 Yifan Zhu1,2,3†
 Tserenpurev Chuluunsaikhan
- 1Department of Big Data, Chungbuk National University, Cheongju, China
- 2AIICON LLC, Seoul, Republic of Korea
- 3Jiangsu Kanion Pharmaceutical Co. Ltd., Lianyungang, China
- 4Bigdata Research Institute, Chungbuk National University, Cheongju, Republic of Korea
- 5Department of Computer Science, Chungbuk National University, Cheongju, Republic of Korea
Accurate forecasting of food prices is important for market regulation and long-term sustainability of the livestock industry. However, traditional forecasting methods often fail to consider unexpected external factors, such as disease outbreaks and natural disasters. Social media and online news have emerged as valuable sources for capturing these influences, but existing studies have primarily relied on short textual data, such as headlines or social media posts, which may lack depth and contextual richness. To address these challenges, we propose the Sentiment Analysis and Seasonal Decomposition (SASD) framework, a novel approach to enhance livestock price forecasting by integrating sentiment analysis of news data with seasonal decomposition of historical price trends. SASD framework, which systematically decomposes complex livestock price time series into trend, seasonal, and residual components, improving the forecasting accuracy by isolating seasonal patterns and irregular fluctuations. Additionally, we develop a Korean-language sentiment lexicon using an improved Term Frequency–Inverse Document Frequency (ITF-IDF) algorithm, enabling morpheme-level sentiment analysis for better sentiment extraction in Korean contexts. Furthermore, an attention-based Long Short-Term Memory (AM-LSTM) model enhances forecasting accuracy by prioritizing important sentiment shifts caused by unexpected external factors. To evaluate the effectiveness of our proposed framework, pork price and news data was collected between 2018 and 2021. The dataset comprises 14,588 news articles and corresponding price data across 874 days. Data from 2018 to 2020 were used for training, while data from 2021 served as the test set. For sentiment analysis, the ITF-IDF approach achieved F1-scores of 0.74 and 0.79 for negative and positive sentiment classifications, respectively. In terms of price prediction, the proposed AM-LSTM model outperformed traditional statistical methods, as well as machine learning and deep learning baselines, achieving improvements in MAE ranging from 43.0 to 87.4%. Furthermore, the SASD framework significantly reduced MAE in both short- and long-term predictions, by approximately 41.8, 60.7, 62.6, and 71.7% for 1-day, 7-day, 15-day, and 30-day forecasts, respectively. These results demonstrate that the SASD framework can be effectively implemented for livestock market analysis and has potential applicability beyond pork, including markets for lamb, beef, chicken, and other animal products.
1 Introduction
Forecasting prices helps understand the demand and consumption patterns of food products and regulate the market. In this study, we forecast pork prices, one of the most commonly consumed food products in South Korea. As of 2023, South Korea’s per capita pork consumption was approximately 30.1 kg, reflecting an increasing trend over recent years (Jobst, 2024). Due to the crucial position of pork in South Korea, the stability of pork prices is essential for pork producers and consumers. However, unstable pork prices can disrupt the production plans of pork producers, causing substantial economic losses. To address this challenge, this study proposes a novel forecasting framework that integrates sentiment analysis and deep learning to improve the accuracy of pork price predictions. By observing the predicted pork price trends, pork producers can gain a better understanding of the market and adjust their production plans. Therefore, accurate and sustainable pork price forecasting is essential for healthy and stable development of the pork industry.
Traditional food price forecasting approaches primarily rely on structured data (Chuluunsaikhan et al., 2024; Ohyver and Pudjihastuti, 2018; Zhao, 2021; Deepa et al., 2023; Yin et al., 2020; Zhang et al., 2018), including supply, demand, and production statistics. However, these methods often fail to consider unexpected external factors (Liu et al., 2019; Taylor et al., 2016; Shang and Tonsor, 2017; Hassouneh et al., 2012) such as disease outbreaks, natural disasters, and economic crises. For example, African Swine Fever (ASF) has caused severe damage to the pork market in South Korea in recent years. In 2019, ASF resulted in the culling of an estimated 145,000 pigs in South Korea (Kang, 2019). This led to a sharp drop in pork production, which had a significant negative impact on the stability of the pork market (Tian and Cramon-Taubadel, 2020). The COVID−19 pandemic also caused sharp fluctuations in livestock prices due to increased household demand and decreased food service sales (Lusk et al., 2021), prompting the government to issue 60 billion KRW in emergency loans to affected farmers (USDA Foreign Agricultural Service, 2023). Additionally, flooding around 2017 caused annual economic loss of 50 billion KRW in the South Korean economy, of which the agricultural sector accounted for 25% (Qasim et al., 2017). Floods can also cause severe food shortages, indirectly affecting the quantity and quality of pork (Biswas et al., 2019). These examples demonstrate the need for a forecasting approach that accounts for unexpected factors affecting long-term sustainability of the livestock industry. Therefore, our proposed framework integrates both structured market trends and unstructured signals from external events to predict pork prices more accurately and robustly.
Social media has become a valuable resource for consumers, producers, and governments to access the latest information regarding ASF, COVID-19, natural disasters, and others. Consumers can use social media to track market trends, while producers adjust their strategies based on social media insights to increase profits. The government can use it to share critical information and make decisions for stabilizing the market during a crisis. Research has shown that sentiment extracted from online news articles correlates with price fluctuations in financial markets and commodity prices (Ryu et al., 2020; Ryu et al., 2023; Yoo, 2016; Rah et al., 2021), suggesting that news sentiment analysis can enhance forecasting accuracy. Several studies have integrated text-based information from social media and news into forecasting models (Chuluunsaikhan et al., 2020; Li et al., 2020; Li et al., 2022; Ye et al., 2021). However, many of these studies often used keywords or short texts such as headlines, reviews, and discussions which lack context and depth, making them less effective for accurate price forecasting. Additionally, sentiment analysis research has been focused on English-language markets, creating challenges when applying these methods to non-English contexts like South Korea.
To address these challenges, this study proposes the Sentiment Analysis and Seasonal Decomposition (SASD) framework, a novel approach to enhance livestock price forecasting by integrating sentiment analysis of news data with seasonal decomposition of historical price trends. Unlike traditional models, SASD captures both structured data (price trends, seasonal patterns) and unstructured data (news sentiment), this enables it to model price fluctuations more accurately and respond dynamically to market changes. The key contributions of the paper are as follows. First, a sentiment analysis and seasonal decomposition (SASD) framework decomposes complex livestock price time series into trend, seasonal, and residual components. This decomposition enhances forecasting accuracy by isolating seasonal patterns and irregular fluctuations. Second, this study constructs a Korean-language sentiment lexicon tailored to livestock-related news using an improved Term Frequency–Inverse Document Frequency (ITF-IDF) algorithm, ensuring morpheme-level sentiment analysis for higher accuracy. Unlike previous studies, which rely on generic sentiment dictionaries, our approach provides more accurate sentiment extraction in Korean contexts. Third, an attention-based LSTM model improves prediction accuracy by focusing on key features. Unlike traditional LSTMs, which treat all inputs equally, our model prioritizes important sentiment shifts caused by unexpected external factors, reducing noise and further improving prediction accuracy. Finally, extensive experiments evaluates and compares the performance of the SASD framework with various statistical, machine learning, and deep learning methods. The experiments consist of news sentiment classification and pork price forecasting. The news sentiment classification method achieved 0.74–0.79 in terms of F1-score. Furthermore, the SASD framework significantly reduced the Mean Absolute Error (MAE) in both short- and long-term forecasts by approximately 41.8, 60.7, 62.6, and 71.7% for 1-day, 7-day, 15-day, and 30-day predictions, respectively.
The remainder of our study is outlined as follows. Section 2 overviews the related studies. Section 3 describes the proposed methods in our study. Section 4 presents experimental results. Section 5 discusses the experimental results. Section 6 concludes our study and introduces shortcomings.
2 Related work
This section reviews food price forecasting studies, categorized by input data: (1) traditional food information, (2) frequency and keywords from textual data, and (3) full-text content analysis. Subsection 2.4 compares our approach with previous studies and highlights key contributions.
2.1 Traditional food price forecasting
Traditional agricultural forecasting relies on structured data such as past prices, consumption volumes, weather, and supply–demand statistics. According to economic theory, agricultural prices are determined by market supply and demand. Numerous studies have applied statistical or machine learning models to forecast prices based on this data. For example, Chuluunsaikhan et al. (2024) developed a machine learning approach to forecast pork supply using both internal and external factors, including weather conditions, exchange rates, and livestock disease reports. This approach improved forecasting accuracy by 2–12%, promoting more stable market conditions in South Korea.
Similarly, Ohyver and Pudjihastuti (2018) predicted medium-quality rice prices using ARIMA models based solely on past prices, aiding government rice market regulation. Zhao (2021) introduced wavelet preprocessing combined with ARIMA for soybean price prediction, while Deepa et al. (2023) compared multiple machine learning models for cotton price forecasting to help farmers minimize financial risk.
More complex models have integrated multiple variables. Yin et al. (2020) improved vegetable price prediction accuracy by incorporating weather and trading volume data, using Seasonal-Trend decomposition based on Loess (STL). Zhang et al. (2018) forecasted soybean prices using macroeconomic indicators such as import volume and CPI, applying Quantile Regression–Radial Basis Function (QR-RBF) neural networks optimized via genetic algorithms.
2.2 Frequency and keyword analysis-based food price forecasting
Beyond structured data, many studies have leveraged the frequency of words or keywords extracted from web-based textual sources. This approach quantifies how often specific terms appear in news, blogs, or social media, linking these trends to agricultural price fluctuations. Ryu et al. (2020; 2023) combined structured agri-food data (i.e., agri-food consumer panel data, pork sales, and pork production) with textual frequency data (i.e., frequency of broadcast news, TV programs/shows, and blogs) from media sources to improve pork consumption predictions. Their findings indicate that media frequency data can serve as meaningful leading indicators. Similarly, Yoo (2016) used keyword frequencies from online sources in a Bayesian structural time-series model, which enhanced vegetable price forecasts. Rah et al. (2021) explored the effects of infectious disease outbreaks on livestock prices by integrating unstructured news and SNS data. The study found that African Swine Fever (ASF) coverage had a significant impact on pork prices. Chuluunsaikhan et al. (2020) employed keyword-based topic modeling (LDA) and trained a long short-term memory (LSTM) model on these features, demonstrating a high correlation between keyword trends and retail pork prices in South Korea.
2.3 Content analysis-based food price forecasting
More recent studies focus on analyzing the full content of textual data instead of relying solely on keyword frequency. This approach can extract deeper semantic signals and contextual sentiment, improving predictive power. Li et al. (2020) applied sentiment analysis to public opinions extracted from full articles to forecast vegetable prices via Multiple Linear Regression (MLR). The study highlighted the strong nonlinear relationship between public sentiment and agricultural prices. Li et al. (2022) extended this approach by combining structured factors with sentiment features from news headlines using topic modeling and sentiment scoring.
Ye et al. (2021) analyzed professional community discussions, building a heterogeneous graph to capture relationships among users, concepts, and sentiments. This representation was input into an LSTM model for hog price trend forecasting, demonstrating that online discourse contains rich, predictive signals. However, a key limitation of these studies is their reliance on short texts (e.g., headlines, comments, and discussion snippets), which may fail to capture nuanced sentiment or contextual shifts in longer articles. Moreover, most sentiment tools are developed for English, and non-English studies often rely on machine-translated text, which risks losing linguistic and cultural nuance.
2.4 Comparison of our study and previous studies
This study differs from previous work in several keyways. First, most prior studies rely on short texts (e.g., headlines, keywords) for sentiment analysis. However, long-form news articles contain richer sentiment information but pose challenges such as noise and imbalanced performance between short and long texts. To address this, this study uses a probabilistic approach to mitigate imbalance and develop a long short-term memory network with an attention mechanism (AM-LSTM) to reduce noise and enhance interpretability. Second, while most studies utilize English-based sentiment tools, our work constructs a domain-specific sentiment lexicon for South Korean pork-related news. This addresses a critical gap where prior studies either limit themselves to English data or rely on translation, which may degrade sentiment accuracy due to linguistic mismatches. Third, rather than focusing only on improving individual models or adding variables, our study introduces a framework that integrates structured data and sentiment signals to improve performance across a variety of forecasting models. This flexible architecture ensures extensibility and generalizability to other agricultural domains. By addressing the short text limitation, the language barrier, and the lack of integration frameworks, our study contributes a robust and localized approach to food price prediction in non-English contexts.
3 Materials and methods
This section presents our proposed method, which utilizes Korean-language sentiment analysis for pork price prediction using deep learning methods. Specifically, Subsection 3.1 provides an overview of the approach. Subsection 3.2 describes the data collection process. Subsection 3.3 outlines the proposed SASD framework in detail. Finally, Subsection 3.4 explains the model construction procedure.
3.1 Overview
We present an overview of the proposed methods in Figure 1 to understand the following subsections better. The proposed methods can be divided into three steps. First, retail pork prices in South Korea were collected from KAMIS (2023). This dataset provides various information on the distribution of agricultural, livestock, and fishery products for consumers and producers. This study also collected pork-related news from Naver News (2023), a popular search engine that helps people in South Korea find helpful information. Second, The SASD framework extracts the news frequency and sentiment features using sentiment analysis and extracts weekly and monthly component features using seasonal decomposition. Then, all features generated by the SASD framework were combined into one dataset, which was then divided into training and test sets. Last, statistical, machine learning, and deep learning models were constructed for model training and pork price predictions. Also, we constructed an AM-LSTM model for training and predicting retail pork prices in South Korea. All predictive models were evaluated the performance of the models using the mean absolute error (MAE) and mean absolute percentage error (MAPE) metrics.
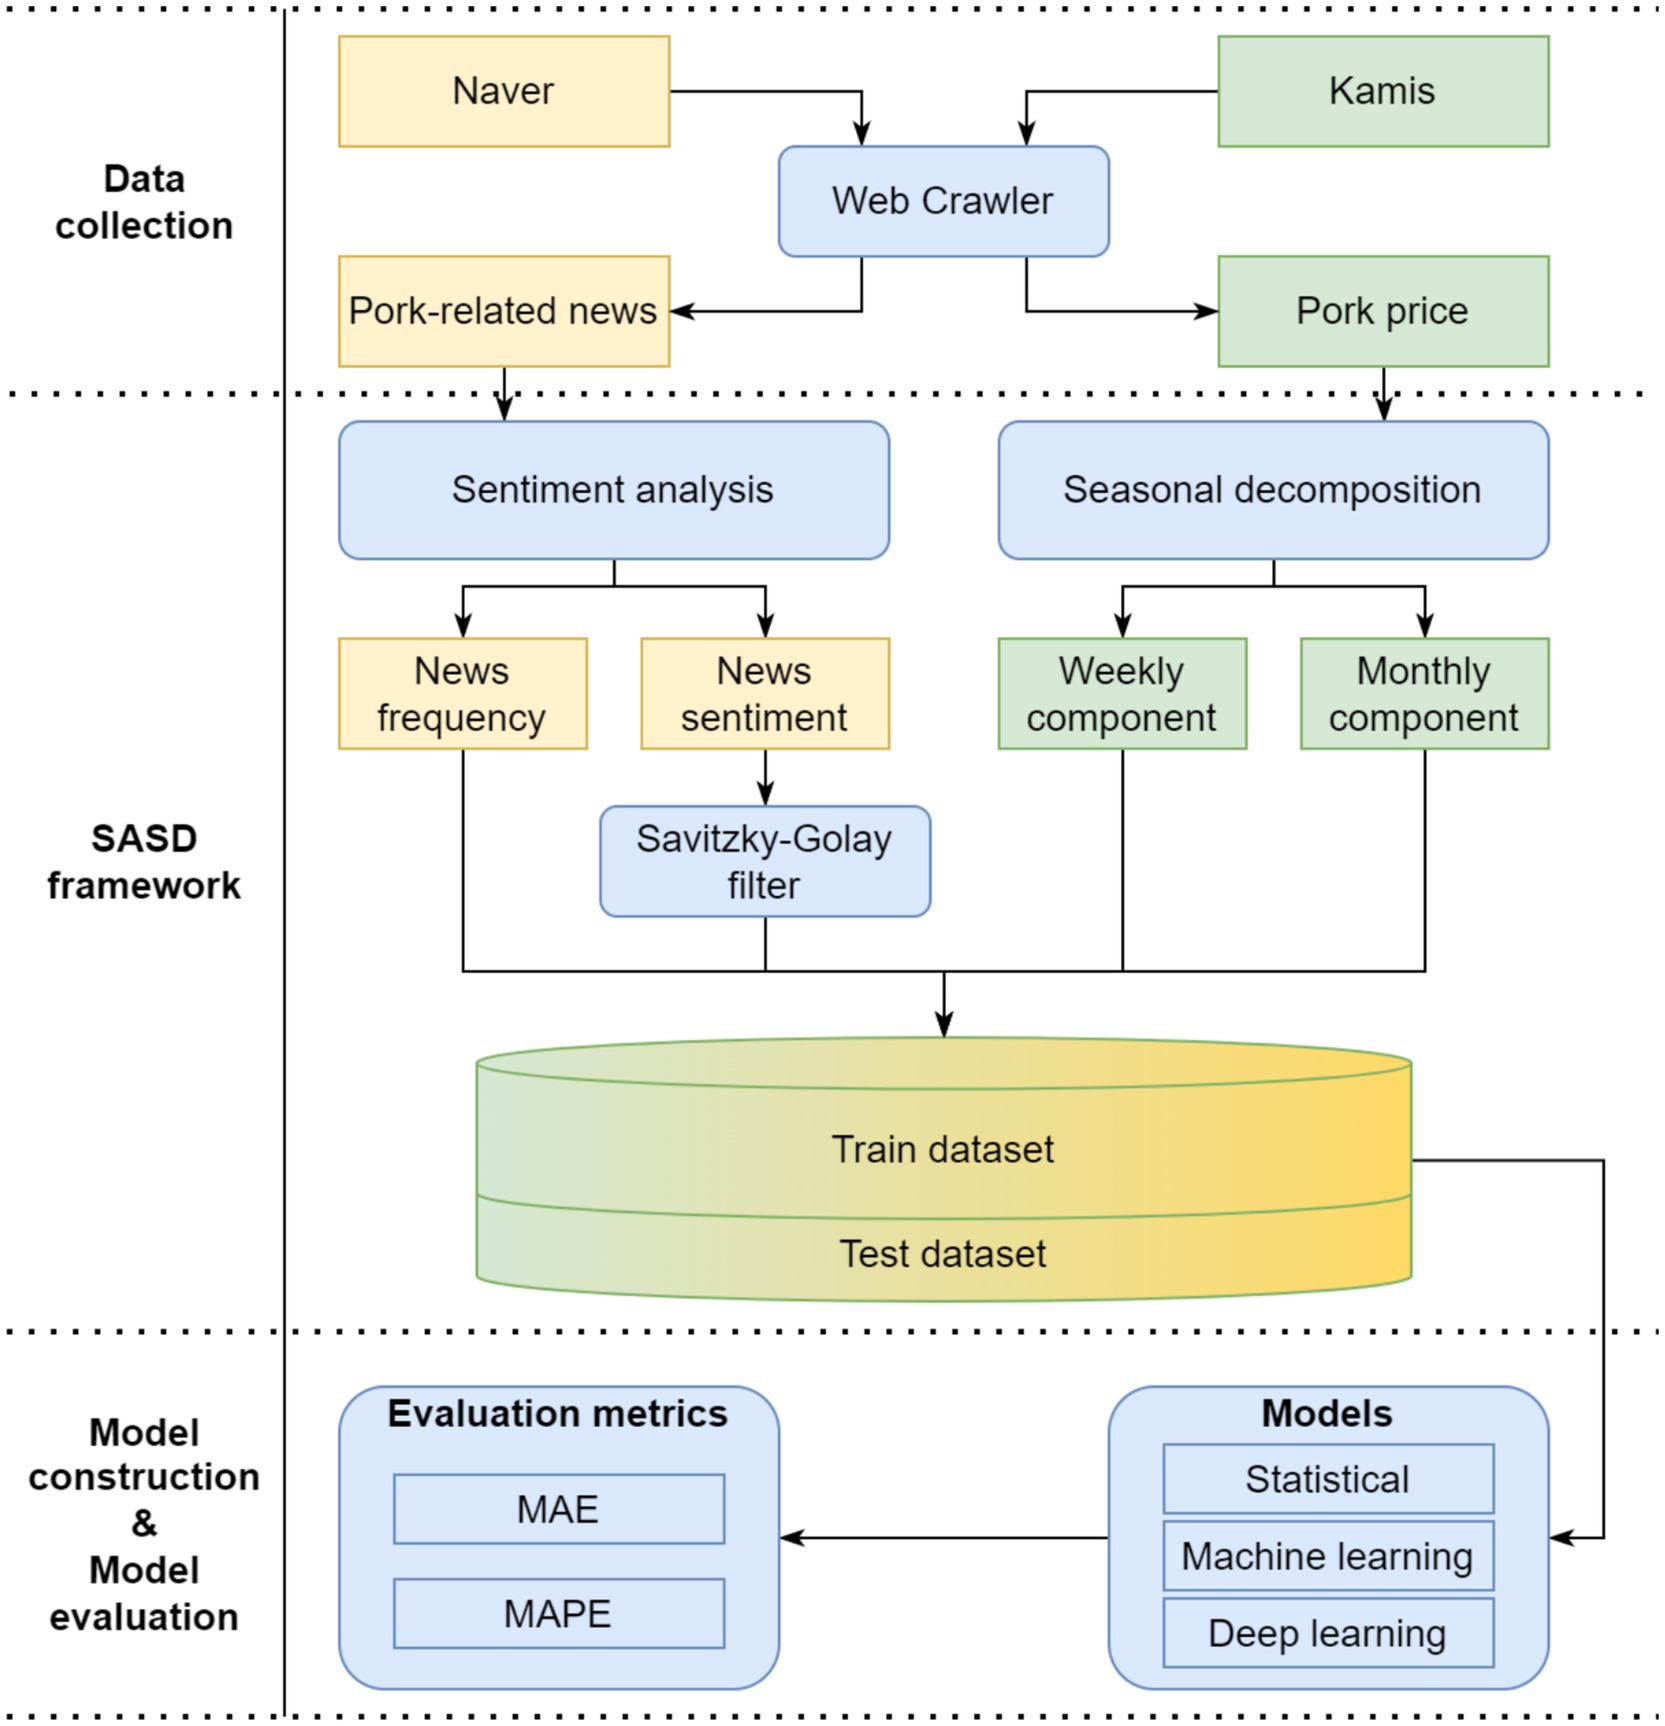
Figure 1. Overview of proposed method.
3.2 Data collection
We developed web crawlers using Python Scrapy for collecting price and news information. Pork retail price is the price of pork at retail stores. For collecting prices, this study extracted pork retail prices between 2018 and 2021 from the KAMIS database. For collecting news, pork or pig as the subject and the following 12 keywords as predicates to retrieve news related to pork prices from Naver news:
• For pork market-related news: price increase, price decrease, supply increase, supply decrease, consumption increase, consumption decrease, breeding increase, and breeding decrease.
• For disease-related news: ASF and COVID-19.
• For natural disaster-related news: rainstorm and flood.
We selected price increase and decrease as they directly reflect the pork price trend. Moreover, supply increase, supply decrease, consumption increase, consumption decrease, breeding increase, and breeding decrease were selected because the price is directly determined by demand and supply. Finally, ASF, COVID-19, rainstorm, and flood keywords were selected because the external environment can significantly impact price. Although these external factors do not directly affect prices, they can affect supply and demand. To retrieve pork-related news, these keywords are used to search for pork-related news, and Naver News then returned a list of news items. Each news item contained a title, channel, and the headline of the news. Second, all verbs and nouns are extracted in the news headline and then opened the main news page. Finally, sentences containing nouns and verbs on the main news page are extracted and then concatenated them as the entire text.
3.3 SASD framework
In this subsection, we explain the SASD framework that fully utilizes the information from past pork-related news and pork retail prices to predict future retail prices. It comprises sentiment analysis and seasonal decomposition, which are explained in the following subsections. For clarity, the details of all the symbols used in this paper are defined in Table 1.
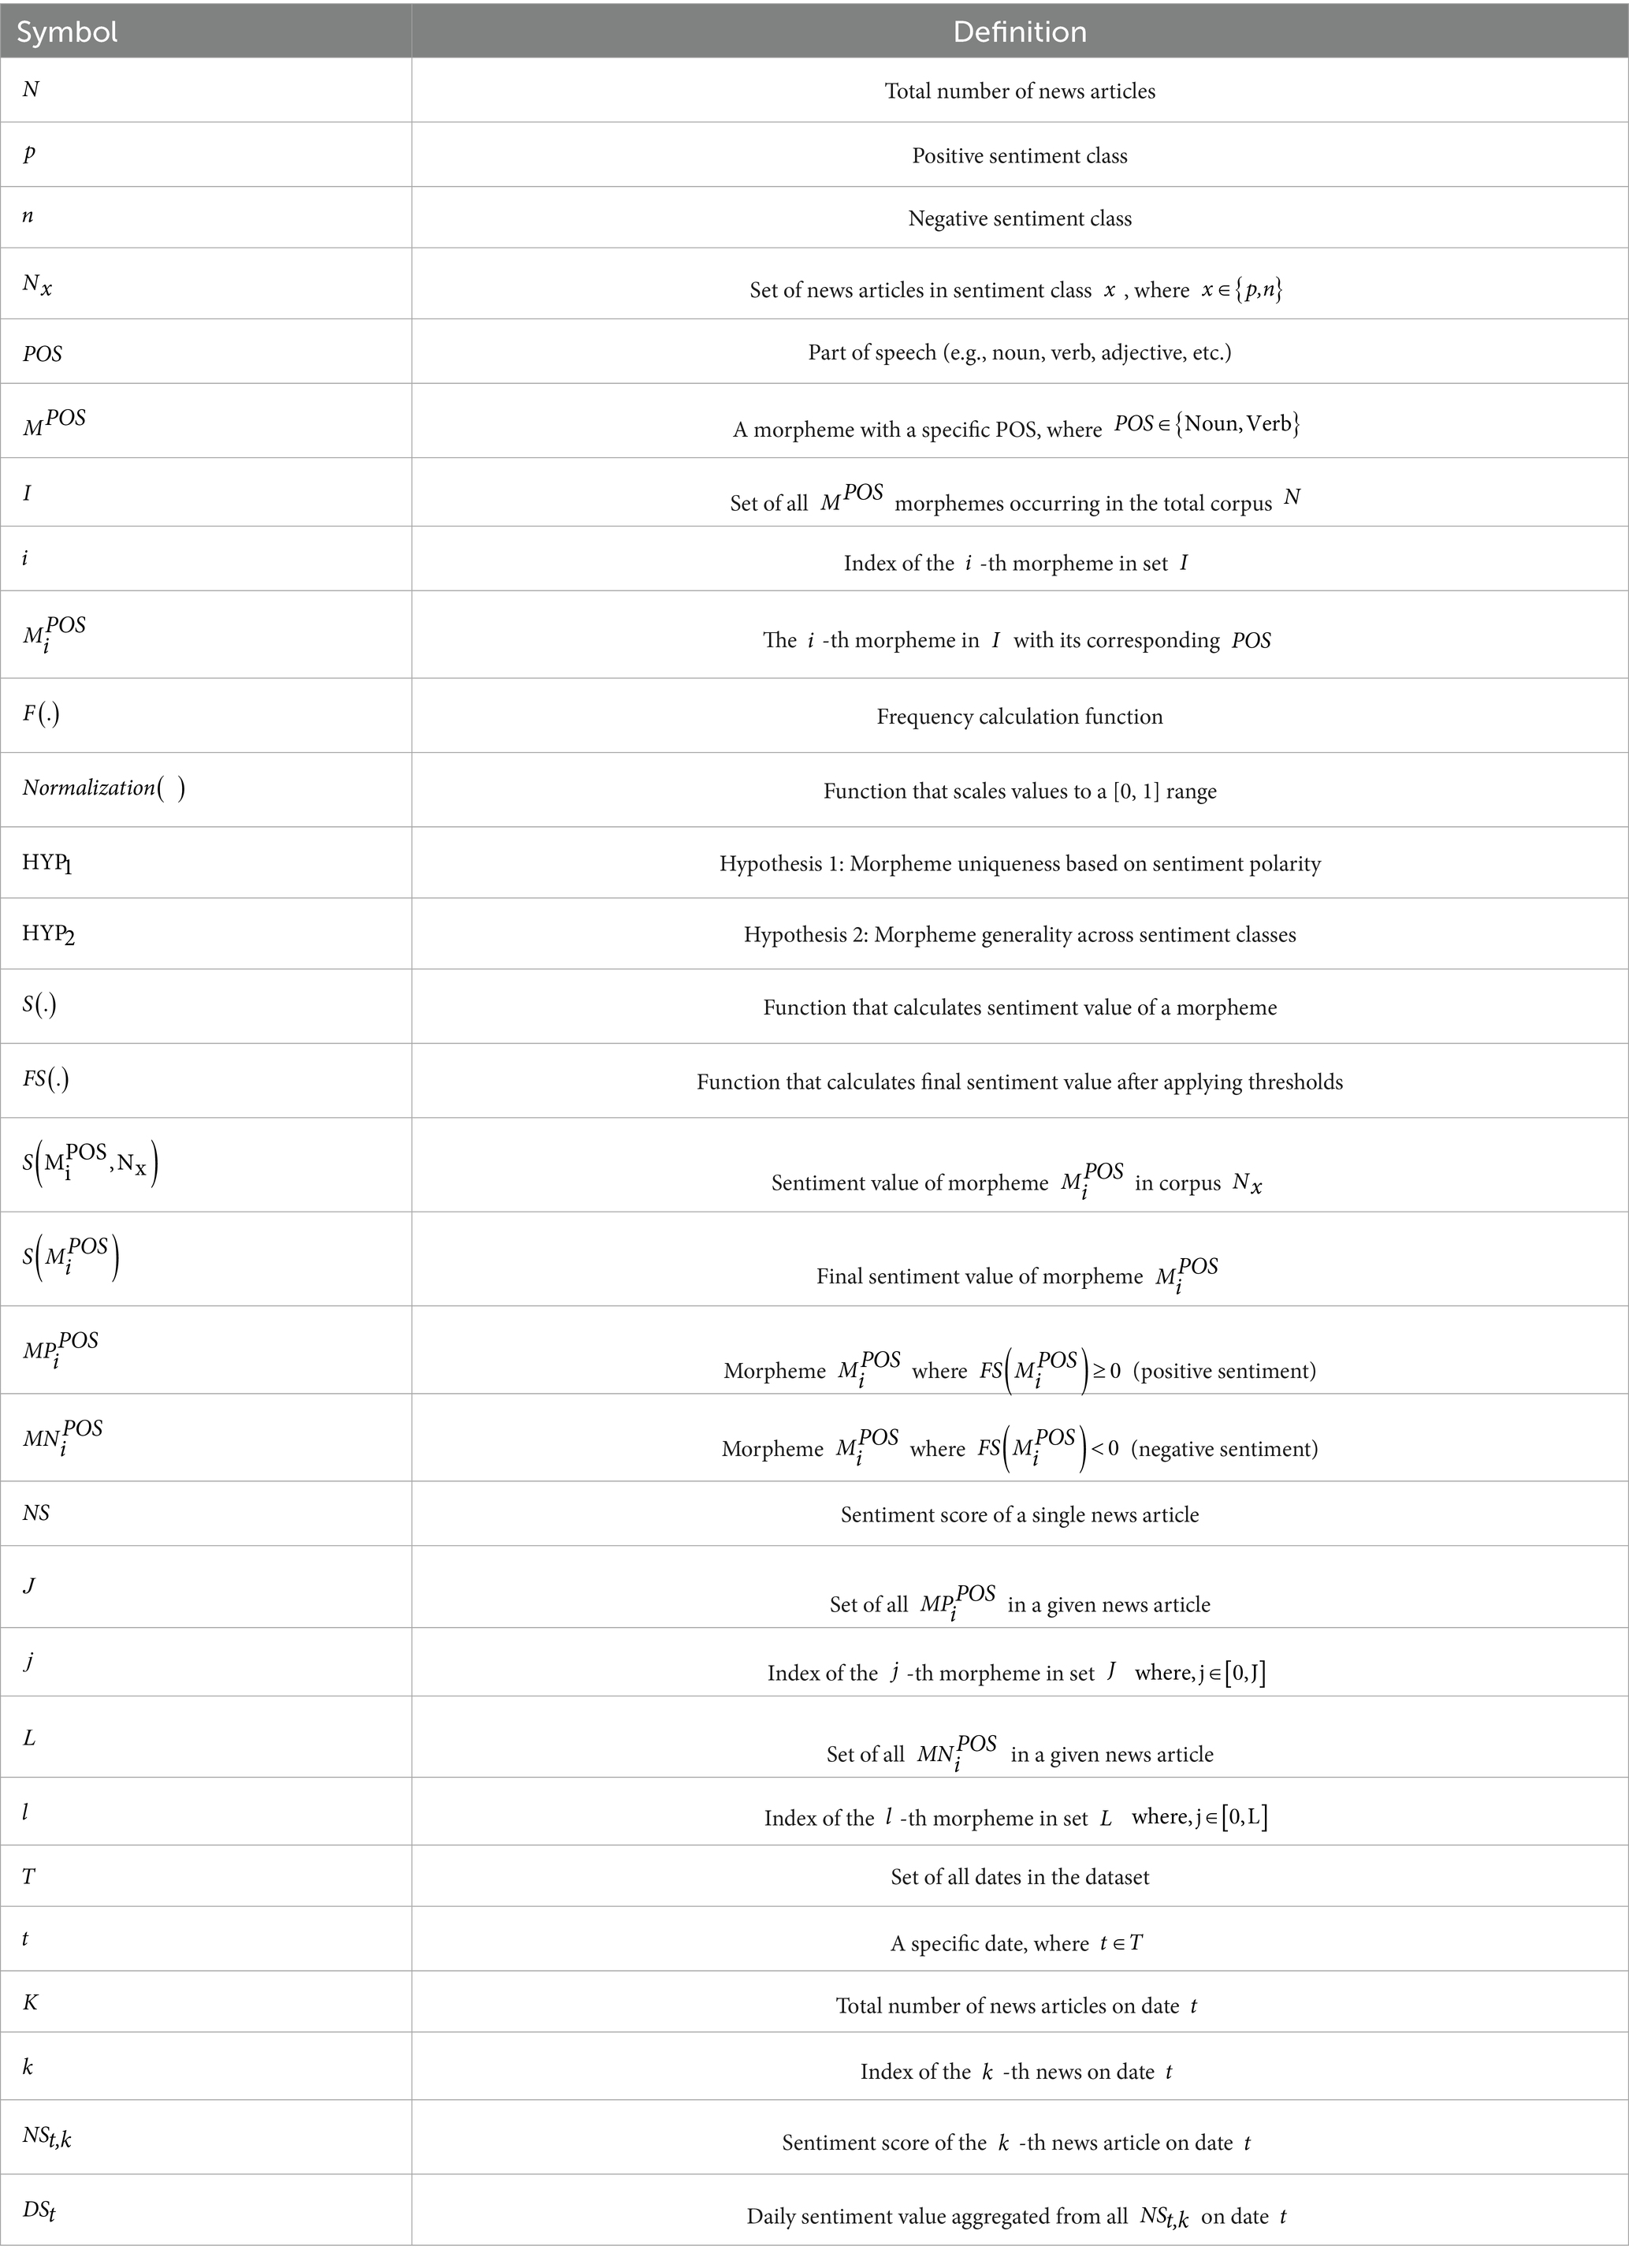
Table 1. Symbols and definitions.
3.3.1 Seasonal decomposition
To capture the various features of pork retail prices, this study decomposed pork retail prices via seasonal decomposition, a classical time-series method (Chen et al., 2020). Seasonal decomposition is used to compute the pork retail price (RP) as Equation 1:
where, Trend is the general direction of the series over a long period. It is calculated using the moving average of the RP, which is a technical indicator used to determine the direction of a trend. Trend is a distinct repeating pattern observed at regular intervals due to various seasonal factors. It could be monthly, weekly, etc. To calculate Seasonal, first RP is detrended by subtracting Trend from it. We then calculated the average trend series for each seasonal period. In terms of weeks, we calculated the average detrended value for each week. Residuals is an irregular component comprising RP fluctuations. It was calculated by subtracting Trend and Seasonal from RP.
We used seasonal decomposition to divide pork retail prices into weekly and monthly components. In seasonal decomposition, a period parameter can be used to extract the periodic components of the time-series data. To extract the weekly components, we set this parameter as seven. However, because pork prices are not published on weekends, we set this parameter as five. Figure 2 shows the results of the seasonal decomposition for extracting weekly components using data from January 1 to December 31, 2021. Similarly, to extract the price features of the monthly component, we set this parameter as 20. Because we have price information only on weekdays and a month has about 4 weeks.
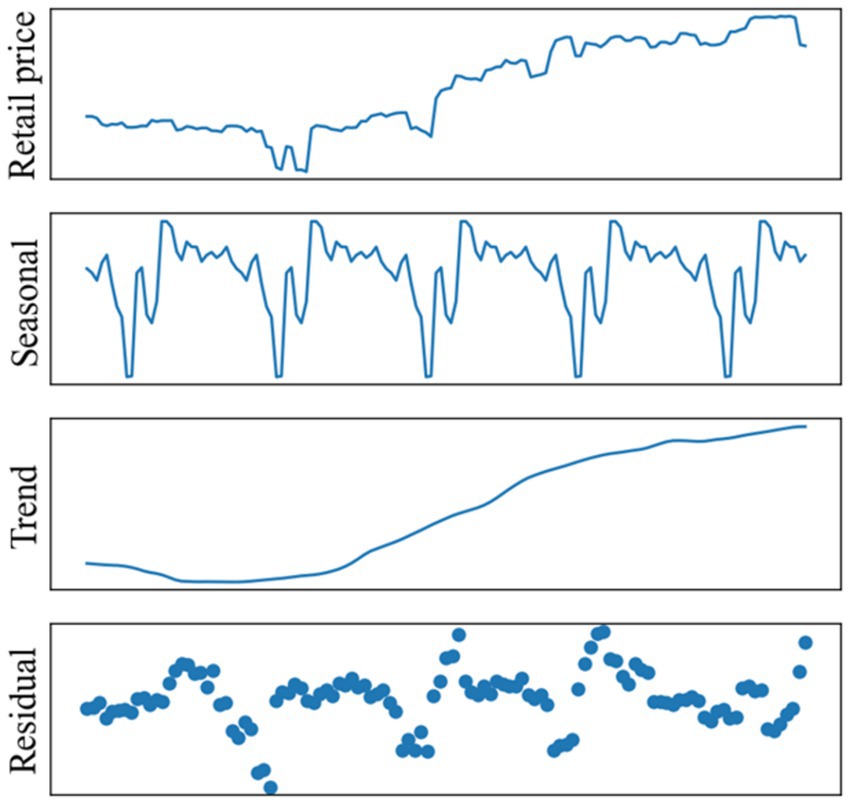
Figure 2. Frequency of external factors-related news and pork retail prices.
3.3.2 Sentiment lexicon construction
Sentiment lexicons are collections of words used to analyze the sentiment in a given text. Although English has the largest and most sophisticated sentiment lexicon, it is unsuitable for this study owing to language limitations. Attempts have also been made to construct a Korean sentiment lexicon. Shin et al. (2012) manually tagged 8,750 sentences from economic and life-related news using a multi-perspective question and answer scheme to construct a Korean sentiment lexicon. An and Kim (2015) used a collective vote to label the sentiments of 35,000 words in an existing Korean dictionary. They also uploaded the voted sentiment lexicon onto a web page to provide a sentiment analysis service for Koreans. The sentiment lexicons constructed in these two studies are extremely convenient for generic sentiment analysis in South Korea. As both sentiment lexicons are generic and this study focuses on quantifying the pork-related sentiment in the news, these two sentiment lexicons are unsuitable.
This study adopted the ITF–IDF algorithm (Wang et al., 2020) to construct a domain-specific sentiment lexicon to analyze the sentiment of Korean-oriented pork-related news. The ITF–IDF algorithm was designed based on the term frequency–inverse document frequency (TF–IDF) algorithm using labeled news and refined formulas. The TF–IDF is a statistical algorithm that measures the relevance of a word to a document from set of documents. It is mainly based on two metrics: the frequency of a word that appears in a document and the word’s inverse document frequency over a set of documents. In general, the TF–IDF algorithm outputs the importance of words in various documents. Unlike TF–IDF, ITF–IDF can output the sentiment values of words using labeled news. Although the ITF–IDF algorithm has been proposed for the English language, it relies on the distribution of sentiment words in the text; hence, it can be applied to multiple languages.
Because the tokenized text is not always composed of independent words, we use “morpheme” instead of “word” when explaining the ITF–IDF algorithm. The main difference is that although words can exist independently, morphemes do not always exist independently. Figure 3 shows an overview of sentiment lexicon construction. First, we labeled pork-related news as positive or negative and then calculated the positive, negative, and all news distributions. Second, we tokenized all news into morpheme collections using the Korean Morphological Analyzer (KOMORAN) (Shin, 2016), and then removed morphemes that were not nouns or verbs. Third, we calculated the morpheme distributions (M1, M2, M3, …, Mn) for positive, negative, and all news. Finally, we input news and morpheme distributions into the ITF–IDF algorithm.
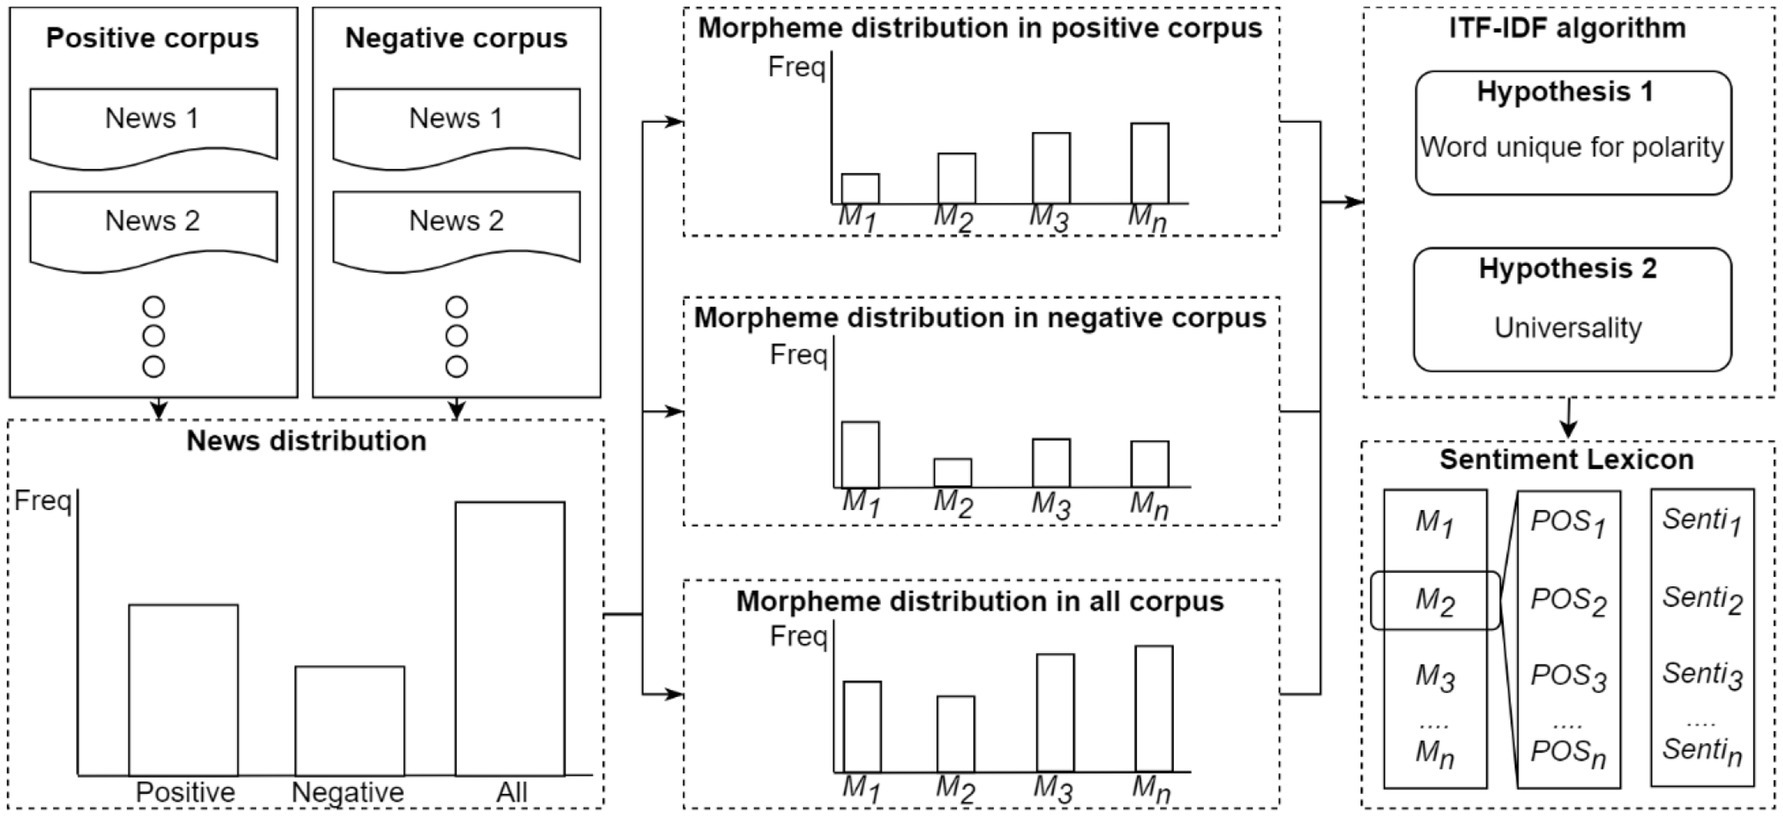
Figure 3. Overview of sentimental lexicon construction.
The adopted ITF–IDF algorithm is based on four hypotheses: words unique to parts of speech, polarity, uniqueness, and universality. We adopted the hypotheses of “words unique to polarity” and “words unique to universality,” as Wang et al. (2020) demonstrated that they achieved the highest classification performance. The former assumes that if a morpheme is positive, it appears more frequently in positive news than in negative news, and vice versa. It is formulated Equation 2:
Where denotes the frequency of , which is total news. indicates that the results were scaled between 0 and 1. Equation 2 indicates the distribution of in the , which is used to measure the importance of the morpheme in . As a result, “words unique for polarity” outputs the of in .
“Universality” assumes that if a morpheme is distributed significantly in both positive and negative corpora, the sentiment intensity will not be too strong. It is formulated Equation 3:
Where and are the frequencies of in and , respectively. indicates that the results are scaled between 0 and 1. Equation 3 shows the universality of the distribution in . As a result, “Universality” outputs the of in .
After calculating and in , the ITF-IDF algorithm calculates the sentiment value of in as following Equation 4:
where indicates sentiment intensity of in relation to x and we use multiplication to represent the magnitude of impact of each factor on the sentiment outcome.
The final sentiment value of is obtained by subtracting the sentiment value of in from that in using Equation 5:
where is the sentiment value of in a positive corpus, is the sentiment value of in negative corpus, and is the final sentiment value of . With the balance of and , the ITF-IDF algorithm outputs a sentiment lexicon containing numerous morphemes with specific and their sentiment values .
3.3.3 Sentiment analysis
After constructing the sentiment lexicon, this study used it to perform the sentiment analysis. As shown in Figure 4, the sentiment analysis in this study is composed of three steps: (1) calculate news sentiment values using the probabilistic approach and sentiment lexicon, (2) average sentiment values of news on the same day into daily sentiment values, and (3) smoothen daily sentiment values using the Savitzky–Golay filter. These steps are explained in the following section.
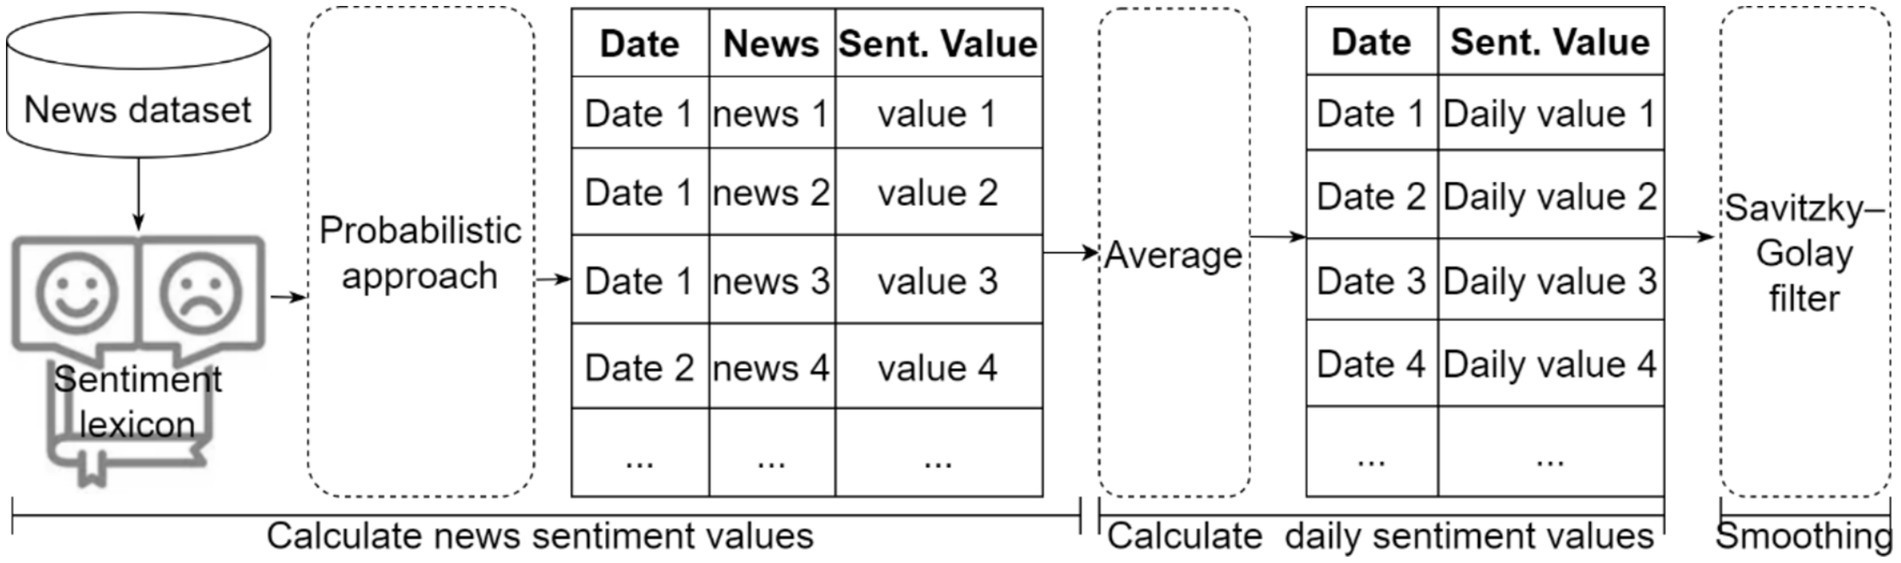
Figure 4. The process of constructing sentiment lexicon.
When calculating news sentiment values, this study first tokenized pork-related news into morpheme collections using the KOMORAN analyzer and then filtered nouns and verbs. Second, we assigned morphemes corresponding to the sentiment values in the sentiment lexicon. Finally, we aggregated the sentiment values of morphemes into news sentiment values. Wang et al. (2020) used an accumulation approach that sums the sentiment values of all the morphemes in certain news. However, this approach cannot limit the expansion of sentiment values when comparing news articles of different lengths. To solve this problem, we calculated news sentiment values using a probabilistic approach that accurately reflects the polarity and intensity of the news. The news sentiment values calculated using the probabilistic approach range from [0, 1]. The probabilistic approach is formulated as following Equation 6:
Where NS is the news sentiment value, is with final sentiment value greater than or equal to 0, is with final sentiment value less than 0, J and L are the number of and in a certain news. NS indicates the probability of news becoming positive news. Although NS is positive, it can represent the sentiment intensity of news. If NS value is low, news tends to be negative whereas if it is high, news tends to be positive.
News frequency is an indicator of the sentiment intensity of events. For extracting features of positive and negative news frequency, we classified all news according to the magnitude of NS. The NS of news is greater or equal to 0.5 was classified as positive and that with NS less than 0.5 was classified as negative. Furthermore, we average news sentiment values on the same day as daily sentiment values. The formula of this calculation is in Equation 7:
Where is the daily sentiment value on date t, K is the number of news items on date t, is k-th news sentiment value on date t.
Because day-to-day sentiment fluctuation is considerably higher than pork price fluctuation, we adopted the Savitzky–Golay filter (Savitzky and Golay, 1964) to smoothen the daily sentiment values. Smoothing can reduce the fluctuation in daily sentiment values and improve the accuracy of time-series predictions (Gao et al., 2009). The Savitzky–Golay filter is a denoising filter suitable for reducing data noise. By finding polynomials of a specific order and fitting the data in a smoothed manner using least squares, useful information can be retained effectively.
3.4 Model construction
In this study, we predicted pork retail prices using three types of models: statistical, machine learning and deep learning. Figure 5 presents an overview of model construction. The SASD framework extracts news sentiment (PDS: daily news sentiment value) and news frequency features (PF: positive frequency, NF: negative frequency, AF: all frequency) from pork-related news. Furthermore, it extracts monthly (MT: monthly trend value, MS: monthly seasonal value, MR: monthly residual value) and weekly component (WT: weekly trend value, WS: weekly seasonal value, WR: weekly residual value) features from pork retail prices. Thereafter, cross-validation is used to select the best parameters for the ridge regression, random forest, gradient boosting, LSTM, and AM-LSTM models. Cross-validation first splits the dataset into three folds, and then two of the folds are included in the training set and the other one is used as the validation set. In three sets of experiments, the parameter with the best overall performance was selected as the model parameter. Finally, we evaluated the performance of the model using the MAPE and MAE. The details of statistical, machine learning, and deep learning methods used in study are described below.
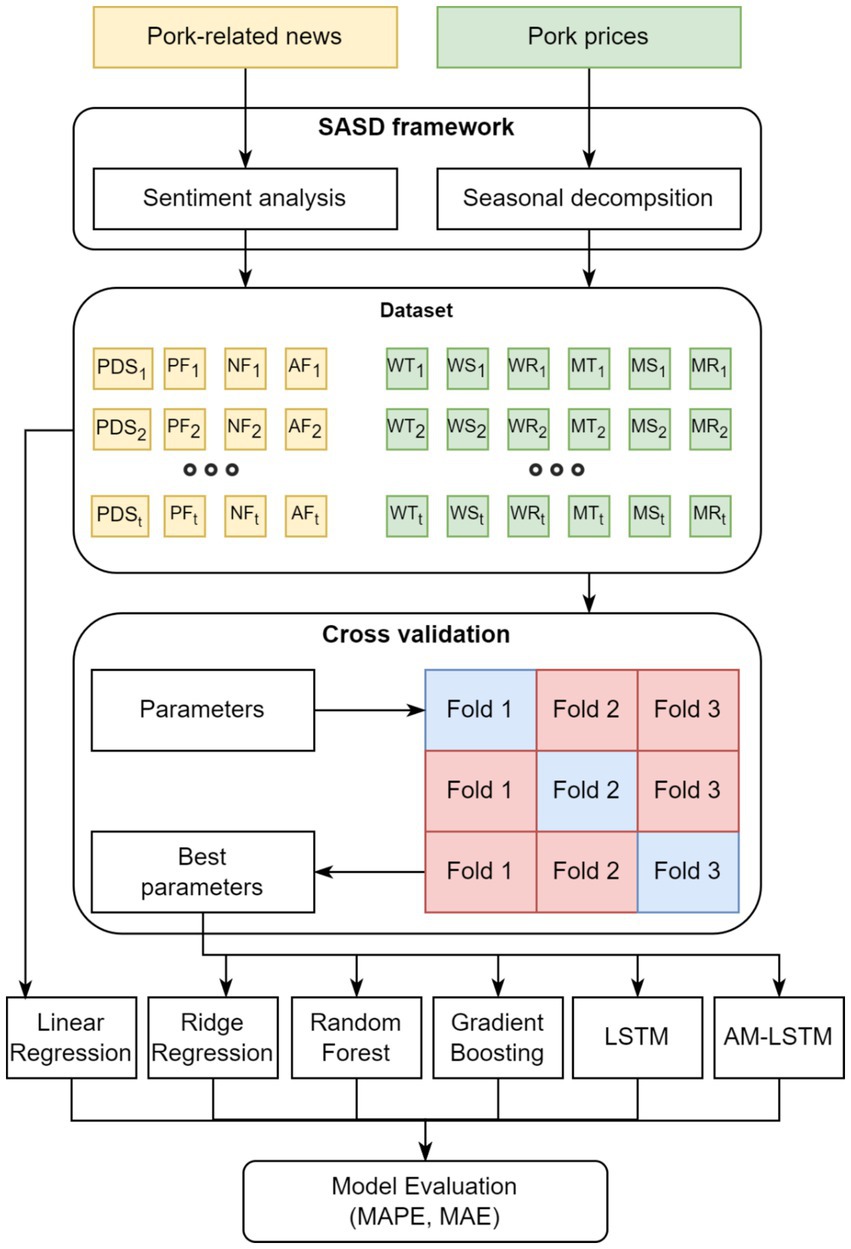
Figure 5. Overview of predictive model construction.
A statistical model is a type of mathematical model that comprises assumptions made to describe the data generation process. This study used the linear regression and ridge regression models owing to their universality and robust predictive performance. Linear regression is a traditional model wherein the model finds the best-fitting linear line between the input and output variables (Seber and Lee, 2003). It can be divided into two types: simple and multiple regression. Simple linear regression uses only one input variable, whereas MLR uses more than one independent variable. In our case, we extracted multiple features from news and price using the SASD framework; hence, we used MLR as described in Equation 8,
where is the intercept, are the regression coefficients, and ε is the error term. n our case, we extracted multiple features from news and price using the SASD framework, which justified the use of MLR.
Ridge regression was proposed to solve the multicollinearity problem of linear regression (Hoerl and Kennard, 2000). Multicollinearity creates inaccurate estimates of the regression coefficients, resulting in false, non-significant p-values, and degrading the predictive ability of the model. Ridge regression (e.g., Equation 9) minimizes the sum of squares of the regression coefficients to reduce the impact of multicollinearity via L2 regularization and yields more robust predictive results.
where σ ≥ 0 is a regularization parameter controlling the strength of the penalty. By minimizing the sum of squared residuals and the sum of squared coefficients, ridge regression yields more stable and generalizable predictions, especially in high-dimensional or collinear settings.
A machine learning model is an algorithmic representation that combined through massive amounts of data to find patterns and make predictions. The machine learning models used in this study were random forest and gradient boosting, which are two popular ensemble algorithms for time-series predictions. This study selected these models because they are both ensembles of decision trees that can produce accurate predictive results. Random forest is a powerful algorithm that can be used for various tasks, including regression and classification problems (Liaw and Wiener, 2002). It is an ensemble model, meaning that it comprises numerous decision trees, called estimators, each of which produces its own predictions. Random forest is a parallel ensemble, which means that the decision trees are trained simultaneously and are expected to be as independent as possible, and the prediction results of all decision trees are averaged to obtain the final prediction result. Similar to random forest, gradient boosting is also suitable for regression and classification problems, and is composed of numerous decision trees (Friedman, 2001). The main difference between random forest and gradient boosting is the ensemble approach. Gradient boosting is a consecutive ensemble, which means that decision trees are trained in a sequential manner and in each iteration, more weights are added to the worst predictions from the previous iteration.
Deep learning is a subfield of machine learning that is essentially a neural network. The deep learning models used in this study were LSTM and AM-LSTM because the special input structure allows LSTM and the proposed AM-LSTM to learn input features across multiple time steps and maintain the learned past information for a long time. LSTM is an artificial recurrent neural network (RNN) that is well suited for time series predictions compared to traditional RNNs because it can retain past information for a long time (Hochreiter and Schmidhuber, 1997). It is composed of a forget gate, an input gate, a cell state, and an output gate. The forget gate decides whether the information from the previous gate must be retained or forgotten. The input gate is used to quantify the importance of new information in the input features. The cell state updates the old information stored in the cell state using the outputs of the forget and input gates. The output gate determines the information to be output from the new information in the input features, output of the previous cell, and updated information stored in the cell state. The forget gate allows the LSTM to remove useless information, and the cell state allows it to maintain past information for a long time. Additionally, LSTM can be trained with input features across multiple time steps to discover more complex patterns between the input and output variables. These attributes impart powerful memory and learning capabilities to LSTM, making it well suited for time-series predictions. In this study, we propose an AM-LSTM model to compete with other state-of-the-art models. AM-LSTM is a hybrid of the LSTM model and attention mechanism; therefore, it inherits all attributes of LSTM and is less sensitive to noise compared with LSTM, AM-LSTM owing to the attention mechanism. The attention mechanism overcomes the problem of noisy data in multivariate time series by extracting valuable information from various characteristic time-series data to predict the target price (Bahdanau et al., 2015). Additionally, it offers a superior method for computing hidden states compared with weighted averages; it allows LSTM to focus on important features. First, the LSTM layer receives the input features, and it then outputs hidden states. Second, the AM receives these hidden states and generates attention weights using the Softmax function. These attention weights are assigned to the hidden states to construct the context vector. Third, the AM concatenates the context vector with hidden states and uses the tanh activation function to process them. Finally, the dense layer outputs the predicted prices.
4 Results
In this section, we first evaluate the performance of the proposed SASD framework for predicting the pork prices on the first, seventh, fifteenth, and thirtieth ahead days using the models presented to demonstrate the power of the SASD framework. Second, we evaluated all the input features extracted by the SASD framework to demonstrate their positive effects on pork price predictions. Third, we predicted three pork prices to demonstrate the generalizability of the proposed methods. Finally, we evaluate the performance of the proposed methods in actual market situations.
4.1 Datasets
When constructing the sentiment lexicon, we used 5,264 labeled pork-related news items comprising 2,836 positive and 2,428 negative news items. For predicting pork prices, we used two types of data: pork retail price and unlabeled pork-related news. These data were from the period between January 1, 2018, and July 31, 2021. Their statistical information is presented in Table 2.
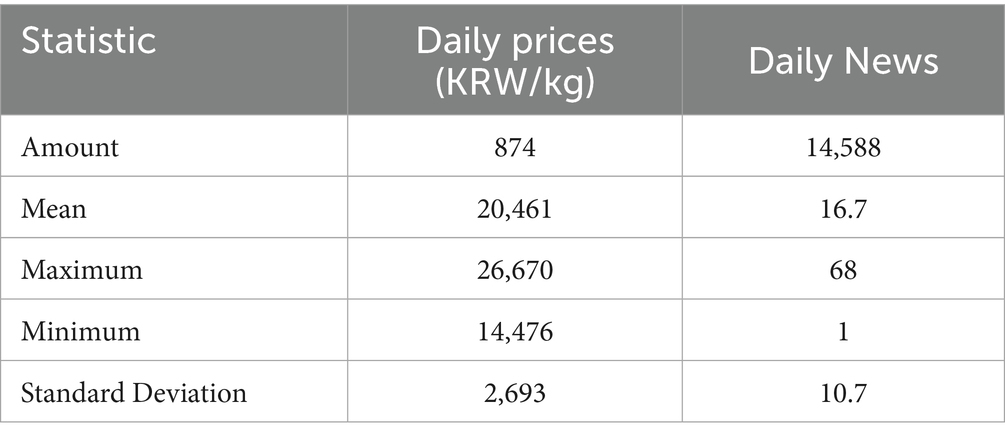
Table 2. Pork retail price and news information.
From Table 2 and Figure 6, we can conclude that the pork retail price in South Korea is extremely volatile, which is one of the reasons why it is difficult to accurately predict pork retail prices in South Korea.
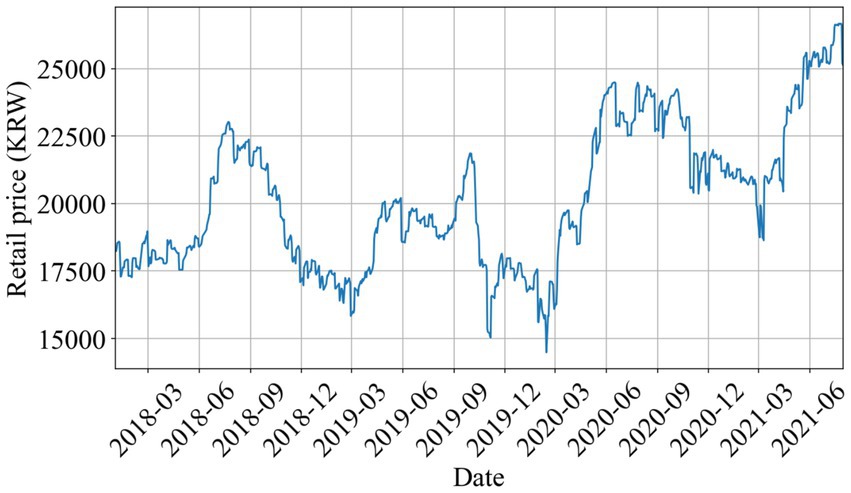
Figure 6. Daily retail pork prices.
Table 3 lists all input features extracted through the proposed SASD framework, which can be classified into four categories: news frequency information, news sentiment information, monthly components, and weekly components.
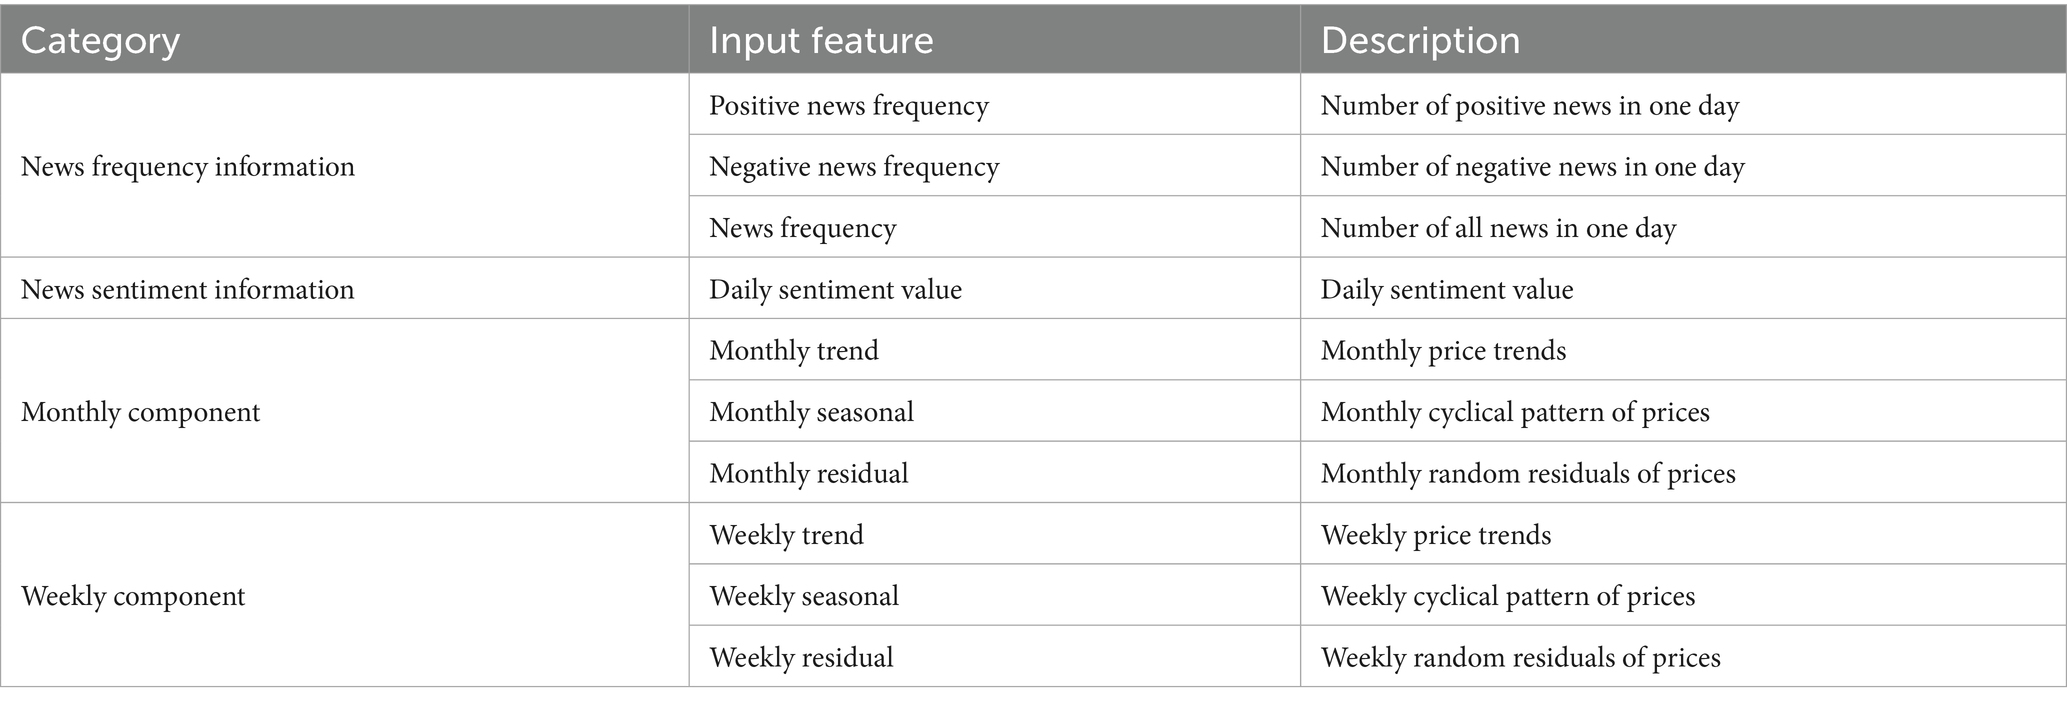
Table 3. Categorization and description of input features.
4.2 Experiment setup
This subsection introduces the software and hardware environments used for the experiment. The PC was equipped with an Intel (R) Core (TM) i7-8700 3.20 GHz CPU, NVIDIA GeForce GTX 1070 GPU, and 40 GB of RAM. Windows 10 was used as the operating system. Python 3.7.6 was to create the methods and experiments. Re, Request, Scrapy, Pandas, Numpy, Scikit-Learn and PyTorch libraries of Python were used.
4.3 Evaluation metrics
We evaluated the performance of our models and components using appropriate metrics for each task. First, the sentiment lexicon was evaluated as a binary classification task using accuracy, precision, recall, and F1-score. Accuracy is the most straightforward classification metric and is computed as the proportion of correctly classified samples to the total number of samples. When the proportion of samples in different categories is unevenly distributed, accuracy can only represent the classification performance of a large proportion of categories. To overcome this limitation, precision and recall have been proposed. Precision measures the performance of an algorithm for classifying samples of a specific category. By contrast, recall measures the ability of an algorithm to identify samples of a specific category among all samples. The F1-score is the harmonic average of precision and recall. It comprehensively evaluates the performance of the algorithm in each category compared to accuracy, precision, and recall. Accuracy, Precision, Recall, and F1-Score are calculated as following Equation 10–13:
where TP, FP, TN, and FN are the number of samples of true positive, false positive, true negative, and false negative, respectively.
Next, we assessed the performance of the price forecasting models using regression metrics: Mean Absolute Error (MAE) and Mean Absolute Percentage Error (MAPE). The MAE is the mean of the absolute values of the individual prediction errors for all instances in the dataset. MAPE represents the average of the absolute percentage errors for each entry in the dataset. It is used to compare predicted targets of different numerical magnitudes. These metrics are computed as Equations 14, 15:
where , and are the actual and predicted prices on date t, respectively.
4.4 Hyperparameters of competing models
Because machine learning and deep learning models are generally sensitive to hyperparameters, their selection is essential for achieving optimal predictive performance. We empirically proposed a range of hyperparameter options and applied cross-validation to our dataset to determine the best-performing settings. Cross-validation is a statistical method used for evaluating and comparing the model performance by dividing the dataset into several segments.
For Ridge Regression, LSTM, and AM-LSTM, we conducted initial cross-validation tuning using the training data. After identifying the best-performing hyperparameter set, we applied this same set across all time horizons (1-day, 7-day, 15-day, and 30-day). This decision was based on the observation that the selected parameters consistently yielded stable and robust results across different forecast lengths. In contrast, for Random Forest and Gradient Boosting, we used Scikit-learn’s GridSearchCV to automatically select hyperparameters. Here, hyperparameter optimization was performed separately for each time horizon, allowing the model to adapt to the characteristics of short-term versus long-term prediction windows.
Table 4 presents the tested hyperparameter options, and those selected are marked in bold. This mixed strategy ensured a balance between efficiency (for deep learning models) and adaptability (for ensemble models), while maintaining reproducibility.
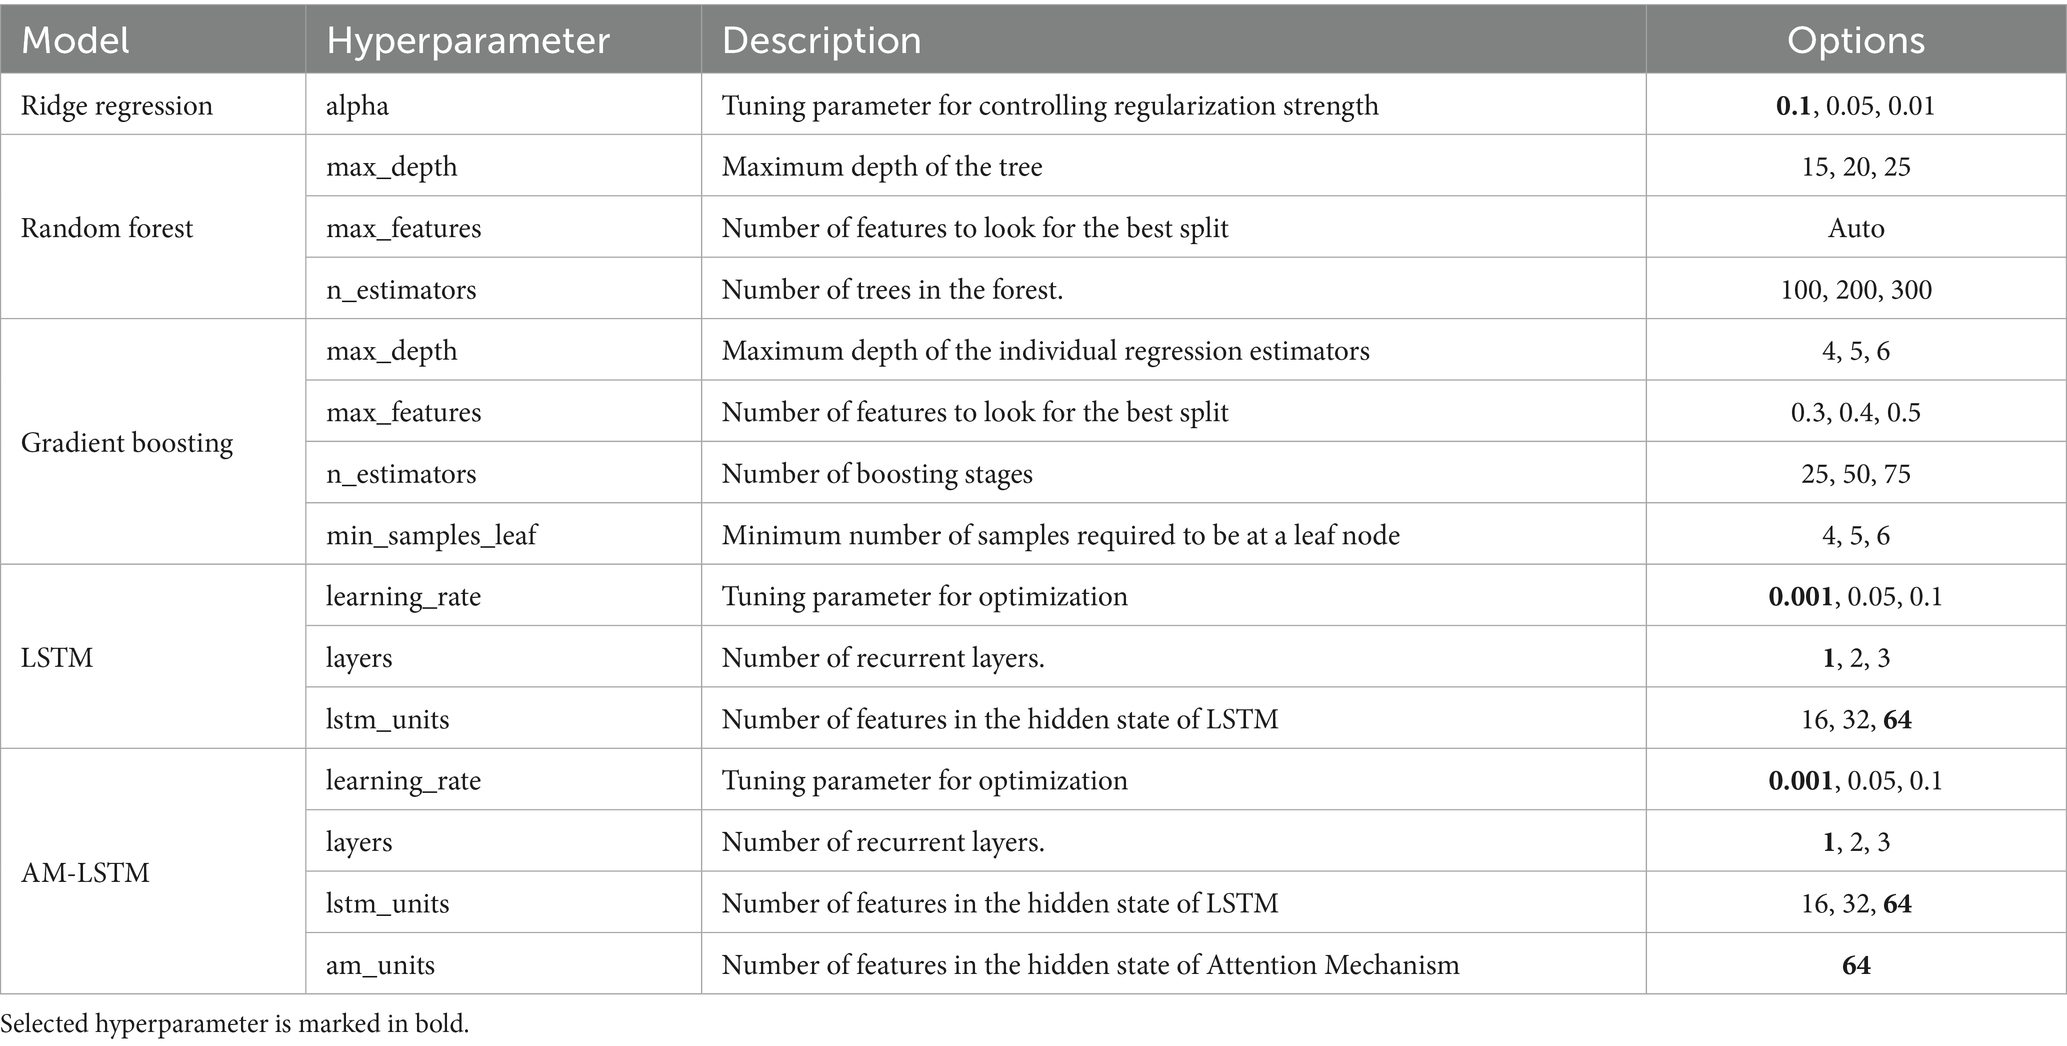
Table 4. Hyperparameters of all models.
4.5 Comprehensive performance of SASD framework
In this experiment, we predicted the pork retail price of the first, seventh, fifteenth, and thirtieth ahead days using the models with and without the proposed SASD framework. The input feature of the models without the proposed SASD framework was pork past retail price. The input features of the models using the proposed SASD framework are listed in Table 3. Table 5 presents the MAE and MAPE of all the models with and without the proposed SASD framework. We can observe that the SASD framework improved the prediction performance of all models, especially LSTM and AM-LSTM, which were improved more than two times. These results demonstrate the power of the proposed SASD framework for improving model performance. We also observed that as the predicted price gets distant, the MAE and MAPE of all the models increased. This is because pork prices are less volatile in the short term and the model predictions are overly dependent on past prices. As the predicted price gets distant, it changes significantly from the past price. Therefore, relying only on past prices resulted in sharp increases in MAE and MAPE. The SASD with AM-LSTM model achieved the best results, which are marked in bold. This is because AM-LSTM and LSTM can be trained with richer input features across multiple time steps compared to statistical and machine learning models. Together with the powerful learning abilities of LSTM and AM-LSTM, they can learn more useful features to help price predictions. Additionally, news features contain significant noise. Because AM-LSTM is a hybrid of LSTM and AM, and AM amplifies the importance of valuable features, it is less impacted by noise.
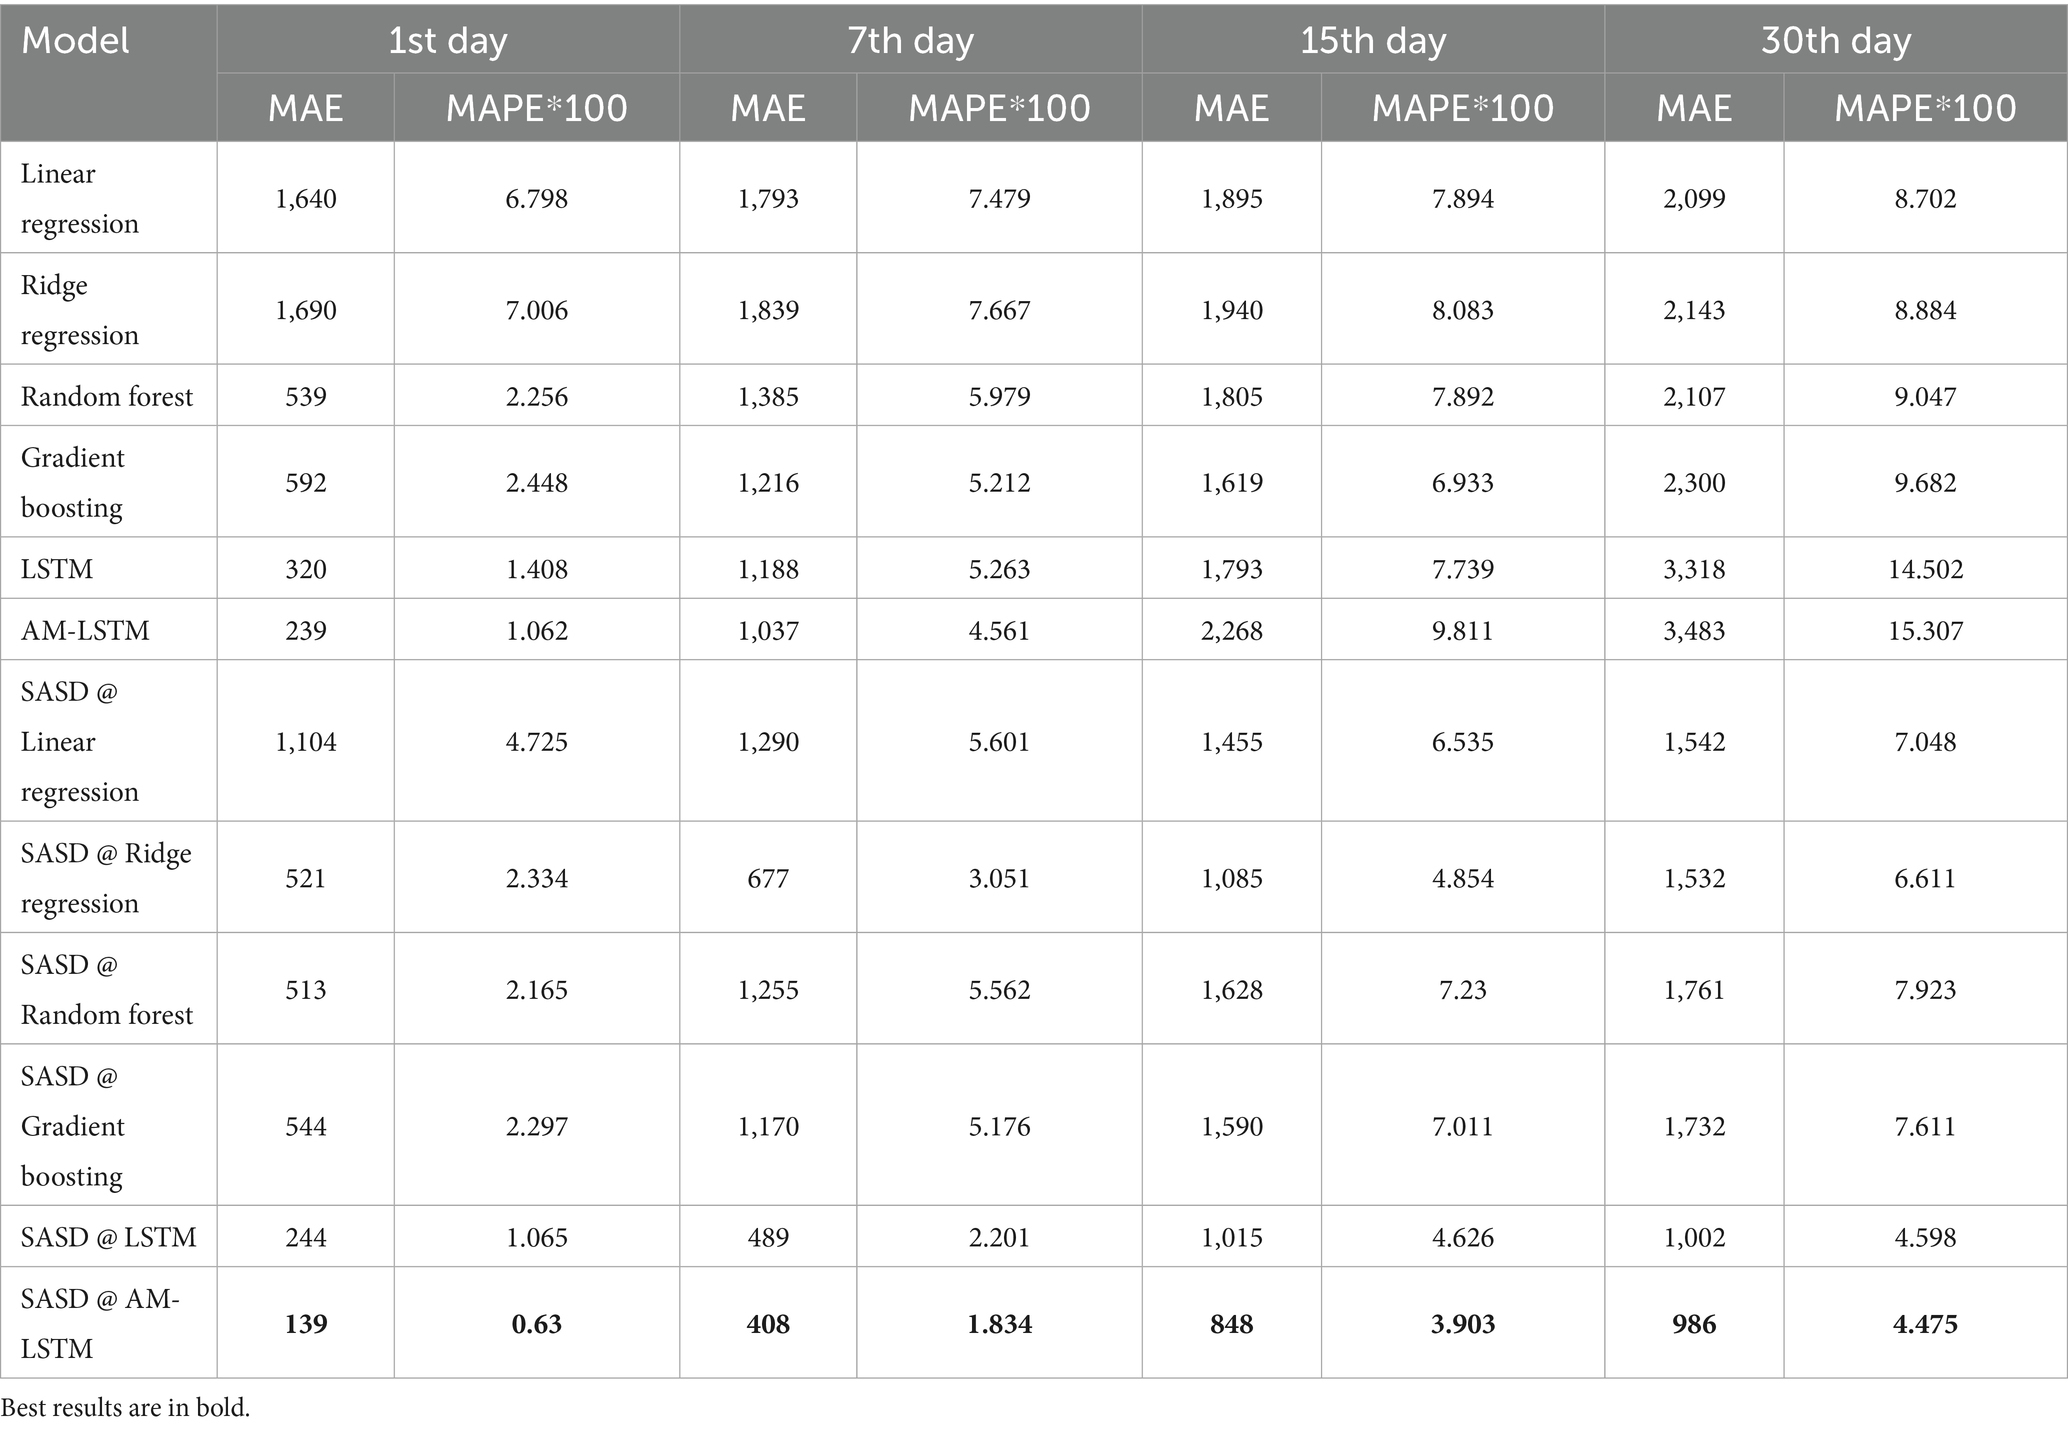
Table 5. Predicted results of all models with and without SASD framework.
The superior performance of the SASD@AM-LSTM model can be explained by several factors. First, pork prices are often influenced by public sentiment and market panic, particularly during crisis periods such as disease outbreaks. For example, the frequency of negative news articles often correlates with sudden price drops due to consumer concern and supply disruptions. By incorporating such sentiment-aware features, SASD enables the model to capture early signals of market volatility that are not evident in historical prices alone. Second, AM-LSTM benefits from its hybrid structure: the LSTM component captures temporal dependencies across multiple time steps, while the attention mechanism (AM) dynamically weights the importance of different input features. This approach allows the model to focus on the most informative signals (e.g., a sudden increase in negative sentiment) while minimizing the impact of irrelevant or noisy data. These results highlight the effectiveness of combining rich contextual features with attention-based architectures for more accurate and resilient price forecasting.
Figure 7 shows the actual and predicted pork retail prices of SASD@AM-LSTM model on the 1-day, 7-day, 15-day, and 30-day ahead forecasts.
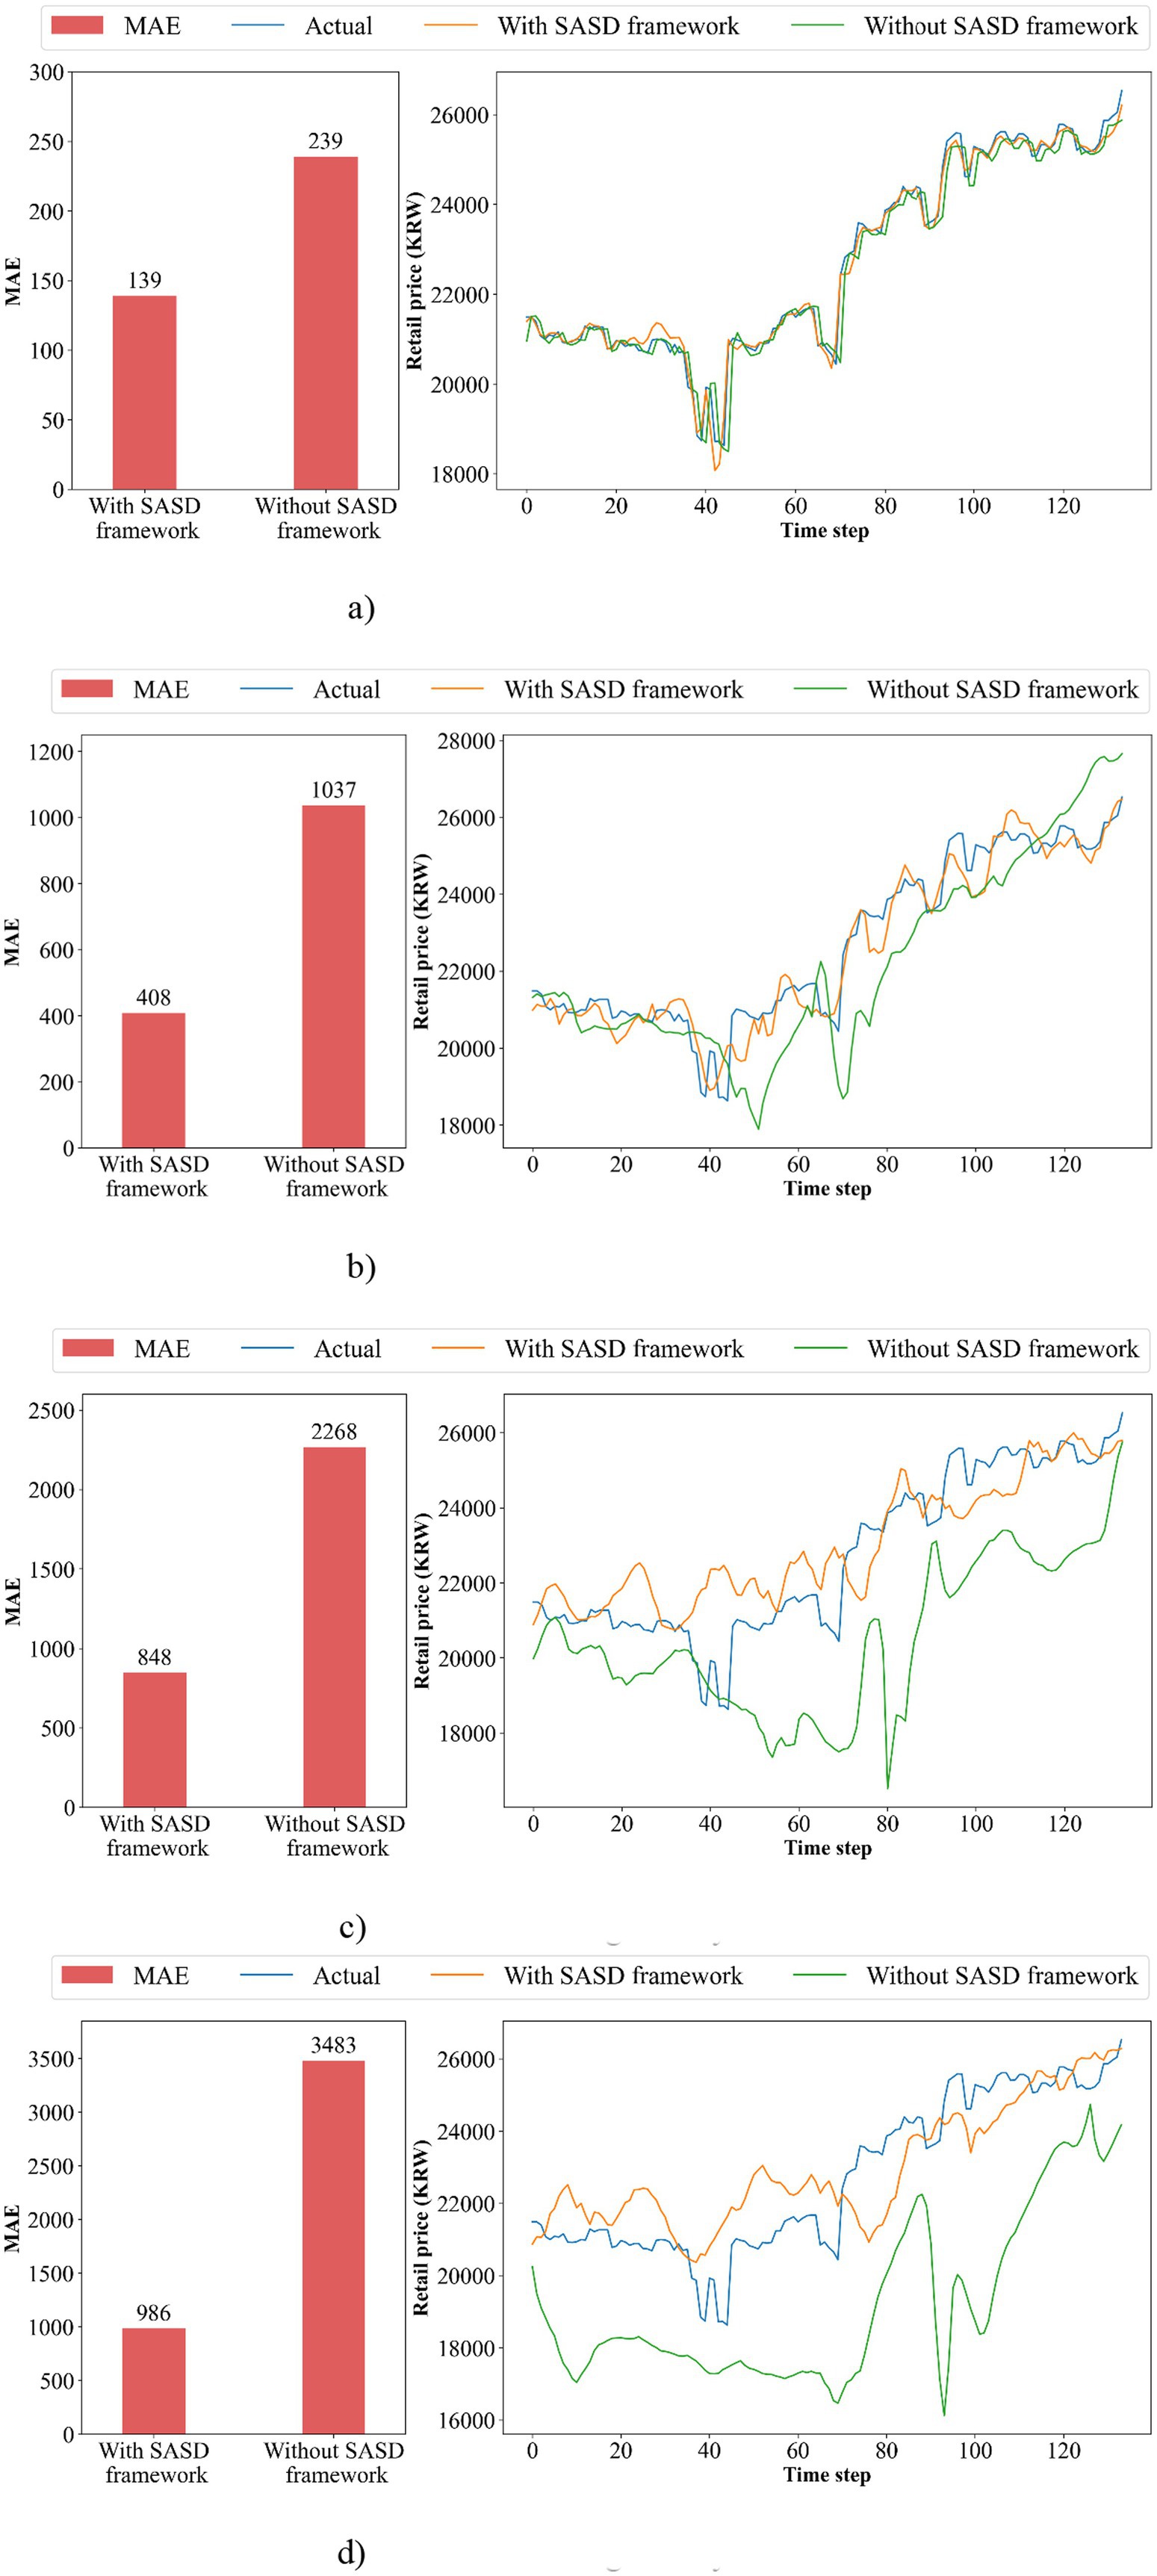
Figure 7. Performance of AM-LSTM with and without SASD framework. (a) When forecasting 1-day ahead; (b) When forecasting 7-day ahead; (c) When forecasting 15-day ahead; (d) When forecasting 30-day ahead.
The left graph of the figure shows the MAE difference between AM-LSTM model with and without the SASD framework. The right graph of the figure shows actual and predicted prices by AM-LSTM and SASD@AM-LSTM, with a legend clearly distinguishing between them.
From these plots, we observe that the predicted prices from the SASD@AM-LSTM model closely follow the actual price trends, especially for short-term forecasts (1-day and 7-day ahead). The fluctuations and turning points are captured with high reliability, demonstrating the model’s ability to track real market behavior. For longer-term forecasts (15-day and 30-day ahead), the predicted values deviate more from actual prices, which is expected due to increased uncertainty and diminished relevance of input features. However, even in these cases, the SASD-enhanced model maintains a more stable trend alignment compared to models without sentiment features. These visual patterns support the quantitative results shown in Table 5: the SASD framework contributes significantly to reducing prediction error and improving trend alignment across multiple time horizons.
4.6 Statistical validation of the SASD framework’s impact on AM-LSTM
To evaluate the statistical significance of the improvements introduced by the SASD framework, we compared the forecast errors of AM-LSTM models with and without SASD across multiple forecast horizons: 1-day, 7-day, 15-day, and 30-day ahead. Specifically, we computed absolute errors between the predicted and actual values and conducted both the paired t-test and the Wilcoxon signed-rank test to assess whether the observed reduction in errors was statistically significant. Here, the t-test examines whether the mean difference between the paired sets is significantly different from zero, assuming normality. In contrast, the Wilcoxon signed-rank test is a non-parametric alternative that does not assume a normal distribution, making it suitable for validating the robustness of the results.
As shown in Table 6, the SASD-enhanced AM-LSTM significantly outperformed the baseline AM-LSTM across all horizons. For example, in the 1-day forecast, the t-test and Wilcoxon test yielded p-values of 0.0018 and 0.0045, respectively. The statistical significance became even more pronounced for longer-term forecasts: in the 30-day horizon, the t-test and Wilcoxon test produced p-values of 1.11e−39 and 6.11e−23, respectively. These results confirm that the improvements are not due to random variation but instead reflect a consistent and statistically robust effect of the SASD framework on forecasting performance.
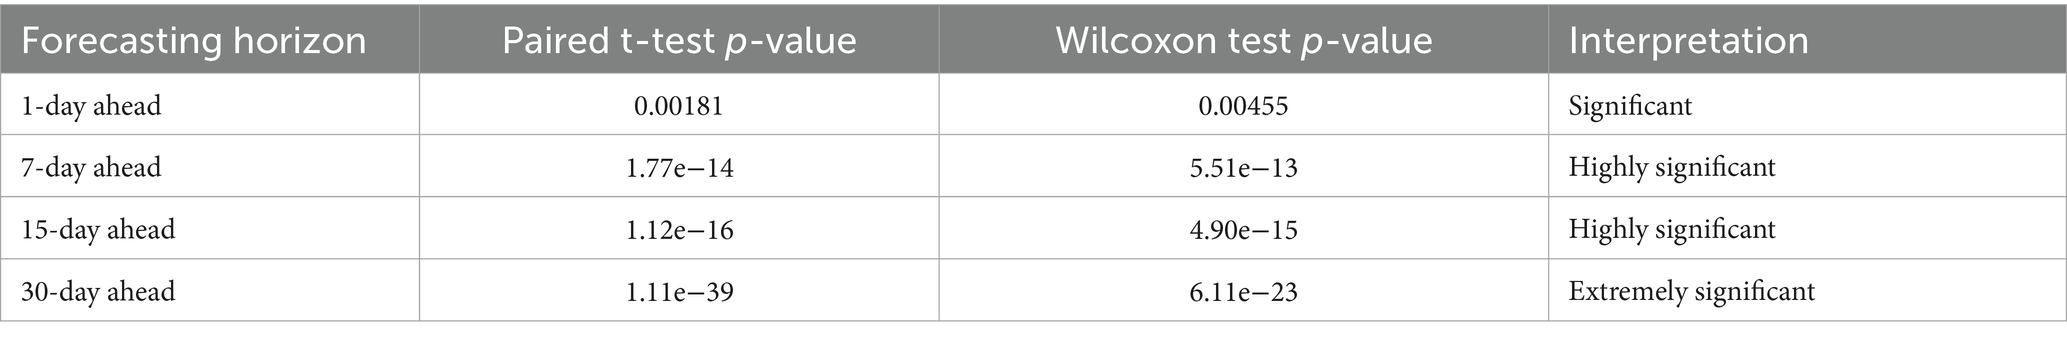
Table 6. Paired t-test and Wilcoxon signed rank test results on the impact of SASD on AM-LSTM.
Furthermore, to verify the statistical nature of the target series, we conducted an Augmented Dickey-Fuller (ADF) test on the actual pork price series. The test yielded a statistic of −0.402 and a p-value of 0.91, indicating that the series is non-stationary. This finding supports our design choice of using sequence models such as LSTM and AM-LSTM, which are well-suited for modeling non-stationary time series data.
To assess whether the performance differences between linear and nonlinear forecasting models were statistically meaningful, we employed the Diebold-Mariano (DM) test. This test is essential for validating whether improvements in predictive accuracy are due to genuine model superiority rather than random variation. Specifically, we compared forecast errors between Ridge Regression (a representative linear model) and AM-LSTM (a representative nonlinear model) across multiple forecast horizons (1, 7, 15, and 30 days), using absolute error as the loss function. The DM test was conducted separately under conditions with and without the proposed SASD framework. The results, summarized in Table 7, reveal that the differences in forecast accuracy are extremely significant (p < 0.001) in most cases, particularly when SASD is applied. Even in the absence of SASD, the performance gap remains statistically significant or highly significant. These findings confirm that the nonlinear AM-LSTM model consistently outperforms the linear Ridge model, and that the SASD framework further enhances this performance gap in a statistically robust manner.
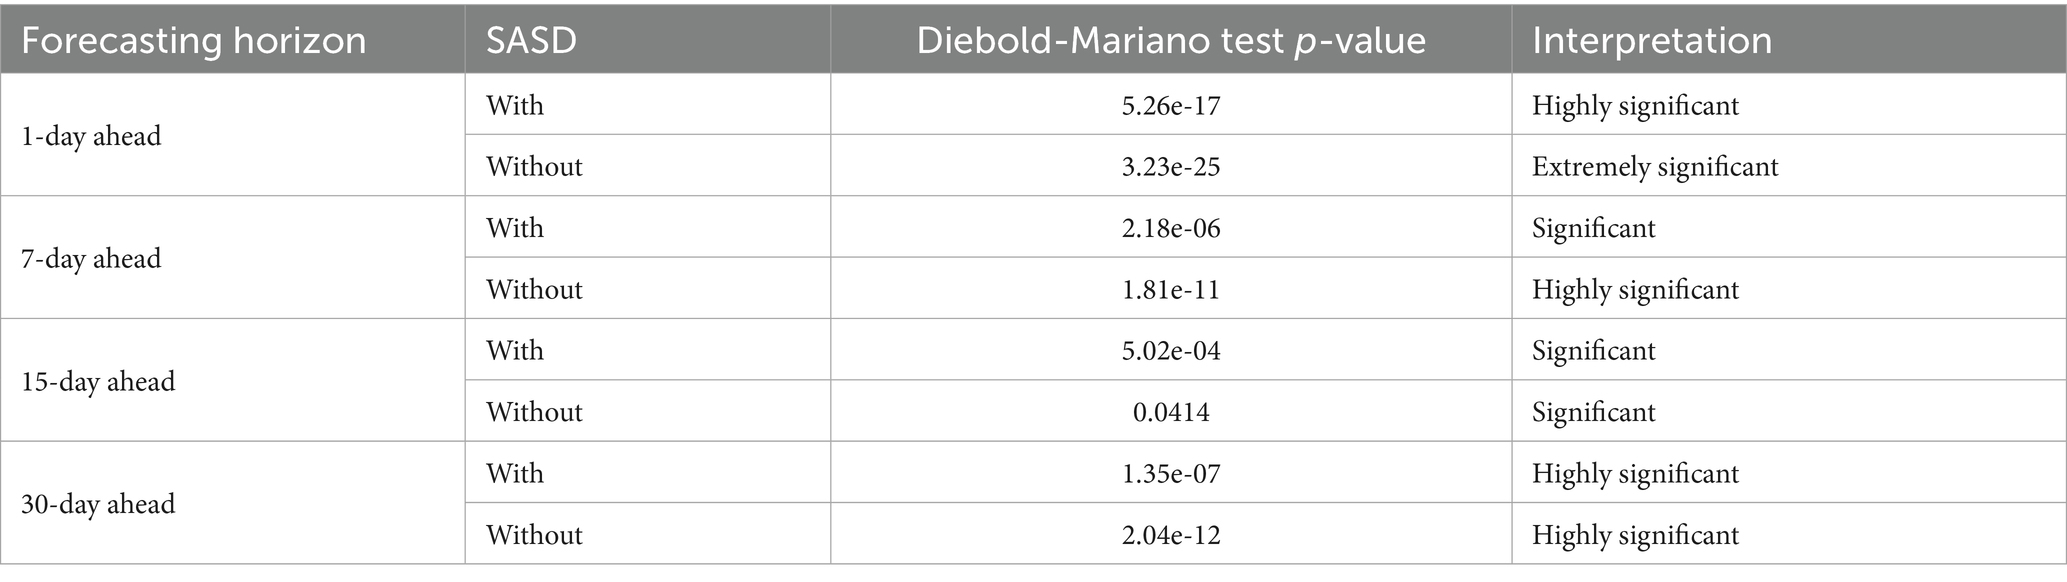
Table 7. Diebold-Mariano test results for comparisons between linear models (e.g., Ridge Regression) and nonlinear models (e.g., AM-LSTM).
4.7 Validation of various input features
In this experiment, we evaluated all the input features extracted by the SASD framework in the best-performing AM-LSTM model to demonstrate the positive effect of each input feature on pork price prediction. An increase in the MAE or MAPE of the SASD@AM-LSTM after removing an input feature indicates that the input feature positively affects pork price prediction. Here, a positive effect implies that the MAE or MAPE is reduced, and a negative effect implies that the MAE or MAPE is increased. We evaluated the effect of the input features using Equation 16. denotes the MAE or MAPE of the AM-LSTM after a certain input feature is removed. denotes the MAE or MAPE of AM-LSTM with all input features. Effect denotes the effect of one certain input feature on the predictive performance of the model. A positive value indicates a positive effect of AM-LSTM, whereas a negative value indicates a negative effect. The larger the Effect, the more significant the positive effect on model performance as shown in Equation 16:
Tables 8, 9 present the MAEs and MAPEs a certain input feature is removed and the effect of this input feature on the AM-LSTM model when predicting the first, seventh, fifteenth, and thirtieth ahead days pork prices. We can observe that almost all the input features have positive effects, except for the news sentiment feature on the fifteenth and thirtieth ahead days and the monthly residual on the thirtieth ahead day. These results suggest that the input features extracted by the SASD framework usually have a positive effect; therefore, they are valuable for improving pork price predictions.
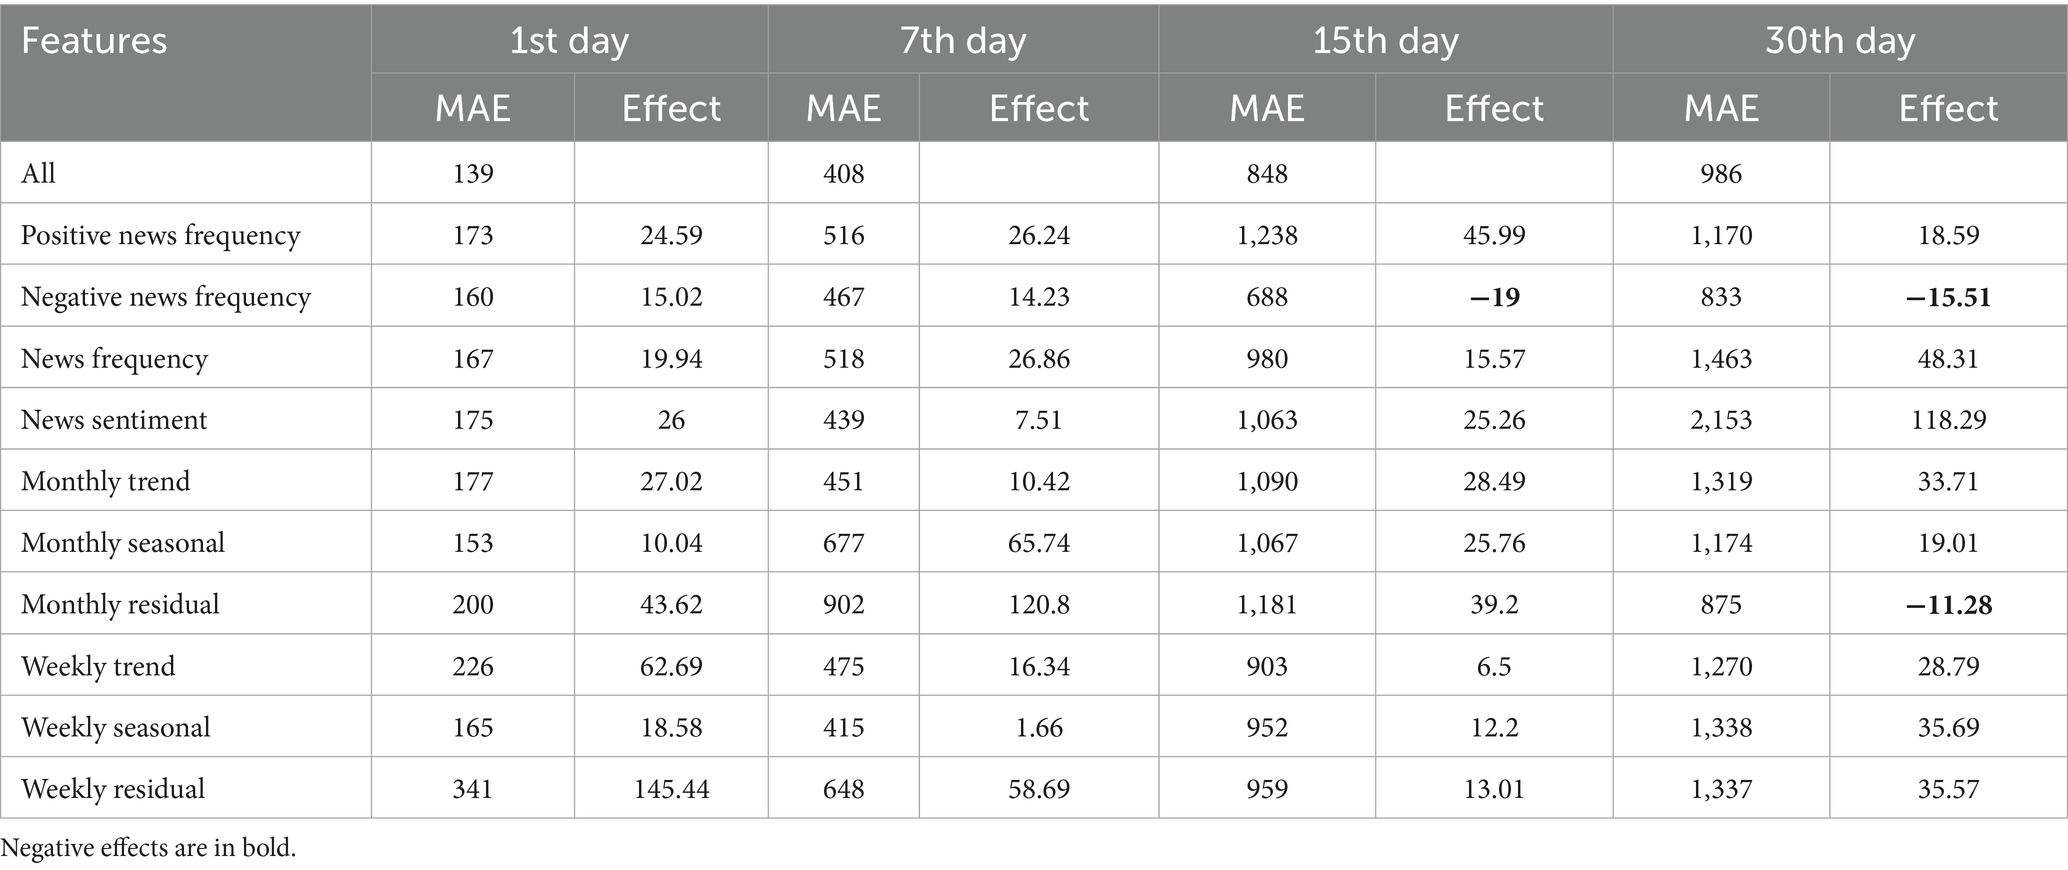
Table 8. Effects of input features under MAE.
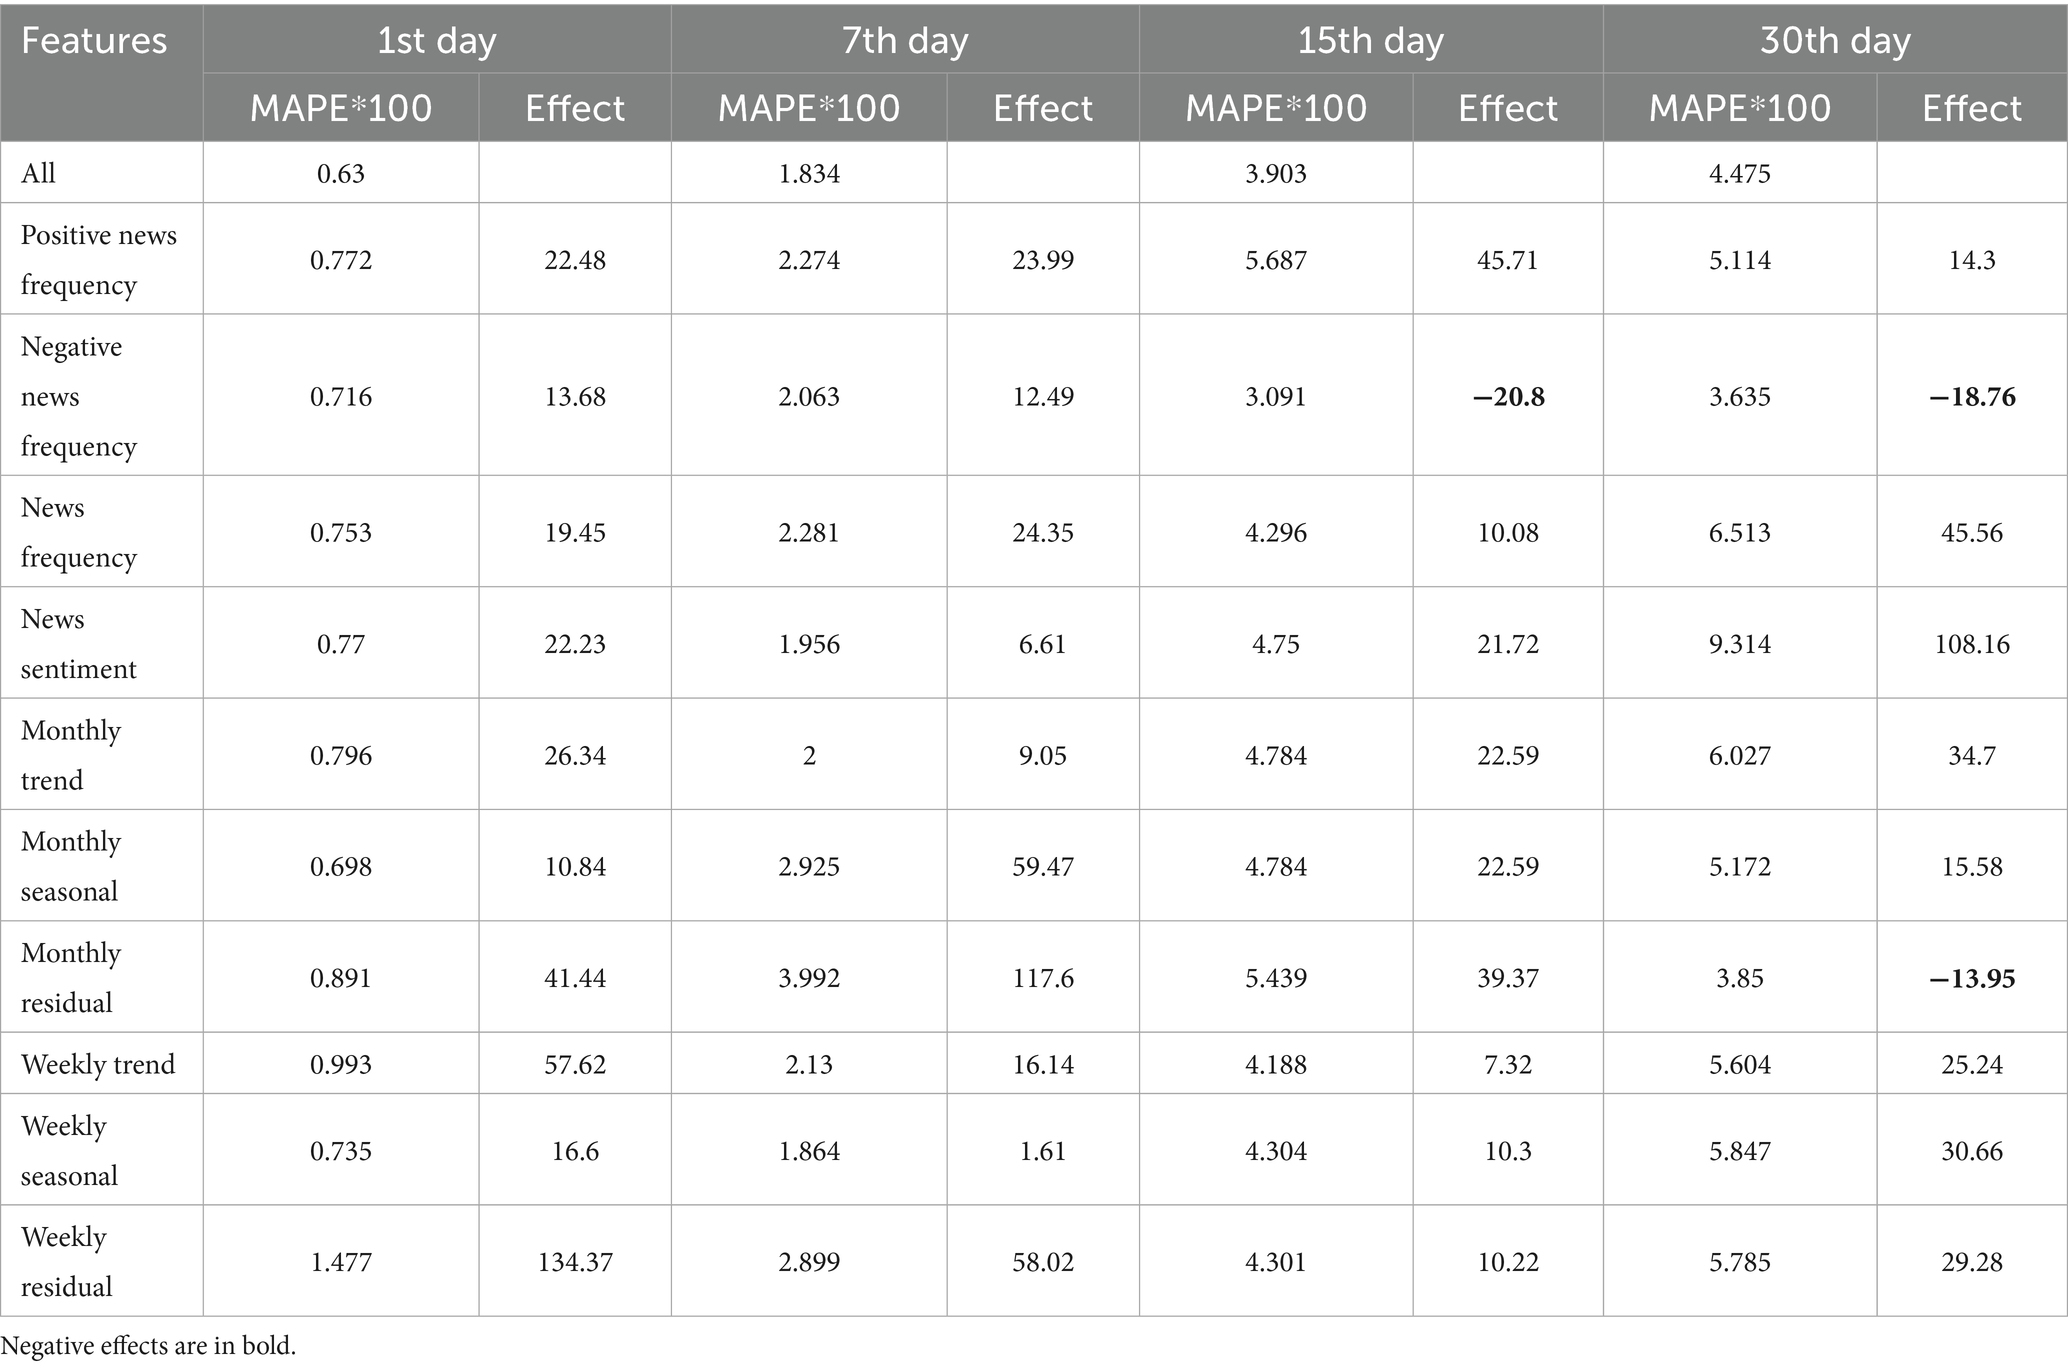
Table 9. Effects of input features under MAPE.
In the following section, we explain how the AM-LSTM model fully uses these input features based on temporal importance. Temporal importance refers to the importance of the input feature assigned to the time dimension for pork price prediction. In this study, the AM-LSTM model predicted pork prices using input features across 30-time steps. To interpret the temporal importance of the input features, we added a random perturbation term, that is, the standard error of the corresponding input feature. After adding a random perturbation, if MAE changes significantly, the temporal importance of the input feature is high, and vice versa. Figure 8 shows a heat map of the temporal importance of all input features, wherein green, yellow, and green colors represent high, medium, and low temporal importance, respectively. In Figures 8a,b, we observe that the closer the input features are to the present, the greater is the temporal importance. In Figures 8c,d, we observe that input features both close and distant from the present have high temporal importance. The main reason is that, when predicting short-term prices, the closer the features are to the present, the more correlated they are with the target price. These input features explain most errors; therefore, those that are distant from the present cannot express their temporal importance. As the target price gets distant, input features closer to the present cannot explain most errors, and the temporal importance of input features that are distant from the present increases. In Figures 8a,b, we also observe that news features closer to the present have a high temporal importance. Figures 8c,d indicate that the news features maintained medium temporal importance over the past 30 days. We conclude that when price features cannot explain most of the errors, the news features extracted through sentiment analysis can assist price features in explaining the remaining errors.
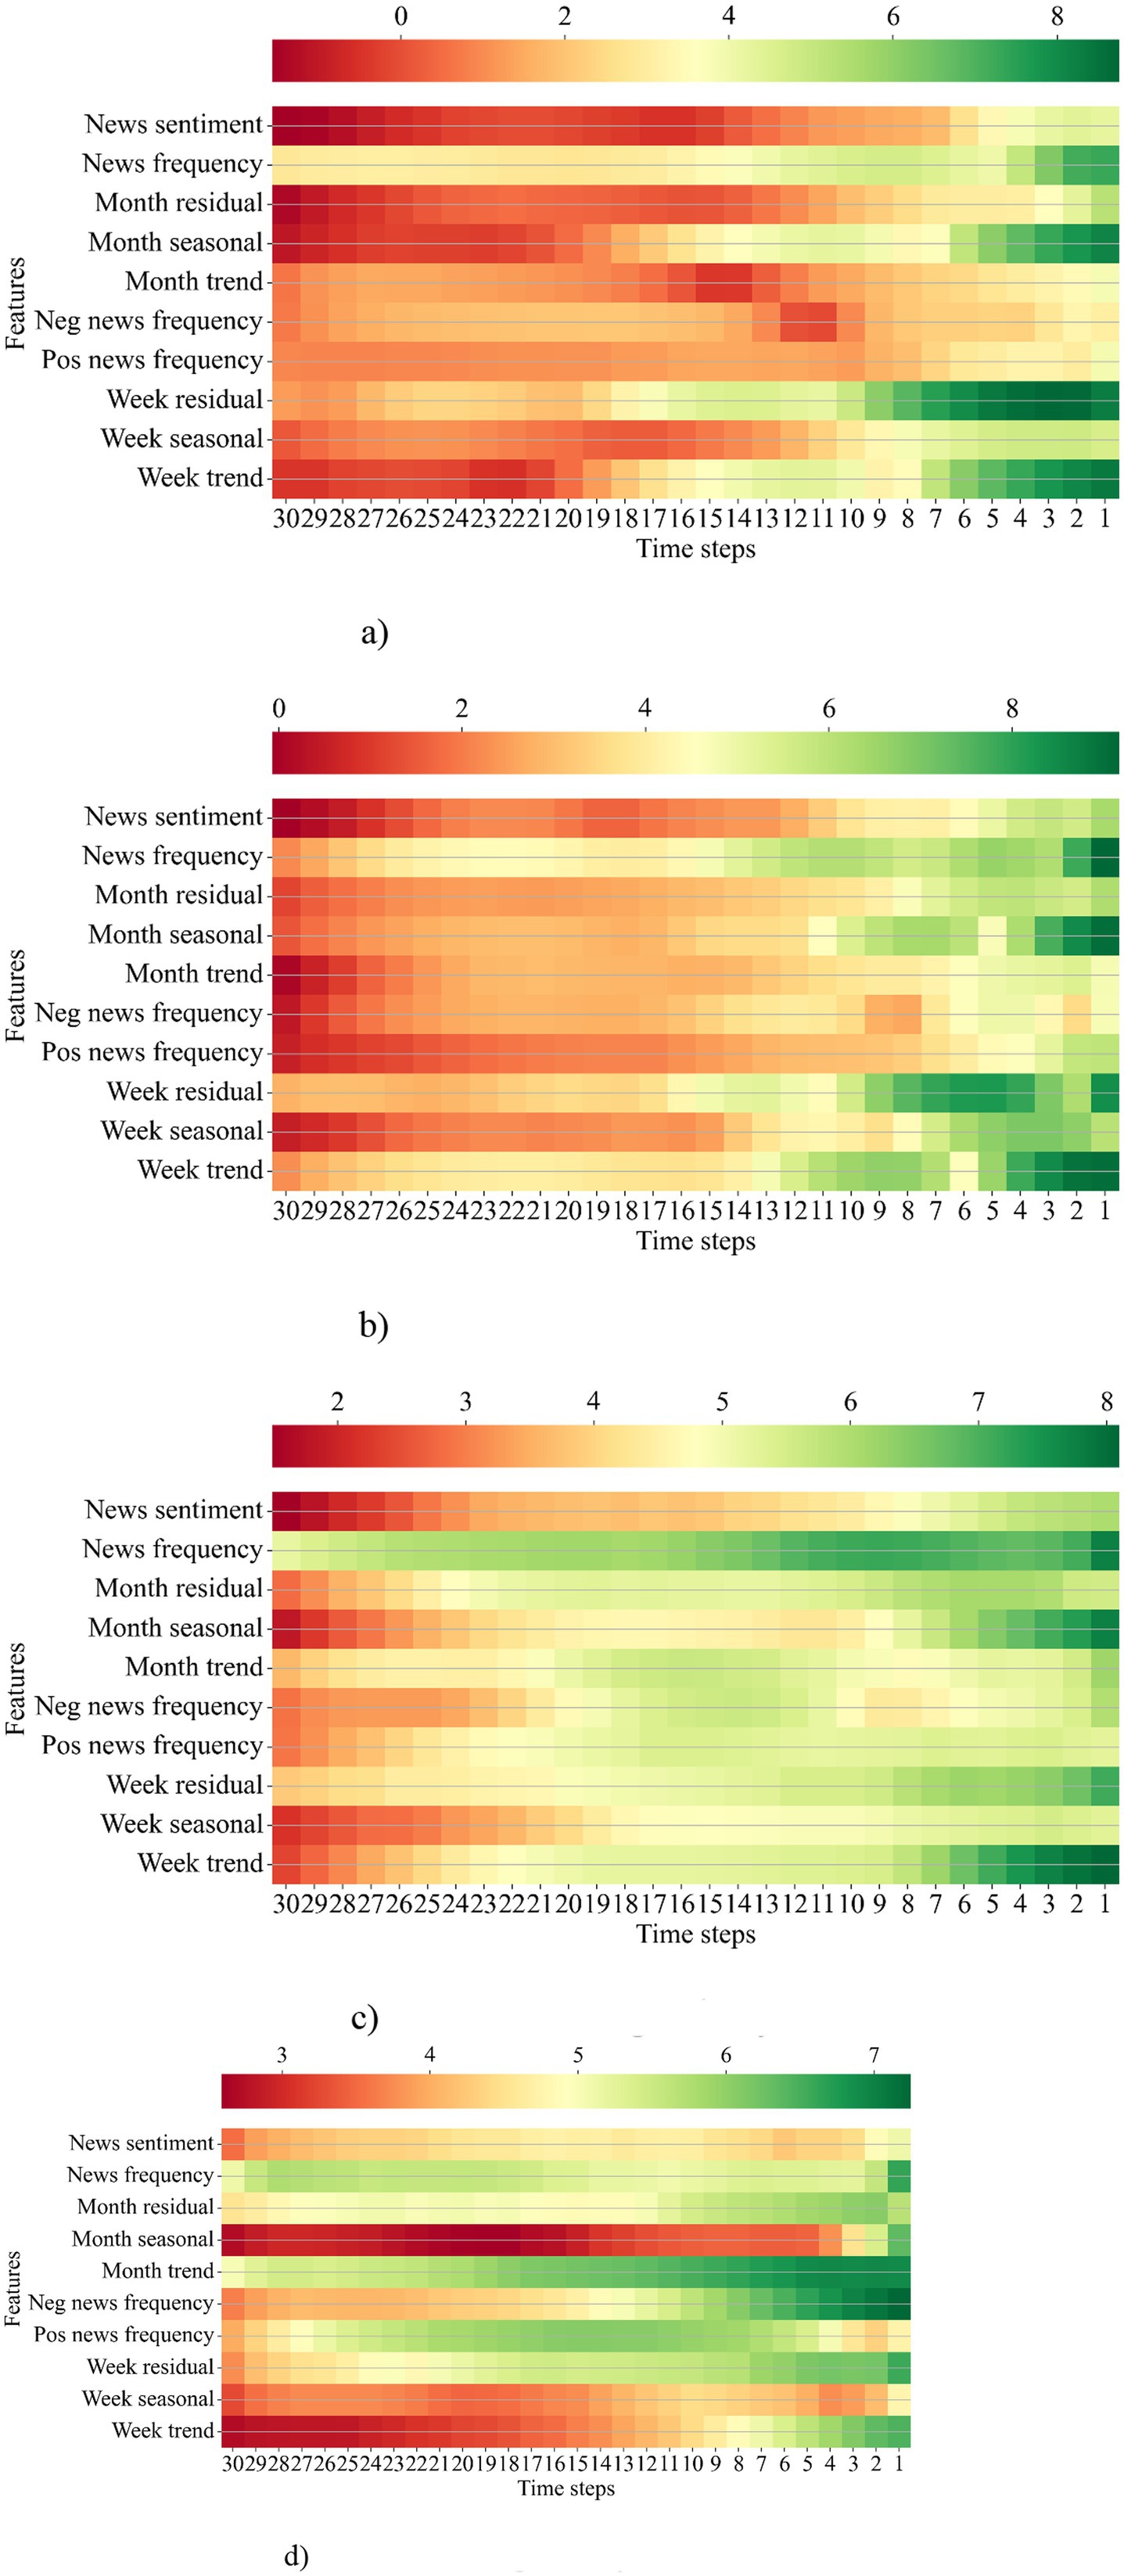
Figure 8. Temporal importance of input features across multiple time steps. (a) When forecasting 1st day; (b) When forecasting 7th day; (c) When forecasting 15th day; (d) When forecasting 30th day.
In the following section, we evaluate the sentiment lexicon to demonstrate why news input features positively affect the model performance. First, we prepared 500 positive and 500 negative news items to evaluate the efficiency of the sentiment lexicon. Then, we set the manually labeled polarity as the actual polarity and compared it with the polarity classified using the sentiment lexicon. Figure 9 shows the accuracy, recall, precision, and F1-score of the sentiment lexicon. We can conclude that the sentiment lexicon accurately classifies both positive and negative news.
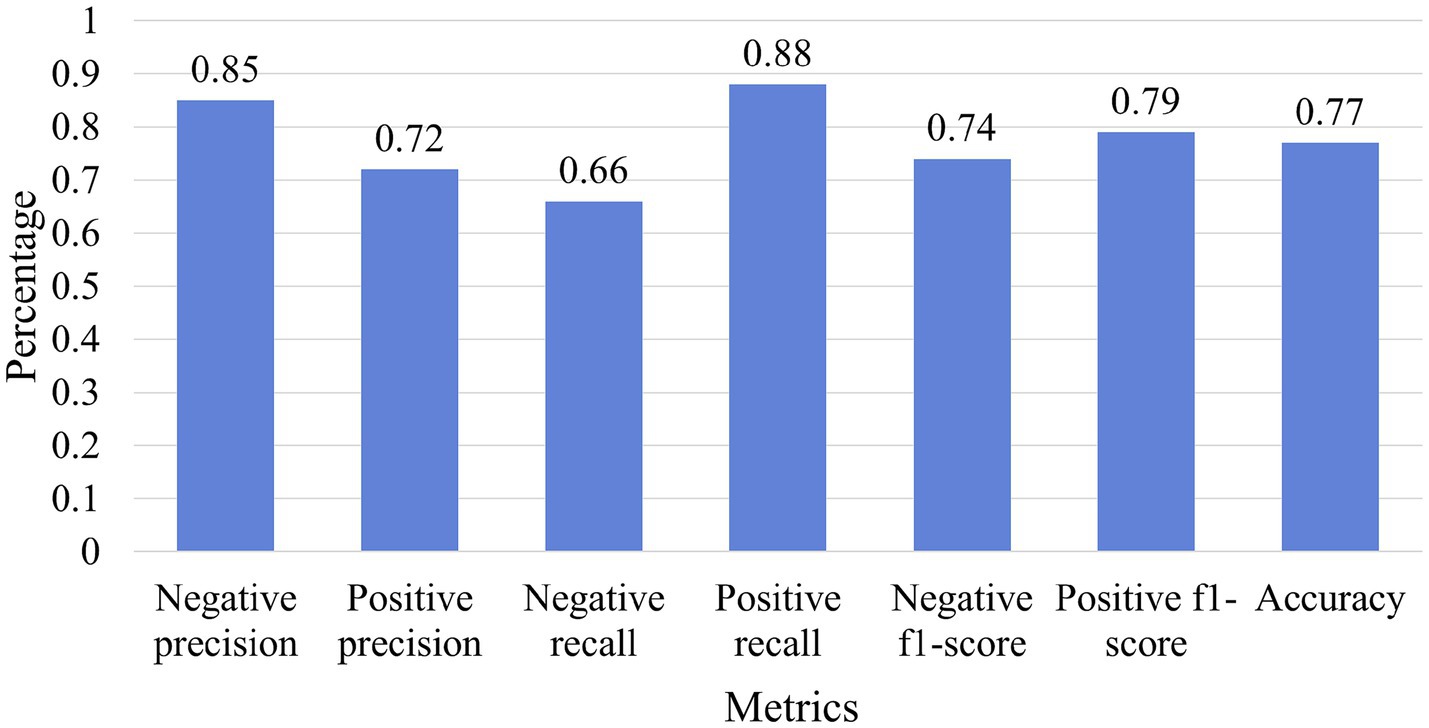
Figure 9. Classification report of sentiment lexicon.
4.8 Generalizability of proposed method
In this experiment, we predicted different types of pork prices to demonstrate the generalizability of the proposed methods. The different types of pork prices include retail, market, and distributor prices. Retail, market, and distribution prices are the prices paid in retail stores, traditional markets, and supermarkets, respectively. Figure 10 shows the MAEs of retail, distributor, and market prices for the first, seventh, fifteenth, and thirtieth ahead days predictions. We can observe that the market price has the lowest MAE, while the distribution price has the highest MAE. Because the market price is inherently stable, its MAE is the lowest. The distribution price is inherently more volatile; thus, its MAE is the highest. Although the MAE has demonstrated the performance of the proposed methods, we cannot conclude that the proposed model has the best prediction performance for market price and the worst prediction performance for distribution price. Because these prices have different standard deviations and mean values, it is difficult to reflect the differences in predictive performances using MAE.
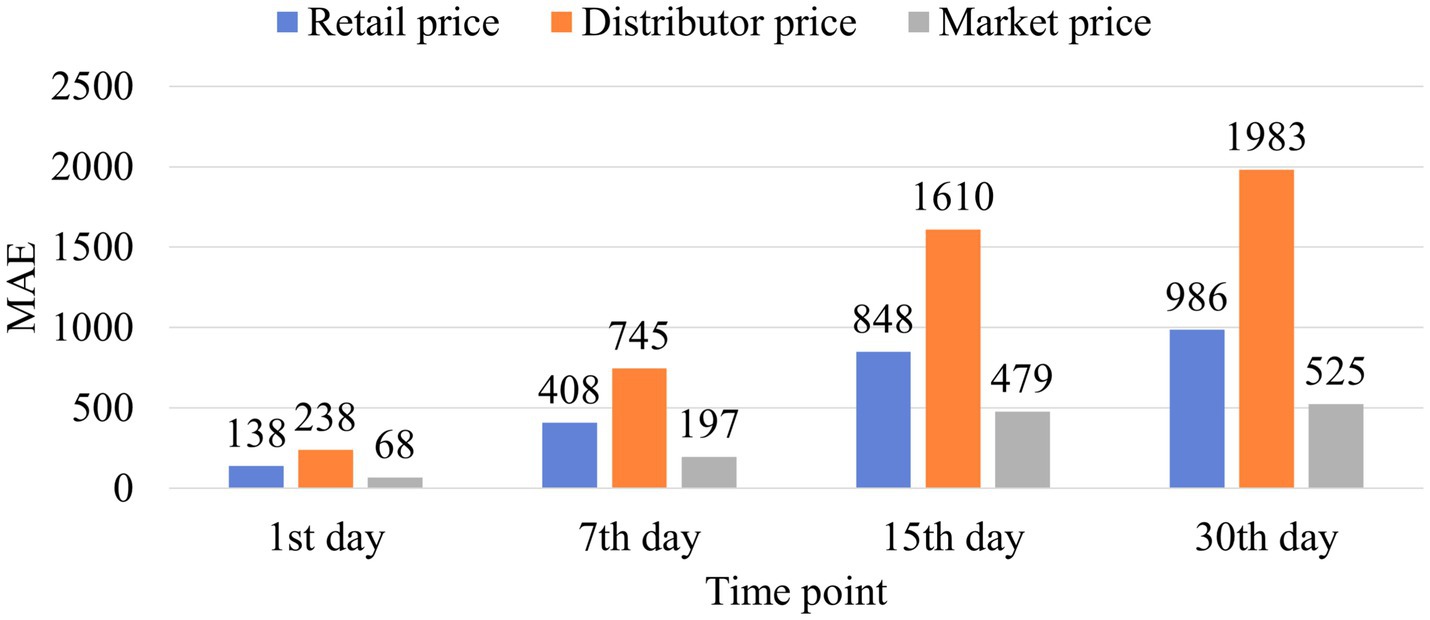
Figure 10. MAE of different types of pork prices.
Figure 11 shows the MAPEs of the retail, distribution, and market prices for the first, seventh, fifteenth, and thirtieth ahead days predictions. We can observe that the proposed methods have the worst prediction performance for distribution price, similar performance for retail and market price on the first and thirtieth days, and best performance for the market price on the seventh and fifteenth ahead days. We can also observe that, as the predicted price gets distant, the MAPE gradually increases, and the maximum MAPE is less than 10. Therefore, we can conclude that the proposed methods not only have high predictive performance for retail prices, but also for distribution and market prices.
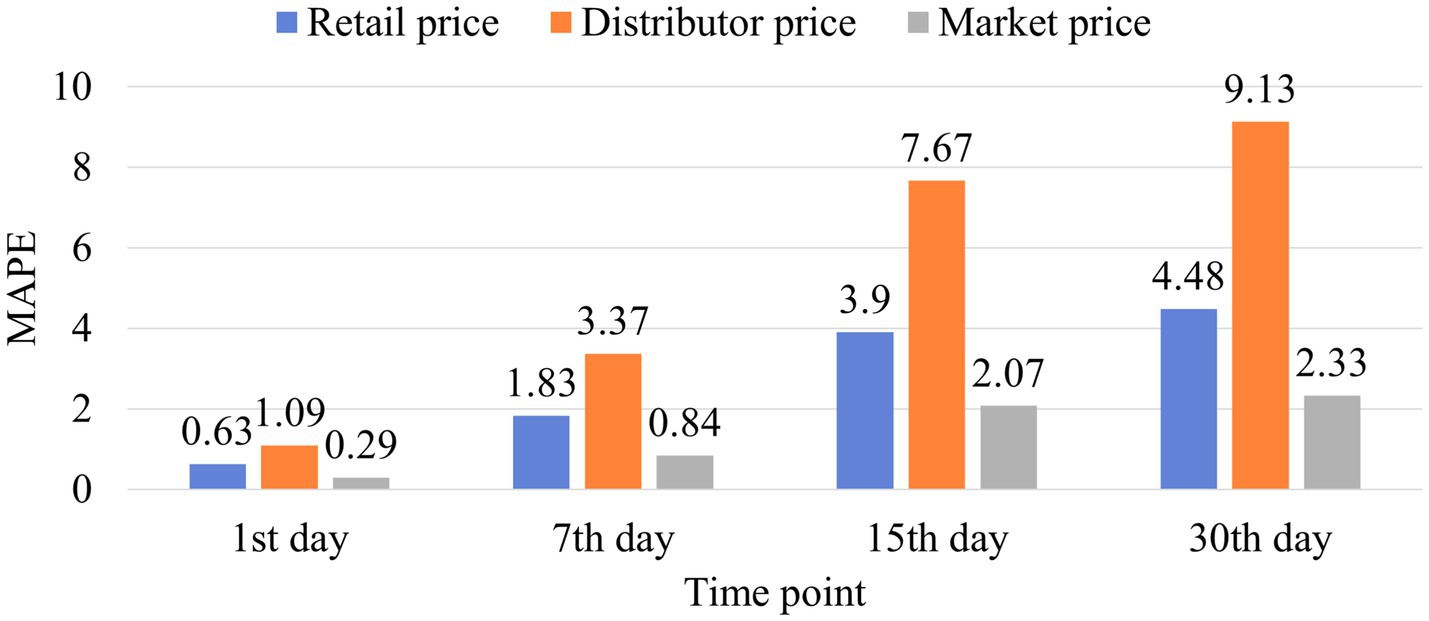
Figure 11. MAPE of different types of pork prices.
4.9 Case study: pork price forecasting during ASF
In this experiment, we evaluated the predictive performance of the proposed method in actual market situations. The pork market suffered a massive shock from February 1 to July 1, 2022, due to ASF. Table 10 presents news items published during this period. On February 8, the first case of ASF in South Korea was reported in the news. On March 28 and April 30, the onset of widespread ASF was reported. On May 28, it was reported that pork prices had risen because of ASF. On May 31, it was reported that the government was controlling the spread of ASF on a large scale. Lastly, on June 30, it was reported that the control of ASF had been lifted, meaning that the spread of the virus in Africa was over.
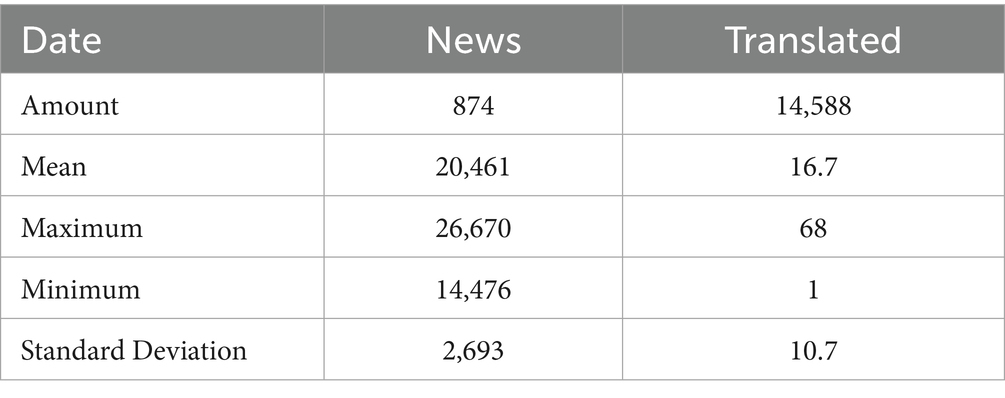
Table 10. Published news during 2022-02-01 and 2022-07-01.
Figure 12 illustrates the MAEs of pork price forecasts at different time horizons (1, 7, 15, and 30 days) during the ASF outbreak period, using three models: LSTM, AM-LSTM, and SASD@AM-LSTM. Among them, the SASD@AM-LSTM model consistently outperformed the other two, demonstrating the lowest MAEs at each time point: 198 (1st day), 409 (7th day), 1,725 (15th day), and 1,890 (30th day). In contrast, both LSTM and AM-LSTM showed higher errors, particularly for longer forecast horizons. This comparison validates the robustness and superiority of the proposed SASD@AM-LSTM framework under extreme market conditions. These results indicate that our short-term prediction models (1-day and 7-day ahead) maintained strong predictive performance, even during this volatile period. In contrast, the performance of longer-term models (15-day and 30-day ahead) worsened, likely due to the reduced relevance of earlier news sentiment features as prediction horizons increased. Therefore, short-term SASD@AM-LSTM models are particularly well-suited for real-time decision-making in dynamic and uncertain market environments.
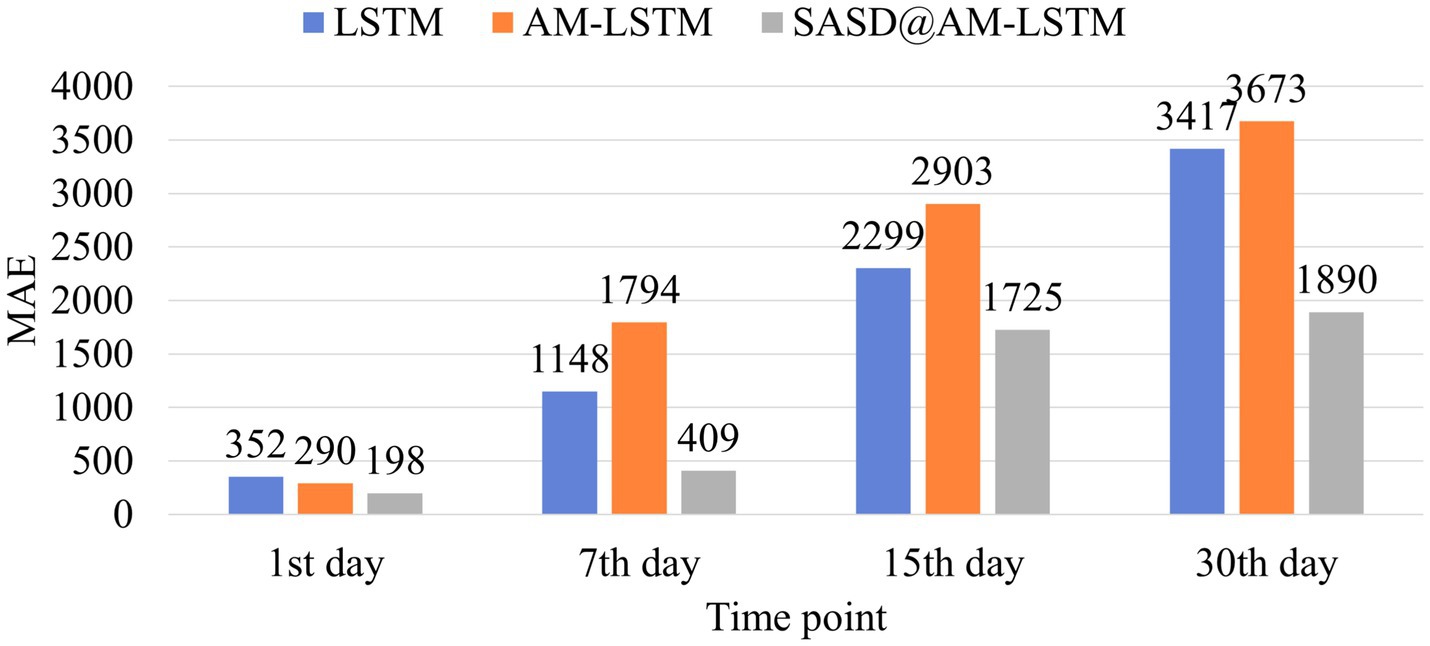
Figure 12. MAE comparison for prediction of pork retail prices during the ASF outbreak using the LSTM, AM-LSTM, and SASD@AM-LSTM model.
5 Discussion
In this study, we proposed the SASD framework for forecasting pork retail prices in South Korea. We collected pork-related news articles from Naver News and retail price data from the KAMIS database, and extracted sentiment scores, sentiment frequency, and seasonal components (weekly and monthly) using the SASD framework. We trained and evaluated several forecasting models, including statistical, machine learning, and deep learning approaches with and without SASD. As shown in Table 5, models incorporating SASD consistently outperformed baseline models. The best performance was achieved by the SASD@AM-LSTM, reducing MAE and MAPE significantly. These improvements are driven by three complementary feature types:
• Sentiment scores provide early signals about market perception, particularly during disruptive events.
• Sentiment frequency captures the volume of media attention, which correlates with public concern and may reflect supply chain disturbances.
• Seasonal components adjust for regular periodic fluctuations (e.g., weekly market cycles or holiday effects) that are not captured by news or prices alone.
Our findings show that news-related features contribute more significantly to long-term forecasts. In short-term predictions, recent prices serve as strong predictors, and the added value of news is marginal. However, in long-term predictions (15- and 30-day ahead), historical prices lose relevance, and sentiment trends help fill the gap. This trend is visualized in Figure 8, where we observe that news sentiment remains predictive while price signals degrade over time. We also observed the effect of major events on model performance. For example, during the ASF outbreak, spikes in negative sentiment and news frequency aligned with sharp price increases (Figure 12). Such cases demonstrate the framework’s ability to adapt to non-linear, exogenous shocks that traditional price-based models struggle to handle.
The ITF–IDF algorithm achieved a classification F1-score exceeding 70% for binary sentiment classification (positive vs. negative). To assess the validity of the generated sentiment lexicon, several domain experts manually reviewed and evaluated a subset of the classification results. While the expert assessment confirmed the overall reliability of the lexicon within the pork-related news domain, its applicability to broader contexts remains limited due to domain specificity. As such, the lexicon may require further manual refinement or adaptation when applied to other commodities or domains. Future research should explore the use of expert-in-the-loop strategies or semi-supervised learning techniques to enhance the generalizability and semantic accuracy of the sentiment lexicon.
6 Conclusion
This study introduces the SASD framework, a novel approach that incorporates sentiment and seasonal signals to enhance price prediction. Unlike conventional methods that rely solely on structured variables such as historical prices, our approach integrates news-derived features, enabling models to respond more effectively to real-world disruptions. Our results confirm that the SASD-enhanced AM-LSTM model achieves superior forecasting accuracy, particularly in volatile conditions. The relationship between sentiment, sentiment frequency, and seasonal trends provides a more nuanced representation of the factors influencing food prices.
By bridging time-series forecasting with sentiment analysis, our study contributes to emerging efforts in agri-food informatics, offering a scalable framework for proactive decision-making during economic and public health crises. In particular, more reliable price forecasts can assist policymakers in implementing timely interventions to stabilize food markets during periods of instability. Farmers and producers can benefit from these predictions by making informed decisions about production volumes, timing of sales, and inventory management, ultimately reducing losses and optimizing profit. Additionally, market stabilization can be enhanced through early detection of sentiment-driven disruptions, such as disease outbreaks or economic shocks, which are often reflected in public discourse before manifesting in market data.
However, this study has several limitations. First, experiments were limited to pork prices in South Korea using Naver News as the sole news source. This reliance may introduce bias or omit perspectives covered by other platforms. Future work should include news aggregation from diverse sources to improve coverage and robustness. For example, “pigtimes” is a platform that publishes news related Korean pork market. Second, the method has not yet been validated for other commodities or regions. Although we hypothesize that SASD may generalize to products such as lamb, beef, or chicken, further experiments are required to confirm its applicability.
Additionally, the construction of a sentiment lexicon for Korean news remains a bottleneck. While the ITF–IDF approach shows promise, expert annotation or transfer learning may be necessary to improve semantic accuracy for domain-specific sentiment analysis. In future research, we aim to:
• Extend SASD to other commodities and regions.
• Incorporate multiple news sources and social media for broader sentiment signals.
• Integrate expert-validated sentiment lexicons and multilingual extensions.
• Evaluate model interpretability using SHAP or attention-based visualization to understand feature impact across different conditions.
Data availability statement
The original contributions presented in the study are included in the article/supplementary material, further inquiries can be directed to the corresponding authors.
Author contributions
YZ: Conceptualization, Data curation, Formal analysis, Investigation, Methodology, Visualization, Writing – original draft. TC: Conceptualization, Data curation, Validation, Writing – review & editing, Formal analysis, Methodology. J-HC: Supervision, Validation, Writing – review & editing, Conceptualization, Investigation. AN: Conceptualization, Supervision, Validation, Writing – review & editing, Formal analysis, Methodology, Funding acquisition.
Funding
The author(s) declare that financial support was received for the research and/or publication of this article. This research was supported by the “Cooperative Research Program for Agriculture Science and Technology Development (Project No. PJ015341012022)” of the Rural Development Administration, Republic of Korea.
Conflict of interest
YZ was employed by Jiangsu Kanion Pharmaceutical Co. Ltd and by AIICON LLC. J-HC was employed by AIICON LLC.
The remaining authors declare that the research was conducted in the absence of any commercial or financial relationships that could be construed as a potential conflict of interest.
Generative AI statement
The author(s) declare that no Gen AI was used in the creation of this manuscript.
Publisher’s note
All claims expressed in this article are solely those of the authors and do not necessarily represent those of their affiliated organizations, or those of the publisher, the editors and the reviewers. Any product that may be evaluated in this article, or claim that may be made by its manufacturer, is not guaranteed or endorsed by the publisher.
Supplementary material
The Supplementary material for this article can be found online at: https://www.frontiersin.org/articles/10.3389/fsufs.2025.1613616/full#supplementary-material
References
An, J., and Kim, H. W. (2015). Building a Korean sentiment lexicon using collective intelligence. J. Intell. Inf. Syst. 21, 49–67. doi: 10.13088/jiis.2015.21.2.49
Bahdanau, D., Cho, K., and Bengio, Y. (2015). 3rd international conference on learning representations
Biswas, J. C., Haque, M. M., Maniruzzaman, M., Ali, M. H., Kabir, W., and Kalra, N. (2019). Natural hazards and livestock damage in Bangladesh. Nat. Hazards 99, 705–714. doi: 10.1007/s11069-019-03768-0
Chen, D., Zhang, J., and Jiang, S. (2020). Forecasting the short-term metro ridership with seasonal and trend decomposition using loess and LSTM neural networks. IEEE Access 8, 91181–91187. doi: 10.1109/ACCESS.2020.2995044
Chuluunsaikhan, T., Kim, J. H., Park, S. H., and Nasridinov, A. (2024). Analyzing internal and external factors in livestock supply forecasting using machine learning: sustainable insights from South Korea. Sustain. For. 16:6907. doi: 10.3390/su16166907
Chuluunsaikhan, T., Ryu, G. A., Yoo, K. H., Rah, H., and Nasridinov, A. (2020). Incorporating deep learning and news topic modeling for forecasting pork prices: the case of South Korea. Agriculture 10:513. doi: 10.3390/agriculture10110513
Deepa, S., Alli, A., and Gokila, S. (2023). Machine learning regression model for material synthesis prices prediction in agriculture. Mater. Today Proc. 81, 989–993. doi: 10.1016/j.matpr.2021.04.327
Friedman, J. H. (2001). Greedy function approximation: a gradient boosting machine. Ann. Stat. 29, 1189–1232. doi: 10.1214/aos/1013203451
Gao, J., Sultan, H., Hu, J., and Tung, W. W. (2009). Denoising nonlinear time series by adaptive filtering and wavelet shrinkage: a comparison. IEEE Signal Process. Lett. 17, 237–240.
Hassouneh, I., Radwan, A., Serra, T., and Gil, J. M. (2012). Food scare crises and developing countries: the impact of avian influenza on vertical price transmission in the Egyptian poultry sector. Food Policy 37, 264–274. doi: 10.1016/j.foodpol.2012.02.012
Hochreiter, S., and Schmidhuber, J. (1997). Long short-term memory. Neural Comput. 9, 1735–1780. doi: 10.1162/neco.1997.9.8.1735
Hoerl, A. E., and Kennard, R. W. (2000). Ridge regression: biased estimation for nonorthogonal problems. Technometrics 42, 80–86. doi: 10.1080/00401706.2000.10485983
Jobst, N. (2024). South Korea: Per capita pork consumption 2023. Statista. Available online: https://www.statista.com/statistics/1036394/south-korea-per-capita-pork-consumption/ (Accessed June 23, 2025).
KAMIS. (2023). Korea Agricultural Marketing Information Service. Available online at: https://www.kamis.or.kr/customer/main/main.do (Accessed June 12, 2023).
Kang, Y. S. (2019). Korea almost completes culling of potentially ASF-affected pigs. Yonhap News Agency. Available online at: https://en.yna.co.kr/view/AEN20191007002700320 (Accessed June 12, 2023).
Li, J., Li, G., Liu, M., Zhu, X., and Wei, L. (2022). A novel text-based framework for forecasting agricultural futures using massive online news headlines. Int. J. Forecast. 38, 35–50. doi: 10.1016/j.ijforecast.2020.02.002
Li, Y., Zhou, H., Lin, Z., Wang, Y., Chen, S., Liu, C., et al. (2020). Investigation in the influences of public opinion indicators on vegetable prices by corpora construction and WeChat article analysis. Futur. Gener. Comput. Syst. 102, 876–888. doi: 10.1016/j.future.2019.07.016
Liu, Y., Duan, Q., Wang, D., Zhang, Z., and Liu, C. (2019). Prediction for hog prices based on similar sub-series search and support vector regression. Comput. Electron. Agric. 157, 581–588. doi: 10.1016/j.compag.2019.01.027
Lusk, J. L., Tonsor, G. T., and Schulz, L. L. (2021). Beef and pork marketing margins and price spreads during COVID-19. Appl. Econ. Perspect. Policy 43, 4–23. doi: 10.1002/aepp.13101
Naver News. (2023). Naver News Portal. Available online at: https://news.naver.com/ (Accessed June 12, 2023).
Ohyver, M., and Pudjihastuti, H. (2018). Arima model for forecasting the price of medium quality rice to anticipate price fluctuations. Procedia Comput. Sci. 135, 707–711. doi: 10.1016/j.procs.2018.08.215
Qasim, W., Breiling, M., Moon, B. E., Ko, H. J., and Kim, H. T. (2017). Effects of disasters and climate change on livestock sector and its implications on ASEAN food security (South Korea).
Rah, H., Kim, H. W., Nasridinov, A., Cho, W. S., Choi, S., and Yoo, K. H. (2021). Threshold effects of infectious disease outbreaks on livestock prices: cases of African swine fever and avian influenza in South Korea. Appl. Sci. 11:5114. doi: 10.3390/app11115114
Ryu, G. A., Chuluunsaikhan, T., Nasridinov, A., Rah, H., and Yoo, K. H. (2023). Sce-lstm: sparse critical event-driven lstm model with selective memorization for agricultural time-series prediction. Agriculture 13:2044. doi: 10.3390/agriculture13112044
Ryu, G. A., Nasridinov, A., Rah, H., and Yoo, K. H. (2020). Forecasts of the amount purchase pork meat by using structured and unstructured big data. Agriculture 10:21. doi: 10.3390/agriculture10010021
Savitzky, A., and Golay, M. J. (1964). Smoothing and differentiation of data by simplified least squares procedures. Anal. Chem. 36, 1627–1639. doi: 10.1021/ac60214a047
Shang, X., and Tonsor, G. T. (2017). Food safety recall effects across meat products and regions. Food Policy 69, 145–153. doi: 10.1016/j.foodpol.2017.04.002
Shin, H., Kim, M., Jang, H., and Cattle, A. (2012). “Annotation scheme for constructing sentiment corpus in Korean” in Proceedings of the 26th Pacific Asia conference on language, information, and computation, 181–190.
Taylor, M., Klaiber, H. A., and Kuchler, F. (2016). Changes in US consumer response to food safety recalls in the shadow of a BSE scare. Food Policy 62, 56–64. doi: 10.1016/j.foodpol.2016.04.005
Tian, X., and Cramon-Taubadel, S. (2020). Economic consequences of African swine fever. Nat. Food 1, 196–197. doi: 10.1038/s43016-020-0061-6
USDA Foreign Agricultural Service, (2023). South Korea: Korean food and agricultural market conditions under COVID-19 outbreaks. Available online at: https://www.fas.usda.gov/data/south-korea-korean-food-and-agricultural-market-conditions-under-covid-19-outbreaks (Accessed June 12, 2023).
Wang, Y., Yin, F., Liu, J., and Tosato, M. (2020). Automatic construction of domain sentiment lexicon for semantic disambiguation. Multimed. Tools Appl. 79, 22355–22373. doi: 10.1007/s11042-020-09030-1
Ye, K., Piao, Y., Zhao, K., and Cui, X. (2021). A heterogeneous graph enhanced LSTM network for hog price prediction using online discussion. Agriculture 11:359. doi: 10.3390/agriculture11040359
Yin, H., Jin, D., Gu, Y. H., Park, C. J., Han, S. K., and Yoo, S. J. (2020). STL-ATTLSTM: vegetable price forecasting using STL and attention mechanism-based LSTM. Agriculture 10:612. doi: 10.3390/agriculture10120612
Yoo, D. I. (2016). Vegetable price prediction using unstructured web-based data: an application to garlic, onion, and pepper in Korea. Korean J. Agric. Econ. 57, 209–233.
Zhang, D., Zang, G., Li, J., Ma, K., and Liu, H. (2018). Prediction of soybean price in China using QR-RBF neural network model. Comput. Electron. Agric. 154, 10–17. doi: 10.1016/j.compag.2018.08.016
Keywords: livestock price prediction, deep learning, improved TF-IDF, sentiment analysis, attention mechanism LSTM
Citation: Zhu Y, Chuluunsaikhan T, Choi J-H and Nasridinov A (2025) Integrating structured and unstructured data for livestock price forecasting: a sustainability study from South Korea. Front. Sustain. Food Syst. 9:1613616. doi: 10.3389/fsufs.2025.1613616
Edited by:
Rajeev Ranjan Kumar, Indian Council of Agricultural Research (ICAR), IndiaReviewed by:
Mutia Yollanda, Andalas University, IndonesiaRonit Jaiswal, Central Institute of Temperate Horticulture (ICAR), India
Copyright © 2025 Zhu, Chuluunsaikhan, Choi and Nasridinov. This is an open-access article distributed under the terms of the Creative Commons Attribution License (CC BY). The use, distribution or reproduction in other forums is permitted, provided the original author(s) and the copyright owner(s) are credited and that the original publication in this journal is cited, in accordance with accepted academic practice. No use, distribution or reproduction is permitted which does not comply with these terms.
*Correspondence: Jong-Hyeok Choi, amhjaG9pQGFpaWNvbi5rcg==; Aziz Nasridinov, YXppekBjaHVuZ2J1ay5hYy5rcg==
†These authors have contributed equally to this work