 R. A. Brociek
 D. S. Gardner
- School of Veterinary Medicine and Science, University of Nottingham, Nottingham, United Kingdom
Introduction: Pet food production contributes substantially to global environmental pressures, driven largely by animal-derived ingredients. The current study quantified the environmental impacts of 31 commercially available dry dog foods purchased in the United Kingdom, categorised as plant-based, poultry-based, red meat-based (beef and lamb) and veterinary renal diets.
Methods: Environmental metrics including land use (m2/1000 kcal), greenhouse gas emissions (kg CO₂eq/1000 kcal), acidifying emissions (g SO₂eq/1000 kcal), eutrophying emissions (g PO₄3−eq/1000 kcal), and freshwater withdrawal (L/1000 kcal) were estimated using life cycle assessment datasets and adjusted for ingredient composition, energy density and differences in moisture content.
Results: Plant-based diets had the lowest impact across all measures of environmental impact. Poultry-based and veterinary diets were intermediate, while beef- and lamb-based foods had substantially higher impact compared to all other foods. For example, per 1,000 kcal dry food, beef-based diets required an estimated 102.15 m2 land to produce (vs. 2.73 m2 for plant-based) and emitted an estimated 31.47 kg CO₂eq (vs. 2.82 kg for plant-based). Beef-based foods generated 7.1-fold higher acidifying emissions and 16.4 fold higher eutrophying emissions, compared to plant-based foods.
Conclusion: Production of animal-based pet foods has significantly greater environmental impact, when compared to production of plant-based pet foods. Higher inclusion of plant-based ingredients in pet feed provides a major opportunity for pet food companies to mitigate the environmental footprint of companion animal food.
Introduction
Vegetarianism, veganism—encapsulated as following a ‘plant-based’ diet, is increasingly popular among consumers; for reasons of better health, not eating animals and, increasingly, for greater sustainability (Rothgerber, 2013; Ingenpaß et al., 2021). Increased population size has inevitably placed greater demands on the food chain, mitigated somewhat by increased production efficiencies. However, the environmental impact of the need for more food has generated increased greenhouse gas emissions, exacerbated deforestation, land degradation, biodiversity loss, freshwater depletion and increased pollution of soil and water sources (Pimentel and Pimentel, 2003; Reijnders and Soret, 2003; Westhoek et al., 2014; Poore and Nemecek, 2018; Humpenöder et al., 2022; Scarborough et al., 2023).
In 2018, the global canine population was estimated at 471 million (Sivewright and Krueger, 2019). Feeding these omnivores a meat-based diet, even when accounting for the use of ‘by-products’, generates considerable greenhouse gases (GHG). The potential for exchanging meat- for plant-based alternatives, when feeding companion animals, could therefore significantly reduce the environmental impact of pet food (Humpenöder et al., 2022). A number of previous studies have assessed different aspects of the environmental impact of pet foods (Swanson et al., 2013; Okin, 2017; Su and Martens, 2018a; Su and Martens, 2018; Martens et al., 2019; Alexander et al., 2020; Pedrinelli et al., 2022; Knight, 2023; Jarosch et al., 2024; Nicholles and Knight, 2025). The estimated environmental impact of manufacturing dog food in Brazil has been calculated to be 2.9–24.6% of the total carbon dioxide emissions of the country (Pedrinelli et al., 2022). In China, it was estimated that dogs fed commercially-produced pet food accounted for three-fold greater carbon emissions than dogs solely eating leftover, human-grade food (Su et al., 2018). In 2015, the GHG footprint of cats and dogs in China—in terms of food consumption—was estimated to be between 2.5 and 7.8% of the GHG footprint of the total population in China. Globally, estimates suggest that production of pet food, including use of by-products, requires 41–58 million hectares (mHa) of agricultural land, around twice the land area of the United Kingdom (24.9 mHa). Thus, it has been suggested that pet food production generates equivalent GHG emissions as some countries such as Mozambique or the Philippines (Alexander et al., 2020).
Producing red meat for animal protein (e.g., beef and lamb) for human (or pet) consumption, registers, without doubt, the greatest impact on the environment in terms of land area, water use and GHG emissions. Growing plant-based protein generates a fraction of the environmental cost; indeed, even when comparing pea-protein producers with the highest carbon footprint (i.e., 0.8 kg CO2eq/100 g protein) vs. the lowest impact farm for lamb, beef or chicken production (12.0, 9.0 and 2.4 kg CO2eq/100 g protein, respectively), the difference remains stark, particularly when scaled-up globally (Poore and Nemecek, 2018; Ritchie, 2020). Although studies have investigated the reduced environmental impact of people adopting a plant-based dietary pattern, and the reduced impact of plant-based pet food consumption by companion animals, none have directly compared the environmental impact of meat vs. plant-based (vegetarian and vegan) dog food in the United Kingdom. Jarosch et al. (2024) estimated the environmental impact of wet, vegan dog food. However, wet foods are known to have a higher environmental impact than dry foods (Pedrinelli et al., 2022; Jarosch et al., 2024) and 50–70% of UK pet owners choose to feed dry kibble (Morelli et al., 2021; Pet Food Industry, 2023), either on its own or mixed with wet food. Previous studies evaluating the impact of pet food manufacturing in Japan (Su and Martens, 2018b) and China (Su et al., 2018) are not directly applicable to the United Kingdom given our variations in pet preferences and population, as well as access to different ingredients.
In the current study, using validated methods to estimate the environmental footprint of pet food production, we calculate the environmental impact of feeding plant-based vs. other commonly fed animal-based diets in the United Kingdom (meat—beef, lamb, poultry; veterinary diets—semi-synthetic animal-based ingredients).
Methods
The environmental impact of 31 adult dog foods commercially available in the United Kingdom, were calculated with regards to land use (m2/1000kcal), carbon dioxide equivalent (CO2eq(kg)/1,000 kcal), acidifying emissions (SO2eq(g)/1,000 kcal), eutrophying emissions (PO43−eq(g)/1,000 kcal) and freshwater withdrawal (L/1000 kcal). These were calculated using previously published values (Poore and Nemecek, 2018).
Selection of dog food
31 complete dry dog food samples were acquired from supermarkets in the United Kingdom. Food was representative of 27 different brands. Any foods not labelled as ‘complete’ and for ‘adults’ were excluded. Veterinary diets were only chosen if they specifically claimed renal benefits. Purchased products were grouped according to their main protein source, as listed on their labels, as: “meat-based”—poultry (n = 7), lamb (n = 6) and beef (n = 6); “plant-based”—including vegan (n = 4) and vegetarian (n = 2) foods. In addition, n = 6 veterinary diets, specifically formulated for animals with renal problems were tested. Veterinary diets have a guaranteed analysis of composition on the label, are usually semi-synthetic with no specific main flavour, but are fed regularly in the United Kingdom and thus were included as a discrete category. Pork, rabbit and other meats were not included in the study as available products were limited. Results represent only single batch analysis.
Pet food composition and ingredient weightings
Across 31 foods, all 298 ingredients were reviewed, encompassing up to 33 individual ingredients. Most individual foods (27/31, 87%) included between 6 and 20 ingredients. All ingredient terms used were pre-defined (Pedrinelli et al., 2022). In summary, “meats” are considered “raw meat” unless specified on packaging and “meat meals” were considered cooked. “Animal protein hydrolysate” is reported as “chicken protein hydrolysate.” Vegetable percentages are provided by fresh weight where possible. “Animal fat” (where the animal is not specified) and “poultry gravy” have been reported as “poultry fat.” “Dehydrated poultry protein” has been reported as “poultry by-product meal.” Where “oils & fats” are listed, this is reported as “sunflower oil, unspecified.” “Salmon oil” and “fish oil” are both reported as “fish oil.” Rye and spelt are reported as “whole wheat.” Maize gluten has been reported as “corn gluten meal.” “Wheat” has been reported as “wheat gluten.” All varieties of wheat have the same impact values. Unless listed in the ingredients as “brown rice,” rice has been reported as “white rice, cooked.” Pasta is reported as “spaghetti.” All “potato protein” is reported as “potato starch.” Potato starch and cooked potato have the same impact values. Where label ingredients did not have an equivalent ingredient with pre-calculated impact value, these were excluded from the estimation. Excluded ingredients include, but were not limited to, glycerol, minerals, lupine, alfalfa, algae, botanicals, vegetable stock and chicory. In 30/31 foods, the first 4 ingredients, which is often the majority of the food composition, were always included in the estimation. One food listed “glycerol” as the third ingredient. Where “animal by-product” (ABP) is referred to, this includes, but is not limited to; hides, skins, hydrolysed protein, rendered fat, digest, milk by-products, eggs, fish products and bones (Gov.uk, 2019).
Previously, ingredient weightings were based on the first five ingredients, each given a 20% weighting, or a 1.5 ratio in descending order of ingredient inclusion (e.g., 38.4% for the first ingredient, 25.6% for the second, 17.1% for the third; Okin, 2017; Alexander et al., 2020). In the present study, a modified ratio, based on the dietary group being analysed, provided a more accurate representation: ingredient percentages were taken from package ingredient lists, assuming a descending order of percentage incorporation (see Supplementary material). When proportions were undefined, an average percentage for the dietary group (e.g., meat-based, plant-based, or veterinary) was applied based on the ingredient’s position in the list (e.g., fifth ingredient). In cases where ingredients were listed as a single percentage (e.g., “dried chicken and turkey 30%”), a 50:50 ratio was used (15% dried chicken, 15% dried turkey). Using this method, the total ingredient composition ranged from 39.29 to 120%, before being adjusted to 100% to ensure an equitable comparison between all foods.
Environmental impact assessment
Life cycle assessments (LCA) are the current standard for assessing environmental impact, with many studies using some variation (Van Zanten, 2016; Yavor et al., 2020; Jarosch et al., 2024). Estimations of five environmental impact scores (per 1,000 kcal metabolisable energy [ME]) were calculated for all pet foods, including (1) land use (m2) as shown below in Equation 1, (2) carbon dioxide equivalent (CO2eq), (3) acidifying sulphur dioxide (SO2), (4) eutrophying phosphate (PO43−) emissions and (5) freshwater withdrawal (L), with the only difference for additional calculations being the appropriate impact value (Pedrinelli et al., 2022) in place of “ingredient land use impact value” (Equation 1).
Impact values represent a methodologically harmonised dataset of life cycle assessments (LCA) from 570 suitable studies: representing ~38,700 farms in 199 countries and producing ~90% of the global protein and calories (Pedrinelli et al., 2022). Over 1,000 post-farm processes were included in the production of these impact values, including processing, packaging, retail, transport and losses, up the point of consumer choice.
Moisture content of dry foods is usually 5–8%, and in our experience of direct measurement is usually 4–6%. In this study, in order to provide estimates of GHG emissions per 1,000 kcal ME, with energy density estimated using Atwater criteria for all proximates on the label, then final values for environmental impact were determined considering ingredient percentage composition and the food moisture content. As an example, for each ingredient:
where moisture adjustment factor (B) = 100/(100-A) [moisture % (A) was taken from label] and percentage of ingredient in formulation (C) was also taken from label. The sum of all ingredients in a food (up to 22) were calculated, they were summated to create a total for that food. Finally, a factor was applied to standardise all foods to a theoretical 100% inclusion rate (e.g., if individual ingredient percentages in a single food only totalled 94.5%, a factor of 1.058% (100/94.5) would be applied to each ingredient to achieve 100% and allow for comparison between different foods in our analysis).
Taking the above calculations into account then environmental impact values were as follows, e.g., for Land use (Equation 1):
Estimation of land use requirement for production of an individual pet food
where L.impval (land impact value), expressed in m2/1000 kcal, was previously calculated (Pedrinelli et al., 2022), %comp is the moisture-adjusted percent composition of individual ingredient in each food. The impact of all individual ingredients was summated, adjusted to 100% as described above. Similar equations were used to calculate carbon dioxide equivalent (Equation 2, kg CO2eq/1000 kcal in Supplementary material), acidifying emissions (Equation 3, g/1000 kcal SO2eq in Supplementary material), eutrophying emissions (Equation 4, g/1000 kcal PO43−eq in Supplementary material) and freshwater withdrawal (Equation 5, L/1000 kcal in Supplementary material).
Statistical analysis
Data were analysed using analysis of variance (ANOVA) for the fixed effect of the three diet-types (meat-based or plant-based, veterinary). To meet assumptions for analysis by ANOVA, all data were checked for a normal distribution of residuals and respective Q-Q plots. If necessary, non-normally distributed data were log-transformed (log10) prior to analysis by ANOVA or a suitable non-parametric, distribution independent test was used (e.g., Kruskall-Wallis NP-ANOVA). All such data were analysed using GenStat v22 (VSNi Ltd., Rothamsted, United Kingdom) and graphically represented using GraphPad Prism v10.3.0 (GraphPad Software Inc., California, United States).
Results
Land use (m2/1000 kcal), carbon dioxide equivalent (kg CO2eq/1000 kcal), acidifying emissions (g/1000 kcal SO2eq), eutrophying emissions (g/1000 kcal PO43−eq) and freshwater withdrawal (L/1000 kcal) were calculated for each ingredient of every food, individually (Table 1). These values were adjusted for the relative percentage of the food that the ingredient takes up, using listed and theoretical proportions (see Materials and Methods for further details). Data for each food were then calculated per 1,000 kcal fed to account for small differences in moisture content and energy density between foods. Overall, plant-based foods had the lowest environmental impact scores for each estimated parameter; beef and/or lamb always had the highest (Figures 1a–e). Veterinary foods, being semi-synthetic, were consistently intermediate between these two product types.
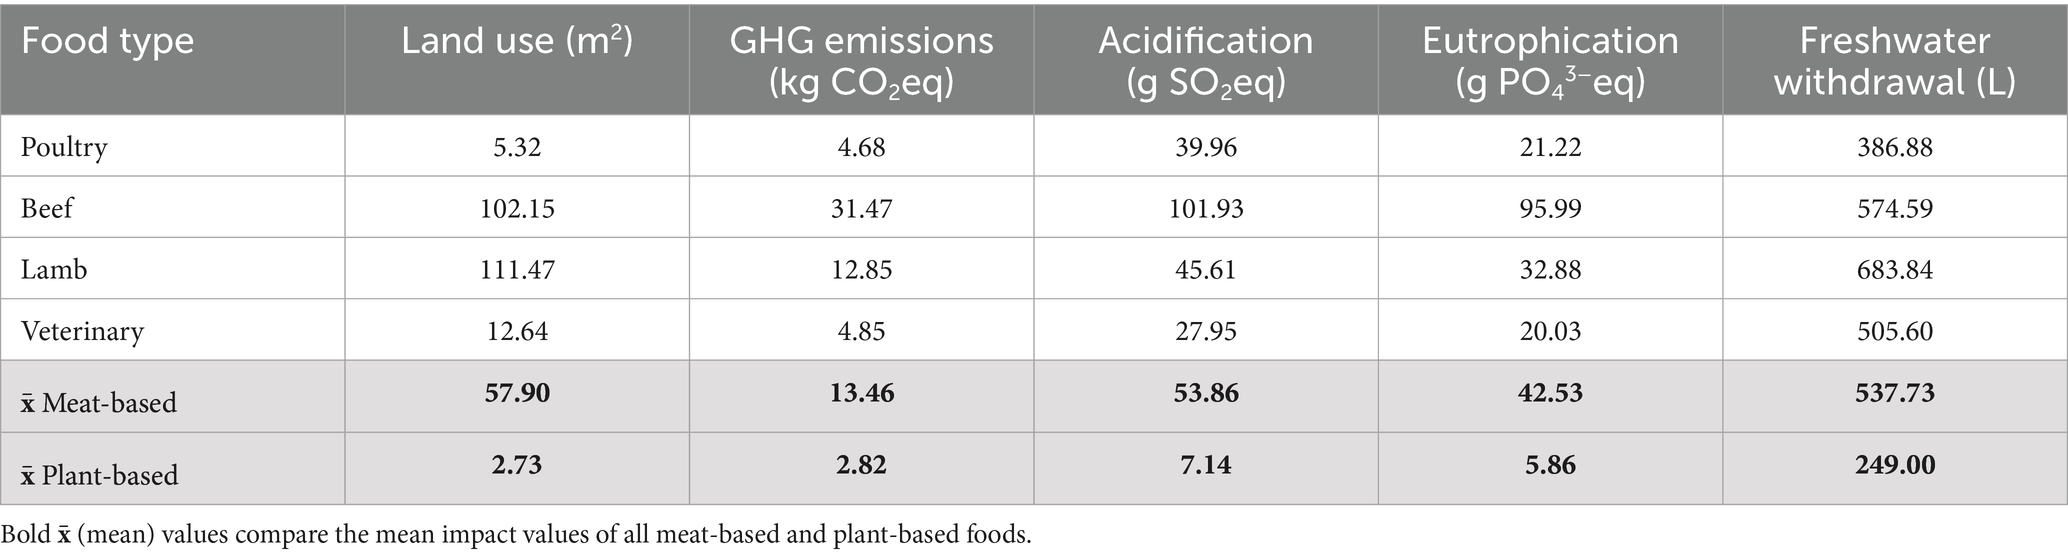
Table 1. Estimated average land use, GHG emissions, terrestrial acidification, eutrophication and freshwater withdrawal of dry kibble dog foods per 1,000 kcal as fed.
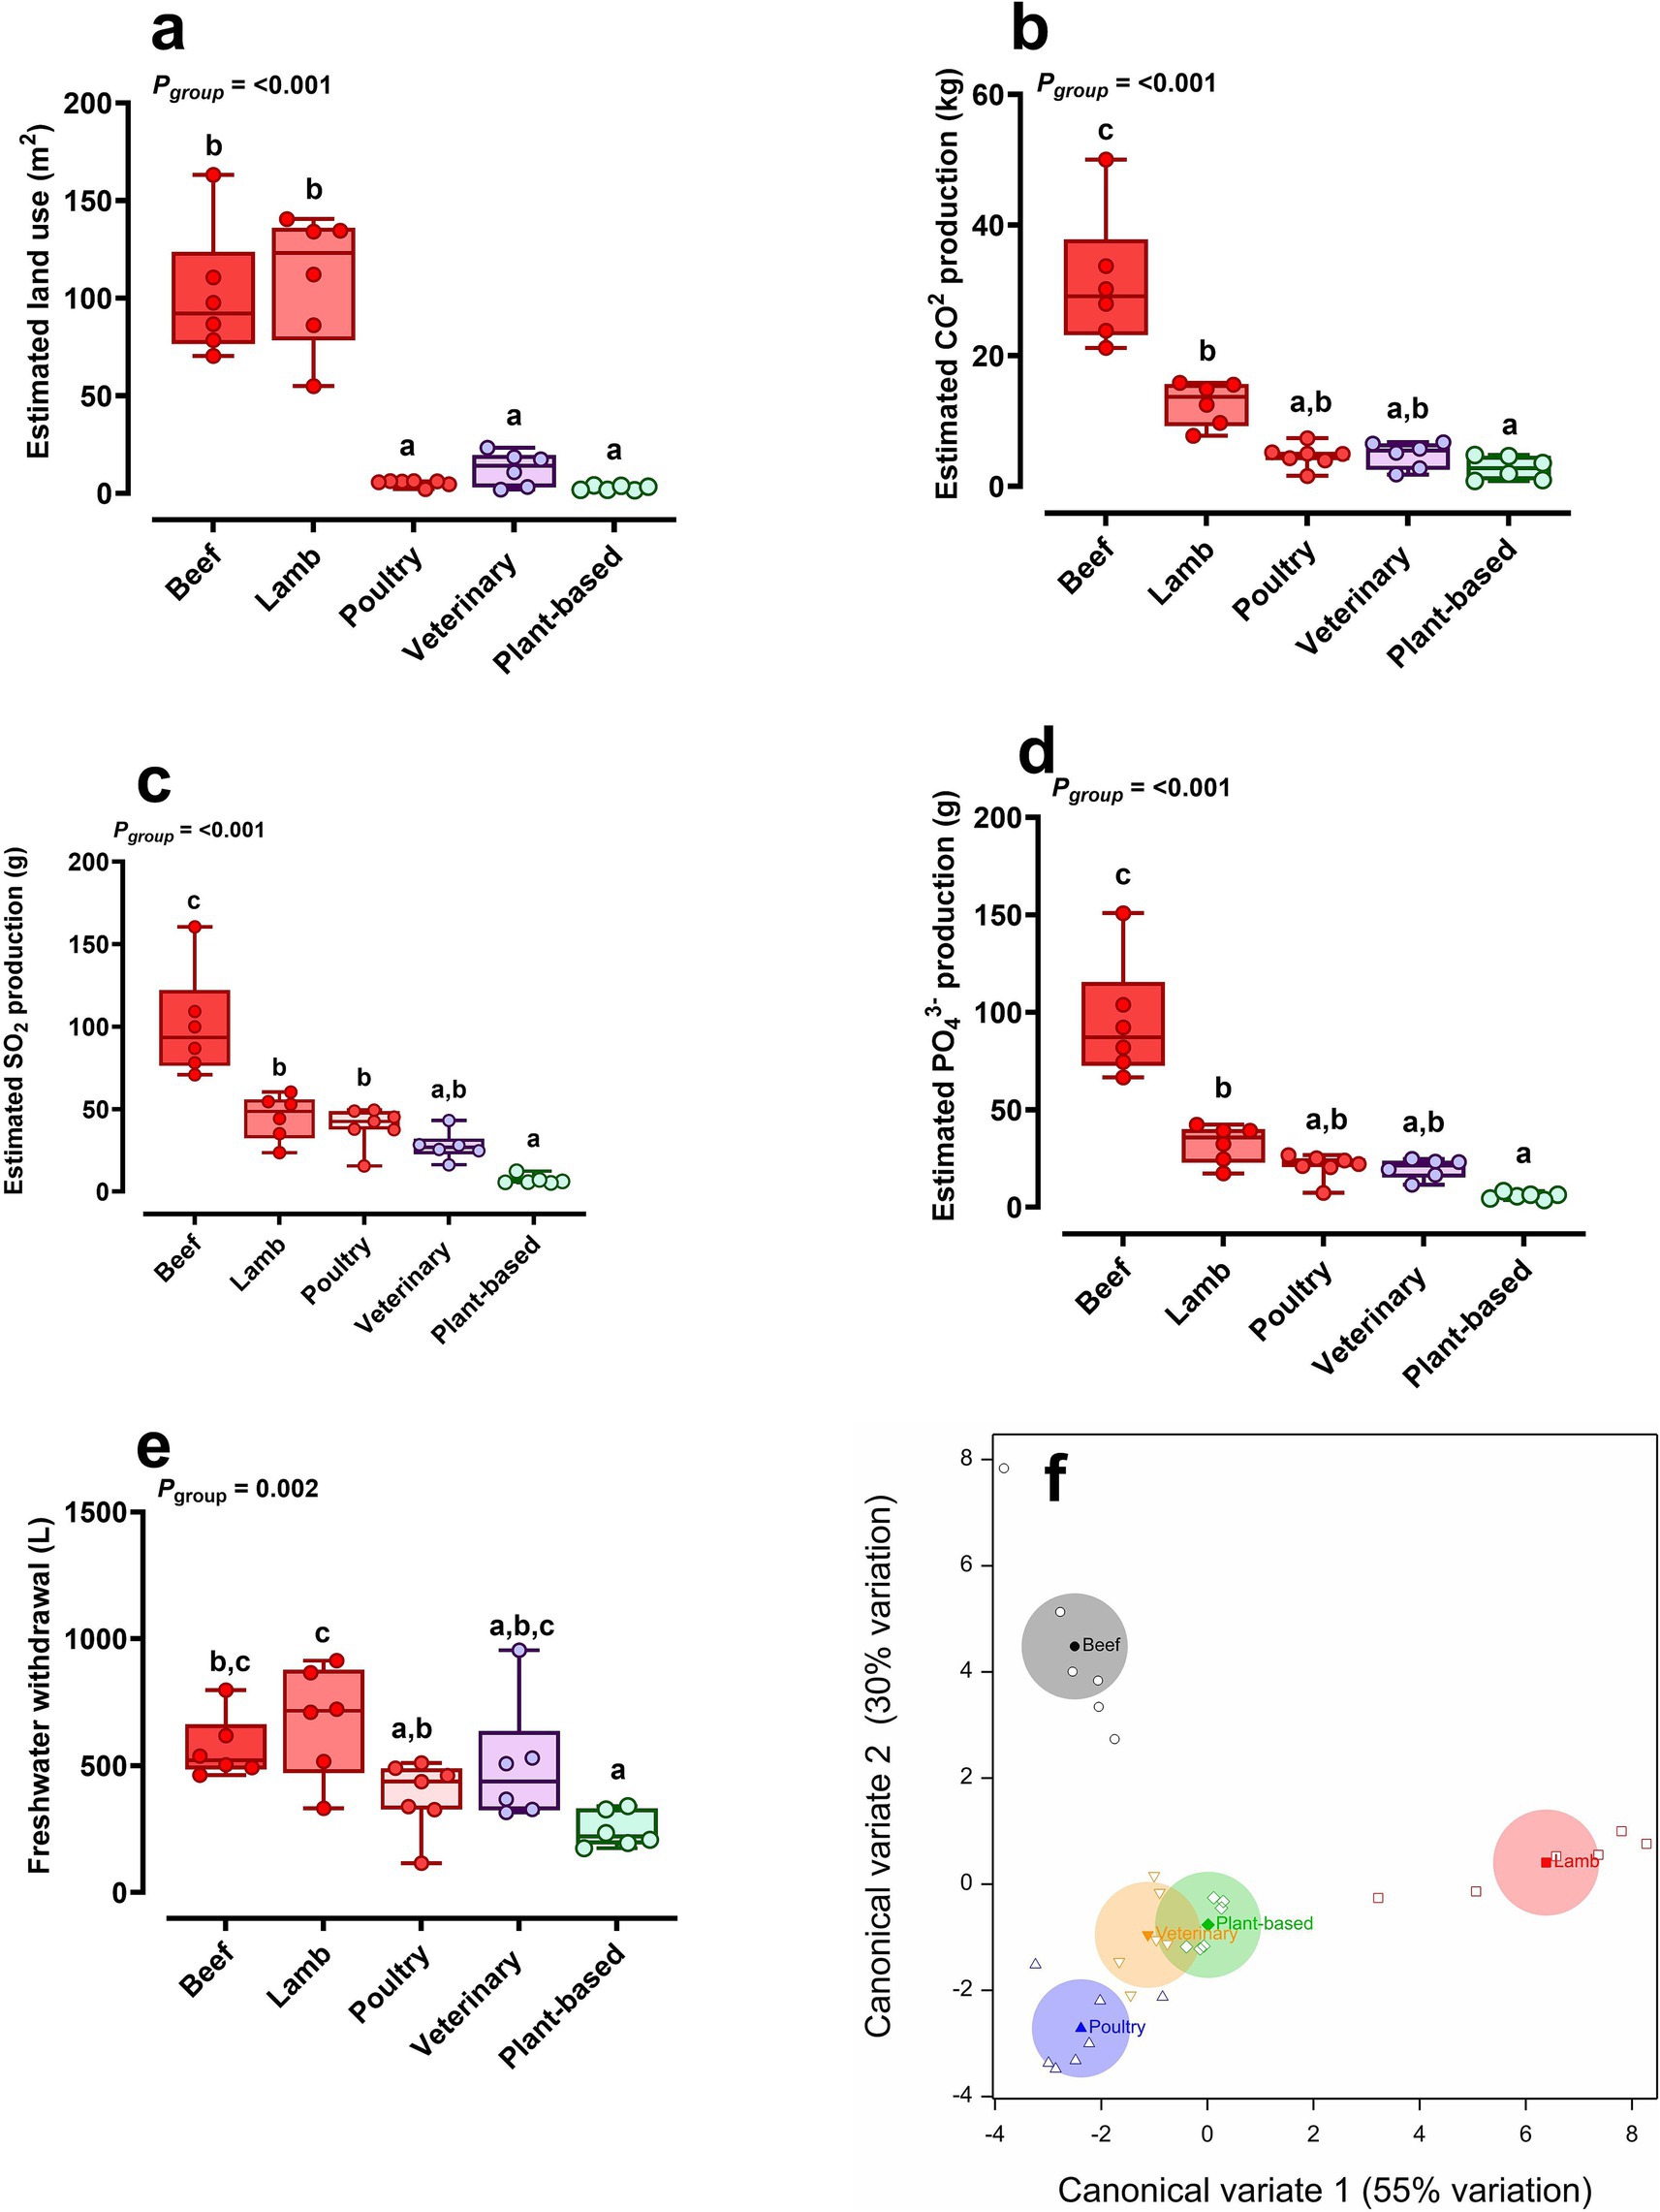
Figure 1. Estimated environmental impact of dry feeds for dogs according to feed type. (a–e) Individual data points and box-plots (line at median, box = first to third interquartile range, whiskers = min, max range) for estimates of environmental impact. Equations used to derive values for each feed are as described in Methods (Equation 1; land-use) or in Supplementary Equations 2–5. Type of meat used to produce ‘meat-based’ food presented for clarity. Veterinary diets were ‘renal’ and semi-synthetic; (f) multivariate analysis (canonical discriminant plot) with all feeds (n = 31) and all estimated environmental impact data (as standardised z-scores due to the marked differences in numbers) represented. Statistical differences: Pgroup = overall effect as analysed by ANOVA (df, 4); boxplots not sharing a superscript are statistically different at p < 0.05, as analysed by post-hoc testing (Tukeys t-test).
Food composition
From the labels, the average content of proximates (protein, fat and fibre) of meat- and plant-based foods were similar (meat: 23.50, 12.78 and 2.9% vs. plant: 24.63, 10.45, and 4.00%, respectively). Veterinary foods had lower protein (by design) with higher fat inclusion (13.82, 17.28, and 2.4%, respectively). Across all foods, 60 different ingredients (after removal of ingredients without suitable impact values to apply) were assessed across the 31 foods. Almost one third of ingredients were animal-derived (19/60, 32%). When comparing the top 5 ingredients of all foods, the most common ingredients were corn gluten (present in 19/31 foods), white rice (12/31), poultry fat (10/31), sunflower oil (7/31), wheat gluten (6/31) and brown rice, raw chicken meat, meat and bone meal, pea, potato and textured vegetable protein (all 5/31). When taking the full formulation into account (up to 21 ingredients), the top ingredients were very similar; corn gluten meal (22/31), poultry fat (17/31), white rice (14/31), sunflower oil (15/31), flaxseed and brewer’s yeast (both 12/31) and pea (10/31).
Across the 25 meat-based foods there were 54 different ingredients, 19 of which were animal-derived. The four most common ingredients were poultry fat (18/25), corn gluten meal (17/25), beet pulp and white rice (both 12/25). The 6 plant-based foods contained 26 different ingredients, with one having an animal-derived ingredient—egg powder. The four most common ingredients were sunflower oil and brewer’s yeast (both 6/6), corn gluten meal and pea (both 5/6).
Land use
The average land use required to produce lamb and beef dog foods were similar but was significantly greater than the land use required to produce poultry, veterinary and plant-based foods (p = <0.001; Figure 1a). In this study, the average estimated land use required to manufacture each dry dog food was 111.47m2/1000 kcal (range: 55.46–141.88) for lamb, 102.15m2/1000 kcal (range: 71.03–164.73) for beef, 5.32m2/1000 kcal (range: 2.15–6.33) for poultry and 2.73m2/1000 kcal (range: 1.52–4.04) for plant-based. Veterinary diets required 12.64m2/1000 kcal (range: 1.90–23.60), which was not different to poultry and plant-based foods. Individual ingredients in the pet food recording greatest land use included lamb meal (92.88m2/1000 kcal), meat and bone meal of unknown species (47.18m2/1000 kcal) and beef liver (25.43m2/1000 kcal; Figure 2). Individual ingredients recording greatest land use in plant-based foods were primarily soy, such as soy protein concentrate (1.67m2/1000 kcal) and cooked soy (1.87m2/1000 kcal).
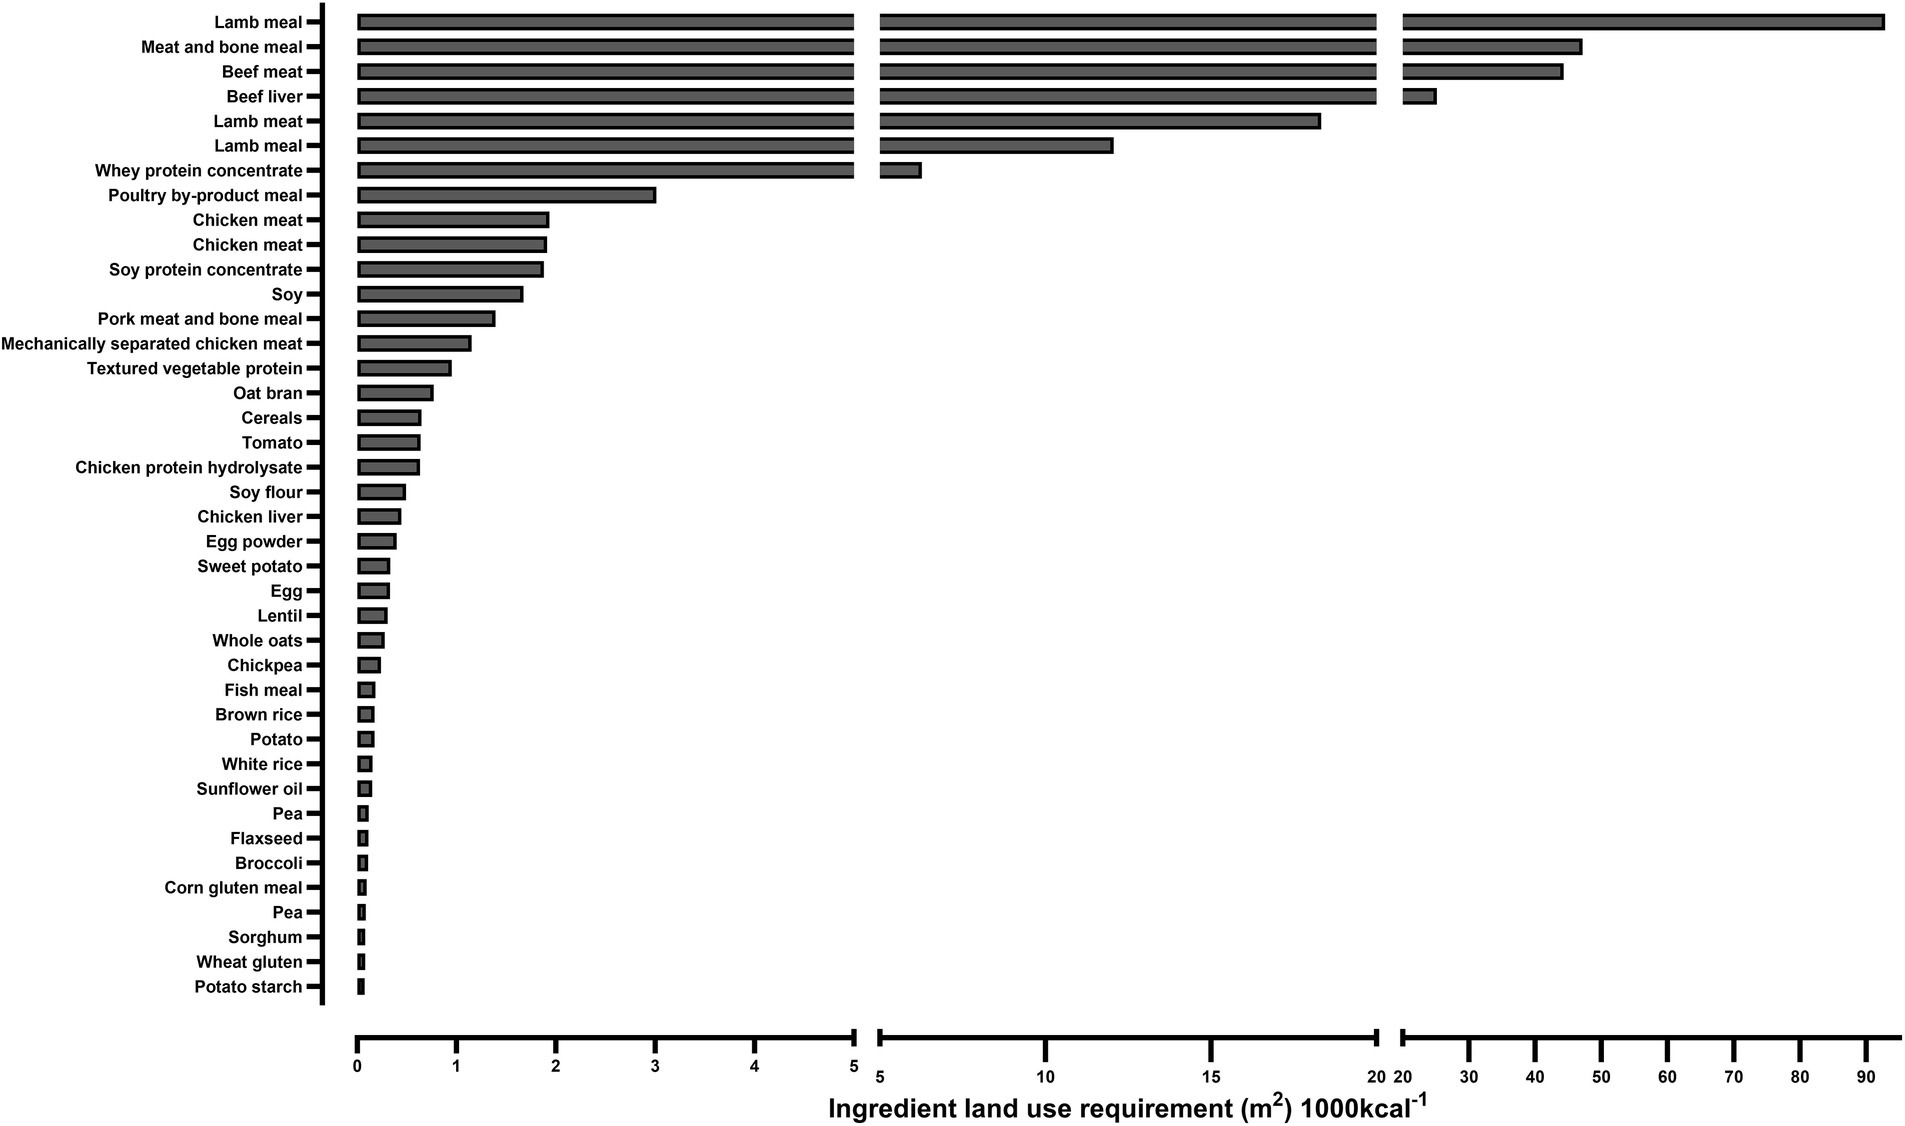
Figure 2. Average land use requirement (m2 1000 kcal-1 of dry food) of top 40 ingredients used in the current study. Estimate of land use requirement for ingredients used in the current analysis of dry dog foods in the UK. Equation 1, (see Methods) used to derive values for land use, standardised to 1,000 kcal as fed, to account for differences in energy density, and thus amount fed, to individual animals.
Carbon dioxide equivalent (CO2eq) emissions
In agricultural production, greenhouse gases include carbon dioxide, methane and nitrous oxide. To comprehensively capture all GHG emissions from dog food production, emissions were expressed as carbon dioxide equivalents (CO2eq) in kg CO2eq/1000 kcal of food. Plant-based foods had the lowest GHG emissions (2.82 kg CO2eq/1000 kcal) which were similar to poultry (4.68 kg CO2eq/1000 kcal) and veterinary foods (4.85 kg CO2eq/1000 kcal; Figure 1b). In contrast, beef (31.47 kg CO2eq/1000 kcal) was significantly higher than all other foods, including lamb (12.85 kg CO2eq/1000 kcal) which was also significantly higher than plant-based foods.
Ingredients with highest CO2eq impact values for meat-based foods included meat and bone meal (99.78 CO2eq/1000 kcal), raw beef liver (99.69 CO2eq/1000 kcal), beef liver (49.120 CO2eq/1000 kcal), lamb meal (37.35 CO2eq/1000 kcal) and whey protein concentrate (28.16 CO2eq/1000 kcal). The highest impact values in plant-based ingredients were pea-unspecified (13.31 CO2eq/1000 kcal), pea-cooked (12.72 CO2eq/1000 kcal), tomato-raw (5.62 CO2eq/1000 kcal) and wheat gluten (1.40 CO2eq/1000 kcal).
Eutrophying and acidifying emissions
Eutrophying emissions (PO43−eq) are a measure of the pollution of soil and waterways from nutrient-rich runoff, particularly inorganic phosphorus (used as a fertiliser) and nitrogen dioxide (Ritchie et al., 2022). Acidifying emissions (SO2eq) groups sulphur dioxide (SO2), nitrogen oxides (NOx) and nitrates from fertilisers and other stages of the manufacturing process (waste water, animal feedlots etc.), which react with water and oxygen to form acidifying compounds such as sulphuric and nitric acids in the atmosphere, before falling as acid rain (Reijnders and Soret, 2003; US Environmental Protection Agency, 2024).
For both metrics, plant-based food produced the lowest emissions, and beef the greatest (Figures 1c,d). Estimated eutrophying (PO43−eq) and acidifying (SO2eq) values were similar between lamb, poultry and veterinary foods, but, as for beef, lamb recorded significantly greater emissions than plant-based foods (p = <0.0001). Indeed, acidifying values for beef were 2.2, 2.6, 3.5 and 14.3 times that of lamb, poultry, veterinary and plant-based foods, respectively; eutrophying emissions were 2.9, 4.5, 4.8 and 16.4 times higher.
Freshwater withdrawal
Total freshwater calculations refer to the freshwater used in agriculture and in industries connected to the life cycle of pet food manufacture. These include water used for irrigation, livestock production and for direct industrial use (including withdrawals for cooling thermoelectric plants; World Bank Group, 2025). Lamb-based diets recorded the highest average freshwater withdrawal (683.84 L/1000 kcal), followed by beef (574.59 L/1000 kcal), veterinary foods (505.60 L/1000 kcal; Figure 1e), poultry (386.88 L/1000 kcal) and finally plant-based foods (249.00 L/1000 kcal). Hence, plant-based food had significantly lower freshwater withdrawal than lamb or beef (p = <0.0001).
Finally, with all estimates combined in an unbiased, multivariate analysis, grouped only by food type, then lamb and beef-based foods significantly distinguished themselves from all other product types (Figure 1f). The first principal component, driving difference in lamb-based foods corresponded to the combination of land use, freshwater withdrawal and CO2eq production (contributing significantly to PC1). The second principal component, driving difference in beef-based foods was constructed by a combination of CO2eq + SO2eq + PO43−eq emissions (Figure 1f). Of interest, veterinary, plant-based and poultry foods had similar overall environmental impact (broadly overlapping 95% confidence intervals of centred-data, Figure 1f).
Discussion
This study is the first to comprehensively compare the environmental impact of commercially available meat-based and plant-based dry dog foods available on the UK market. Our findings broadly align with global literature, confirming that plant-based diets are consistently the lowest-impact choice across metrics of land use, greenhouse gas emissions, eutrophication, acidification, and water use (Pedrinelli et al., 2022; Knight, 2023). In contrast, diets containing lamb or beef generated the highest environmental burden, followed by veterinary and poultry-based foods. These differences have substantial implications when scaled to the lifetime of a single dog, as well as across the broader UK pet population, or indeed the entire planet.
A dog is considered adult for approximately 7–11 years (dependent on breed), preceded by the growth and development (puppy) stage and followed by the senior stage, with some also going through pregnancy and lactation. Foods specific for each life stage provide dogs with nutrition appropriate to their body’s needs at that point in life. In this study, the authors only evaluated adult dog food, and so estimations can only be extrapolated for this life stage. The environmental impact of diet varies depending on ingredient composition, with substantial differences between meat-based and plant-based formulations.
A 20 kg Labrador Retriever, the most popular dog in the United Kingdom currently, with low to moderate exercise, requires approximately 280 g of food (1,008 kcal) per day. Over 9 years, this amounts to approximately 919.8 kg of food (280 g/day × 365 days × 9 years). Conventional diets show a fold-increase in impacts across key environmental metrics when compared to plant-based alternatives (Figure 3). Over the 9 adult years, exclusively feeding a 20 kg Labrador Retriever plant-based, veterinary, poultry, beef, or lamb food would require 8,964 m2 (about 1.4 football fields; each field is approximately 100 m x 64 m), 17,453 m2 (around 2.7 football fields), 41,476 m2 (approximately 6.5 football fields), 334,851 m2 (roughly 52 football fields), and 365,409 m2 (close to 57 football fields) of land, respectively. These results are largely supported by those currently in the literature (Vale and Vale, 2009; Martens et al., 2019).
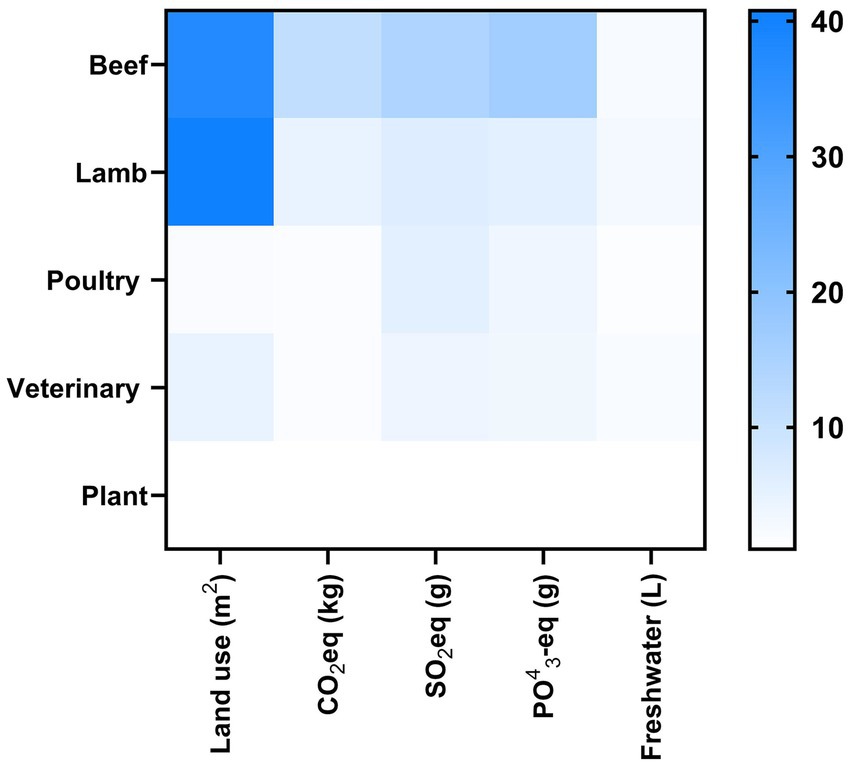
Figure 3. Heat map of fold-increase (relative to feeding plant-based – set at 1.0), estimated impact value for all categories of foods fed over a nine-year period (average length of time an adult diet is fed), compared to feeding plant-based.
Correspondingly, the greenhouse gas emissions (kg CO2eq) produced by the plantbased, veterinary, poultry, lamb, or beef foods over this period would be equivalent to 2.8, 4.65, 4.8, 12.8, and 31.3 round trips between London and New York, per passenger, on a Boeing 747. These values are similar to results previously described (Yavor et al., 2020). Impacts also vary significantly depending on the size of the dog, and its energy needs (Satriajaya, 2017). Vale and Vale (2009) estimated that feeding a 15 kg dog 300 g/day of meat-based food requires 0.27 ha/year, whereas a Chihuahua would require 0.09 ha/year, a Scottish Terrier 0.18 ha/year, and a large Alsatian 0.36 ha/year. Scaling this across millions of dogs adds considerable pressure to land systems already under stress from both human and livestock food production.
Land use
Land use emerged as one of the most contrasting indicators of environmental impact among different dog food formulations. Our study’s land use estimates incorporated several refinements to increase accuracy, including multicropping (up to four harvests per year), periods of fallow (uncultivated land between crops), and economic allocation of co-products such as straw (Poore and Nemecek, 2018). These adjustments reflect real-world farming systems more accurately than older models, but they still highlight the large disparity in land demand between animal-based and plant-based dog food.
In this study, plant-based diets required an average of just 2.73 m2 per 1,000 kcal, compared with over 100 m2 for beef and lamb-based diets. With soy and soybean concentrate having the highest plant-based impacts, the current study does support claims of soy products having a high land impact, with the soy crop production utilising over 280 million acres used globally in 2013–2014, an area equivalent to France, Germany, and the UK combined (WWF, 2015). However, plant-based foods and direct consumption contribute minimally to this, as more than 75% of soy is allocated to livestock feed rather than direct human or pet consumption (Fraanje and Garnett, 2020). In addition, meat protein production has been shown to have 6–17 times higher land requirement than soybean production (Reijnders and Soret, 2003). By contrast, chicken, while often viewed as a lower-impact protein, also relies heavily on soy and maize for fast growth, both of which compete with the human food system (Wilkinson, 2011).
Greenhouse gas emissions
Beef and lamb-based diets led to dramatically higher CO2-equivalent emissions than poultry, plant or veterinary formulations. These results mirror broader findings that 80% of agricultural GHG emissions arise from soil changes linked to deforestation, fertiliser use, and methane from ruminants (Pedrinelli et al., 2022). Although plant-based ingredients such as soy have drawn criticism for land use, their total emissions remain substantially lower per unit of protein. Knight (2023) emphasises that switching pet dogs within a home environment to vegan diets could reduce total global GHG outputs by 5.8%. Indeed, many dogs around the world fed dry, kibbled animal-based diets are community-owned or housed in animal shelters and thus this figure of ~6% is likely a gross underestimate.
Acidifying and eutrophying emissions
Environmental degradation via nutrient pollution is another critical consequence of animal agriculture. Phosphates, commonly used as a key ingredient in pet food formulations to promote bone and dental health, are often sourced from phosphate rock during the manufacturing process which can lead to increases of excess phosphates into nearby water systems (Reijnders and Soret, 2003). They are also present in fertilisers, which are applied liberally to increase crop yield.
This study found plant-based diets yielded 7–16 times lower phosphate and sulphur-based emissions than beef or lamb diets. These emissions contribute to acid rain and aquatic eutrophication, with long-term impacts on biodiversity (Chislock et al., 2013). During the agricultural process, phosphate ions (PO43−) are released into the environment, depleting soil richness and causing an overabundance of algae and plant growth (Scarborough et al., 2023), leading to the decomposition of plants, release of CO2, and subsequent water pH reduction and ocean acidification (National Oceanic and Atmospheric Association, 2024). Food production is the single largest contributor to global ocean and freshwater eutrophication, around 78 and 95%, respectively, of which most is captured at the farm stage (Poore and Nemecek, 2018). Similarly, Anthropocene activity contributes significantly to acidification of soil and water sources. This interferes with terrestrial and aquatic ecosystems by damaging plant life, degrading soil quality, and acidifying large bodies of water (European Environmental Agency, 2020). Jarosch et al. (2024) previously reported that wet vegan foods still outperformed meat-based diets in eutrophication, though dry diets remain more sustainable overall.
Freshwater withdrawal
Water stress continues to increase in countries around the world, with 70% or more of global freshwater being used for agriculture (Knight, 2023; Fujs and Kawshiwase, 2023). Beef and lamb required the most water per 1,000 kcal, with plant-based diets using the least. Mekonnen and Hoekstra (2011) previously found that water for crop production dwarfs all other uses, with wheat and maize among the most water-intensive crops. The global water footprint of crop production in the period 1996–2005 was 7,404 Gm3 yr.−1, with wheat making up 15% of this. Other crops with a large total water footprint are rice (992 Gm3 yr.−1) and maize (770 Gm3 yr.−1). However, while livestock drink little water directly, feed crop irrigation accounts for most of the sector’s water use (Pimentel and Pimentel, 2003). They estimate the production of forage and grain was estimated to use 100,000 L of water to produce 1 kg of fresh beef.
But what about by-products?
Traditionally, dogs were fed table scraps, which had a lower impact on the environment (Su et al., 2018). However, the rise in popularity of “premium” dog foods, which increasingly incorporates parts of the animal fit for human consumption, has created feed-food competition (Okin, 2017). Many of the meat-based protein sources analysed in this study were derived from meat meals rather than fresh meat, most of which are classified as animal by-products (ABPs), likely sourced as offcuts from the human food chain. These by-products are often considered a more sustainable option than prime meat cuts (Pingali et al., 2023), and there are claims that they help reduce waste, making use of parts that might otherwise be discarded (Alexander et al., 2020). However, recent evidence suggests that the environmental benefits of by-products used in dog food may be overstated. Knight (2023) reported that by-products not fit for human consumption require 1.35 times more livestock animals per unit of usable protein, compared to lean meat. Rushforth and Moreau (2013) similarly found that using offal in pet food may be less efficient than using muscle meat, due to lower digestibility and nutrient density.
In our analysis, meat and bone meal, a common by-product, was among the highest-impact ingredients, with land use values of 327.70m2, and CO₂-equivalent emissions of 99.78 kg per 1,000 kcal as methane and nitrous oxide from livestock, along with emissions from rendering processes, continue to contribute to their footprint. Likewise, although water use for rendering is relatively low, most of the water demand arises upstream from feed crop cultivation and animal husbandry, placing ABP diets above plant-based ones in terms of freshwater use. Moreover, some by-products used in pet food could otherwise be repurposed for human or industrial applications (Martens et al., 2019), further complicating sustainability claims. The concept of using “waste” ingredients in pet food must therefore be critically assessed against the full lifecycle and opportunity cost of those inputs in other industries.
Is a circular food system the answer?
Globally, 45% of the world’s habitable land is dedicated to agriculture, and of that, 70–85% is used to support livestock production (Van Zanten, 2018; Knight, 2023). This includes not only grazing grasslands, but considerable areas of cropland used to grow livestock feed. With a growing global population comes an increasing food demand, and the concept of a more circular food system is gaining traction (Van Selm, 2022), as well as emphasising the complementary roles of plants and livestock in sustainable food production (Godfray et al., 2010; Van Kernebeek, 2016; Van Zanten et al., 2019). Van Zanten (2018) found that compared to excluding ABPs, a system where livestock consume biomass unsuited for direct human consumption could free up to one quarter of global arable land. This could also provide around 9–23 g of daily protein needs, per capita, although animal consumption above this level would require human-edible crops to be redirected to livestock. Schader et al. (2015) supported this and demonstrated that feeding animals primarily on grasslands and food production by-products, rather than human edible concentrates, could decrease land use by 26% and cut GHG emissions by 18%.
While trade-offs remain, integrating these principles into pet food production aligns with broader efforts to enhance sustainability without increasing competition with human food supplies. In one study, using and marketing a pet food as “upcycled” enhanced its image, especially in budget-friendly markets (Ye et al., 2022). However, even though pet owners saw upcycled food as sustainable, this did not influence their buying behaviour as much as the perceived quality of the food. In addition to other available studies reviewing the topic, despite public hesitancy towards moving to plant-based dog food, the current authors have previously shown that they can indeed be as nutritionally complete as meat-based foods (Brociek et al., 2025).
Study limitations
The impact values used in this study are at the point of retail (Pedrinelli et al., 2022) and so only account for the production, manufacturing and distribution of the food. Therefore, additional environmental impacts of waste (food waste, animal waste and packaging end of life), previously explored (Swanson et al., 2013; Yavor et al., 2020), have not been accounted for. Modelling the environmental impacts of ingredients is limited by data availability, requiring assumptions for certain components. In some cases, our database lacked specific impact values, necessitating estimations based on analogous ingredients, which may not precisely represent current production methods. Additionally, as noted by Jarosch et al. (2024), assumed values may not scale linearly with global warming potential, introducing further uncertainty. While extreme miscalculations are unlikely, these limitations highlight the need for improved ingredient-specific data to enhance model reliability.
Conclusion
This study re-affirms the suggestion from previous analyses conducted in other countries—in the United Kingdom, feeding your dog plant-based will significantly improve a households’ environmentally sustainability, vs. feeding traditional meat-based diets. It should be noted that bioavailability and bioaccessibility of foods was outside the scope of this study and as such the authors cannot recommend any food other than on the basis of planetary benefit. Using animal by-products in such estimations of GHG emissions, does not reduce the gap in environmental sustainability between meat- and plant-based foods. Although poultry and veterinary foods had relatively lower impact than those with beef or lamb as the main ingredient, they remain substantially less sustainable than plant-based alternatives. With rising global food demand and growing pet ownership, shifting towards lower-impact pet food ingredients will be essential in reducing the sector’s ecological paw print.
Data availability statement
The raw data supporting the conclusions of this article will be made available by the authors, without undue reservation http://doi.org/10.17639/nott.7569.
Author contributions
RB: Conceptualization, Data curation, Formal analysis, Investigation, Methodology, Validation, Visualization, Writing – original draft, Writing – review & editing. DG: Conceptualization, Data curation, Formal analysis, Funding acquisition, Methodology, Project administration, Supervision, Validation, Writing – original draft, Writing – review & editing.
Funding
The author(s) declare that financial support was received for the research and/or publication of this article. This study was funded by the Biotechnology and Biological Sciences Research Council (BBSRC) as part of the University of Nottingham DTP PhD studentship awarded to RB (grant code: RS86P5).
Acknowledgments
The authors would like to thank Jack Bobo, former Director of The Food Systems Institute, University of Nottingham (Food Systems Institute, https://www.nottingham.ac.uk/science/schools-centres-and-institutes/food-systems-institute/index.aspx), for his advice while preparing the final version of the manuscript.
Conflict of interest
The authors declare that the research was conducted in the absence of any commercial or financial relationships that could be construed as a potential conflict of interest.
Correction note
A correction has been made to this article. Details can be found at: 10.3389/fsufs.2025.1713231.
Generative AI statement
The author(s) declare that no Gen AI was used in the creation of this manuscript.
Any alternative text (alt text) provided alongside figures in this article has been generated by Frontiers with the support of artificial intelligence and reasonable efforts have been made to ensure accuracy, including review by the authors wherever possible. If you identify any issues, please contact us.
Publisher’s note
All claims expressed in this article are solely those of the authors and do not necessarily represent those of their affiliated organizations, or those of the publisher, the editors and the reviewers. Any product that may be evaluated in this article, or claim that may be made by its manufacturer, is not guaranteed or endorsed by the publisher.
Supplementary material
The Supplementary material for this article can be found online at: https://www.frontiersin.org/articles/10.3389/fsufs.2025.1633312/full#supplementary-material
References
Alexander, P., Berri, A., Moran, D., Reay, D., and Rounsevell, M. D. (2020). The global environmental paw print of pet food. Global Environmental Change, 65:102153. doi: 10.1016/j.gloenvcha.2020.102153
Brociek, R.A. (2025). ‘Nutritional analysis of commercially available, complete plant- and meat-based dry dog foods in the UK ’. doi: 10.1371/journal.pone.0328506
Chislock, M. F., Doster, E., Zitomer, R. A., and Wilson, A. E. (2013). Eutrophication: causes, consequences, and controls in aquatic ecosystems. Nature Educ. Knowledge 4. https://www.nature.com/scitable/knowledge/library/eutrophication-causes-consequences-and-controls-in-aquatic-102364466/#
European Environmental Agency (2020). “Acidification” in Europe’s environment. The Dobris Assessment was edited by David Stanners and Philippe Bourdeau and was a comprehensive report prepared by the European Environment Agency (EEA) Task Force. https://www.eea.europa.eu/en/analysis/publications/92-826-5409-5
Fraanje, W., and Garnett, T. (2020). Soy: Food, feed, and land use change. Oxford: Food Climate Research Network, University of Oxford.
Fujs, Tony, and Kawshiwase, Haruna (2023) ‘World Bank blogs’, Strains on freshwater resources: The impact of food production on water consumption, 23 august. Available online at: https://blogs.worldbank.org/en/opendata/strains-freshwater-resources-impact-food-production-water-consumption (Accessed: 13 March 2025).
Godfray, H. C. J., Beddington, J. R., Crute, I. R., Haddad, L., Lawrence, D., Muir, J. F., et al. (2010). Food security: the challenge of feeding 9 billion people. Science 327, 812–818. doi: 10.1126/science.1185383
Gov.uk. (2019). Using animal by-products to make pet food. Available online at: https://www.gov.uk/guidance/using-animal-by-products-to-make-pet-food (Accessed: 25 April 2024).
Humpenöder, F., Bodirsky, B. L., Weindl, I., Lotze-Campen, H., Linder, T., and Popp, A. (2022). Projected environmental benefits of replacing beef with microbial protein. Nature 605, 90–96. doi: 10.1038/s41586-022-04629-w
Ingenpaß, L., Abd El-Wahab, A., Ullrich, C., Kölln, M., Ahmed, M. F. E., Visscher, C., et al. (2021). Nitrogen output in the urban environment using a vegetarian canine diet. PLoS One 16:e0257364. doi: 10.1371/journal.pone.0257364
Jarosch, L., Bach, V., and Finkbeiner, M. (2024). A life cycle assessment of vegan dog food. Cleaner Environ. Systems 14:100216. doi: 10.1016/j.cesys.2024.100216
Knight, A. (2023). The relative benefits for environmental sustainability of vegan diets for dogs, cats and people. PLoS One 18:e0291791. doi: 10.1371/journal.pone.0291791
Martens, P., Su, B., and Deblomme, S. (2019). The ecological paw print of companion dogs and cats. Bio Science 69, 467–474. doi: 10.1093/biosci/biz044
Mekonnen, M. M., and Hoekstra, A. Y. (2011). The green, blue and grey water footprint of crops and derived crop products. Hydrol. Earth Syst. Sci. 15, 1577–1600. doi: 10.5194/hess-15-1577-2011
Morelli, G., Stefanutti, D., and Ricci, R. (2021). A survey among dog and cat owners on pet food storage and preservation in the households. Animals 11:273. doi: 10.3390/ani11020273
National Oceanic and Atmospheric Association (2024). What is eutrophication? National Ocean Service.
Nicholles, B., and Knight, A. (2025). The environmental sustainability of meat-based versus vegan pet food. Front. Sustain. Food Syst. 9:1569372. doi: 10.3389/fsufs.2025.1569372
Okin, G. S. (2017). Environmental impacts of food consumption by dogs and cats. PLoS One 12:e0181301. doi: 10.1371/journal.pone.0181301
Pedrinelli, V., Teixeira, F. A., Queiroz, M. R., and Brunetto, M. A. (2022). Environmental impact of diets for dogs and cats. Sci. Rep. 12:18510. doi: 10.1038/s41598-022-22631-0
Pet Food Industry (2023). How dog owners in five developed countries feed their pets. Available online at: https://www.petfoodindustry.com/blogs-columns/adventures-in-pet-food/blog/15546603/how-dog-owners-in-five-developed-countries-feed-their-pets (Accessed: 6 January 2025).
Pimentel, D., and Pimentel, M. (2003). Sustainability of meat-based and plant-based diets and the environment. Am. J. Clin. Nutr. 78, 660S–663S. doi: 10.1093/ajcn/78.3.660S
Pingali, P., Boiteau, J., Choudhry, A., and Hall, A. (2023). Making meat and milk from plants: a review of plant-based food for human and planetary health. World Dev. 170:106316. doi: 10.1016/j.worlddev.2023.106316
Poore, J., and Nemecek, T. (2018). Reducing food’s environmental impacts through producers and consumers. Science 360, 987–992. doi: 10.1126/science.aaq0216
Reijnders, L., and Soret, S. (2003). Quantification of the environmental impact of different dietary protein choices. Am. J. Clin. Nutr. 78, 664S–668S. doi: 10.1093/ajcn/78.3.664S
Ritchie, H. (2020). Less meat is nearly always better than sustainable meat, to reduce your carbon footprint, our world in data. Available online at: https://ourworldindata.org/less-meat-or-sustainable-meat (Accessed: 7 January 2025).
Ritchie, H., Rosado, P., and Roser, M. (2022) Environmental impact of food production. Available online at: https://ourworldindata.org/environmental-impacts-of-food (Accessed: 23 April 2024).
Rothgerber, H. (2013). A meaty matter. Pet diet and the vegetarian’s dilemma. Appetite 68, 76–82. doi: 10.1016/j.appet.2013.04.012
Rushforth, R., and Moreau, M. (2013). Finding your dog’s ecological ‘pawprint’: A hybrid EIO-LCA of dog food manufacturing. Tempe, Arizona: Centre for Eart Systems Engineering and Management.
Satriajaya, A. (2017). The water and land footprint of pets. Enschede, The Netherlands: University of Twente.
Scarborough, P., Clark, M., Cobiac, L., Papier, K., Knuppel, A., Lynch, J., et al. (2023). Vegans, vegetarians, fish-eaters and meat-eaters in the UK show discrepant environmental impacts. Nature Food 4, 565–574. doi: 10.1038/s43016-023-00795-w
Schader, C., Muller, A., Scialabba, N. E. H., Hecht, J., Isensee, A., Erb, K. H., et al. (2015). Impacts of feeding less food-competing feedstuffs to livestock on global food system sustainability. J. R. Soc. Interface 12:20150891. doi: 10.1098/rsif.2015.0891
Sivewright, Joe, and Krueger, Nina Leigh (2019) ‘Winning in PetCare’. Available online at: https://www.nestle.com/sites/default/files/asset-library/documents/library/presentations/investors_events/investor-seminar-2019/petcare.pdf (Accessed: 12 March 2025).
Su, B., and Martens, P. (2018). Environmental impacts of food consumption by companion dogs and cats in Japan. Ecol. Indic. 93, 1043–1049. doi: 10.1016/j.ecolind.2018.06.015
Su, B., Martens, P., and Enders-Slegers, M.-J. (2018). A neglected predictor of environmental damage: the ecological paw print and carbon emissions of food consumption by companion dogs and cats in China. J. Clean. Prod. 194, 1–11. doi: 10.1016/j.jclepro.2018.05.113
Swanson, K. S., Carter, R. A., Yount, T. P., Aretz, J., and Buff, P. R. (2013). Nutritional sustainability of pet foods. Adv. Nutr. 4, 141–150. doi: 10.3945/an.112.003335
US Environmental Protection Agency (2024) What is acid rain? Available online at: https://www.epa.gov/acidrain/what-acid-rain (Accessed: 12 January 2025).
Vale, R., and Vale, B. (2009). Time to eat the dog? The real guide to sustainable living. United Kingdom: Thames & Hudson Ltd.
Van Kernebeek, H. R. J. (2016). Saving land to feed a growing population: consequences for consumption of crop and livestock products. Int. J. Life Cycle Assess. 21, 677–687. doi: 10.1007/s11367-015-0923-6
Van Selm, B. (2022). Circularity in animal production requires a change in the EAT-lancet diet in Europe. Nature Food 3, 66–73. doi: 10.1038/s43016-021-00425-3
Van Zanten, H. H. E. (2016). Global food supply: land use efficiency of livestock systems. Int. J. Life Cycle Assess. 21, 747–758. doi: 10.1007/s11367-015-0944-1
Van Zanten, H. H. E. (2018). Defining a land boundary for sustainable livestock consumption. Glob. Chang. Biol. 24, 4185–4194. doi: 10.1111/gcb.14321
Van Zanten, H. H. E., Ittersum, M. K., and De Boer, I. J. M. (2019). The role of farm animals in a circular food system. Glob. Food Secur. 21, 18–22. doi: 10.1016/j.gfs.2019.06.003
Westhoek, H., Lesschen, J. P., Rood, T., Wagner, S., De Marco, A., Murphy-Bokern, D., et al. (2014). Food choices, health and environment: effects of cutting Europe’s meat and dairy intake. Glob. Environ. Chang. 26, 196–205. doi: 10.1016/j.gloenvcha.2014.02.004
Wilkinson, J. M. (2011). Re-defining efficiency of feed use by livestock. Animal 5, 1014–1022. doi: 10.1017/S175173111100005X
World Bank Group (2025) Metadata Glossary. Available online at: https://databank.worldbank.org/metadataglossary/world-development-indicators/series/ER.H2O.FWTL.ZS (Accessed: 12 March 2025).
WWF (2015). Soy: The biggest food crop we never talk about. Available online at: https://www.worldwildlife.org/magazine/issues/winter-2015/articles/soy-the-biggest-food-crop-we-never-talk-about
Yavor, K. M., Lehmann, A., and Finkbeiner, M. (2020). Environmental impacts of a pet dog: an LCA case study. Sustainability 12:3394. doi: 10.3390/su12083394
Keywords: canine, diet, dog, ecological footprint, plant-based, vegan, greenhouse gases, climate change
Citation: Brociek RA and Gardner DS (2025) Environmental impact of feeding plant-based vs. meat-based dry dog foods in the United Kingdom. Front. Sustain. Food Syst. 9:1633312. doi: 10.3389/fsufs.2025.1633312
Edited by:
Kathleen L. Hefferon, Cornell University, United StatesReviewed by:
Waseem Khalid, Government College University, PakistanAndrew Knight, Murdoch University, Australia
Copyright © 2025 Brociek and Gardner. This is an open-access article distributed under the terms of the Creative Commons Attribution License (CC BY). The use, distribution or reproduction in other forums is permitted, provided the original author(s) and the copyright owner(s) are credited and that the original publication in this journal is cited, in accordance with accepted academic practice. No use, distribution or reproduction is permitted which does not comply with these terms.
*Correspondence: R. A. Brociek, cmViZWNjYS5icm9jaWVrQG5vdHRpbmdoYW0uYWMudWs=; D. S. Gardner, ZGF2aWQuZ2FyZG5lckBub3R0aW5naGFtLmFjLnVr