 Jianya Zhao1
 Fanhao Yang
 Shu Wang
- 1Jinan University-University of Birmingham Joint Institute, Jinan University, Guangzhou, China
- 2School of Economics, Jinan University, Guangzhou, China
Introduction: In the context of global climate warming and agricultural carbon emission management, corn, as the widely cultivated and cereal crop in China, plays a crucial role in ensuring food security and supporting the development of the livestock industry. Its production process generates carbon emissions and can affect the nitrogen cycle in the environment. To contribute to a more comprehensive understanding of regional characteristics and policy landscape, this study aims to calculate the carbon and nitrogen footprints of corn production in China and explore relevant emission reduction strategies, thereby providing a more comprehensive nationwide systematic analysis and offering a more nuanced depiction of regional differentiation.
Methods: This study uses agricultural statistical data from 2014 to 2023 to analyze corn production trends. Major corn-producing regions are categorized based on government’s corn regional planning and agroecological humidity zones. This study employs life cycle assessment and area-weighted methods to estimate the carbon and nitrogen footprints across major corn-producing regions. It further examines the impact of key factors—including planting area expansion, fertilizer reduction, and pesticide reduction—on carbon and nitrogen footprints through scenario-based simulations.
Results: The results indicate that: (1) Both the Northwestern Irrigated Corn Region and Arid to Semi-arid Zone have elevated carbon footprints, while nitrogen footprints peak in the Northwestern Region and Arid Zone (2) Scenario simulations show that planting area expansion serves as a baseline for the carbon and nitrogen footprints. The impact of fertilizer and pesticide reduction on the carbon footprint varies depending on regional characteristics, while fertilizer reduction has a notably greater effect on reducing the nitrogen footprint.
Discussion: This study provides quantitative evidence and policy recommendations for balancing food security with low-carbon transformation and nitrogen management in major corn-producing regions, thereby contributing to carbon neutrality and agricultural sustainability in China.
1 Introduction
With the intensifying trend of global climate warming, reducing greenhouse gas emissions has become a consensus among countries worldwide. Among major human activities, agricultural activities contribute a significant portion of carbon dioxide (CO2) emissions, making agricultural carbon emission management a key area for achieving the temperature control goals outlined in the Paris Agreement. On a global scale, food systems account for 21–37% of global greenhouse gas emissions, with the agricultural sector responsible for nearly 15% of total emissions (Xu et al., 2024). Furthermore, global agricultural greenhouse gas emissions are increasing by approximately 1% annually (Xu et al., 2024). In China, agricultural carbon emissions have reached approximately 13.2% of total emissions from 2008 to 2015 (Huang et al., 2019). As one of the three major grain crops in China, corn is the widely cultivated and high-yielding cereal crop, as well as the primary feed raw material. It had a yield of 288.8 million tons in 2023, accounting for approximately 23.26% of the world’s production that year (FAO, n.d.). In the staple food system, corn contains abundant carbohydrates and other nutrients, providing basic nutritional support for a large population, and is an indispensable component of the dietary structure (Erenstein et al., 2022). From the perspective of the feed industry, corn has become a high-quality nutrient feed material due to its high starch content and high nutrient value characteristics (Corsato Alvarenga et al., 2022; Wang et al., 2023). Corn can meet the nutrient needs of animals in different growth cycles of livestock and poultry farming, and is a key element in maintaining the efficient operation of animal husbandry (Chao, 2023). In addition, corn has shown great value in the field of industrial processing, and has profound strategic significance for ensuring national food security and promoting the economic development of related industries (Kopparapu et al., 2022). Therefore, the carbon emission intensity of large-scale corn production directly affects the process of low-carbon transformation in agriculture. The major corn-producing regions in China are widely distributed, covering areas such as the North China Plain, Northeast China, and the Huang-Huai-Hai region. The production systems in these regions significantly influence the carbon emissions intensity (Ministry of Agriculture and Rural Affairs, 2021). The entire life cycle of corn production, including fertilizer use (Guo et al., 2022; Guo and Wang, 2021; Wu et al., 2021), pesticide application (Du et al., 2023; Hu and Liu, 2024), the adoption of agricultural technologies (such as plastic film use) (Chen et al., 2023; Zhang et al., 2021), and irrigation (Zhang et al., 2023; Qin et al., 2024), all have profound impacts on the carbon footprint. Therefore, in the context of the continued rise in corn demand (Ministry of Agriculture and Rural Affairs, 2021), conducting in-depth research on its carbon emissions, discussing the production mode and resource utilization differences across various regions, is of great significance for ensuring food security while achieving low-carbon transformation and the sustainable development goals (SDGs) of agriculture (Wang et al., 2021).
Existing research on carbon and nitrogen footprints from corn production in China encompasses individual provinces or specific geographic regions (Pang et al., 2020; Zhang et al., 2023; Wen et al., 2022). The primary research focuses include comparisons of carbon and nitrogen footprints (Zhou et al., 2022), water-soil-energy-carbon footprint framework analysis (Yao et al., 2024), spatiotemporal characteristic differences (Zhu and Huo, 2022), and factor analysis (Chen et al., 2021). In May 2022, the “Implementation Plan for Agricultural and Rural Emission Reduction and Carbon Sequestration” (National Development and Reform Commission, Price Bureau, 2015–2024) was issued by Ministry of Agricultural and Rural Affairs, marking a further exploration and development of low-carbon agriculture across various regions. In key corn-producing areas such as the North China Plain (Liang et al., 2024) and the Northeast Black Soil Region (Guo et al., 2021), research on carbon emissions intensity and structure has been relatively in-depth, revealing the impacts of driving factors such as mulching (Luo et al., 2021) and drip irrigation (Zong et al., 2020) on the carbon footprint of corn production. Although domestic and international scholars have proposed various emission reduction technologies for corn production, such as the promotion of slow-release fertilizers (Jiang et al., 2010), implementation of water-saving irrigation (Wang et al., 2020), and the practice of straw return (Li et al., 2024; Wang et al., 2023; Wang et al., 2022; Wang et al., 2021), there are significant limitations in the policy recommendations presented in the existing literature. These include: the economic-environmental benefit assessments of emission reduction measures are often based on single pilot sites or idealized models, lacking empirical comparisons across different production areas and scenarios; policy designs have not fully considered the spatiotemporal coupling effects of production factors. For example, although mulching technology can reduce carbon emissions, the organic carbon loss in the soil caused by residual plastic films may offset some of the short-term emission reduction benefits (Yin et al., 2016; Yang, 2024).
To address the research gaps, this study integrates the national government’s corn regional planning and humidity zoning to divide China’s 20 major corn-producing provinces into four primary production regions. By incorporating inputs such as seeds, plastic film, fertilizers, and diesel, the carbon and nitrogen footprints are calculated using a life cycle assessment and area-weighted method. Based on the planting plans and policy guidelines outlined in the 14th Five-Year Plan for the Development of Planting Industry (Ministry of Agriculture and Rural Affairs, 2021)—planting area expansion, fertilizer reduction, and pesticide reduction—are constructed to simulate the environmental and economic impacts of different policy combinations. This study aims to provide differentiated policy pathways for balancing food security and low-carbon transformation in major corn-producing regions, while offering technical support for abatement of agricultural carbon emission. The overall research framework is illustrated in Figure 1.
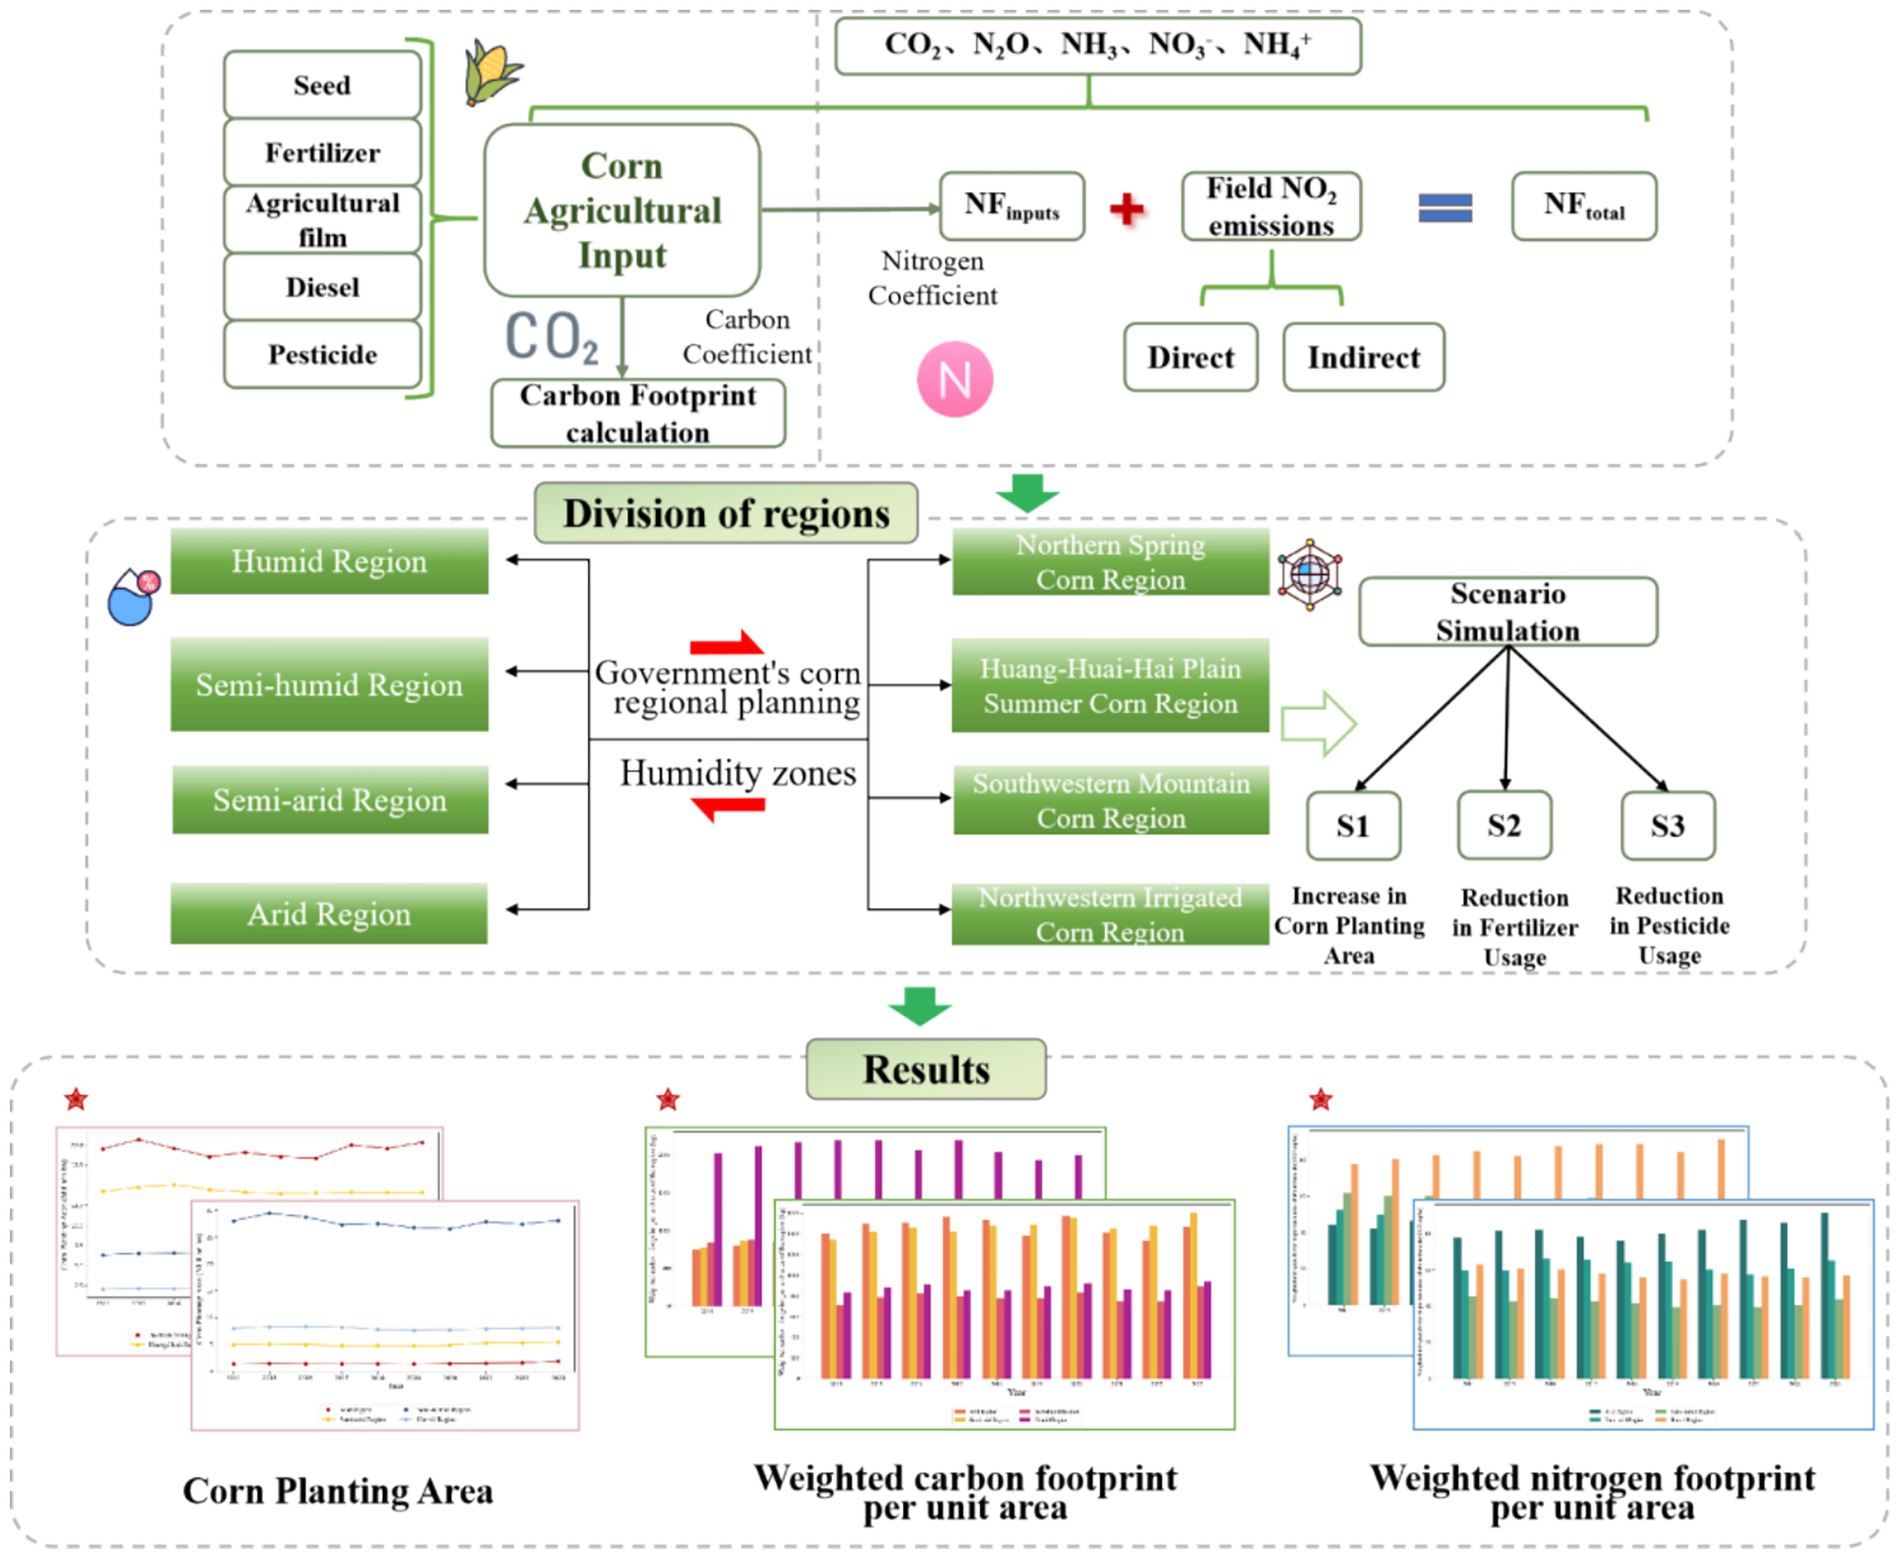
Figure 1. Research framework.
2 Materials and methods
2.1 Division of the study area
Given China’s vast territory and the widespread cultivation of corn nationwide, this study selects 20 major corn-producing provinces and autonomous regions (hereafter collectively referred to as ‘provinces’). Based on the agricultural zoning and the government’s corn regional planning in China (Zhu, 1992; Fang, 2022), these provinces are divided into four corn-producing regions:
• Northern Spring Corn Region: Heilongjiang, Jilin, Liaoning, Inner Mongolia, Ningxia, Shanxi Provinces.
• Huang-Huai-Hai Plain Summer Corn Region: Shandong, Henan, Hebei, Shaanxi, Jiangsu, Anhui Provinces.
• Southwestern Mountain Corn Region: Hubei, Chongqing, Sichuan, Yunnan, Guizhou, Guangxi Provinces.
• Northwestern Irrigated Corn Region: Xinjiang and Gansu Provinces.
Precipitation is one of the important driving factors affecting soil nitrogen emissions (Intergovernmental Panel on Climate Change, n.d.; Liang et al., 2020), therefore the second division method in this article is based on the regional division of China’s humidity zones (The Central People’s Government of the People’s Republic of China, n.d.).
• Arid Zone (including Xinjiang, Ningxia Provinces): Low precipitation, low soil moisture.
• Semi-arid Zone (including Gansu, Inner Mongolia Provinces): Slightly higher precipitation than arid areas; nitrogen emissions fluctuate with climate and seasons.
• Semi-humid Zone (including Hebei, Henan, Shandong, Shaanxi, Heilongjiang, Jilin, Liaoning, Shanxi Provinces): Moderate precipitation.
• Humid Zone (including Jiangsu, Anhui, Chongqing, Sichuan, Yunnan, Guizhou, Guangxi, Hubei Provinces): Abundant precipitation and moist soil.
The maps showing the regional divisions based on the two different criteria are presented in Figure 2.
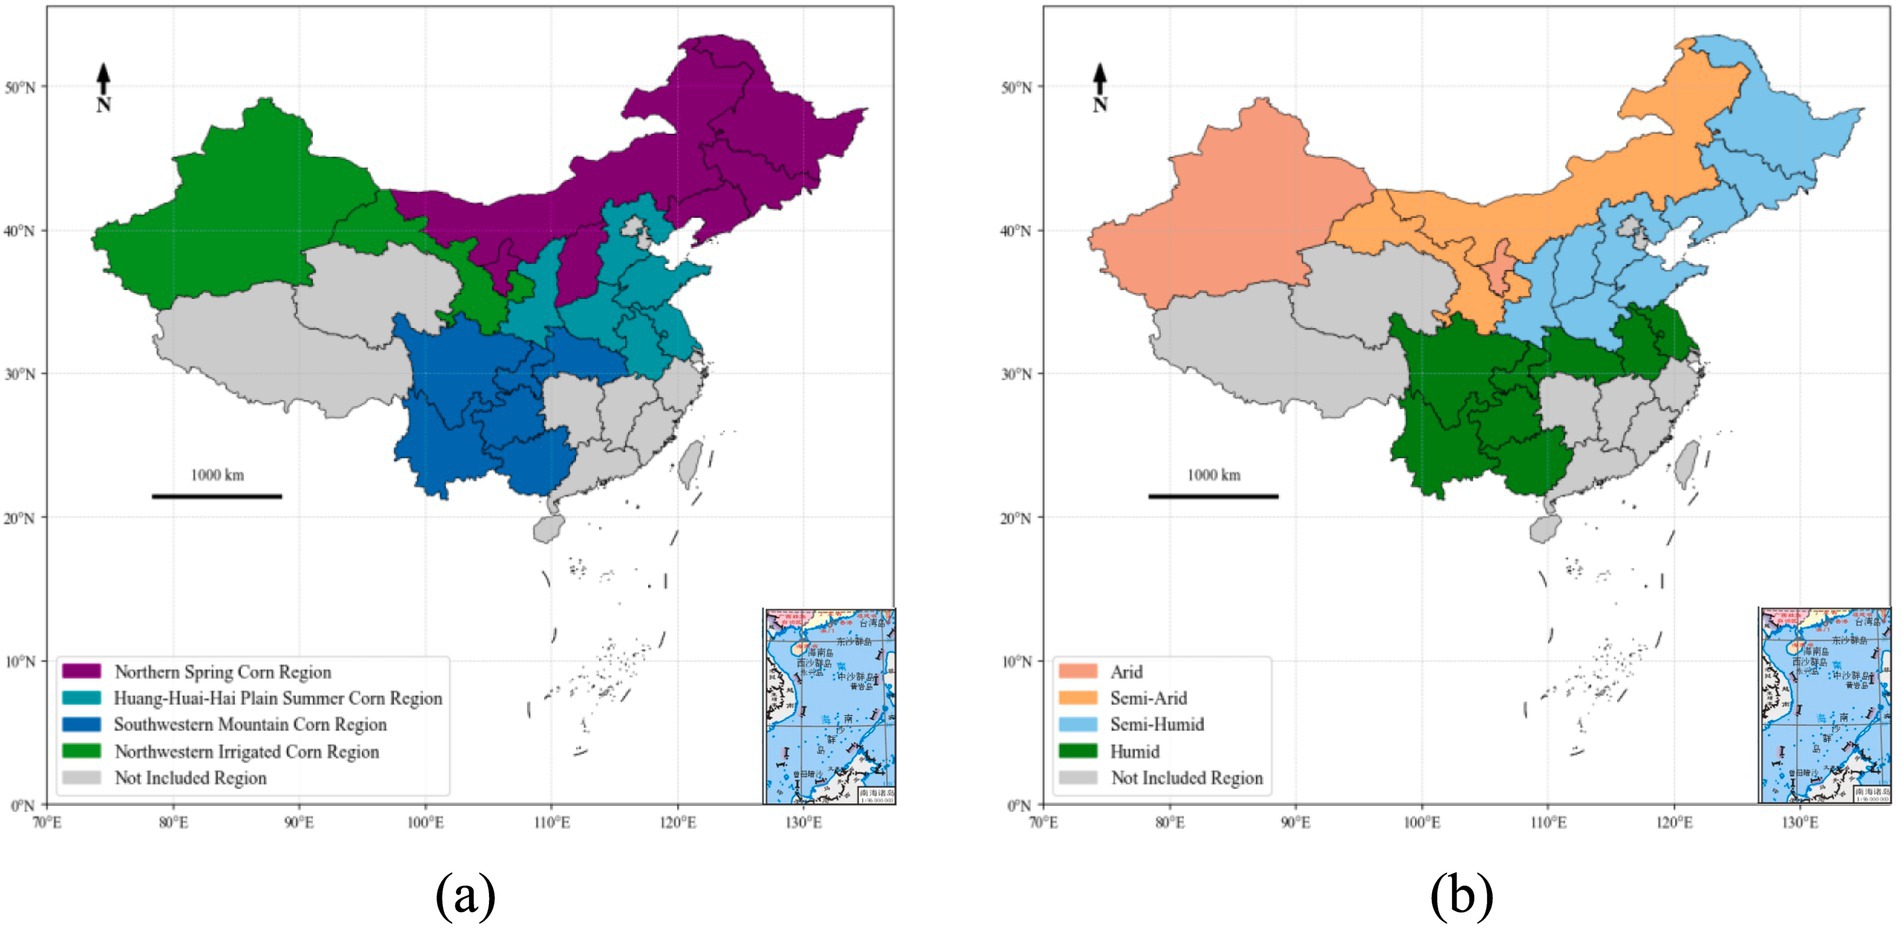
Figure 2. Visual maps of different regional divisions. (a) Based on agricultural zoning and the government’s corn regional planning in China. (b) Based on the regional division of China’s humidity zones.
2.2 Data source and processing
Owing to the continuous advancement and refinement of China’s agricultural policies and data systems, the period spanning from 2014 to 2023 has featured remarkable policy continuity and data integrity. During this phase, several pivotal programmatic documents were promulgated, including the 14th Five-Year Plan for the Development of National Crop Farming and the Action Plan for Zero Growth in Fertilizer and Pesticide Application by 2020 (Ministry of Agriculture and Rural Affairs, 2021; Ministry of Agriculture and Rural Affairs, 2022a). These documents have exerted a significant guiding influence on recent agricultural development. As corn constitutes a critical component of agricultural production, its planting structure, input–output dynamics, and other relevant aspects have also undergone changes alongside the implementation of these policies. Consequently, the carbon and nitrogen footprints of corn production analyzed in our research are closely linked to the policy adjustments during this period. In this study, the agricultural input data for the corn-producing process in 20 provinces is sourced from the “National Agricultural Product Cost and Benefit Data Compilation” from 2014 to 2023 (China Statistics Press, 2015–2024). The price data for pesticides and diesel is sourced from the “Market Price Changes of Important Production Materials in the Circulation Field” published by the National Bureau of Statistics from 2014 to 2023 (https://www.stats.gov.cn/search/s?qt=流通领域重要生产资料市场价格变动情况). The corn-producing areas data is sourced from the annual data of the National Bureau of Statistics from 2014 to 2023 (https://data.stats.gov.cn/easyquery.htm?cn=C01). Specifically, the mechanical diesel cost is calculated as 30% of the mechanical operation cost (Ji et al., 2024), and the mechanical diesel consumption is calculated as mechanical diesel cost / diesel price. The pesticide usage is calculated as pesticide cost / pesticide price.
2.3 Methods
2.3.1 Corn carbon footprint calculation
This study uses the life cycle method to calculate the carbon footprint, considering only indirect emissions and does not account for changes in organic carbon (Zhang et al., 2023; Qi et al., 2018). The agricultural inputs during the life cycle of corn primarily include eight inputs: seeds, chemical fertilizers (nitrogen, phosphorus, potassium, compound fertilizers), agricultural film, diesel, and pesticides. These inputs are converted into carbon emission equivalent (CE). The carbon footprint calculation formula is as follows:
Where, is the carbon footprint per unit area ; refers to the input amount of the i-th agricultural input product ( ); n refers to the number of agricultural input types. ECi refers to the emission coefficient of the i-th agricultural input product (see Table 1).
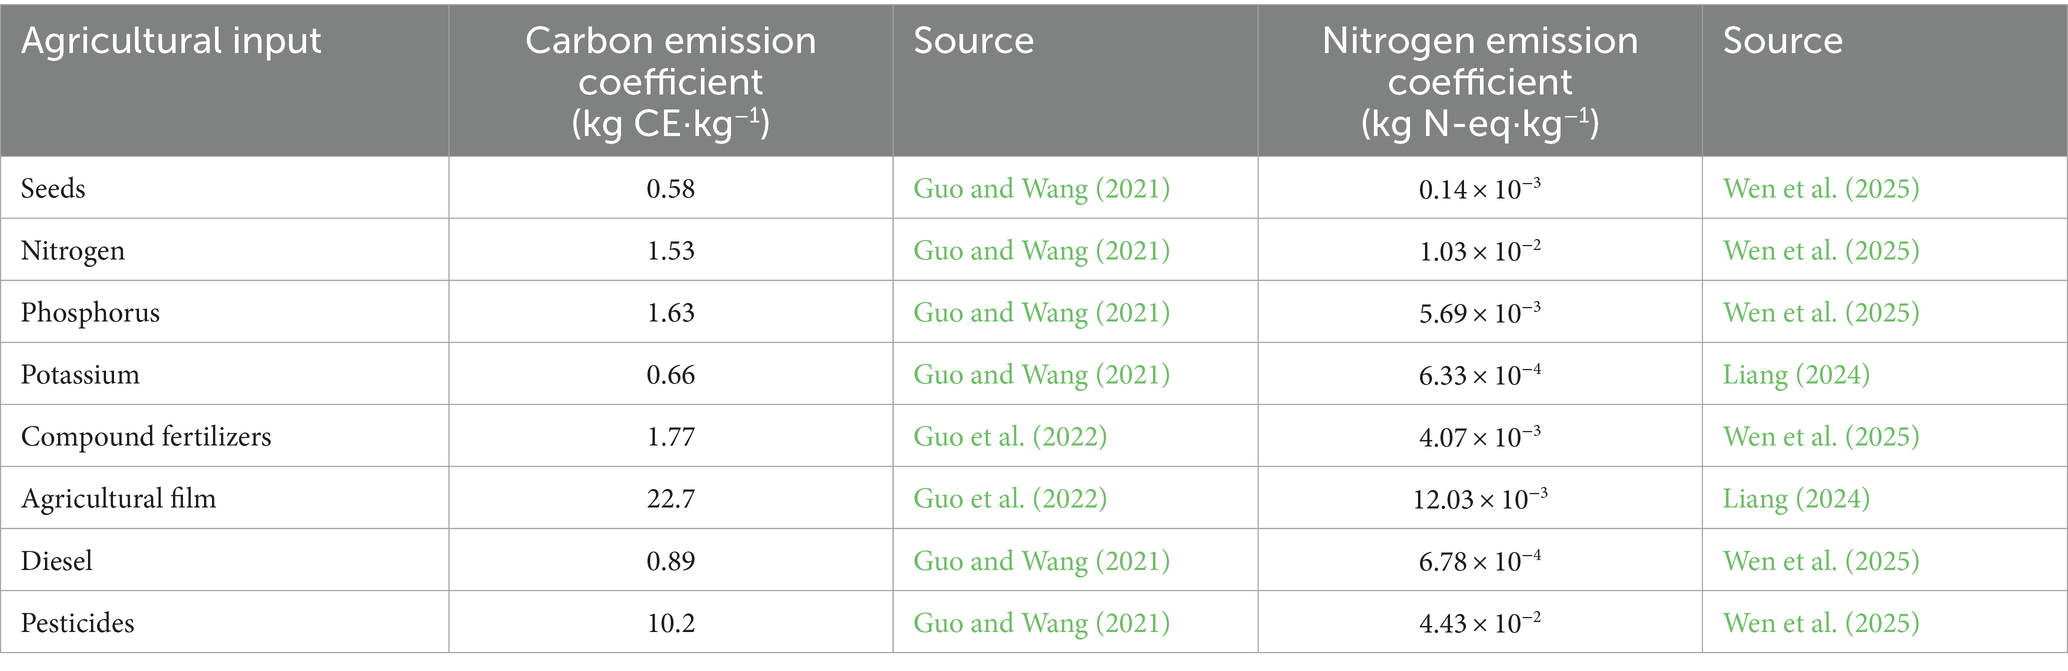
Table 1. Emission coefficient for agricultural inputs in corn carbon and nitrogen footprint calculation.
Where, is the weighted carbon footprint per unit area ( ); refers to the corn planting area of the j-th province ( ), m refers to the number of provinces in the designated region.
2.3.2 Corn nitrogen footprint calculation
The nitrogen footprint in corn production mainly includes indirect reactive nitrogen generated from agricultural input and both direct and indirect N2O emissions during nitrogen fertilizer application. Direct emissions primarily arise from the microbial processes in the soil after nitrogen fertilizer application, resulting in the emission of nitrous oxide (N2O). Indirect emissions mainly originate from the loss of nitrogen fertilizers to water bodies or the atmosphere, where nitrogen oxides are formed and subsequently deposited into the soil system. The nitrogen footprint calculation formula is as follows:
Where, represents the considered loss of reactive nitrogen throughout the entire lifecycle (kg ); is the indirect loss of reactive nitrogen caused by agricultural inputs during production, transportation, and use (kg N-eq·ha−1); refers to the input amount of the i-th agricultural input product ( ); is the corresponding active nitrogen loss coefficient or nitrogen emission coefficient (kg N-eq·ha−1) (see Table 1); , , , represent the loss of active nitrogen throughout the entire growth period of corn; , , refer to the direct emissions of in the field, indirect emissions caused by the volatilization of fertilizers into the atmosphere in the form of and , and indirect emissions caused by nitrogen loss through leaching and runoff of fertilizers, respectively; represents nitrogen application rate (kg), Nf and Cf refers to the amount of nitrogen fertilizer and compound fertilizer (kg), the main components of compound fertilizer are calculated according to =15:15:15; , , and and are the direct emissions caused by nitrogen fertilizer input and the emissions caused by nitrogen deposition, respectively, with a value of 0.01; and represent the proportion of fertilizer volatilization in the form of and (with a value of 0.1 kg·kg-1), as well as the proportion of leaching and runoff losses in the soil (with a value of 0.3 kg·kg-1); , , and are the loss coefficients of volatile nitrogen in (with a value of 0.226); 44/28, 17/14, 62/14, 18/14 are the relative molecular weight ratios of and , and , and , and respectively. 0.476, 0.833, 0.238, and 0.786 are the eutrophication coefficients of , , , and respectively (Liang, 2024; Zheng and Wang, 2020; Chen et al., 2020; Wang et al., 2018; Chen et al., 2023; Lin et al., 2012; Wen et al., 2025).
Where, is the weighted nitrogen footprint per unit area ( ); refers to the corn planting area of the j-th province (ha), m refers to the number of provinces in the designated region.
2.3.3 Scenario simulation
Relevant literature (Wang et al., 2022) states that in 2020, China’s corn planting area was only 41.3 million ha, but by 2025, the total output of food crops should be maintained above 0.65 billion tons, and the planting area of food crops should remain stable at 116 million ha. Especially, the corn planting area will reach more than 4 million ha, and output will increase to more than 26.5 million tons, striving to reach 27.75 million tons. The “Action Plan for Fertilizer Reduction by 2025” (Ministry of Agriculture and Rural Affairs, 2022a) and the “Action Plan for Pesticide Reduction by 2025” (Zhang et al., 2022) state that compared to 2020, by 2025, the use of fertilizers and pesticides for major food crops should be maintained at a declining trend, with a moderate reduction.
This study sets scenarios regarding the changes in fertilizer and pesticide use and planting area for the four major corn-producing regions, to simulate future corn carbon and nitrogen footprints calculations. The three scenarios are as follows:
2.3.3.1 Scenario 1 (Increase in corn-producing areas)
This scenario assumes that the corn-producing areas will increase. Based on factors such as topography, arable land resources, and agricultural technology levels in different regions, different growth rates for planting area are set for each region. For example, the northeast region, with its fertile black soil and favorable climate, has become one of the major corn-producing regions. The north region, with its vast plains and convenient irrigation, also has a large corn planting area (Zhu et al., 2022). Although the northwest region has a dry climate, the use of water-saving irrigation technology and drought-resistant varieties has led to certain successes in corn production (Ouyang et al., 2022). Additionally, the Northern Spring Corn Region and the Huang-Huai-Hai Summer Corn Region account for the majority of the national corn-producing areas, indicating these regions have relatively abundant arable land resources suitable for corn production (Jiang et al., 2025). Furthermore, the climate in the northeast, north China, and parts of the southwest is suitable for corn growth.
Moreover, the “14th Five-Year National Planting Industry Development Plan” (Ministry of Agriculture and Rural Affairs, 2021) indicates that corn is China’s largest staple crop, an important feed and industrial raw material. During the 14th Five-Year period, efforts will be made to increase planting area, improve capacity, optimize structure, promote diversified development, and enhance supply security. By 2025, the planting area will reach more than 42 billion ha, and output will increase to more than 265 million tons, striving to reach 277.5 million tons. Specifically, the northeast region will appropriately expand area, optimize planting systems, and increase production levels. The Huang-Huai-Hai Summer Corn Region will stabilize the area, focus on improving corn productivity, and promote grain harvesting with machinery. The northwest region will stabilize the area, enhance productivity, and develop silage corn according to local conditions. The southwest region will stabilize the area, optimize the structure, and develop in a diversified manner.
This scenario serves as a baseline scenario and is not considered a mitigation strategy. Instead, it is designed to reflect the current national policy trend of ensuring food security through production expansion. By comparing this scenario with the two emission reduction scenarios—fertilizer reduction and pesticide reduction, the study aims to reveal the carbon emission costs associated with large-scale agricultural expansion and to emphasize the necessity of implementing mitigation measures. This comparative scenario framework contributes to a more comprehensive understanding of the potential trade-offs between agricultural productivity goals and climate targets.
2.3.3.2 Scenario 2 (reduction in fertilizer usage)
This scenario assumes a reduction in the fertilizer usage in the corn-producing process. Due to differences in soil properties, climate conditions, and fertilization technologies, different fertilizer reduction rates are set for each region. For example, the northeast region, with its high soil fertility, should moderately reduce fertilizer application to save on fertilizer costs, while the northwest region, with lower soil nutrient content, may slightly increase fertilizer use to further increase corn production (Kong et al., 2022). In Humid and Semi-humid Zone, less fertilizer may be needed to maintain soil fertility, while in Arid and Semi-arid Zone, more fertilizer may be required to replenish soil nutrients (Xin, 2022). Regions with abundant arable land resources may require more fertilizer due to more land being used for corn production. In contrast, regions with limited arable land may focus more on improving fertilizer use efficiency to reduce overall usage (Cui et al., 2024).
At the same time, the “Action Plan for Fertilizer Reduction by 2025” (Ministry of Agriculture and Rural Affairs, 2022a) mentions that China’s agricultural fertilizer usage has decreased for six consecutive years, with the amount in 2021 being 51.91 million tons (pure weight), a decrease of 13.8% compared to 2015. The goal is to reduce fertilizer use steadily by 2025, with more rational nutrient structure for nitrogen, phosphorus, potassium, and trace elements. Specifically, the northeast region will limit nitrogen, phosphorus, and potassium; the north region will reduce nitrogen, control phosphorus, and stabilize potassium; the Yangtze River region will implement regional fertilizer control and optimize fertilizer structure; the Southwest region will reduce nitrogen, phosphorus, and adjust potassium; and the Northwest region will apply fertilizer based on soil testing and stabilize nitrogen, control phosphorus, and adjust potassium.
2.3.3.3 Scenario 3 (reduction in pesticide usage)
This scenario assumes a reduction in the pesticide usage in the corn-producing process in each of the major corn-producing regions. The pesticide usage reduction rates are set based on climate, the degree of mechanization, and pest severity in different regions. In the Northern Spring Corn Region and Northwestern Irrigated Corn Region, where the climate is more extreme and pests are fewer, pesticide use is low; in contrast, the other three regions, with their more temperate and humid climates and more frequent pest occurrences in the complex Southwestern mountain terrain, may see higher pesticide usage (Cui et al., 2024).
Additionally, the “Action Plan for Pesticide Reduction by 2025” (Ministry of Agriculture and Rural Affairs, 2022a) mentions that since the implementation of the zero-growth pesticide usage action since 2015, national pesticide use has declined for six consecutive years. During the 13th Five-Year Plan, the annual pesticide usage decreased by 9.4% compared to the 12th Five-Year Plan, and in 2021, pesticide usage was 0.248 million tons, a reduction of 16.8% from 2015. The goal is to maintain a continuous decline in pesticide use by 2025.
Based on the above policies, this study sets scenario-specific parameters for each province and region regarding corn planting area expansion, reductions in fertilizer use (nitrogen, phosphorus, and potassium), and pesticide reduction. The detailed settings are shown in Supplementary Table 1.
3 Results
3.1 Spatiotemporal characteristics of corn-producing areas
Based on government’s corn regional planning (Figure 2a), from a temporal perspective, the corn-producing areas in the Southwestern Mountain Corn Region and the Northwestern Irrigated Corn Region remained relatively stable between 2013 and 2020, consistently maintaining around 5 × 10⁶ hectares (ha) and 2.5 × 10⁶ ha, respectively. However, in 2020, the planting area in the Northwestern Irrigated Corn Region decreased significantly, which is closely related to the impact of the COVID-19 pandemic. The pandemic caused labor shortages, supply chain disruptions, and increased uncertainty in agricultural production, which in turn affected the corn planting plans in the region. This phenomenon highlights the vulnerability of agricultural systems to unforeseen global events, indicating that policy frameworks need to better address such risks. Especially in 2025, the occurrence of severe drought in major production areas such as Henan and Shanxi will result in a national summer grain output of 299.48 million tons, a decrease of 0.31 million tons or 0.1% compared to the previous year (People's Government of the People's Republic of China, 2025); Since the outbreak of the epidemic, the global grain fundamentals have shown a trend of gradually slowing down the growth of output and maintaining the reduction of inventory: from 2021 to 2022, the global grain production will be about 2.8 billion tons, with a growth rate of only 0.8%, significantly lower than the average growth rate of 2.4% over the past 2 years. At the same time, the inventory consumption ratios of global wheat, corn, soybeans, and rice have decreased by 13.7%, 7.8%, 21.2%, and 2.6%, respectively, compared to 2018 (Xiao et al., 2022). In contrast, the planting areas in the Northern Spring Corn Region and Huang-Huai-Hai Plain Summer Corn Region exhibited greater fluctuations, especially after peaking in 2015–2016, followed by a gradual decline. Notably, between 2020 and 2021, the corn-producing areas in these regions sharply decreased, with a reduction of 1–3 × 10⁶ ha. The pandemic affected labor mobilization, agricultural input supply, and market demand stability, leading to a substantial reduction in corn-producing areas.
From a spatial perspective, significant differences exist among the four major corn-producing regions. The Northern Spring Corn Region has the largest corn-producing areas, consistently maintaining around 20 × 106 ha from 2014 to 2023, approximately 10–20 times larger than the Northwestern Irrigated Corn Region. This is primarily due to the favorable climate for spring corn production in this region, with warm springs and relatively stable precipitation providing suitable growing conditions for corn. Additionally, the relatively mature agricultural technology and high level of mechanization contribute to increased production efficiency, further promoting the expansion of corn-producing areas. The corn-producing areas in the Huang-Huai-Hai Plain Summer Corn Region and the Southwestern Mountain Corn Region are relatively stable, maintaining around 15 × 106 ha and 5 × 10⁶ ha, respectively. The Huang-Huai-Hai Plain is suitable for summer corn production, with flat terrain and relatively stable production conditions, resulting in minimal changes in corn-producing areas. In contrast, the Southwestern Mountain Corn Region faces limitations in expanding its corn-producing areas due to complex terrain, significant soil quality variations, and higher production costs, which restrict further expansion (Figure 3). This highlights the unique challenges faced by mountainous regions in agricultural development. Policy interventions should focus on improving soil quality, promoting technological advancements, and reducing production costs to facilitate agricultural development in these regions.
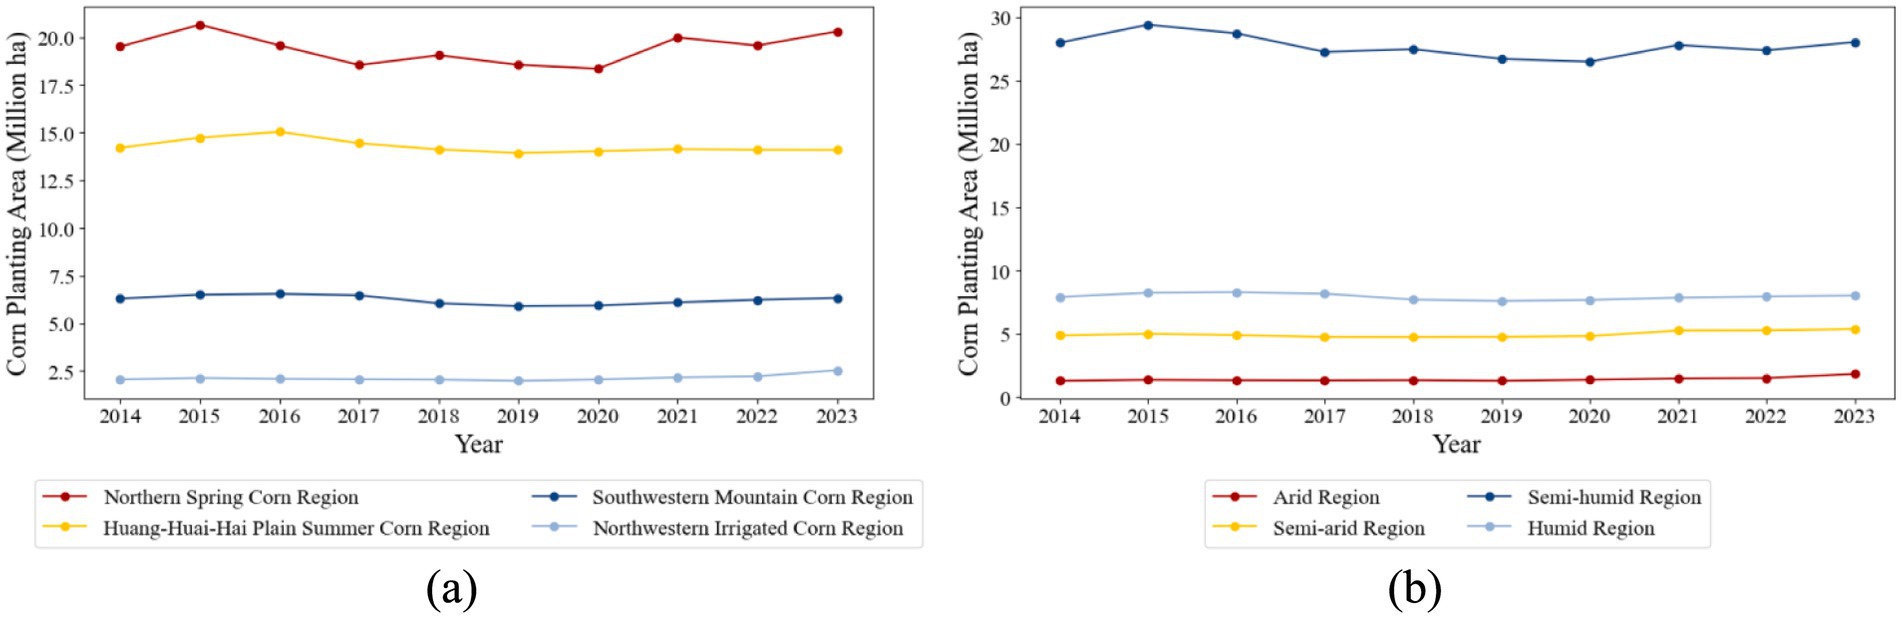
Figure 3. Changes in corn planting area from 2014 to 2023 in the four major corn-producing regions. (a) Based on government’s corn regional planning; (b) Based on the humidity zones.
As shown in Figure 2b, compared to the classification based on the government’s corn regional planning, the regional differences in the four major corn-producing regions based on China’s humidity zones are more pronounced. The Semi-humid Zone, which includes provinces such as Henan and Shandong, consistently ranks first in terms of corn planting area, maintaining between 25 × 106 – 30 × 106 ha. The climate in this zone is relatively stable, with moderate rainfall, making it suitable for corn production. The Humid, Semi-arid, and Arid Zone follows in order, with the arid Zone having the smallest corn-producing areas, approximately 1.5×10⁶ ha. In contrast to other zones, the Arid Zone faces more severe climatic challenges, including water scarcity and poor soil quality, which limit the further expansion of corn planting. The corn-producing regions in the Semi-humid Zone shows a fluctuating trend, first declining and then rising, closely related to recent changes in the zone’s climate, agricultural policy adjustments, and market demand fluctuations. Despite this, the corn-producing regions in the Semi-humid Zone remains high, indicating the zone’s strong agricultural production capacity and its flexible adaptability. The corn-producing regions in other regions have remained relatively stable over time, with minimal changes, mainly constrained by climatic factors.
This trend reflects the profound impact of regional climate conditions, agricultural technology, and policy support on corn production. The Semi-humid Zone, with its relatively stable rainfall and suitable temperature, is more conducive to large-scale corn production. Additionally, more mature agricultural technology and infrastructure further promote the expansion of corn planting areas. In contrast, in the Arid Zone, the lack of water resources and poor soil quality significantly limit the planting area.
3.2 Carbon footprint variation characteristics corn-producing areas
The results of the weighted carbon footprint per unit area for the major corn-producing areas, are shown in Figure 4. According to the government’s corn regional planning calculations, the Northwestern Irrigated Corn Region has the highest carbon footprint per unit area, approximately 2,000 kg/ha. In recent years, compared to previous periods, the carbon footprint in this region has shown a trend of rising and then falling, although the fluctuation is not significant. By 2022, the carbon footprint decreased to 1926.11 kg/ha, reflecting a certain degree of underestimation. In contrast, the weighted carbon footprints per unit area of the other three regions show little difference, but all exhibit an upward trend over time. The carbon footprint in these regions alternately leads, eventually reaching between 940 and 980 kg/ha in 2023. Notably, the Northern Spring Corn Region and the Huang-Huai-Hai Plain Summer Corn Region saw average annual carbon footprint growth rates of 27.4 and 21.8%, respectively, from 2014 to 2023, while the Southwestern Mountain Corn Region had a smaller increase of only 13.3%. The rapid mechanization and scale development of agricultural production in the Northern Spring Corn Region and the Huang-Huai-Hai Plain have led to a significant short-term improvement in carbon emission efficiency.
Figure 4. Changes in weighted carbon footprint per unit area in the four major corn-producing regions (kg CE/ha). (a) Based on government’s corn regional planning; (b) Based on the humidity zones.
Based on the classification of humidity zones, a detailed analysis reveals that the Arid and Semi-arid Zone exhibit the highest weighted carbon footprints per unit area. In the Arid Zone, the carbon footprint per unit area shows a trend of increasing and then decreasing, reaching its peak in 2020 at 1575.7 kg/ha. This phenomenon is closely related to the water scarcity and agricultural irrigation in Arid Zone. Corn production in these areas often relies on irrigation, which leads to substantial energy consumption (e.g., diesel), thus increasing carbon emissions. In contrast, the Semi-arid Zone has shown a steadily increasing trend in carbon footprint per unit area, surpassing the Arid Zone in 2021. By 2023, the weighted carbon footprint in the Semi-arid Zone rose to 1606.4 kg/ha. The rapid increase in carbon emissions in this region is largely attributed to the gradual adoption of more intensive and mechanized farming practices. While this intensive farming approach increases corn production, it is often associated with higher carbon emissions. The carbon footprints in the Humid and Semi-humid Zone have developed more steadily. In the Humid Zone, the abundant water resources have helped control agricultural carbon emissions to some extent, as these resources provide better growing conditions for crops and reduce the dependence on machinery and irrigation, thus lowering carbon emissions. The Semi-humid Zone consistently maintains the lowest carbon footprint, with its unit-area carbon footprint being approximately half that of the Arid and Semi-arid Zone, reflecting the natural advantages of agricultural production under humid conditions.
3.3 Nitrogen footprint variation characteristics of corn-producing regions
Based on the analysis of the weighted nitrogen footprint, the Northwestern Irrigated Corn Region consistently has the highest carbon footprint per unit area across all regions, showing a steadily increasing trend, reaching 91.6 kg in 2023 (Figure 5). This phenomenon is closely related to the region’s agricultural production, which heavily relies on irrigation. During the irrigation process, excessive nitrogen fertilizer application leads to some nitrogen loss, increasing carbon emissions. The region’s intensive agricultural production and high-input farming model, particularly the high demand for nitrogen fertilizer, further contribute to the increase in nitrogen footprint. Climate change may exacerbate water imbalances, further affecting irrigation and fertilizer application, leading to increased nitrogen emissions.
Figure 5. Changes in weighted nitrogen footprint per unit area in the four major corn-producing regions (kg N-eq/ha). (a) Based on government’s corn regional planning; (b) Based on the humidity zones.
In contrast, the other three regions exhibit a trend of first decreasing and then increasing in their nitrogen footprint per unit area. This suggests that, in the initial phase, effective fertilizer management (such as precision fertilization) helped reduce nitrogen footprints, but as agricultural production scale and demand increased, nitrogen emissions began to rise again. The transition of agricultural models, such as shifting from traditional methods to mechanized and intensive production, has led to higher reliance on nitrogen fertilizer, thereby increasing nitrogen emissions. The nitrogen footprint in the Southwestern Mountain Corn Region remains relatively stable, at around 60 kg, ranking second. This stability reflects the region’s relatively conservative agricultural model. Although some intensive farming practices are adopted, geographical and climatic constraints help maintain lower nitrogen footprints. As a result, the Southwestern Mountain Region has exhibited minimal fluctuation in nitrogen footprints over time, maintaining a stable emission trend. It is worth noting that precipitation and irrigation patterns in different regions significantly affect the direct emissions of N2O (i.e., in formula 6). In Arid Zone such as Xinjiang and Gansu province, agricultural production is highly dependent on irrigation, and frequent irrigation drying cycles create an environment conducive to promoting microbial activity, significantly increasing the N2O emission coefficient per unit nitrogen fertilizer input. In contrast, the natural precipitation in Semi humid Zone is relatively uniform, the soil moisture fluctuation is small, and N2O emission coefficient is relatively stable; The abundant precipitation in humid areas (such as the southwestern mountains) may increase the risk of nitrogen leaching, but the sustained high soil moisture inhibits the rate of N2O generation. In addition, although the film mulching drip irrigation technology in the Northwestern Irrigated Corn Region can reduce water evaporation, the high-temperature and high humidity microenvironment under the film may further amplify the activity of nitrifying bacteria, leading to a sustained high nitrogen footprint.
Based on the analysis of the weighted nitrogen footprint by humidity zones, precipitation and humidity are important factors influencing nitrogen emissions. In the Arid Zone, the weighted nitrogen footprint per unit area has consistently remained the highest, showing a trend of first decreasing and then increasing. By 2023, nitrogen emissions in the Arid Zone reached 91.7 kg/ha, almost the same as in the Northwestern Irrigated Corn Region. This phenomenon is closely related to the region’s reliance on irrigation for agricultural production. Due to the extremely limited precipitation, agricultural production in the Arid Zone heavily depends on irrigation systems, during which large amounts of nitrogen fertilizer are used to compensate for the nitrogen deficiency in the soil. Excessive nitrogen fertilizer applied during irrigation tends to be lost through water runoff, evaporation, or seepage, thereby increasing nitrogen emissions. Additionally, due to the harsh climate conditions and shorter growing seasons in the Arid Zone, farmers need to invest more and apply fertilizers frequently to increase corn production. This high-intensity farming approach further contributes to the increase in nitrogen emissions. Although earlier optimization of fertilization management and improvements in irrigation technology may have led to a decrease in nitrogen footprints, nitrogen emissions began to rise again with the intensifying effects of climate change and increased agricultural production demands, eventually peaking in 2023.
In contrast, the weighted nitrogen footprints in the Semi-arid and Semi-humid Zone follow closely behind. From 2013 to 2014, the nitrogen emissions in the Semi-humid Zone were lower than those in the Arid Zone, reflecting the relatively mild climate and lower irrigation needs of the area. As agricultural technologies advanced and production methods transitioned, farming in the Semi-humid Zone became increasingly intensive and mechanized, leading to higher demand for fertilizers, especially nitrogen fertilizers. This, in turn, caused the nitrogen footprint per unit area to rise and eventually surpass that of the Arid Zone. The weighted nitrogen footprint per unit area in the Humid Zone has remained the lowest, around 40 kg/ha, roughly half that of the Arid Zone. This is because the Humid Zone experiences abundant rainfall, reducing the reliance on irrigation for agricultural production. The water resources in the Humid Zone provide adequate conditions for crop growth, allowing crops to absorb nitrogen more efficiently from the soil, thereby reducing excessive fertilizer use and nitrogen losses. Compared to the Arid and Semi-arid Zone, agricultural production in the Humid Zone does not require excessive fertilizer, particularly nitrogen fertilizers, which effectively reduces nitrogen emissions. This also indicates that agricultural production in the Humid Zone is more efficient in terms of water resource and nitrogen fertilizer management, with relatively less environmental impact compared to the Arid and Semi-arid Zone.
3.4 The comparison between carbon footprint and nitrogen footprint
Carbon footprint refers to the total amount of carbon dioxide and other greenhouse gas emissions directly or indirectly generated by individuals, organizations, activities, or products throughout their entire lifecycle, usually measured in carbon dioxide equivalents. It focuses on the impact of these greenhouse gas emissions on climate change, covering energy consumption, industrial production, transportation, waste disposal, and other aspects. The nitrogen footprint refers to the total amount of migration and transformation of nitrogen elements in the environment directly or indirectly caused by human activities, mainly involving the emission and cycling of active nitrogen such as ammonia, nitrate, nitrogen oxides, etc. It focuses on the impact of nitrogen pollution on ecosystems, such as eutrophication of water bodies, soil degradation, ozone layer depletion, etc. Carbon nitrogen footprint is a comprehensive consideration of carbon footprint and nitrogen footprint, emphasizing the synergistic effects and interrelationships between the two in the process of energy conservation and emission reduction. It analyzes the coupling relationship between carbon emissions and nitrogen emissions, such as the simultaneous production of carbon dioxide and nitrogen oxides in certain activities such as fossil fuel combustion, which need to be synchronously controlled to reduce the composite impact on climate and environment. Its core is to evaluate the dual effects of human activities on climate and ecosystems from a comprehensive perspective, and promote the coordinated governance of carbon reduction and nitrogen control.
Specifically, based on the calculations in this study, the carbon footprint (CF) was highest in the Northwestern Irrigated Corn Region (about 2,000 kg CE/ha) and Arid/Semi-arid Zone (1,575–1,606 kg CE/ha), while the Semi-humid Zone exhibited the lowest CF (about 50% lower than Arid Zone). For the nitrogen footprint (NF), the Northwestern Irrigated Corn Region (91.6 kg N-eq/ha) and Arid Zone (91.7 kg N-eq/ha) showed the highest values, contrasting sharply with the Humid Zone, which had the lowest NF (about 40 kg N-eq/ha, 54% lower than Arid Zone). The spatial disparity between the highest and lowest CF reached about 100% (Northwestern Irrigated Corn Region vs. Semi-humid Zone), while the NF gap was even more pronounced, with Arid Zone exceeding humid regions by about 129%. These differences highlight the critical role of regional irrigation dependence, climate conditions, and intensive farming practices in driving environmental footprints.
3.5 Results of scenario simulation
Based on the government’s corn regional planning and humidity zones, the changes in unit area weighted carbon footprint and nitrogen footprint under three scenarios show significant regularity (Tables 2, 3). In terms of carbon footprint, in the scenario of expanding corn-producing areas, as the carbon footprint per unit area is not affected by the adjustment of planting scale, the values in each region remain consistent with the benchmark level in 2023. From an overall distribution perspective, the Northwestern Irrigated Corn Region and Semi-arid Zone in the humidity zone in the corn-producing ares have always been at a relatively high level (1,999 kg CE/ha and 1,606 kg CE/ha, respectively), which is closely related to the irrigation dependence in agricultural production in these regions. The Semi-humid Zone (891 kg CE/ha), on the other hand, maintains a relatively low level due to suitable climate conditions and relatively reasonable production inputs. After the implementation of the fertilizer reduction scenario, the carbon footprint per unit area of each region showed varying degrees of decline. Among them, the decline is more significant in the Southwestern Mountain Corn Region and Humid Zone in the corn-producing regions (from 943 kg CE/ha to 915 kg CE/ha in the Southwestern Mountain Corn Region, and from 941 kg CE/ha to 917 kg CE/ha in the Humid Zone), which is related to the high proportion of fertilizers in the carbon emission composition and the strong targeted reduction measures in these areas. As an important source of carbon emissions in agricultural production, the reasonable control of fertilizer usage directly promotes the reduction of carbon footprint per unit area, especially in areas with high fertilizer application intensity, where this emission reduction effect is more prominent. The impact of pesticide reduction scenarios on carbon footprint is relatively limited, and the overall emission reduction effect is weaker than that of fertilizer reduction scenarios. In the two zones, the Huang-Huai-Hai Plain Summer Corn Region, decreased from 971 kg CE/ha to 955 kg CE/ha, while the arid area in the Humid Zone decreased from 1,464 kg CE/ha to 1,450 kg CE/ha. Most other areas showed no significant changes. This is because pesticides account for a relatively low proportion of total agricultural carbon emissions, and the reduction in their use naturally has a less significant impact on the overall carbon footprint per unit area than the reduction in fertilizer use. The carbon footprint of more regions remains close to the baseline level.
Table 2. Weighted carbon footprint per unit area under different scenarios (kg CE/ha).
Table 3. Weighted nitrogen footprint per unit area regions under different scenarios (kg N-eq/ha).
From the changes in nitrogen footprint, the unit area nitrogen footprint of the corn-producing areas expansion scenario remains consistent with the baseline value in 2023. The nitrogen footprint in the Northwestern Irrigated Corn Region and the Arid Zone in the humidity zone of the corn-producing areas has always been high (both at 92 kg N-eq/ha), which is related to the extensive application of nitrogen fertilizer in these areas to increase production and the limited conditions for soil nitrogen transformation. In contrast, the Semi-humid Zone and other zones have relatively low nitrogen footprints (at 44 kg N-eq/ha) due to their high nitrogen fertilizer utilization efficiency. The scenario of reducing fertilizer usage has had a significant effect on reducing nitrogen footprint. The nitrogen footprint in each region showed a significant decrease, especially in the Southwestern Mountain Corn Region where it decreased from 59 kg N-eq/ha to 54 kg N-eq/ha, and in the Humid Zone where it decreased from 57 kg N-eq/ha to 53 kg N-eq/ha, with a consistent downward trend. This result is directly related to the differentiated regulation of fertilizers in the scenario, especially the precise reduction of nitrogen fertilizer - as the core influencing factor of nitrogen cycle, the reasonable control of nitrogen fertilizer usage effectively reduces nitrogen loss and related emissions, thereby significantly reducing the unit area nitrogen footprint. The nitrogen fertilizer reduction ratio formulated by different regions based on soil fertility and production demand maximizes the nitrogen reduction effect while ensuring stable yield. In contrast, the nitrogen footprint under the scenario of pesticide reduction showed almost no significant change, and the values in most regions were basically the same as those under the scenario of planting area expansion. For example, the Northern Spring Corn Region in the corn-producing regions maintained 46 kg N-eq/ha, and the Semi-humid Zone maintained 44 kg N-eq/ha. This is because the main function of pesticides is to prevent and control pests and diseases, and their impact on the transformation and emission of nitrogen is relatively small. The reduction of their usage is difficult to have a substantial impact on the nitrogen footprint, and therefore cannot touch the core link of the nitrogen cycle like the reduction of fertilizer.
Overall, the effect of fertilizer reduction scenario on reducing nitrogen footprint is significantly better than that of pesticide reduction scenario. This difference precisely confirms the key position of fertilizers (especially nitrogen fertilizers) in the nitrogen cycle - the control of fertilizers can directly affect nitrogen related emission processes, while pesticide reduction is difficult to achieve this effect. Therefore, there is a clear causal relationship between the nitrogen footprint reduction effect of fertilizer reduction scenario and the targeted regulation of fertilizers, which also provides an important basis for regional development of differentiated agricultural emission reduction strategies.
4 Discussion
4.1 Policy implications and recommendations
This study integrates national policy guidance with regional resource endowment characteristics to propose differentiated carbon reduction pathways for China’s four major corn-producing regions, aiming to achieve the coordinated development of food security and low-carbon agriculture. The following recommendations, which combine various policy frameworks, emphasize the core role of technological adaptation and policy synergy:
4.1.1 Northern Spring Corn Region: black soil protection and smart agricultural technology integration
Northern Spring Corn Region, should rely on the “Northeast Black Soil Conservation Tillage Action Plan” (Ministry of Agriculture and Rural Affairs, 2024b) and the “National Smart Agriculture Action Plan (2024–2028)” (Ministry of Agriculture and Rural Affairs, 2024a) to establish a “conservation tillage + digital management” system. The promotion of no-till technologies with straw cover, achieved through mechanical straw crushing and surface coverage, will reduce soil erosion and enhance soil organic carbon sequestration. At the same time, the integration of Beidou navigation unmanned seeding machines and multispectral remote sensing monitoring systems can dynamically detect soil moisture and nutrient distribution. Artificial intelligence algorithms can generate field-specific fertilization prescriptions to optimize the nitrogen, phosphorus, and potassium ratio and reduce fertilizer overuse. In terms of agricultural machinery upgrades, the transition from traditional diesel-powered machinery to electric equipment should be promoted. The “14th Five-Year Renewable Energy Development Plan” (National Development and Reform Commission (NDRC), 2022a) suggests building distributed photovoltaic power stations on the marginal areas of farmland to provide clean energy for smart agricultural machinery and irrigation facilities, gradually replacing fossil fuel dependence. From a policy perspective, it is recommended that the effectiveness of black soil protection be incorporated into the farmland fertility subsidy assessment system. Farmers adopting no-till technologies should receive tiered subsidies, and soil carbon sequestration should be converted into farmer income through carbon trading mechanisms, forming a “technology promotion - ecological compensation - market incentives” closed loop.
4.1.2 Huang-Huai-Hai Plain Summer Corn Region: circular agriculture system and climate adaptation enhancement
Huang-Huai-Hai Plain Summer Corn Region, with high crop rotation indices and frequent climate fluctuations, needs to rely on the “14th Five-Year Circular Economy Development Plan” (National Development and Reform Commission (NDRC), 2022b) and the “National Climate Change Adaptation Strategy 2035” (People's Government of the People's Republic of China, 2022) to create a “crop-livestock integration - resource recycling - risk mitigation” model. Promoting the coordinated treatment of corn straw and livestock manure, building regional biogas projects to replace coal usage in rural areas, and reducing carbon emissions from domestic energy use should be prioritized. The slurry and digestate can be used for soil improvement to reduce fertilizer dependence. In response to frequent extreme rainfall and drought, the promotion of drought- and flood-resistant corn varieties (such as drought-tolerant and flood-tolerant gene types), along with underground drainage systems and meteorological index insurance mechanisms, will reduce disaster emergency investments. Additionally, in line with the “Opinions on Establishing and Improving the Mechanism for Realizing the Value of Ecological Products,” the benefits of carbon sequestration in farmland ecosystems should be included in agricultural subsidies, encouraging farmers to adopt low-carbon agricultural practices. Establishing provincial-level agricultural climate resilience service centers to provide disaster early warning, technical training, and carbon footprint assessment services will help enhance the stability of regional production systems.
4.1.3 Northwestern Irrigated Corn Region: low-carbon water-saving irrigation system and dryland technology integration
Northwestern Irrigated Corn Region, with its high dependence on high-energy irrigation models, needs to follow the “14th Five-Year Water-Saving Society Construction Plan” (National Development and Reform Commission (NDRC), 2022c) and the “2021 Organic Dryland Agriculture Development Work Plan” (The People's Government of Shanxi Province, 2022) to implement “photovoltaic irrigation + precision water-saving” systemic reforms. The promotion of photovoltaic-drip irrigation coupling technologies, powered by distributed photovoltaic power stations, will gradually replace traditional diesel pumps, reducing energy consumption per irrigation. Concurrently, technologies like membrane-covered drip irrigation and water-fertilizer integration should be promoted to optimize water resource use efficiency, reducing deep leakage and evaporation losses. In arid areas with annual precipitation below 350 mm, biodegradable mulch for dryland technology should be promoted, along with the selection of drought-tolerant corn varieties with deep root systems to reduce irrigation dependence. Policy-wise, it is suggested to include photovoltaic water-saving projects in the renewable energy subsidy list and provide special subsidies for farmers adopting dryland techniques. Additionally, a “water-energy-grain” collaborative management platform should be established to integrate the resources of water, energy, and agricultural sectors, achieving smart matching between irrigation scheduling and energy supply.
4.1.4 Southwestern Mountain Corn Region: moderate planting under ecological constraints and low-carbon industry chain extension
Southwestern Mountain Corn Region is constrained by fragmented terrain and ecological fragility. The “Ecological Protection Compensation Regulations” (People's Government of the People's Republic of China, 2024) and the “Opinions on Accelerating the Green Transformation of Economic and Social Development” (People’s Government of the People’s Republic of China, 2024) should serve as the framework for constructing an “ecological protection—moderate planting—green processing” collaborative system. Strictly defining no-planting zones within ecological red lines and compensating farmers for carbon sequestration in afforestation areas will incentivize ecological restoration. In arable areas, the promotion of contour line planting and terracing, along with a corn-legume intercropping model, will reduce fertilizer use through biological nitrogen fixation. In the processing sector, enterprises should be supported in adopting low-temperature drying and bioenzymatic technologies to reduce energy consumption and carbon emissions. Additionally, in line with the “Implementation Opinions on Promoting Rural Energy Transformation for Rural Revitalization” (People's Government of the People's Republic of China, 2022), the promotion of straw-based fuel and household biogas dual supply models will replace coal use, achieving low-carbonization across the entire planting-processing-living chain. A mountain agriculture green transformation fund should be established to provide financial support for eco-friendly technology applications, and a cross-province carbon trading coordination mechanism should be created to promote the sharing of ecological benefits across regions.
4.1.5 Cross-regional collaborative mechanism: policy integration and technological innovation network
To achieve collaborative carbon reduction goals across the four major production areas, it is necessary to construct a multi-level policy support system based on the “Agricultural Emissions and Carbon Sequestration Implementation Plan” (Ministry of Agriculture and Rural Affairs, 2022b) and the “National Carbon Emissions Trading Market Construction Plan (Power Sector)” (Sichuan Provincial Development and Reform Commission, 2018). Agricultural carbon sequestration (such as soil carbon sequestration and biogas substitution) should be included in carbon trading pilot programs to enable market-based monetization of emissions reductions. Simultaneously, a “Corn Major Production Area Green Technology Alliance” should be established to promote the diffusion of photovoltaic irrigation technologies from the northwest to the Huanghuai region and the adaptation of smart farming technologies from the north to the southwest mountainous areas. Building on the “Digital Agriculture and Rural Development Plan” (Ministry of Agriculture and Rural Affairs, 2020), a corn carbon footprint monitoring platform should be developed, integrating IoT and blockchain technologies to enable traceability of carbon emissions throughout the entire life cycle and provide data support for precise policy regulation. Through these pathways, it is possible to promote the transformation of the four major corn-producing regions toward the “high production—low carbon—high resilience” triad goal while ensuring national food security and contributing to global agricultural sustainability with a Chinese solution.
4.2 Comparison with existing studies
This study systematically integrates regional differentiation and dynamic policy simulation to address the limitations of existing research on agricultural carbon and nitrogen footprints, while establishing connections with and expanding upon key findings in the literature.
This study covers 20 major corn-producing provinces and innovatively adopts dual classification criteria—governmental corn regional planning and humidity zones—to reveal spatial heterogeneity. For example, our finding that the Northwestern Irrigated Corn Region and arid zones exhibit the highest carbon and nitrogen footprints (about 2,000 kg CE/ha and about 91.7 kg N-eq/ha) aligns with localized studies on straw returning rate in Xinjiang and Gansu (Zong et al., 2020), but further quantifies these trends across broader macro-regions. This complements province-specific studies by demonstrating that arid/semi-arid regions consistently outperform humid regions in emissions by 100%–129%, a pattern not fully captured in smaller-scale analyses.
Methodologically, this study advances the field by combining life cycle assessment with area-weighted calculations to account for regional scale differences, then introducing policy-driven scenario simulations. For instance, our scenario 2 (fertilizer reduction) shows a 76.7% emission reduction in the Huang-Huai-Hai region, which directly validates the effectiveness of targeted fertilizer management proposed in national action plans (Ministry of Agriculture and Rural Affairs, 2022a) but adds nuance by revealing that reduction potential varies by region (e.g., 72.1% in the Southwest vs. 5% in the Northwest). This dynamic approach addresses the static limitations of earlier studies (Zhou et al., 2022; Chen et al., 2021), which could not capture how policy interventions interact with regional resource endowments.
Regarding policy relevance, our differentiated pathways—such as photovoltaic irrigation for the Northwest and contour planting for the Southwest—respond to region-specific constraints identified in the literature [e.g., water scarcity in Xinjiang (National Development and Reform Commission (NDRC), 2022c) or terrain fragmentation in Yunnan (Jiang et al., 2025)]. This bridges the gap between technology-focused studies and policy implementation, as highlighted in the “Agricultural Emission Reduction Plan” (National Development and Reform Commission, Price Bureau, 2015–2024).
In summary, this study expands upon existing research by: (1) applying different classification rules to scale the analysis from the local to the national level; (2) introducing dynamic scenario modeling to link policies with emissions; and (3) proposing regionally tailored strategies based on empirical data. These advancements not only validate the key findings of previous localized studies but also address their limitations in terms of scope, methodology, and policy applicability.
4.3 Limitations of this study
Despite the contributions of this study, several limitations remain. Firstly, although this study utilizes various data and scenario simulations to estimate potential changes in carbon and nitrogen footprints across different regions, the carbon emission model primarily relies on hypothetical scenarios and does not fully account for sudden events, such as extreme weather, natural disasters, and the 2020 COVID-19 pandemic, which may directly affect production systems, potentially leading to biased results. Secondly, due to data availability, the study mainly uses historical statistical data from 2014 to 2023, which may not fully reflect the latest agricultural policies and technological advancements, particularly in regions experiencing rapid policy changes. Finally, this study does not comprehensively evaluate the economic benefits and feasibility of various low-carbon technologies, especially in poorer regions and areas with high ecological risks. Additionally, the calculation of carbon and nitrogen footprints in this study only considers indirect emissions during the production phase, without including direct emissions, changes in organic carbon (such as straw returning and the application of organic fertilizers), or downstream stages such as transportation and sales, which introduces certain limitations to the overall estimation of carbon emissions.
4.4 Future research direction
Future research should take several targeted directions to address these limitations and deepen the understanding of carbon and nitrogen emissions in agriculture. First, to account for sudden disturbances such as extreme weather and natural disasters, future studies could incorporate dynamic climate-agriculture interaction models, such as agro-meteorological simulation systems or stochastic impact models, to better capture real-time emission variability. Second, expanding the boundary of analysis beyond the production phase is necessary. Future work should adopt full life-cycle assessment (LCA) approaches to quantify emissions from transportation, processing, storage, and sales stages, possibly by integrating remote sensing and supply chain databases. Third, economic feasibility and adoption potential of low-carbon technologies should be assessed using cost–benefit analysis, behavioral adoption models, and regional case studies, particularly in vulnerable regions with limited resources or high ecological pressure. Lastly, future research could explore advanced regional classification methods, such as clustering based on land productivity, climate risk, or input-intensity. This would allow for a more precise matching between emission profiles and mitigation strategies, supporting region-specific management policies.
In addition, future research could further integrate data-driven methods with policy simulation tools to enhance the prediction of dynamic changes in agricultural carbon and nitrogen emissions and improve responsiveness to policy scenarios. For example, advanced machine learning techniques could be introduced to capture nonlinear patterns in complex agricultural systems, thereby improving model generalization and predictive performance. Meanwhile, incorporating uncertainty modeling approaches—such as Monte Carlo simulations—by applying stochastic perturbations to key parameters could strengthen the model’s adaptability to real-world complexities. This would allow for a more comprehensive assessment of the performance of different mitigation pathways under various external conditions, ultimately enhancing the robustness and practical relevance of policy recommendations. Such improvements would provide strong support for developing region-specific and actionable agricultural emission reduction strategies.
5 Conclusion
This study quantifies carbon and nitrogen footprints of China’s major corn-producing regions (2014–2023) using the life cycle assessment and area-weighted approach, supplemented by scenario simulations of corn-producing areas expansion, fertilizer reduction, and pesticide reduction. Targeted low-carbon strategies are proposed based on regional heterogeneity, with key conclusions as follows:
1. Based on two classification rules (government’s corn regional planning and humidity zones), the Northwestern Irrigated Corn Region, arid, and semi-arid regions exhibit higher carbon footprints, while the Northwestern Irrigated Corn Region and arid areas have the highest nitrogen footprints. These patterns are driven by regional climate, irrigation practices, and intensive farming, aligning with real-world conditions.
2. Scenario simulations show that the corn-producing areas expansion scenario does not affect the weighted carbon and nitrogen footprints per unit area, and it is thus used as the baseline. However, due to regional variations in the demand for fertilizers and pesticides, the emission reduction potential of fertilizer and pesticide reduction differs. With respect to nitrogen footprint, compared to pesticide reduction, fertilizer reduction, especially nitrogen fertilizer reduction, has a significantly greater impact on reducing nitrogen emissions.
3. Differentiated carbon reduction pathways are recommended: (i) integrate black soil conservation and smart agriculture in the Northern Spring Corn Region; (ii) develop circular agriculture and climate resilience in the Huang-Huai-Hai Plain Summer Corn Region; (iii) promote low-carbon irrigation systems in the Northwestern Irrigated Region; (iv) adopt moderate planting and low-carbon industrial chain extension in the Southwestern Mountainous Region.
Data availability statement
The data analyzed in this study is subject to the following licenses/restrictions: Data will be made available on request. Requests to access these datasets should be directed to c2h1d2FuZ0BqbnUuZWR1LmNu.
Author contributions
JZ: Conceptualization, Data curation, Formal analysis, Methodology, Resources, Software, Validation, Visualization, Writing – original draft. FY: Conceptualization, Data curation, Formal analysis, Methodology, Visualization, Writing – original draft. YZ: Formal analysis, Methodology, Resources, Writing – review & editing. SW: Funding acquisition, Project administration, Supervision, Validation, Writing – review & editing.
Funding
The author(s) declare that financial support was received for the research and/or publication of this article. This research was supported by Jinan University Enterprise Development Research Institute 2023 Annual Research Project (QF20230902), Jinan University-“Challenge Cup” and extracurricular academic, scientific, technological innovation, and entrepreneurship competition projects (Grant No. 20242020), Guangdong Province College Students “Innovation and Entrepreneurship Training Program Supported Project (S202510559168), The Special Funds for Cultivation of Guangdong College Students” Scientific and Technological Innovation (pdjh2025bg035).
Conflict of interest
The authors declare that the research was conducted in the absence of any commercial or financial relationships that could be construed as a potential conflict of interest.
Generative AI statement
The author(s) declare that no Gen AI was used in the creation of this manuscript.
Publisher’s note
All claims expressed in this article are solely those of the authors and do not necessarily represent those of their affiliated organizations, or those of the publisher, the editors and the reviewers. Any product that may be evaluated in this article, or claim that may be made by its manufacturer, is not guaranteed or endorsed by the publisher.
Supplementary material
The Supplementary material for this article can be found online at: https://www.frontiersin.org/articles/10.3389/fsufs.2025.1647853/full#supplementary-material
References
Chao, X. (2023). Silage corn: an environmentally friendly feed option for sustainable animal husbandry. Geograph. Res. Bull. 2, 211–214. doi: 10.50908/grb.2.0_211
Chen, B., Cui, J., Dong, W., and Yan, C. (2023). Effects of biodegradable plastic film on carbon footprint of crop production. Agriculture 13:816. doi: 10.3390/agriculture13040816
Chen, X., Ma, C., Zhou, H., Liu, Y., Huang, X., Wang, M., et al. (2021). Identifying the main crops and key factors determining the carbon footprint of crop production in China, 2001–2018. Resour. Conserv. Recycl. 172:105661. doi: 10.1016/j.resconrec.2021.105661
Chen, Z., Xu, C., Ji, L., and Fang, F. (2023). Carbon and nitrogen footprint analysis of double cropping rice production in the Yangtze River basin based on farmer surveys: a case study of Jiangxi and Hunan provinces. Crop Mag. 2, 229–237. doi: 10.16035/j.issn.1001-7283.2023.02.033
Chen, Z., Xu, C., Ji, L., Feng, J., Li, F., Zhou, X., et al. (2020). Effects of multi-cropping system on temporal and spatial distribution of carbon and nitrogen footprint of major crops in China. Glob. Ecol. Conservat. 22, –e00895. doi: 10.1016/j.gecco.2019.e00895
China Statistics Press. Price Department of National Development and Reform Commission Compilation of National Agricultural Product Beneficial Capital Cost Collection (2015–2024).
Corsato Alvarenga, I., Dainton, A. N., and Aldrich, C. G. A. (2022). Review: nutrition and process attributes of corn in pet foods. Crit. Rev. Food Sci. Nutr. 62, 8567–8576. doi: 10.1080/10408398.2021.1931020
Cui, H. Y., Sciligo, A., Tan, X. L., Hui, C., Zhang, Y. S., Li, W., et al. (2024). Dynamic trends in corn diseases and pests across six regions in China over two decades. Crop Prot. 186:106930. doi: 10.1016/j.cropro.2024.106930
Du, Y., Liu, H., Huang, H., and Li, X. (2023). The carbon emission reduction effect of agricultural policy——evidence from China. J. Clean. Prod. 406:137005. doi: 10.1016/j.jclepro.2023.137005
Erenstein, O., Jaleta, M., Sonder, K., Mottaleb, K., and Prasanna, B. M. (2022). Global corn production, consumption and trade: trends and R&D implications. Food Secur. 14, 1295–1319. doi: 10.1007/s12571-022-01288-7
Fang, F. (2022). The layout and optimization of modern seed industry in China. Mol. Plant Breed. 20, 6957–6960. doi: 10.13271/j.mpb.020.006957 (In Chinese)
FAO, FAO statistical database. Available online at: https://www.fao.org/faostat/zh/#data/QCL (Access July 16, 2025).
Guo, L., Guo, S., Tang, M., Su, M., and Li, H. (2022). Financial support for agriculture, chemical fertilizer use, and carbon emissions from agricultural production in China. Int. J. Environ. Res. Public Health 19:7155. doi: 10.3390/ijerph19127155
Guo, Y., and Wang, J. (2021). Spatiotemporal changes of chemical fertilizer application and its environmental risks in China from 2000 to 2019. Int. J. Environ. Res. Public Health 18:11911. doi: 10.3390/ijerph182211911
Guo, H., Xie, S., and Pan, C. (2021). The impact of planting industry structural changes on carbon emissions in the three northeast provinces of China. Int. J. Environ. Res. Public Health 18:705. doi: 10.3390/ijerph18020705
Hu, Y., and Liu, Y. (2024). Impact of fertilizer and pesticide reductions on land use in China based on crop-land integrated model. Land Use Policy 141:107155. doi: 10.1016/j.landusepol.2024.107155
Huang, X., Xu, X., Wang, Q., Zhang, L., Gao, X., and Chen, L. (2019). Assessment of agricultural carbon emissions and their spatiotemporal changes in China, 1997–2016. Int. J. Environ. Res. Public Health 16:3105. doi: 10.3390/ijerph16173105
Intergovernmental Panel on Climate Change. Available online at: https://www.ipcc.ch/report2019-refinement-to-the-2006-ipcc-guidelines-for-national-greenhouse-gasinventories/ (Accessed May 16, 2025).
Ji, G., Ji, H., Cheng, K., Liu, M., Jiang, Y., Hu, Z., et al. (2024). Comprehensive evaluation of carbon footprint and economic benefits of rice planting methods in Jiangsu Province. J. Soil Sci. 61, 1042–1054. doi: 10.11766/trxb202212180695 (In Chinese)
Jiang, J., Hu, Z., Sun, W., and Huang, Y. (2010). Nitrous oxide emissions from Chinese cropland fertilized with a range of slow-release nitrogen compounds. Agric. Ecosyst. Environ. 135, 216–225. doi: 10.1016/j.agee.2009.09.014
Jiang, Y., Li, H., Ma, W., Yu, W., Chen, J., Gao, Y., et al. (2025). A meta-analysis of the effects of nitrogen fertilizer application on corn (Zea mays L.) yield in Northwest China. Front. Plant Sci. 15:1485237. doi: 10.3389/fpls.2024.1485237
Kong, F., Wu, Y., Cui, S., Wang, X., Wei, G., Liu, Q., et al. (2022). Effect of chemical fertilizer application on corn production in China over the past 15 years: a meta-analysis. Agronomy 12:3005. doi: 10.3390/agronomy12123005
Kopparapu, N. K., Duan, Y., Huang, L., and Katrolia, P. (2022). Review on utilisation of corn gluten meal, a by-product from corn starch industry for production of value-added products. Int. J. Food Sci. Technol. 57, 5592–5599. doi: 10.1111/ijfs.15541
Li, R. C., Tian, Y. G., Wang, F., Sun, Y. F., Lin, B. J., Dang, Y. P., et al. (2024). Optimizing the rate of straw returning to balance trade-offs between carbon emission budget and rice yield in China. Sustain. Product. Consum. 47, 166–177. doi: 10.1016/j.spc.2024.03.026
Liang, H. (2024). Carbon Footprint and Nitrogen Footprint, Mitigation Potentials and Management Approaches of Maize Production in Inner Mongolia (doctoral thesis Inner Mongolia Agricultural University) doi: 10.27229/d.cnki.gnmnu.2024.000052
Liang, B. C., Macdonald, J. D., Thiagarajan, A., Flemming, C., Cerkowniak, D., and Desjardins, R. (2020). Developing a country specific method for estimating nitrous oxide emissions from agricultural soils in Canada. Nutr. Cycl. Agroecosyst. 11, 145–167. doi: 10.1007/s10705-020-10058-w
Liang, L., Wang, H., Huai, H., and Tang, X. (2024). Study of the decoupling patterns between agricultural development and agricultural carbon emissions in Beijing Tianjin Hebei region from 2000 to 2020. Land 13:839. doi: 10.3390/land13060839
Lin, Z., Dai, Q., Ye, S., Wu, F., Jia, Y., Chen, J., et al. (2012). Effects of nitrogen application levels on ammonia volatilization and nitrogen utilization during rice growing season. Rice Sci. 19, 125–134. doi: 10.1016/S1672-6308(12)60031-6
Luo, X., Guo, Y., Wang, R., Wang, N., Li, C., Chu, X., et al. (2021). Carbon footprint of a winter wheat-summer corn cropping system under straw and plastic film mulching in the loess plateau of China. Sci. Total Environ. 794:148590. doi: 10.1016/j.scitotenv.2021.148590
Ministry of Agriculture and Rural Affairs. (2020). Digital rural development plan for agriculture and rural areas (2019–2025). Available online at: http://www.moa.gov.cn/govpublic/FZJHS/202001/t20200120_6336316.htm (Accessed May 16, 2025).
Ministry of Agriculture and Rural Affairs. (2024a). Ministry of Agriculture and rural affairs. Notice on the issuance of the National Smart Agriculture Action Plan (2024–2028). Available online at: http://www.moa.gov.cn/govpublic/SCYJJXXS/202410/t20241025_6465041.htm (Accessed May 16, 2025).
Ministry of Agriculture and Rural Affairs. (2021). Notice on the issuance of the National Plan for the development of planting industry during the 14th five-year plan period by the Ministry of Agriculture and rural affairs. Available online at: http://www.moa.gov.cn/govpublic/ZZYGLS/202201/t20220113_6386808.htm (Accessed on May 16, 2025).
Ministry of Agriculture and Rural Affairs. (2022a). Notice on the issuance of the "action plan for reducing chemical fertilizer use by 2025" and the "action plan for reducing chemical pesticide use by 2025". Available online at: http://www.moa.gov.cn/govpublic/ZZYGLS/202212/t20221201_6416398.htm (Accessed May 16, 2025).
Ministry of Agriculture and Rural Affairs. (2024b). Ministry of agriculture and rural affairs has released the 2023 action plan and technical guidelines for conservation tillage and black soil protection in Northeast China. Available online at: http://www.moa.gov.cn/govpublic/SCYJJXXS/202410/t20241025_6465041.htm (Accessed May 16, 2025).
Ministry of Agriculture and Rural Affairs. (2022b). Implementation plan for emission reduction and carbon sequestration in rural and agricultural sectors. Available online at: http://www.moa.gov.cn/govpublic/KJJYS/202206/P020220630331656855638.pdf (Accessed May 16, 2025)
National Development and Reform Commission (NDRC). (2022a). 14th five-year plan for the development of renewable energy. Available online at: https://www.ndrc.gov.cn/xxgk/zcfb/ghwb/202206/P020220602315308557623.pdf (Accessed May 16, 2025).
National Development and Reform Commission (NDRC). (2022b). 14th five-year plan for circular economy development. Available online at: https://www.ndrc.gov.cn/xxgk/zcfb/ghwb/202206/P020220602315308557623.pdf (Accessed May 16, 2025).
National Development and Reform Commission (NDRC). (2022c). 14th five-year plan for building a water-saving society. Available online at: https://www.ndrc.gov.cn/xxgk/zcfb/ghwb/202111/P020211108630238124208.pdf (Accessed May 16, 2025).
National Development and Reform Commission, Price Bureau (2015–2024). Compilation of cost and resource materials for National Agricultural Products. Beijing: China Statistical Press.
Ouyang, S., Hu, J., Yang, M., Yao, M., and Lin, J. (2022). Temporal and regional differences and empirical analysis on sensitive factors of the corn production cost in China. Appl. Sci. 12:1202. doi: 10.3390/app12031202
Pang, J., Li, H., Lu, C., Lu, C., and Chen, X. (2020). Regional differences and dynamic evolution of carbon emission intensity of agriculture production in China. Int. J. Environ. Res. Public Health 17:7541. doi: 10.3390/ijerph17207541
People’s Government of the People’s Republic of China. The opinions of the central Committee of the Communist Party of China and the state council on accelerating the comprehensive green transition of economic and social development. Available online at: https://www.gov.cn/zhengce/202408/content_6967663.htm (Accessed May 16, 2025).
People's Government of the People's Republic of China. Notice on the issuance of the National Adaptation Strategy to climate change 2035. Available online at: https://www.gov.cn/zhengce/zhengceku/2022-06/14/content_5695555.htm (Accessed May 16, 2025).
People's Government of the People's Republic of China. Ecological protection incentive regulations. Available online at: https://www.gov.cn/zhengce/content/202404/content_6944394.htm (Accessed May 16, 2025).
People's Government of the People's Republic of China. Notice on the issuance of the implementation opinions to accelerate the transformation and development of rural energy and support rural revitalization. Available online at: https://www.gov.cn/zhengce/zhengceku/2022-01/07/content_5666809.htm (Accessed May 16, 2025).
People's Government of the People's Republic of China, Actively overcoming adverse factors such as drought to achieve stable and abundant summer grain production nationwide. Available online at: https://www.gov.cn/yaowen/liebiao/202507/content_7031563.htm (Access May 16, 2025).
Qi, J., et al. (2018). Response of carbon footprint of spring corn production to cultivation patterns in the loess plateau, China. J. Clean. Prod. 187, 525–536. doi: 10.1016/j.jclepro.2018.02.184
Qin, J., Duan, W., Zou, S., Chen, Y., Huang, W., and Rosa, L. (2024). Global energy use and carbon emissions from irrigated agriculture. Nat. Commun. 15:3084. doi: 10.1038/s41467-024-47383-5
Sichuan Provincial Development and Reform Commission. Sichuan Province's implementation plan for the National Construction Plan of the carbon emissions trading market (electric power industry). Available online at: https://fgw.sc.gov.cn/sfgw/zcwj/2018/4/12/81484c7624e4405f8865fde7a0cb6751.shtml (Accessed May 16, 2025).
The Central People’s Government of the People’s Republic of China. Climate. Available online at: https://www.gov.cn/guoqing/2005-09/13/content_2582628.htm (Accessed May 16, 2025).
The People's Government of Shanxi Province. Notice on the issuance of the 2021 development plan for organic drought-resistant agriculture. Available online at: https://www.shanxi.gov.cn/zcwjk/bgtwj/202411/t20241126_9709729_wjkDetail.shtml (Accessed May 16, 2025).
Wang, L., Dong, S., Liu, P., Zhang, J., Zhao, B., and Zheng, F. (2018). The interactive effects of water and nitrogen addition on ammonia volatilization loss and yield of winter wheat. Chinese Journal of Applied Ecology 29, 1919–1927. doi: 10.13287/j.1001-9332.201806.026
Wang, S., Huang, X., Yin, C., and Richel, A. (2021). The effect of corn straw return on corn production in Northeast China: an integrated regional evaluation with meta - analysis and system dynamics. Resour. Conserv. Recycl. 167:105402. doi: 10.1016/j.resconrec.2021.105402
Wang, S., Liu, C., Han, L., Li, T., Yang, G., and Chen, T. (2022). Corn grain or corn silage: effects of the grain-to-fodder crop conversion program on farmers’ income in China. Agriculture 12:976. doi: 10.3390/agriculture12070976
Wang, S., Yin, C., Jiao, J., Yang, X., Shi, B., and Richel, A. (2022). StrawFeed model: an integrated model of straw feedstock supply chain for bioenergy in China. Resour. Conserv. Recycl. 185:106439. doi: 10.1016/j.resconrec.2022.106439
Wang, S., Yin, C., Li, F., and Richel, A. (2023). Innovative incentives can sustainably enhance the achievement of straw burning control in China. Sci. Total Environ. 857:159498. doi: 10.1016/j.scitotenv.2022.159498
Wang, S., Yin, C., Yang, X., and Richel, A. (2021). A critical review on the key issues and optimization of agricultural residue transportation. Biomass Bioenergy 146:105979. doi: 10.1016/j.biombioe.2021.105979
Wang, S., Yin, C., Yang, X., and Richel, A. (2023). Barter mode: the institutional innovation for affordable and clean energy (SDG7) in rural China. Biomass Bioenergy 170:106725. doi: 10.1016/j.biombioe.2023.106725
Wang, H., Zhang, Y., Zhang, Y., McDaniel, M. D., Sun, L., Su, W., et al. (2020). Water-saving irrigation is a ‘win-win’ management strategy in rice paddies–with both reduced greenhouse gas emissions and enhanced water use efficiency. Agric. Water Manag. 228:105889. doi: 10.1016/j.agwat.2019.105889
Wen, S., Hu, Y., and Liu, H. (2022). Measurement and spatial–temporal characteristics of agricultural carbon emission in China: an internal structural perspective. Agriculture 12:1749. doi: 10.3390/agriculture12111749
Wen, G., Yao, J., Han, Q., Li, P., Wang, Z., Zhang, C., et al. (2025). Spatial and Temporal Variation Characteristics and Driving Factors of Carbon and Nitrogen Footprint in Wheat and Maize Production Systems in Henan Province. Environ. Sci. 46, 1002–1015. doi: 10.13227/j.hjkx.202401099
Wu, H., MacDonald, G. K., Galloway, J. N., Zhang, L., Gao, L., Yang, L., et al. (2021). The influence of crop and chemical fertilizer combinations on greenhouse gas emissions: a partial life-cycle assessment of fertilizer production and use in China. Resour. Conserv. Recycl. 168:105303. doi: 10.1016/j.resconrec.2020.105303
Xiao, R., Feng, R. X., and Li, Y. D. (2022). Analysis of the new round of global food price surge. Chinese Finance 15, 58–59. (in Chinese)
Xin, L. (2022). Chemical fertilizer rate, use efficiency and reduction of cereal crops in China, 1998–2018. J. Geogr. Sci. 32, 65–78. doi: 10.1007/s11442-022-1936-2
Xu, X., Zhao, Q., Guo, J., Li, C., Li, J., Niu, K., et al. (2024). Inequality in agricultural greenhouse gas emissions intensity has risen in rural China from 1993 to 2020. Nat. Food 5, 916–928. doi: 10.1038/s43016-024-01071-1
Yang, L. (2024). Study on influencing factors of mulchingfilm residue in farmland and carbonfootprint evaluation of mulching filmresidue pollution reduction technology ingansu province (Master’s Thesis, Lanzhou University). doi: 10.27204/d.cnki.glzhu.2024.003957
Yao, Y., Bi, X., Li, C., Xu, X., Jing, L., and Chen, J. (2024). A united framework modeling of spatial-temporal characteristics for county-level agricultural carbon emission with an application to Hunan in China. J. Environ. Manag. 364:121321. doi: 10.1016/j.jenvman.2024.121321
Yin, W., Shi, Q., Guo, Y., Feng, F., Zhao, C., Yu, A., et al. (2016). Short-term response of farmland carbon emission to straw return, two-year plastic film mulching and intercropping. Chinese Journal of Eco-Agriculture 24.6, 716–724. doi: 10.13930/j.cnki.cjea.151309
Zhang, Y., Ge, M., Zhang, Q., Xue, S., Wei, F., and Sun, H. (2023). What did irrigation modernization in China bring to the evolution of water-energy-greenhouse gas emissions? Agric. Water Manag. 282:108283. doi: 10.1016/j.agwat.2023.108283
Zhang, Y., Gu, J. Y., Wang, C., Wang, W. L., Zhang, W. Y., Gu, J. F., et al. (2023). Carbon footprint of major grain crop production in the middle and lower reaches of the Yangtze River from 2011 to 2020. Chin. J. Appl. Ecol. 34, 3364–3372. doi: 10.13287/j.1001-9332.202312.027 (in Chinese)
Zhang, H., Hobbie, E. A., Feng, P., Niu, L. A., and Hu, K. (2022). Can conservation agriculture mitigate climate change and reduce environmental impacts for intensive cropping systems in North China plain? Sci. Total Environ. 806:151194. doi: 10.1016/j.scitotenv.2021.151194
Zhang, Q. Q., Ma, Z. R., Cai, Y. Y., Li, H. R., and Ying, G. G. (2021). Agricultural plastic pollution in China: generation of plastic debris and emission of phthalic acid esters from agricultural films. Environ. Sci. Technol. 55, 12459–12470. doi: 10.1021/acs.est.1c04369
Zhang, X., Zhang, J., and Yang, C. (2023). Spatio-temporal evolution of agricultural carbon emissions in China, 2000–2020. Sustainability 15:3347. doi: 10.3390/su15043347
Zheng, X., and Wang, Y. (2020). The current situation and trend of the development of compound fertilizer industry in China phosphate fertilizer and compound fertilizer. Eco-industry Science & Phosphorus Fluorine Engineering 35, 1–4.
Zhou, Y., Liu, K., Harrison, M. T., Fahad, S., Gong, S., Zhu, B., et al. (2022). Shifting rice cropping systems mitigates ecological footprints and enhances grain yield in Central China. Front. Plant Sci. 13:895402. doi: 10.3389/fpls.2022.895402
Zhu, Z. (1992). Characteristics of Agricultural Natural Resource Zoning and Planting Industry Layout in China. Natural Resources 1–8.
Zhu, Y., and Huo, C. (2022). The impact of agricultural production efficiency on agricultural carbon emissions in China. Energies 15:4464. doi: 10.3390/en15124464
Zhu, X., Liu, T., Xu, K., and Chen, C. (2022). The impact of high temperature and drought stress on the yield of major staple crops in northern China. J. Environ. Manag. 314:115092. doi: 10.1016/j.jenvman.2022.115092
Keywords: major corn producing areas, carbon footprint, nitrogen footprint, scenario simulation, life cycle assessment
Citation: Zhao J, Yang F, Zhang Y and Wang S (2025) Carbon and nitrogen footprints of major corn production systems in China. Front. Sustain. Food Syst. 9:1647853. doi: 10.3389/fsufs.2025.1647853
Edited by:
Liming Ye, Ghent University, BelgiumReviewed by:
Tao Sun, Shandong Academy of Agricultural Sciences, ChinaJing Kong, Hohai University, China
Copyright © 2025 Zhao, Yang, Zhang and Wang. This is an open-access article distributed under the terms of the Creative Commons Attribution License (CC BY). The use, distribution or reproduction in other forums is permitted, provided the original author(s) and the copyright owner(s) are credited and that the original publication in this journal is cited, in accordance with accepted academic practice. No use, distribution or reproduction is permitted which does not comply with these terms.
*Correspondence: Shu Wang, c2h1d2FuZ0BqbnUuZWR1LmNu