 Muhammad Fuad Anshori1,2*
 Bambang Sapta Purwoko3
 Nono Carsono4
 Iswari Saraswati Dewi5
 Willy Bayuardi Suwarno3
 Sintho Wahyuning Ardie3
 Abd Haris Bahrun1,2
 Achmad Kautsar Baharuddin2
 Purnama Isti Khaerani2
 Zeeshan Ali6
 Majed Alotaibi7
 Nawab Ali8
 Mahmoud F. Seleiman7
- 1Department of Agronomy, Faculty of Agriculture, Hasanuddin University, Makassar, Indonesia
- 2Rice Research Group, Faculty of Agriculture, Hasanuddin University, Makassar, Indonesia
- 3Department of Agronomy, Faculty of Agriculture, IPB University, Bogor, Indonesia
- 4Department of Crop Science, Faculty of Agriculture, Universitas Padjadjaran, Bandung, Indonesia
- 5Research Center for Food Crops, Research Organization for Agriculture and Food, National Research and Innovation Agency, Cibinong, Indonesia
- 6Department of Plant Breeding and Genetics, Faculty of Agriculture and Environment, The Islamia University of Bahawalpur, Bahawalpur, Pakistan
- 7Department of Plant Production, College of Food and Agriculture Sciences, King Saud University, Riyadh, Saudi Arabia
- 8Department of Biosystems and Agricultural Engineering (BAE), College of Agriculture and Natural Resources, Michigan State University, East Lansing, MI, United States
The development of effective selection criteria and models under hydroponic salinity screening can be used image-based phenotyping (IBP) and statistical analysis to detect double-haploid rice with high adaptability to saline environments. Therefore, this study aimed to identify the IBP selection criteria and develop a model for potential tolerance in double-haploid rice under hydroponic salinity screening. The experimental design was a split-plot randomized complete block design. The main plot was NaCl concentration (0 mM and 120 mM), and the subplots contained ten genotypes with three replications. Selection criteria and model development were identified systematically and comprehensively through the best linear unbiased estimation, stress tolerance index, principal component analysis, factor analysis, and selection index. In addition, validation was also carried out based on conventional morphological characteristics, physiology, Na + and K + contents, and yield in saline land. The results showed that there are two tolerance index models: a morphometric (geometric) index represented by the total area and green area, and a colorimetric index defined by the green area percentage, CIVE, and GLI. The interaction of these indices effectively mapped the double-haploid rice genotypes based on their tolerance levels and adaptability to salinity stress. The colorimetric index was a reliable indicator of the potential adaptability of double-haploid rice lines in saline fields. This study provides a novel approach for developing effective selection criteria and models for rice tolerance, especially double-haploid line, under hydroponic salinity screening, which can accelerate the identification of genotypes with high adaptability to saline environments.
1 Introduction
Rice development is a priority in maintaining global food security. This commodity is the main food source for most of the world’s population, particularly in Asia (Fukagawa and Ziska, 2019; Mohidem et al., 2022). However, this commodity faces various production challenges, including the impact of global warming (Arifah et al., 2022; Jamal et al., 2023). An increase in Earth’s temperature will induce an increase in sea level, which will indirectly increase salinity levels on land (Griggs and Reguero, 2021; Jabir et al., 2021; Mazhar et al., 2022; Olson et al., 2022). This is crucial for island regions, such as Indonesia (Rumanti et al., 2018; Anshori et al., 2021; Dewi et al., 2022). This impact is becoming more serious with expert changes in the function of agricultural land in buildings, so that agricultural areas lead to suboptimal areas, such as coastal areas (Azadi et al., 2021; Nong et al., 2021; Sekaranom et al., 2021). Rumanti et al. (2018), stated that 29% of the total rice land in Java (Indonesia’s rice production center) is located in coastal areas. This phenomenon reduces national rice production, which is correlated with a threat to food security in Indonesia (Rumanti et al., 2018; Anshori et al., 2021; Arifah et al., 2022). This will also have an increasingly negative impact on global warming, which will continue to occur dynamically (Rumanti et al., 2018). Therefore, the development of rice varieties that are tolerant and adaptive to salinity stress is crucial for mitigating the effects of global warming on rice cultivation in coastal areas.
The assembly of salinity stress-tolerant varieties is largely determined by three components: the screening method, selection environment, and selection characteristics (Reddy et al., 2017; Anshori et al., 2018; Singh et al., 2021). Screening approaches have been strongly linked to the critical phase of plants (Reddy et al., 2017; Wu et al., 2019; Chen et al., 2021; Farid et al., 2021; Singh et al., 2021; Afzal et al., 2023). According to a study by Bado et al. (2016), Gerona et al. (2019), and Singh et al. (2021), there are two critical phases in rice exposed to salinity: the early seedling and reproductive phases. However, the most widely used screening method is rapid screening in the seedling phase using the concept of hydroponics (Liu et al., 2019; Chen et al., 2020; Anshori et al., 2021; Arifuddin et al., 2021; Farid et al., 2021; Singh et al., 2021; Lutambi et al., 2024). This screening method was recommended by the IRRI for rapid salinity selection (Bado et al., 2016; Farid et al., 2021; Singh et al., 2021). The selection environment for this screening has also been reviewed and recommended as 12 dS/m (Anshori et al., 2021; Singh et al., 2021). However, this concept still needs development concerning the selection criteria. In general, tolerance levels are determined only by assessing the tolerance scores (Bado et al., 2016; Anshori et al., 2021). This is considered less objective when describing the tolerance level of a genotype. The tolerance score is considered a categorical approach in assessing tolerance potential (Purbajanti et al., 2019), whereas salinity stress is controlled by minor genes that are quantitative (Rahman et al., 2019; Kumar et al., 2022; Sugasi et al., 2024). In addition, salinity stress can induce other secondary stresses such as osmotic stress, ion homeostasis, and oxidative stress (Reddy et al., 2017; Wu et al., 2019). This phenomenon makes salinity tolerance patterns more complex (Erythrina et al., 2021). Moreover, tolerance during the seedling phase is not necessarily related to tolerance potential during the reproductive phase (Bado et al., 2016; Chen et al., 2021; Singh et al., 2021). Therefore, comprehensive selection criteria and models are required for screening hydroponic salinity.
The development of the selection criteria and models could not be separated from the included genotypes. Each genotype has a different genetic background and correlates with its selection response (Goldstein and Ehrenreich, 2021; Ćalić et al., 2022). The more homozygous the genetic construct of a genotype, the more additive is the selection response (Karavolias et al., 2020; Villiers et al., 2024). Thus, response patterns can be easily understood and inherited. This differs when selection is performed on genotypes with heterozygous genetic constructs, and the potential dominant variant determines the selection response. This reduces the consistency of the selection response for each generation (Liu et al., 2020; So et al., 2022; Li et al., 2023). One genotype with a highly homozygous genetic construct was the double haploid line. These lines result from chromosome doubling in haploid cells due to anther or ovule culture (Mishra and Rao, 2016; Ren et al., 2017; Niazian and Shariatpanahi, 2020; Lantos et al., 2022). The development of double haploid lines can accelerate the variety development process; therefore, this concept is an important part of accelerating the rice variety breeding (Dewi et al., 2017; Ren et al., 2017; Gudi et al., 2022; Lantos et al., 2022). In addition, the homozygous nature of these lines makes them suitable for genetic studies and method development such as hydroponic salinity screening (Arifuddin et al., 2021; Ivanova et al., 2025). The development of DH rice lines was reported by Anshori et al. (2021), who identified several DH rice lines with various levels of tolerance and adaptability. These lines can be used as the basis for the development of selection criteria for hydroponic salinity screening.
Image-based phenotyping (IBP) is a new approach for assessing and evaluating genotype responses. This concept utilizes the imaging analysis of an image that is translated into various observation characters, either area-based or morphometric (geometric), or based on color reflection or colorimetry (Mochida et al., 2018; Li et al., 2021; Vârban et al., 2022; Anshori et al., 2023; Sakinah et al., 2024). The concept of IBP can be used to assess the overall morphological potential of a plant in an image. Therefore, this approach is efficient and effective for determining the potential of a genotype, including its tolerance potential (Anshori et al., 2023). Several studies have reported the effectiveness of IBPs under salinity stress, including in rice (Anshori et al., 2021; Pabuayon et al., 2022; Sakinah et al., 2022). Anshori et al. (2021) and Sakinah et al. (2022) also reported the development of IBP selection criteria for hydroponic salinity stress screening. However, the development was still simply analyzed and did not use double-haploid rice genotypes. In addition, the analysis was not completed through systematic validation. Therefore, the IBP approach needs to be comprehensively deepened, based on both the concepts of model development and validation.
Statistical analysis is an important part of data interpretation. The more complex the data and objectives, the more complex is the statistical analysis. This can be an indicator of the comprehensiveness of the evaluation (Nayak et al., 2018; Reed et al., 2021; Soltabayeva et al., 2021; Phanniphong and Na-Nan, 2025). However, the results of the analysis still require validation to increase confidence in interpreting drawings. Validation is key to the effectiveness of a systematic set of statistical approaches (Nelson et al., 2019; Manavalan et al., 2021; Myllyaho et al., 2021; Baharuddin et al., 2025). Such validation should be performed incrementally, both on approaches with higher accuracy and on different populations (LaBudde and Harnly, 2012; Nelson et al., 2019; Anshori et al., 2021, 2022; Myllyaho et al., 2021; Satpathi et al., 2023; Baharuddin et al., 2025). Validated statistical analysis in the development of a crop model will increase the comprehensiveness of the study (Nelson et al., 2019; Anshori et al., 2021, 2022; Baharuddin et al., 2025). Therefore, systematic statistical development and validation are required to develop IBP-based selection criteria and models for double-haploid rice tolerance under hydroponic salinity screening. The purpose of this study was to identify IBP selection criteria and develop a model for potential tolerance in double-haploid rice under hydroponic salinity screening.
2 Materials and methods
2.1 Experimental design
This experiment was conducted at BB Biogen Greenhouse, Bogor, for 3 months from February to April 2019. The test was conducted with a hydroponic culture using Yoshida solution (Platten, 2018). The experimental design used was split-plot randomized complete block design, the main plot was NaCl concentration (0 mM (0.77 dS m−1) and 120 mM (13.42 dS m−1), and the subplots were ten genotypes 7 double haploid lines (HS4-15-1-63, HS4-15-1-70, HS4-15-2-4, HS4-15-2-6, HS4-45-1-66, and HS17-33-1-8) and 3 check varieties [Ciherang, IR 29 (sensitive), and Pokkali (tolerant)]. This study was repeated 3 times, so there were 60 experimental units. Each experimental unit consisted of 20 seedlings.
2.2 Research procedure
Seeding was carried out in stages according to the method of IRRI (2021), namely, seeding in Petri dishes for 2 days and then transferred to the nursery until 7 days after sowing (HSS). The 7-day-old seedlings were removed from the nursery media and transplanted into the nutrient culture media using a Styrofoam tray that had been perforated with a diameter of 18 mm, with a distance of 5 cm × 4 cm between holes. The seedlings were planted by rolling the seedling stems with a thin foam sheet and placing them into holes that had been made in the Styrofoam. The styrofoam containing the seedlings was then placed (until it floated) in Yoshida medium (8 L per tub) (IRRI, 2021). Each tub consisted of two genotypes and two sensitive and tolerant controls to compare the tub microenvironment. NaCl was applied when the seedlings had an average of three leaves. The first stage of NaCl application was 60 mM NaCl; after 2 days, it was increased to 120 mM NaCl. The pH of the solution was maintained in the range of 5.0–5.1 by adding 1 N NaOH or HCl every other day. The nutrient culture medium was replaced once a week until observations were made.
Images were taken with a Canon EOS 1200D RGB camera in a portable photo studio measuring 75 cm × 75 cm × 75 cm. A white background with two 8-watt white LED lights in the studio with camera settings (5.6\u00B0F-stops, 1/160 s exposure time, ISO 800, and no flash) was used. The side view (90°) from which the images were taken, is in the visible spectrum, commonly known as the RGB range (400–700 nm). Images were taken twice at 28 DAS (days after planting) or 14 days after treatment. Geometric characteristics were analyzed using ImageJ 1.54c. Excess area was cropped from all four sides to focus on the plant canopy and reference ruler, and a straight line of known length was drawn across the ruler to calibrate pixel measurements to real-world units. A color threshold based on saturation was then applied to separate the plants from the background, resulting in a binary mask that retained only plant pixels. The entire canopy area was extracted through this segmentation, and the green area was identified using the Hue, Saturation, and Brightness (HSB) model with a hue value of 50. All measured areas were converted from pixels to cm2 using the calibrated scale. Additionally, R (Red), G (Green), and B (Blue) channel data are obtained from the segmented image, where R, G, and B represent the raw digital values of each color channel, while r (Normalized Red), g (Normalized Green), and b (Normalized Blue) are the normalized values used to calculate the colorimetric index for IBP characteristics.
The association between RGB image data and salinity tolerance in double-haploid rice lines were defined through image-based phenotyping (IBP) combined with statistical modeling. Rice seedlings were grown under optimal and saline hydroponic conditions, then photographed using a Canon EOS 1200D camera in a controlled photo studio to maintain consistency in lighting and background. From each image, morphometric traits and colorimetric indices were extracted using ImageJ through segmentation and color thresholding. These traits were analyzed using Best Linear Unbiased Estimator (BLUE) and Stress Tolerance Index (STI) to evaluate performance across different environments. Properties significantly associated with salinity tolerance were identified through Spearman correlation with IRRI salinity scores, followed by Principal Component Analysis (PCA) and factor analysis to select the most informative IBP criteria. The selected traits were verified against physiological measurements (chlorophyll content, relative water content, malondialdehyde, and proline), and integrated into a morphometric and colorimetric selection index to predict and classify salinity tolerance directly from RGB images. To enhance clarity, the entire process is explained in Figure 1.
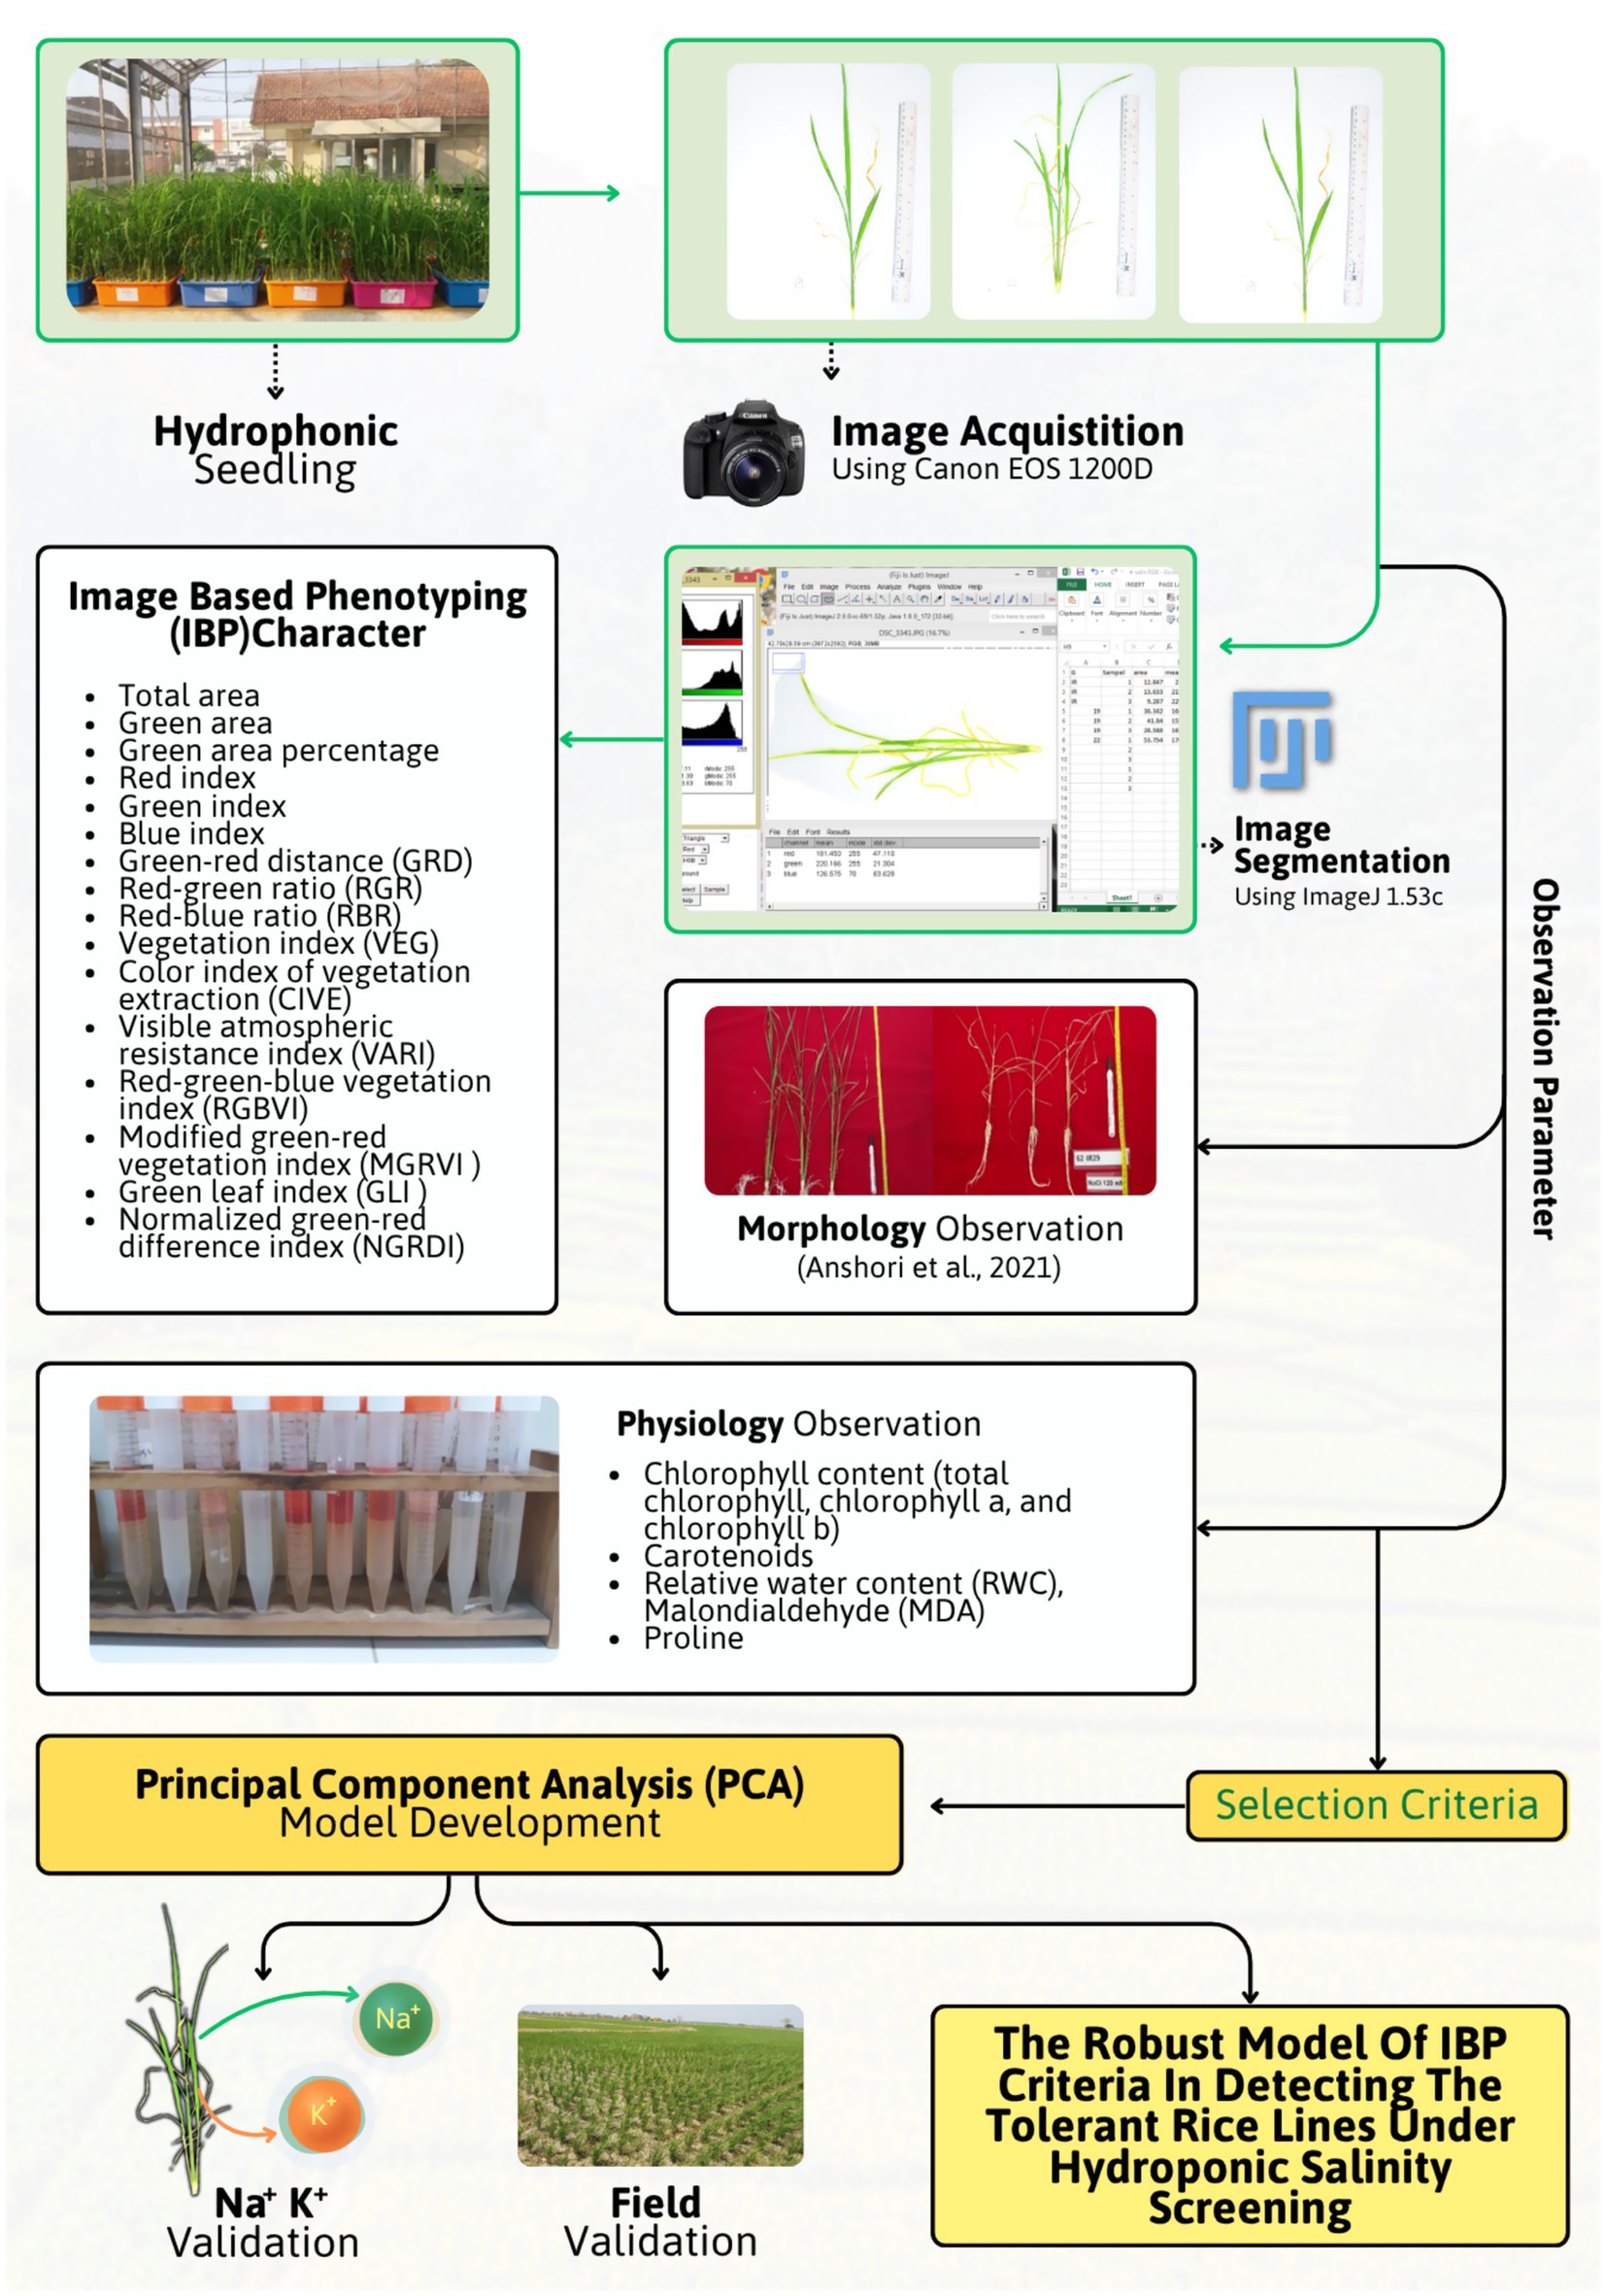
Figure 1. Research scheme flow.
2.3 Observation parameters and data analysis
The observed data included the morphology, image-based phenotyping, and physiology. The conventional morphological characteristics observed were those reported by Anshori et al. (2021), namely crown height and crown wet weight. The observation of image-based phenotyping characters adapts the concepts of Laraswati et al. (2021) and Sakinah et al. (2022, 2024), both for morphometric (geometric) and colorimetric potentials. The observed IBP characters include total area, green area, green area percentage, red index, green index, blue index, green-red distance (GRD), red-green ratio (RGR), red-blue ratio (RBR), vegetation index (VEG), color index of vegetation extraction (CIVE), visible atmospheric resistance index (VARI), red-green-blue vegetation index (RGBVI), modified green-red vegetation index (MGRVI), green leaf index (GLI), and normalized green-red difference index (NGRDI). Information regarding colorimetric index are provided in Table 1. The observed physiological characteristics included chlorophyll content (total chlorophyll, chlorophyll a, and chlorophyll b), carotenoids, relative water content (RWC), malondialdehyde (MDA), and proline. All analyses were conducted at the Physiology Laboratory, Biology, IPB University, with specific protocols. Meanwhile, Na+ and K+ ion content in the canopy was observed on selected genotype samples based on the cluster. Analysis of Na+ and K+ ion content was performed by atomic absorption spectrophotometer (AAS) analysis at the Integrated Laboratory, Department of Agronomy and Horticulture, IPB University. Samples of each genotype were taken with as much as 5 g of dry matter for Na+ and K+ ion analysis.
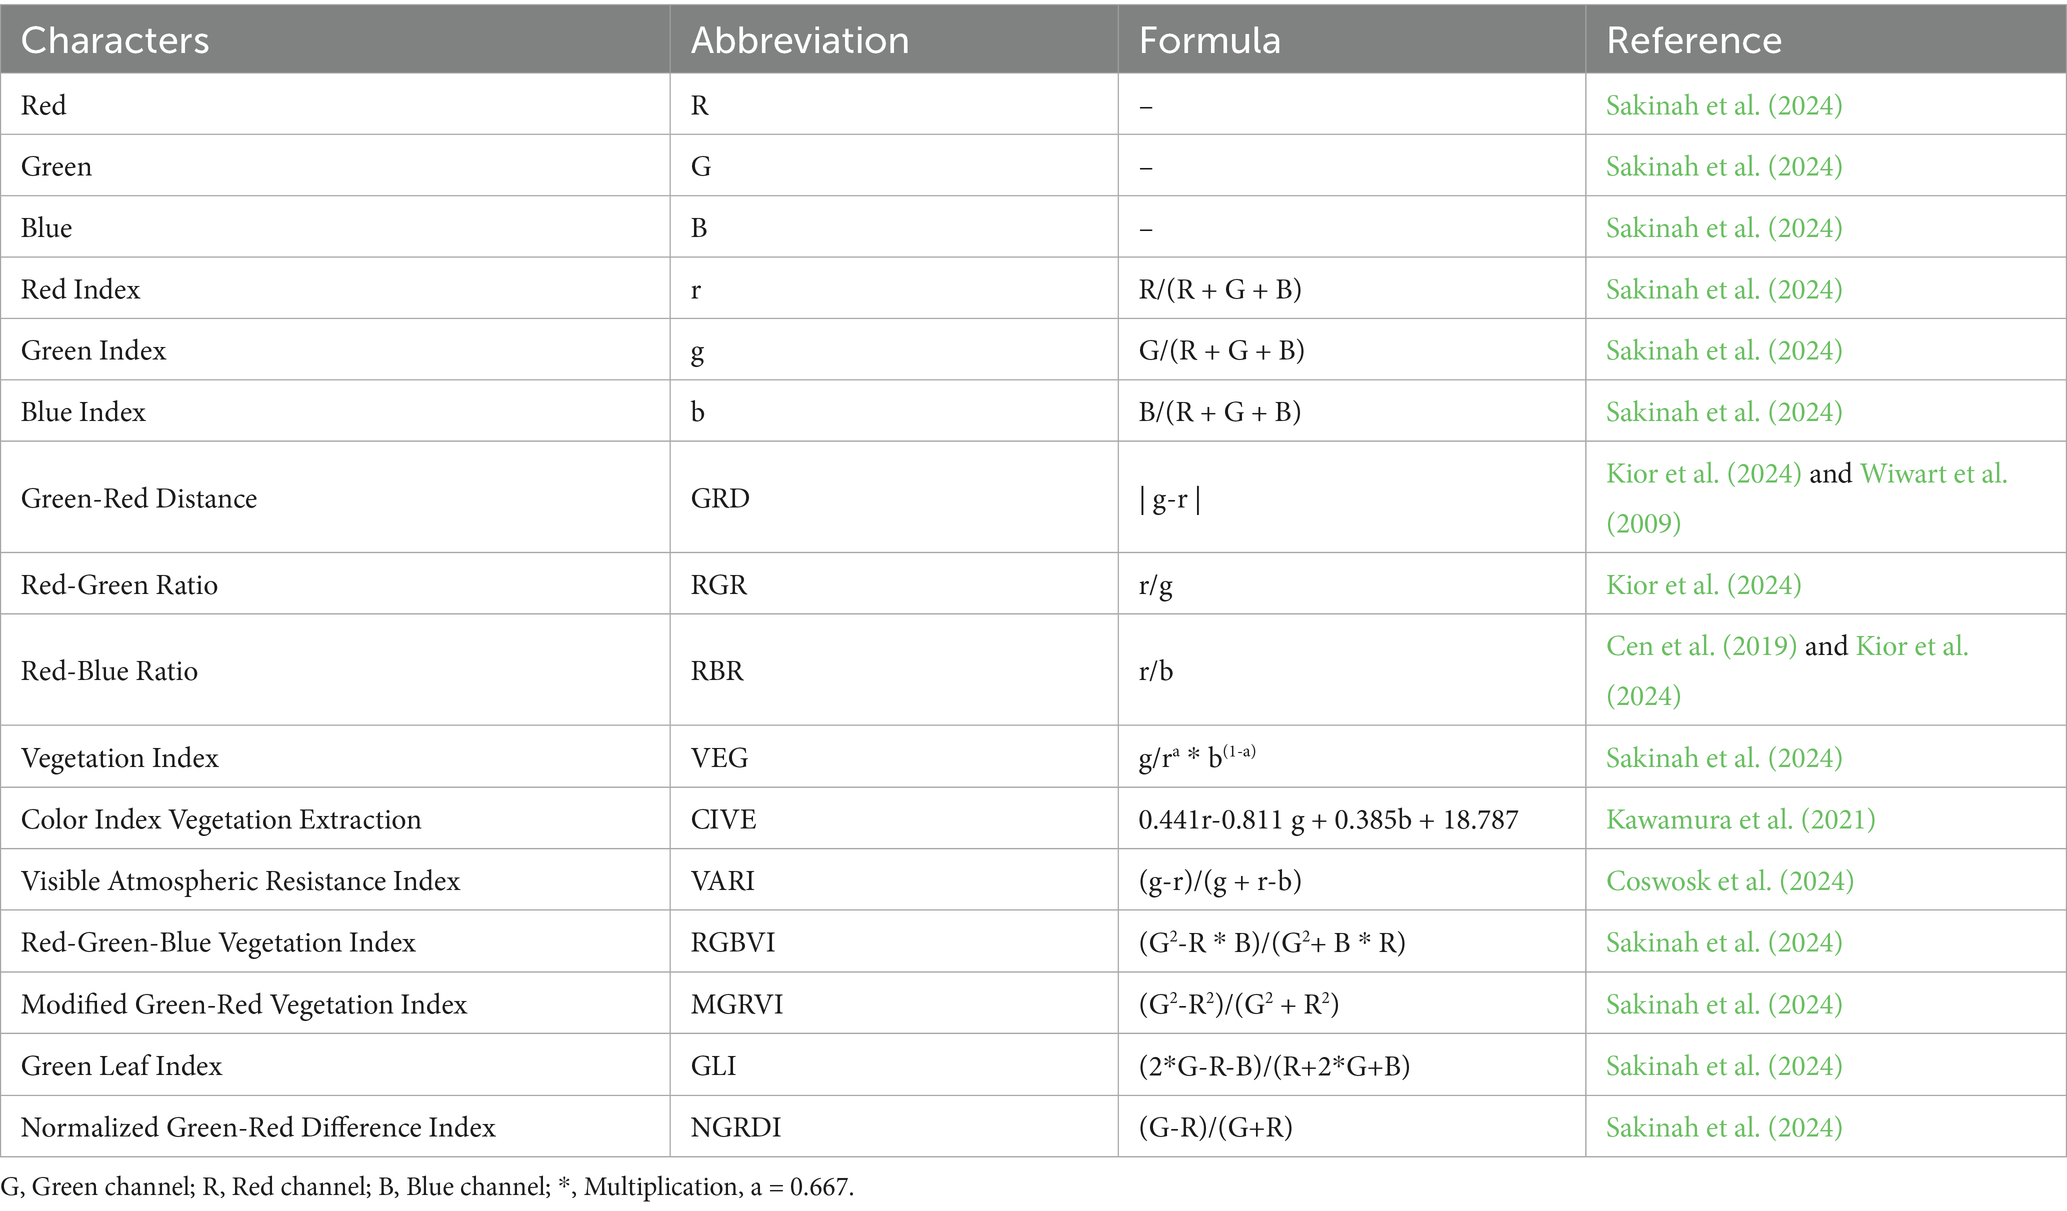
Table 1. Description and formulas of selected colorimetric index.
Chlorophyll determination was carried out using fresh leaves from the oldest leaves (0.1 g at the center of the leaf). The leaves were then crushed, 2 mL of 80% acetone was added, and the extract was placed in a phalcon until 10 mL. Then the mixture was centrifuged with a rotational speed of 3,000 rpm for 10 min at 4 °C. The chlorophyll content in the supernatant was measured with a spectrophotometer at wavelengths of 470 nm, 464 nm, and 663 nm. Chlorophyll a, b, and carotenoid contents were calculated using the formula described by Lichtenthaler (1987).
RWC measurements were performed on salinity-stressed leaves. Fresh leaves were cut to a length of 2 cm, and the leaves were immediately weighed as wet weight. The leaves were placed in distilled water for 24 h in the dark. The next day, the leaves were dried with a hard filter, and the turgid leaves were weighed. The leaves were then dried again at 50 °C for a day and weighed again as dry weight. RWC was determined using the following formula:
MDA testing can be performed on leaves. The weight of the samples used was 0.5 g. The oldest leaf sample was used. MDA extraction began with grinding and the addition of 5 mL of 5% trichloroacetic acid (TCA). The extract was centrifuged at 3000 rpm for 30 min at 4°C. Then, 2 mL of the supernatant was added to a new phial and mixed with 2 mL of 0.5% thiobarbituric acid (TBA): 5% TCA. The mixture was heated at 80 °C in a water bath for 45 min. After 45 min, the reaction mixture was cooled on ice for 5 min and resuspended at the same speed, time, and temperature. The absorbance of the mixture was then measured with a spectrophotometer at wavelengths of 450 nm, 532, and 600 nm. MDA was measured using the following formula (Wang et al., 2013):
Fresh leaves in young leaves were taken as much as 0.25 g then crushed and added 3% Sulfosalicylic Acid as much as 5 mL. The sample was then centrifuged at 3600 nm for 25 min at 4 °C. Then, 2 mL of the supernatant was transferred to an empty phial and mixed with 2 mL of ninhydrin, which had been dissolved in glacial acetic acid, 6 M orthophosphoric acid, and 2 mL of glacial acetic acid. The reaction mixture was then incubated for 1 h at 80 °C in a water bath and cooled with water at room temperature. Subsequently, 4 mL of toluene was mixed with each phalcone and vortexed. The reaction mixture was allowed to stand for 5 min at room temperature until a boundary formed between toluene and the other mixtures. Proline dissolved in toluene was measured using a spectrophotometer at 520 nm, and the amount of proline in the sample was estimated using a standard curve (Ali et al., 2014).
The data were analyzed using systematic and comprehensive concepts. In general, the statistical concepts used focus on the identification of selection criteria and the development of selection models. The identification of selection criteria began with a variance analysis of IBP characteristics using STAR software, version 2.0. Subsequently, significant data, especially in the interaction variance, were followed by analysis of the best linear unbiased estimator (BLUE) and stress tolerance index (STI). This combination is a part of the development of standard values for salinity tolerance analysis. In general, BLUE is used as the basic approach for determining selection criteria. This approach provides fixed effect estimates that are linear and unbiased, and have the minimum variance among all unbiased linear estimators, thus minimizing the impact of errors in the estimates (Kleinknecht et al., 2013; Dieng et al., 2024; Ridwan et al., 2025). The formulation of the BLUE concept is as follows:
Where y is the vector of dependent variables (n × 1), X is the matrix of independent variables (n × k), and is the parameter estimation using ordinary least squares (OLS). Meanwhile, the STI concept focuses on correlating the differences in the response of genotype potential on optimal land and salinity to the average potential of genotypes. This concept considers the general response of a genotype, so that the assessment is dynamic and objective in determining the adaptability of a genotype to abiotic stress (Anshori et al., 2018, 2022; Hooshmandi, 2019). The formulation of STI according to Fernandez (1992) is as follows:
Yn = character value in normal condition; Ys = character value in saline condition; = average value in normal condition.
The combination results of BLUE and STI of IBP characteristics were followed by Spearman correlation analysis using STAR 2.0.1 software. This analysis focused on the IRRI tolerance score. The use of Spearman’s correlation is considered effective for the combination of ordinal data (tolerance score) with quantitative IBP characters (Anshori et al., 2021). The characters that correlated significantly were further analyzed by Principal Component Analysis (PCA) biplot analysis through Rstudio with the factorextra package (Sakinah et al., 2022, 2024). This analysis aims to simultaneously map the diversity between characters into two main dimensions by minimizing the effect of overlap between sources of diversity. This allows the pattern of relationships between characters to be interpreted more clearly and informatively (Jollife and Cadima, 2016; Anshori et al., 2019). The interpretation of this analysis focused on the clustering of IBP characters and their relationship with important morphological characteristics [shoot height (SH) and shoot fresh weight (SFW)] (Anshori et al., 2021). IBP characteristics related to SH and SFW are indicated as morphometric (geometric) IBP criteria, while other RGB-based characteristics are considered colorimetric IBP characteristics. Especially for characters related to colorimetry, all characters were analyzed more in depth with factor analysis the minitab v 17 software. This analysis was intended to reduce factors that are considered to have a low covariance on a dimension (Rocha et al., 2018; Anshori et al., 2022). Colorimetric IBP characteristics that are consistently high on both dimensions of the factor become a reference for estimating the selection criteria for selected colorimetric IBPs. The selected morphometric and colorimetric IBP criteria were validated using physiological parameters. The physiological parameters were first changed through a combination of BLUE and relative increase. The relative increase in this study was calculated using the formula (Anshori et al., 2020):
The overall physiological relative gains were reanalyzed using a PCA biplot against the candidate colorimetric and geometric IBP selection criteria. Subsequently, the validated candidates were developed into IBP selection models based on mophometric (geometric) and colorimetric methods. The selection model was developed through the concept of a selection index. The selection index is a method that utilizes several selection criteria that are used as a multiple regression formulation (Alsabah et al., 2019; Anshori et al., 2019, 2021). This index can efficiently increase the genetic value of the population by considering the priority value of each selection criterion through the concept of weighting criteria (Rahimi and Debnath, 2023; Wellmann, 2023). This has also been reported in the development of selection for salinity stress tolerance (Anshori et al., 2019, 2021, 2022; Arifuddin et al., 2021; Farid et al., 2021; Sakinah et al., 2022). The selection index was formulated as follows (Anshori et al., 2019):
Where I is the index value; b₁, b₂, …, bₙ = selection weight (coefficient) for each trait; and x₁, x₂, …, xₙ = observed trait values. Weighting development of the selection index values was performed using the concept of eigenvectors on the PCA values. The selected IBP selection criteria were re-analyzed using PCA without biplots. This concept was developed by Anshori et al. (2019, 2021), Laraswati et al. (2021), Sarwendah et al. (2022), Hadianto et al. (2023), and Nasaruddin et al. (2024). The determination of eigenvectors is based on PCs, which can describe the differences in the potential of colorimetric and geometric selections in shaping the weighting of selection indices from the two IBP approaches (Anshori et al., 2019, 2021). Subsequently, the two indices were interacted to determine the mapping pattern of the selection potential. The index interaction was visualized by scatter plot analysis using Excel 365 software and Rstudio with the package ggplot2. The Na + and K + ion contents of the samples from each interaction group were analyzed. The Na + and K + contents can be used as indicators to determine the mechanism of tolerance of rice to salinity stress (Reddy et al., 2017; Gerona et al., 2019; Chen et al., 2021; Paul et al., 2024), including in this study. In addition, the geometric and colorimetric indices were validated against their production potential under salinity stress, except for IR 29 and Pokkali. This study aimed to identify the relationship between tolerance potential and adaptability in a salinity field. This concept is an indication for the development of criteria and selection models for salinity tolerance, especially through hydroponic salinity screening of DH rice lines.
3 Result
3.1 Identification of image-based phenotyping (IBP) selection criteria for DH Rice tolerance to salinity stress based on conventional phenotypic validation
The analysis of variance for image-based phenotyping (IBP) characteristics is shown in Table 2. Genotype variation had a highly significant effect on all IBP characteristics of double-haploid rice in the hydroponic salinity test. This is also followed by environmental variation and G × E interaction, which also show significant effects on almost all characters, except for the blue index and red-blue ratio. The blue index character does not show a significant effect from environmental variation, and the red-blue ratio does not show a significant effect from environmental variation and G × E interaction.

Table 2. Analysis of variance of image-based phenotyping characters of double haploid rice lines under hydroponic salinity screening.
The IBP characteristics with potential as selection criteria were further analyzed using BLUE analysis and stress tolerance indices. BLUE analysis for all IBP characteristics of diploid rice in the hydroponic salt tolerance test is presented in Supplementary Table 1. The results of the BLUE analysis were used as the basis for developing stress tolerance indices (Table 3). The table shows that the double haploid line HS4-15-1-63 (F19) showed good potential for the green index (GI) (0.93), green-red distance (GRD) (0.65), vegetation index (VEG) (0.87), color index of vegetation extraction (CIVE) (0.70), visible atmospheric resistance index (VARI) (0.60), red-green-blue vegetation index (RGBVI) (0.83), modified green-red vegetation index (MGRVI) (0.64), green leaf index (GLI) (0.79), and normalized green-red difference index (NGRDI) (0.63). The Ciherang and IR 29 varieties have a high potential in the red-green ratio (RGR) (1.49) and red index (1.17), respectively. Meanwhile, the Pokkali variety has high potential in terms of area (1.00), green area (0.90), percentage of green area (0.85), plant height (1.61), wet canopy weight (1.39), and IRRI tolerance score (1.00).

Table 3. BLUE-based stress tolerance index of image-based phenotyping characteristics of double-haploid rice lines under hydroponic salinity screening.
The results of the Spearman analysis are shown in Figure 2. This correlation focused on the IRRI tolerance score. Based on the figure, the tolerance score has a significant negative correlation with shoot height (−0.85), green area (−0.96), total area (−0.91), shoot fresh weight (−0.87), green area percentage (−0.85), VARI (−0.87), GRD (−0.86), MGRVI (−0.83), NGRDI (−0.83), CIVE (−0.88), and GLI (−0.82). Additionally, green area had a significant positive correlation with other characteristics related to the assessment, namely shoot height (0.92), total area (0.95), shoot fresh weight (0.95), green area percentage (0.89), VARI (0.88), GRD (0.88), MGRVI (0.85), NGRDI (0.85), CIVE (0.88), and GLI (0.84).

Figure 2. Spearman correlation analysis between image-based phenotyping characteristics of double-haploid rice lines under hydroponic salinity screening. GRD, green-red distance; RGR, red-green ratio; RBR, red-blue ratio; VEG, vegetation index; CIVE, color index of vegetation extraction; VARI, visible atmospheric resistance index; RGBVI, red-green-blue vegetation index; MGRVI, modified green-red vegetation index; GLI, green leaf index; NGRDI, normalized green-red difference index.
The results of the biplot analysis based on principal component analysis (PCA) showed two groups of characteristics based on vector direction (Figure 3). The first group consisted of shoot height, shoot fresh weight, total area, and green area. The Pokkali variety was the only variety aligned with the first vector group with a high individual contribution value. Conversely, the second vector group consisted of CIVE, GRD, VARI, MGRVI, GLI, green area percentage, and NGRDI. This vector group also depicts several double haploid lines, namely HS4-15-2-4, HS4-15-2-6, HS4-15-1-70, and HS4-15-1-63. These lines have significant individual contributions to the biplot analysis. The other genotypes were grouped in different quadrants. Varieties IR 29 and Ciherang are in quadrant 2, with high individual contribution values. Conversely, HS17-33-1-8, HS4-45-1-66, and HS4-15-1-26 were grouped in quadrant 3 with low individual contribution values.

Figure 3. Principal component analysis between image-based phenotyping and conventional morphological characteristics of double-haploid rice lines under hydroponic salinity screening. Dim, dimension; GRD, green-red distance; CIVE, color index of vegetation extraction; VARI, visible atmospheric resistance index; MGRVI, modified green-red vegetation index; GLI, green leaf index; NGRDI, normalized green-red difference index.
The results of factor analysis of the PCA biplot of vector group 2 (Figure 3) are presented in Table 4. Based on the table, two factors describe the diversity of vector group 2 or colorimetric group, with a total diversity of 99.30%. Based on the intersection of the two factors, the characteristics of green percentage, CIVE, and GLI had high and consistent factor loadings or variances for both factors. The green percentage had factor loadings of 0.728 and 0.614 for factors 1 and 2, respectively. CIVE had factor loadings of −0.541 and −0.836 for factors 1 and 2, respectively. Meanwhile, GLI had factor loadings of −0.676 and −0.988 for factors 1 and 2, respectively.

Table 4. Factor analysis of selected colorimetric characteristics of double haploid rice lines under hydroponic salinity screening.
3.2 Identification of image-based phenotyping selection criteria for DH Rice tolerance to hydroponic salinity screening based on physiological validation
The relative increase in the physiological parameters of the double haploid rice lines under hydroponic salinity screening is shown in Table 5. The table shows that IR 29 had a high relative increase in malondialdehyde (MDA) (2.81) and proline (46.23). Additionally, Pokkali exhibited a relatively high increase in total chlorophyll (0.49), chlorophyll a (0.44), chlorophyll b (0.68), and carotenoids (0.22). The genotype with the highest relative increase in relative water content is HS4-15-1-63 (0.00).

Table 5. BLUE-based relative increase in physiological characteristics of double haploid rice lines under hydroponic salinity screening.
The results of the PCA biplot analysis of the selected IBP and physiological characteristics are shown in Figure 4. According to this figure, there are two vector groups. The first group consisted of the total area, green area, GLI, chlorophyll a, chlorophyll b, total chlorophyll, CIVE, green area percentage, carotenoids, and relative water content. The genotypes around this vector group are Pokkali, HS4-15-2-4, HS4-15-2-6, HS4-15-1-63, and HS4-15-1-70. Conversely, the second vector group contained MDA and proline. The genotypes grouped in this vector were IR 29 and Ciherang.

Figure 4. Principal component analysis between selected IBP characteristics and physiological parameters of double-haploid rice lines under hydroponic salinity screening. Dim, dimension; CIVE, color index of vegetation extraction; GLI, green leaf index; MDA, malondialdehyde; Total Chl, total chlorophyll; Chl a, chlorophyll a; Chl b, chlorophyll b; Car, carotenoids; RWC, relative water content.
3.3 Development of a Rice tolerance index to salinity stress based on IBP and its validation based on Na and K contents
The results of the PCA involving five selection criteria for IBP double-haploid rice under hydroponic salinity screening are shown in Table 6. The table shows that two principal components could represent the diversity of the five selection criteria, with a cumulative diversity of 0.95. The determination of these criteria was also based on eigenvalue values in each PC dimension that exceeded 1. PC1 has relatively similar eigenvectors, ranging from 0.4 among the IBP selection criteria. Conversely, PC2 showed two groups of selection criteria marked by different vector directions. The positive-valued vectors consisted of green area (0.51) and total area (0.58), whereas the negative-valued vectors consisted of green area percentage (−0.31), CIVE (−0.31), and GLI (−0.46). These results can be formulated into two types of indices: morphometric (geometric) and colorimetric indices.

Table 6. Principal component analysis of selected image-based phenotyping characteristics based on morphometric (geometric) and colorimetric of DH rice under salinity stress.
The interaction between colorimetric and morphometric (geometric) indices based on IBP criteria for double-haploid rice under hydroponic salinity stress is shown in Figure 5. Based on the figure, there were three groups. The first group consisted of HS4-15-2-6, HS15-2-4, and Pokkali. The second group consists of HS4-15-1-63, HS4-15-1-70, HS4-45-1-66, HS4-15-1-26, and HS17-33-1-8. The last group consisted of Ciherang and IR 29.

Figure 5. Analysis of the interaction of morphometric (geometric) and colorimetric indices of DH rice on its tolerance potential under hydroponic salinity screening. IR, IR29; PK, Pokkali.
The analyses of potassium and sodium contents and their ratios in the IBP interaction index group samples are shown in Table 7. Based on the table, HS4-15-2-6 (−0.07) has a low relative increase in potassium content, while Pokkali and HS4-45-1-66 have a high relative increase in potassium, namely 0.31. The double haploid line HS4-15-2-6 (8.29) also showed a low relative increase, while IR 29 showed a high relative increase in sodium (27.84). Furthermore, the lowest relative increase in the Na/K ratio is found in HS4-15-2-6 at 8.97, while the highest relative increase in the Na/K ratio is found in IR 29 (27.64).
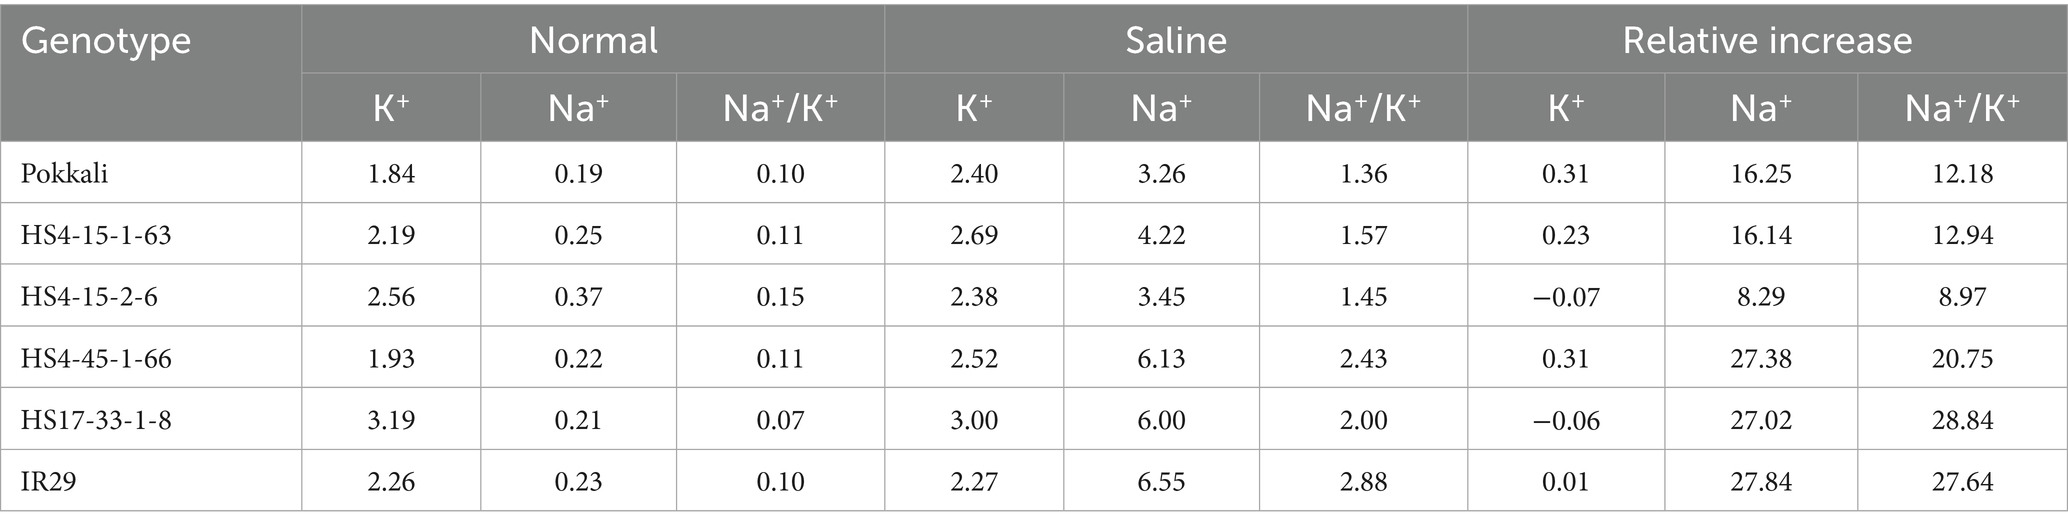
Table 7. Analysis of Potassium, Sodium, and Ratio content of sample groups based on the interaction of IBP colorimetric and morphometric (geometric) tolerance indexes.
3.4 Interaction of IBP colorimetric and morphometric (geometric) tolerance index with the yield in saline areas
A summary of the productivity of the genotypes in both salt environments is presented in Table 8. Based on this table, the overall average productivity of the genotypes in the Truntum and Sukra areas is 6.34 and 5.57 (t ha−1), respectively. The combination of the two regions resulted in an average productivity of 5.95 t ha−1, with HS4-15-1-63 (6.45 t ha−1) as the genotype with the highest productivity compared to the others. Conversely, HS17-33-1-8 (4.12 t ha−1) had the lowest productivity. These results form the basis for the analysis of the 3D interactions of morphometric (geometric) and colorimetric indices.

Table 8. The yield of several double haploid rice lines in Truntum and Sukra, along with the potential tolerance index based on IBP.
The interactions among the three approaches are displayed in a 3D plot (Figure 6). Based on the figure, there were four grouping categories. The first group consists of the double haploid lines HS4-15-2-6 and HS4-15-2-4. The second group consists of HS4-15-1-26, HS4-15-1-63, HS4-15-1-70, and HS4-45-1-66. The third and fourth groups consisted of Ciherang variety and HS17-33-1-8, respectively.

Figure 6. Analysis of the interaction of the morphometric (geometric) index, colorimetric index, and yield of DH rice on its potential adaptability to salinity stress. Morpho Index, morphometric (geometric) Index; Color Index, colorimetric index.
4 Discussions
4.1 Determination of selection criteria in determining DH rice tolerance under hydropnic salinity screening
The identification of selection criteria based on image-based phenotyping characters cannot be separated from the potential of these characters in detecting differences in responses between genotypes to normal and saline environments (Anshori et al., 2019, 2022; Farid et al., 2021; Herawati et al., 2024; Khan et al., 2024). This potential can be seen in the diversity of interactions between the genotype and environment in this study. Based on the source of diversity, all IBP characters showed a significant effect of interaction diversity, except for the blue index and red-blue ratio. In general, screening for stress must include checking genotypes that are tolerant and sensitive to abiotic stresses, including salinity. This aims to control the diversity of a screening to show significant differences in responses between the two checks in the selection environment (Bado et al., 2016; Anshori et al., 2020; Singh et al., 2021). Tolerant check genotypes show a gentle decline in growth characteristics when subjected to salinity stress. Conversely, sensitive genotypes experience a sharp and exponential decline in growth characteristics when experiencing salinity stress (Anshori et al., 2018; Arifuddin et al., 2021; Huqe et al., 2021; Chen et al., 2024). This difference induces a significant effect of genotype and environment interaction diversity on a character. Moreover, the selection also included various other genotypes with varying tolerance levels, as in the present study, (Anshori et al., 2018; Arifuddin et al., 2021; Huqe et al., 2021; Chen et al., 2024). This makes the source of interaction diversity more significant to a growth character, so the determination of the effect of interaction diversity is an early indication in determining the selection criteria in tolerance screening. This concept was also reported by Arifuddin et al. (2021), Farid et al. (2021), Herawati et al. (2024), and Sakinah et al. (2024), in rice to salinity stress, and for Laraswati et al. (2021), Nasaruddin et al. (2024) on rice against drought stress. Based on this, all IBP characters can potentially be used as selection criteria in screening the tolerance of double haploid rice lines to salinity stress, except blue index and red, blue ratio.
The identification of effective IBP selection criteria in tolerance screening of double haploid rice under hydroponic salinity screening is performed gradually through various approaches and validation. The utilization of several approaches and validations in determining selection criteria was also reported by Anshori et al. (2021, 2022), Huqe et al. (2021), Tabassum et al. (2021), and Chen et al. (2024). In addition, utilization is the basis for developing an effective and precise model for hydroponic-based salinity tolerance screening in this study. The concept of determining the selection criteria in this study is based on the concept of best linear unbiased estimation (BLUE) and stress tolerance index (STI). Utilization of BLUE is considered critical because all genotypes in this study have homozygous and fixed genetic constructs (Dewi et al., 2017; Anshori et al., 2021); therefore, the utilization of BLUE will increase the precision of assessing the tolerance of a genotype. On the other hand, STI also increases the effectiveness of determining selection criteria and developing tolerance-screening models (Lone et al., 2019; Dehnavi et al., 2020; Kandel et al., 2022; Nasaruddin et al., 2024). The STI has a role as a midpoint in assessing the potential adaptability of genotypes to stress (Anshori et al., 2019, 2022; Hooshmandi, 2019; Kumar et al., 2024). The use of this STI in screening rice against stress has also been reported by Lestari et al. (2019), Laraswati et al. (2021), Sakinah et al. (2022, 2024), Hallajian et al. (2024), Kumar et al. (2024), and Nasaruddin et al. (2024), as well as salinity stress (Sakinah et al., 2024). Based on this, the combination of the two is a new and essential approach for increasing the precision of assessing the tolerance potential of double-haploid rice, especially in hydroponic salinity screening.
The determination of IBP selection criteria was first validated by morphological characteristics. The validation concept was also divided into two approaches: validation based on the IRRI SES salinity tolerance score (Anshori et al., 2020; IRRI, 2021; Singh et al., 2021; Fellahi et al., 2024) and conventional morphological selection criteria (Anshori et al., 2021, 2022; Arifuddin et al., 2021; Farid et al., 2021; Sakinah et al., 2022; Alkahtani and Dwiningsih, 2023; Dwiningsih, 2023). The IRRI has developed protocols for the assessment of various tolerances tailored to the developmental stages of the crop, including hydroponic salinity screening in the seedling phase (IRRI, 2021; Singh et al., 2021). This indicates that such an assessment is the minimum requirement for determining the level of plant tolerance. However, the concept of score is more focused on the chlorophyll potential of a genotype under stress (Anshori et al., 2021; Singh et al., 2021; Sakinah et al., 2024). This has limitations in assessing the potential for cell division that occurs when plants experience salinity stress. Some rice genotypes optimize their cell division potential as a form of resilience to minimize the impact of salinity stress (Anshori et al., 2021; Farid et al., 2021). This indicates that the use of conventional morphological characteristics is complementary in assessing the potential tolerance of genotypes to salinity stress. According to Anshori et al. (2021), Farid et al. (2021), Alkahtani and Dwiningsih (2023), and Atta et al. (2023), shoot height and shoot fresh weight are seedling morphological characteristics that are effective as selection criteria in hydroponic salinity screening. Both characteristics can be part of the validation in determining the IBP selection criteria. Based on this, the IRRI SES salinity tolerance score, shoot height and shoot fresh weight are morphological validation indicators for detecting the potential tolerance of double-haploid rice lines in hydroponic salinity screening.
Based on the morphological validation of the three indicators, the IBP characters total area, green area, green area percentage, CIVE, and GLI can be indicated as potential IBP selection criteria. The five characteristics can be divided into two groups based on PCA analysis, which represent the potential for cell division and chlorophyll color content. The total area and green area represent the morphological characteristics of the shoot height and shoot fresh weight, respectively. This indicates that both characteristics can act as morphometric (geometric) IBP criteria in determining the potential tolerance of DH rice lines in hydroponic salinity screening. In contrast, the green area percentage, CIVE, and GLI became a part of the colorimetric potential of IBP after being analyzed more deeply through factor analysis. This analysis can simplify a large number of variables into fewer factors, based on the clustering of high covariance between variables in one dimension (Rocha et al., 2018; Anshori et al., 2022; Jia et al., 2022); therefore, characters with a large diversity in the PCA dimension can be indicated as potential characters in the group. However, the five characteristics that have been indicated as IBP selection criteria must be further validated based on their physiological potential.
Physiological validation involves various biochemicals that generally undergo changes upon exposure to salinity stress (Alkahtani and Dwiningsih, 2023). These characteristics included proline, chlorophyll, carotenoids, melandealdhedi, and relative water content. Based on the validation, the colorimetric selection criteria (green percentage area, CIVE, and GLI) had the same direction as RWC and chlorophyll content. In contrast, this group of criteria was also in the opposite direction to MDA and Proline contents. In addition, the total area and green area were strongly related to the potential of the Pokkali-tolerant genotypes. In general, plants under salinity stress are exposed to Na + toxicity and free radicals (Atta et al., 2023; Balasubramaniam et al., 2023; Fu and Yang, 2023). This could induce chlorophyll damage. Plants exposed to salinity stress experience chlorophyll depletion (Gerona et al., 2019; Atta et al., 2023; Liu et al., 2024; Ubaidillah et al., 2024). However, plants with salinity tolerance minimize chlorophyll damage to their leaves (Liu et al., 2024; Zuo et al., 2024). This phenomenon may indicate the potential of chlorophyll content as an indicator of tolerance to salinity stress in rice. This was also consistent with the relative water content (RWC). When plants experience salinity stress, it is difficult for cells to obtain water for cell growth (Balasubramaniam et al., 2023; Liu et al., 2024; Zuo et al., 2024). This indicates that sensitive rice plants have lower water content than tolerant plants (Korres et al., 2022; Balasubramaniam et al., 2023). This potential makes RWC an indicator of tolerance to salinity stress. On the other hand, the concepts of malondialdehyde (MDA) and proline can be selection criteria whose functions are different from those of chlorophyll and RWC. Salinity stress triggers excessive production of reactive oxygen species (ROS) in plant cells (Hasanuzzaman et al., 2021). ROS damage membrane lipid peroxidation, one of the products of which is MDA (Miftahudin et al., 2020). Plants that are sensitive to salinity show a significant increase in MDA levels (Gerona et al., 2019; Miftahudin et al., 2020; Hartatik et al., 2024). This indicates severe cell damage and the inability of the plant antioxidant defense system to overcome these ROS; therefore, this content can be used as an indicator of rice tolerance to salinity stress. Proline is an amino acid that acts as an osmoprotectant and is dominantly expressed when plants, including rice, experience salinity stress (Meena et al., 2019; El Moukhtari et al., 2020; Hosseinifard et al., 2022). In the present study, the highest proline content was found in the sensitive genotypes. This indicates that sensitive genotypes will try to optimally increase their osmotic pressure to meet the needs of water in the crown. This result is different from the statement of Atta et al. (2023), the increase in proline also occurred very highly in tolerant varieties compared to sensitive varieties. However, the assessment focused on the roots, while this study used the crown as an indicator of proline accumulation. This indicates that sensitive genotypes will try to increase the water content in the canopy by increasing the osmotic pressure of the canopy cells (Koc et al., 2024). This role makes proline an indicator of rice tolerance to salinity stress (Nguyen et al., 2021; Koc et al., 2024). Based on this, the five IBP characteristics have great potential as important selection criteria for the tolerance of double-haploid rice lines in hydroponic salinity screening.
4.2 Development of tolerance index model based on IBP selection criteria in double haploid Rice under hydroponic salinity screening
The development of the IBP tolerance index model in double-haploid rice under hydroponic salinity screening was carried out using the concepts of Akbar et al. (2019), Anshori et al. (2019), and Farid et al. (2021). The development of the index is based on the potential eigenvectors of PCA in a PC dimension. The crucial aspect of this concept is to determine the effective PC that can be used as the basis for the weighting value of the selection criteria in the index model. Based on the PCA analysis, PC2 was the optimal PC for distinguishing the potential diversity between the IBP groups. In contrast, PC1 had a unidirectional diversity in the five selection criteria. This indicates that PC cannot be the basis for determining the weighting of the selection index. The development of the IBP index in PC2 is divided into two concepts: the morphometric (geometric) index represented by total area and green area, and the colorimetric index represented by green area percentage, CIVE, and GLI. Although, the colorimetric group showed a negative PC2 value. However, this value is not absolute; therefore, the eigenvectors for each selection criterion can be positive in developing the colorimetric index (Anshori et al., 2019, 2021). Based on this, the two indices developed can be used to assess the potential of double-haploid rice genotypes for image-based phenotyping of hydroponic salinity screening.
The results of the interaction between the colorimetric index and morphometric (geometric) index, along with validation against Na + and K + contents, showed three main quadrants. The first quadrant indicates a group of genotypes with very strong salinity tolerance. This is indicated by the morphometric and colorimetric potential in the same direction so that genotypes in this group can maintain an increase in growth rhythm and chlorophyll content when experiencing salinity stress. This is further reflected in the validation of the Na + and K + contents in the samples of this group. Pokkali and HS4-15-2-6 had low relative increases in Na content and Na+/K + ratio. This indicates that quadrant 1 group has tolerance properties by maintaining Na + ions from entering the leaf tissue. This concept is related to the avoidance tolerance mechanism in response to salinity stress (Reddy et al., 2017; Gerona et al., 2019; Paul et al., 2024). The second quadrant genotype group was considered complex. This is a moderate or transitional group between tolerance and sensitivity. Quadrant II was divided into two subgroups, which indicated the direction of tolerance. The first subgroup, consisting of HS4-15-1-63 and HS4-15-1-70, tended to have tolerance potential. This is also reflected in the validation of Na + and K+, where the sample group HS4-15-1-63 had a low relative increase, similar to the group in the first quadrant. Both can still be categorized as avoidance mechanisms by minimizing the increase in growth rhythm and maintaining its chlorophyll potential (Reddy et al., 2017; Gerona et al., 2019). On the other hand, the 2nd subgroup has the potential for sensitive genotypes. This can be seen from the close proximity and high increase in Na content in the third quadrant genotype group. This indicates that the genotype uses the tolerance mechanism as a form of tolerance, so that the Na + content is quite high in maintaining the chlorophyll potential in young leaves (Reddy et al., 2017; Paul et al., 2024). Old leaves in these genotypes are sacrificed as part of the organ complementation related to Na + ion toxicity (Reddy et al., 2017; Gerona et al., 2019). The third quadrant is a collection of sensitive genotypes, especially IR 29. These genotypes die because they cannot maintain the balance of division and damage when experiencing salinity stress (Reddy et al., 2017). Based on this, the potential interaction of these two IBP indices is suitable to be an important part in the classification and assessment of the salinity tolerance potential of a Double haploid rice genotype, specifically in hydroponic screening. However, these two index concepts also require field validation as economic and final validation related to the salinity stress adaptability of double-haploid rice.
The interaction of the IBP index (morpho-and colorimetric) on productivity shows that DH rice genotypes that are tolerant have better productivity potential than moderate and sensitive genotypes. The results of this interaction also show that the colorimetric potential has a role in the same direction as the potential productivity of double haploid rice lines in a salinity area. This phenomenon indicates that the chlorophyll potential in the maternity area is related to the potential adaptability of productivity (Wang et al., 2024); therefore, the colorimetric index of IBP plays an important role in identifying the potential productivity of double haploid rice lines in the maternity area. Chlorophyll damage continues until the plant can handle it (Lu et al., 2023; Nisbett et al., 2024). If the increase in chlorophyll damage enters an exponential pattern, the damage will induce a decrease in productivity and death in plants (Voitsekhovskaja et al., 2020). However, this concept does not apply to the ciherang variety. This variety is considered to be sensitive to hydroponic salinity screening. However, its productivity showed potential value in the salinity area in this study. This is because the Ciherang variety is a megavariety that has a statistically stable production under various environmental conditions (Kinose et al., 2019; Aswidinnoor et al., 2023; Sakinah et al., 2024). In addition, the application of stress in hydroponics has a severe salinity status, reaching 12 dS/m, while in rice-growing areas, the stress status does not reach 12 dS/m. This is why the Ciherang variety has an adaptive mechanism and good production levels in saline fields. However, its production potential is not as good as that of varieties that are tolerant to salinity stress. Therefore, the colorimetric potential (green area percentage, CIVE, and GLI) in this study can be used as an early indicator of the potential productivity of rice lines, especially double haploids, when grown in saline areas.
The morphometric and colorimetric index formulas developed in this study effectively distinguished salt-tolerant double haploid rice lines from sensitive ones in hydroponic salinity tests. Their discriminative ability is supported by consistent correlations with IRRI salinity scores, conventional morphological traits, physiological parameters, tissue Na+/K+ content, and yield performance under saline field conditions. These indices reliably grouped known tolerant and sensitive control lines together with experimental lines in patterns consistent with biological expectations. However, since these indices were developed and validated on a limited number of genotypes under controlled conditions, broader testing across diverse genetic backgrounds, developmental stages, and imaging environments is needed. The addition of diagnostic metrics (sensitivity, specificity) and independent validation will further strengthen their utility for large-scale screening programs.
5 Conclusion
The development of criteria and selection models based on image-based phenotyping (IBP) in hydroponic salinity screening is considered effective for estimating the potential tolerance of rice lines, especially double haploid lines. This development can be performed with a combination of the best linear unbiased estimation and stress tolerance index to determine the potential of a rice line. This concept is further developed through the development of an index model based on eigenvector weighting in principal component analysis. This combination is an effective novelty in estimating the potential of selection criteria and the development of IBP tolerance models. The concept of the tolerance index model in IBP can be divided into two approaches: morphometric (geometric) and colorimetric. The morphometric (geometric) index is represented by the total area and green area, whereas the colorimetric index is represented by the percentage of green area, CIVE, and GLI. All IBP criteria showed good validation results for conventional morphological potential (IRRI tolerance score, seedling height, and shoot fresh weight), physiology (MDA, Proline, RWC, chlorophyll, and carotenoids), Na + and K + contents, and productivity in saline areas. The formulation of the two tolerance indexes are:
The interaction of the two IBP tolerance indices can map double haploid rice genotypes unequivocally, both between tolerant and sensitive traits, and potential differences to the moderate group. However, the colorimetric index roughly indicates the potential adaptability of the double-haploid rice lines in the salinity field. Therefore, the colorimetric index can be used as a reference for a double-haploid rice tolerance model in hydroponic salinity screening. However, this concept needs to be further tested with genotypes in other populations, both crossbred and mutated rice populations.
Data availability statement
The datasets presented in this study can be found in online repositories. The names of the repository/repositories and accession number(s) can be found in the article/Supplementary material.
Author contributions
MuA: Conceptualization, Data curation, Formal analysis, Funding acquisition, Investigation, Methodology, Project administration, Software, Visualization, Writing – original draft, Writing – review & editing. BP: Conceptualization, Data curation, Funding acquisition, Methodology, Resources, Supervision, Validation, Writing – review & editing. NC: Data curation, Funding acquisition, Supervision, Validation, Writing – review & editing. ID: Conceptualization, Data curation, Methodology, Resources, Supervision, Validation, Writing – review & editing. WS: Conceptualization, Formal analysis, Methodology, Software, Supervision, Validation, Writing – review & editing. SA: Conceptualization, Data curation, Methodology, Supervision, Validation, Writing – review & editing. AbB: Data curation, Supervision, Validation, Writing – review & editing. AcB: Investigation, Software, Visualization, Writing – review & editing. PK: Investigation, Visualization, Writing – review & editing. ZA: Data curation, Validation, Writing – review & editing. MaA: Funding acquisition, Supervision, Validation, Writing – review & editing. NA: Supervision, Validation, Writing – review & editing. MS: Data curation, Funding acquisition, Supervision, Validation, Writing – review & editing.
Funding
The author(s) declare that financial support was received for the research and/or publication of this article. The financial support was received from Ongoing Research Funding Program (ORFFT-2025-041-1), King Saud University, Riyadh, Saudi Arabia. The study was also funded by the Indonesian Collaboration Research (Riset Kolaborasi Indonesia (RKI)) scheme A with number 01319/UN4.22/PT.01.03/2025.
Acknowledgments
The authors acknowledge the dedication of all respondents who shared their knowledge in this study. The authors would like to thank Ongoing Research Funding Program, (ORFFT-2025-041-1), King Saud University, Riyadh, Saudi Arabia for financial support. Besides that, we are grateful to Hasanuddin University for providing funding for this research through the Indonesian collaboration research (Riset Kolaborasi Indonesia (RKI)) scheme A with number 01319/UN4.22/PT.01.03/2025.
Conflict of interest
The authors declare that the research was conducted in the absence of any commercial or financial relationships that could be construed as a potential conflict of interest.
Generative AI statement
The authors declare that no Gen AI was used in the creation of this manuscript.
Any alternative text (alt text) provided alongside figures in this article has been generated by Frontiers with the support of artificial intelligence and reasonable efforts have been made to ensure accuracy, including review by the authors wherever possible. If you identify any issues, please contact us.
Publisher’s note
All claims expressed in this article are solely those of the authors and do not necessarily represent those of their affiliated organizations, or those of the publisher, the editors and the reviewers. Any product that may be evaluated in this article, or claim that may be made by its manufacturer, is not guaranteed or endorsed by the publisher.
Supplementary material
The Supplementary material for this article can be found online at: https://www.frontiersin.org/articles/10.3389/fsufs.2025.1659331/full#supplementary-material
References
Afzal, M., Hindawi, S. E. S., Alghamdi, S. S., Migdadi, H. H., Khan, M. A., Hasnain, M. U., et al. (2023). Potential breeding strategies for improving salt tolerance in crop plants. J. Plant Growth Regul. 42, 3365–3387. doi: 10.1007/s00344-022-10797-w
Akbar, M. R., Purwoko, B. S., Dewi, I. S., and Suwarno, W. B. (2019). Selection of doubled haploid lines of rainfed lowland rice in preliminary yield trial. Biodiversitas 20, 2796–2801. doi: 10.13057/biodiv/d201003
Ali, M. N., Yeasmin, L., Gantait, S., Goswami, R., and Chakraborty, S. (2014). Screening of rice landraces for salinity tolerance at seedling stage through morphological and molecular markers. Physiol. Mol. Biol. Plants 20, 411–423. doi: 10.1007/s12298-014-0250-6
Alkahtani, J., and Dwiningsih, Y. (2023). Analysis of morphological, physiological, and biochemical traits of salt stress tolerance in Asian rice cultivars at seedling and early vegetative stages. Stress 3, 717–735. doi: 10.3390/stresses3040049
Alsabah, R., Purwoko, B. S., Dewi, I. S., and Wahyu, Y. (2019). Selection index for selecting promising doubled haploid lines of black rice. SABRAO J. Breed. Genet. 51, 430–441. Available at: http://sabraojournal.org/wp-content/uploads/2020/01/SABRAO-J-Breed-Genet-514-430-441-Purwoko.pdf
Anshori, M. F., Dirpan, A., Sitaresmi, T., Rossi, R., Farid, M., Hairmansis, A., et al. (2023). An overview of image-based phenotyping as an adaptive 4.0 technology for studying plant abiotic stress: a bibliometric and literature review. Heliyon 9:e21650. doi: 10.1016/j.heliyon.2023.e21650
Anshori, M. F., Purwoko, B. S., Dewi, I. S., Ardie, S. W., and Suwarno, W. B. (2019). Selection index based on multivariate analysis for selecting doubled-haploid rice lines in lowland saline prone area. SABRAO J. Breed. Genet. 51, 161–174. Available at: https://www.researchgate.net/publication/334457137
Anshori, M. F., Purwoko, B. S., Dewi, I. S., Ardie, S. W., and Suwarno, W. B. (2021). A new approach to select doubled haploid rice lines under salinity stress using indirect selection index. Rice Sci. 28, 368–378. doi: 10.1016/j.rsci.2021.05.007
Anshori, M. F., Purwoko, B. S., Dewi, I. S., Ardie, S. W., Suwarno, W. B., and Safitri, H. (2018). Determination of selection criteria for screening of rice genotypes for salinity tolerance. SABRAO J. Breed. Genet. 50, 279–294. Available at: https://www.researchgate.net/publication/328726245_Determination_of_selection_criteria_for_screening_of_rice_genotypes_for_salinity_tolerance
Anshori, M. F., Purwoko, B. S., Dewi, I. S., Suwarno, W. B., and Ardie, S. W. (2020). Cluster heatmap for detection of good tolerance trait on doubled-haploid rice lines under hydroponic salinity screening. IOP Conf. Ser. Earth Environ. Sci. 484:012001. doi: 10.1088/1755-1315/484/1/012001
Anshori, M. F., Purwoko, B. S., Dewi, I. S., Suwarno, W. B., and Ardie, S. W. (2022). Salinity tolerance selection of doubled-haploid rice lines based on selection index and factor analysis. AIMS Agric. Food. 7, 520–535. doi: 10.3934/agrfood.2022032
Arifah, S., Salman, D., Yassi, A., and Bahsar-Demmallino, E. (2022). Climate change impacts and the rice farmers’ responses at irrigated upstream and downstream in Indonesia. Heliyon 8:e11923. doi: 10.1016/j.heliyon.2022.e11923
Arifuddin, M., Musa, Y., Farid, M., Anshori, M. F., Nasaruddin, N., Nur, A., et al. (2021). Rice screening with hydroponic deep-flow technique under salinity stress. SABRAO J. Breed. Genet. 53, 435–446. Available at: https://www.researchgate.net/publication/354641038_RICE_SCREENING_WITH_HYDROPONIC_DEEP-FLOW_TECHNIQUE_UNDER_SALINITY_STRESS
Aswidinnoor, H., Listiyanto, R., Rahim, S., Holidin,, Setiyowati, H., Nindita, A., et al. (2023). Stability analysis, agronomic performance, and grain quality of elite new plant type rice lines (Oryza sativa L.) developed for tropical lowland ecosystem. Front. Sustain. Food Syst. 7:1147611. doi: 10.3389/fsufs.2023.1147611
Atta, K., Mondal, S., Gorai, S., Singh, A. P., Kumari, A., Ghosh, T., et al. (2023). Impacts of salinity stress on crop plants: improving salt tolerance through genetic and molecular dissection. Front. Plant Sci. 14, 1–21. doi: 10.3389/fpls.2023.1241736
Azadi, H., Taheri, F., Burkart, S., Mahmoudi, H., De Maeyer, P., and Witlox, F. (2021). Impact of agricultural land conversion on climate change. Environ. Dev. Sustain. 23, 3187–3198. doi: 10.1007/s10668-020-00712-2
Bado, S., Forster, B. P., Ghanim, A. M. A., Jankowicz-Cieslak, J., Berthold, G., and Luxiang, L. (2016). Protocols for pre-field screening of mutants for salt tolerance in rice, wheat and barley. Cham: Springer International Publishing.
Baharuddin, A. K., Padjung, R., Kaimuddin, K., Musa, Y., Bahrun, A. H., Yassi, A., et al. (2025). Validation assessment of nitrogen and irrigation effects on early maturing rice varieties Cakrabuana and Inpari 13 through ORYZA (v3) modeling. Front. Sustain. Food Syst. 9:1541691. doi: 10.3389/fsufs.2025.1541691
Balasubramaniam, T., Shen, G., Esmaeili, N., and Zhang, H. (2023). Plants’ response mechanisms to salinity stress. Plants 12, 1–22. doi: 10.3390/plants12122253
Ćalić, I., Groen, S. C., Choi, J. Y., Joly-Lopez, Z., Hamann, E., Natividad, M. A., et al. (2022). The influence of genetic architecture on responses to selection under drought in rice. Evol. Appl. 15, 1670–1690. doi: 10.1111/eva.13419
Cen, H., Wan, L., Zhu, J., Li, Y., Li, X., Zhu, Y., et al. (2019). Dynamic monitoring of biomass of rice under different nitrogen treatments using a lightweight UAV with dual image-frame snapshot cameras. Plant Methods 15:32. doi: 10.1186/s13007-019-0418-8
Chen, T., Niu, Y., Yang, C., Liang, Y., and Xu, J. (2024). Screening of rice (Oryza sativa L.) genotypes for salinity tolerance and dissecting determinants of tolerance mechanism. Plants 13, 1–11. doi: 10.3390/plants13071036
Chen, C., Norton, G. J., and Price, A. H. (2020). Genome-wide association mapping for salt tolerance of rice seedlings grown in hydroponic and soil systems using the Bengal and Assam Aus panel. Front. Plant Sci. 11, 1–18. doi: 10.3389/fpls.2020.576479
Chen, T., Shabala, S., Niu, Y., Chen, Z.-H., Shabala, L., Meinke, H., et al. (2021). Molecular mechanisms of salinity tolerance in rice. Crop J. 9, 506–520. doi: 10.1016/j.cj.2021.03.005
Coswosk, G. G., Gonçalves, V. M. L., de Lima, V. J., de Souza, G. A. R., Teixeira do Amaral Junior, A., Pereira, M. G., et al. (2024). Utilizing visible band vegetation indices from unmanned aerial vehicle images for maize phenotyping. Remote Sens 16:3015. doi: 10.3390/rs16163015
Dehnavi, A. R., Zahedi, M., Ludwiczak, A., Perez, S. C., and Piernik, A. (2020). Effect of salinity on seed germination and seedling development of sorghum (Sorghum bicolor (L.) Moench) genotypes. Agronomy 10:859. doi: 10.3390/agronomy10060859
Dewi, E. S., Abdulai, I., Bracho-Mujica, G., and Rötter, R. P. (2022). Salinity constraints for small-scale agriculture and impact on adaptation in North Aceh, Indonesia. Agronomy 12:341. doi: 10.3390/agronomy12020341
Dewi, I. S., Syafii, M., Purwoko, B. S., and Suwarno, W. B. (2017). Efficient indica rice anther culture derived from three-way crosses. SABRAO J. Breed. Genet. 49, 336–345. Available at: https://www.researchgate.net/publication/321963544
Dieng, I., Gardunia, B., Covarrubias-pazaran, G., Gemenet, D. C., Trognitz, B., Ofodile, S., et al. (2024). Q&A: methods for estimating genetic gain in sub-Saharan Africa and achieving improved gains. Plant Genome 17, 1–16. doi: 10.1002/tpg2.20471
Dwiningsih, Y. (2023). Utilizing the genetic potentials of traditional rice varieties and conserving Rice biodiversity with system of Rice intensification management. Agronomy 13:3015. doi: 10.3390/agronomy13123015
El Moukhtari, A., Cabassa-Hourton, C., Farissi, M., and Savouré, A. (2020). How does proline treatment promote salt stress tolerance during crop plant development? Front. Plant Sci. 11, 1–16. doi: 10.3389/fpls.2020.01127
Erythrina, E., Anshori, A., Bora, C. Y., Dewi, D. O., Lestari, M. S., Mustaha, M. A., et al. (2021). Assessing opportunities to increase yield and profit in rainfed lowland rice systems in Indonesia. Agronomy 11:777. doi: 10.3390/agronomy11040777
Farid, M., Anshori, M., Musa, Y., Iswoyo, H., and Sakinah, A. (2021). Interaction of rice salinity screening in germination and seedling phase through selection index based on principal components. Chil. J. Agric. Res. 81, 368–377. doi: 10.4067/S0718-58392021000300368
Fellahi, Z. E. A., Boubellouta, T., Bentouati, I., Safsaf, H., Hannachi, A., Utkina, A. O., et al. (2024). Hydroponic screening at early seedling stage identified sources of salinity tolerance in wheat (Triticum aestivum L.) crop. Agronomy 14:984. doi: 10.3390/agronomy14050984
Fernandez, G. J., (1992). Effective Selection Criteria for Assessing Plant Stress Tolerance. In: “Proceeding of the International Symposium on adaptation of vegetables and other food crops in temperature and water stress,” 257–270.
Fu, H., and Yang, Y. (2023). How plants tolerate salt stress. Curr. Issues Mol. Biol. 45, 5914–5934. doi: 10.3390/cimb45070374
Fukagawa, N. K., and Ziska, L. H. (2019). Rice: importance for global nutrition. J. Nutr. Sci. Vitaminol. (Tokyo) 65, S2–S3. doi: 10.3177/jnsv.65.S2
Gerona, M. E. B., Deocampo, M. P., Egdane, J. A., Ismail, A. M., and Dionisio-Sese, M. L. (2019). Physiological responses of contrasting rice genotypes to salt stress at reproductive stage. Rice Sci. 26, 207–219. doi: 10.1016/j.rsci.2019.05.001
Goldstein, I., and Ehrenreich, I. M. (2021). The complex role of genetic background in shaping the effects of spontaneous and induced mutations. Yeast 38, 187–196. doi: 10.1002/yea.3530
Griggs, G., and Reguero, B. G. (2021). Coastal adaptation to climate change and sea-level rise. Water 13:2151. doi: 10.3390/w13162151
Gudi, S., Kumar, P., Singh, S., Tanin, M. J., and Sharma, A. (2022). Strategies for accelerating genetic gains in crop plants: special focus on speed breeding. Physiol. Mol. Biol. Plants 28, 1921–1938. doi: 10.1007/s12298-022-01247-8
Hadianto, W., Purwoko, B. S., Dewi, I. S., Suwarno, W. B., and Hidayat, P. (2023). Selection index and agronomic characters of doubled haploid rice lines from anther culture. Biodiversitas 24, 1511–1517. doi: 10.13057/biodiv/d240321
Hallajian, M. T., Ebadi, A. A., and Kordrostami, M. (2024). Advancing rice breeding for drought tolerance: a comprehensive study of traditional and mutant lines through agronomic performance and drought tolerance indices. BMC Plant Biol. 24:1087. doi: 10.1186/s12870-024-05771-5
Hartatik, S., Rozzita, N., Wibowo, S., Choirunnisa, E., Sakanti, S. A. S., Puspito, A. N., et al. (2024). Characterization of rice varieties under salinity level and the response of defense-related genes during the germination stage. Biodiversitas 25, 1536–1543. doi: 10.13057/biodiv/d250422
Hasanuzzaman, M., Raihan, M. R. H., Masud, A. A. C., Rahman, K., Nowroz, F., Rahman, M., et al. (2021). Regulation of reactive oxygen species and antioxidant defense in plants under salinity. Int. J. Mol. Sci. 22:9326. doi: 10.3390/ijms22179326
Herawati, R., Simarmata, M., Masdar, M., Purwoko, B. S., and Miswati, M. (2024). Systematic assessment of salt tolerance based on morpho-physiological traits and genes related in inbred rice lines at the seedling stage. Biodiversitas 25, 9–20. doi: 10.13057/biodiv/d250102
Hooshmandi, B. (2019). Evaluation of tolerance to drought stress in wheat genotypes. Idesia (Arica) 37, 37–43. doi: 10.4067/S0718-34292019000200037
Hosseinifard, M., Stefaniak, S., Javid, M. G., Soltani, E., Wojtyla, Ł., and Garnczarska, M. (2022). Contribution of exogenous proline to abiotic stresses tolerance in plants: a review. Int. J. Mol. Sci. 23:5186. doi: 10.3390/ijms23095186
Huqe, M. A. S., Haque, M. S., Sagar, A., Uddin, M. N., Hossain, M. A., Hossain, A. K. M. Z., et al. (2021). Characterization of maize hybrids (Zea mays l.) for detecting salt tolerance based on morpho-physiological characteristics, ion accumulation and genetic variability at early vegetative stage. Plants 10:2549. doi: 10.3390/plants10112549
IRRI (2021). Phenotyping protocols for abiotic stress tolerance in Rice. Los Baños: International Rice Research Institute.
Ivanova, Z., Pasev, G., Pashkoulova, V., Radeva, V., and Grozeva, S. (2025). Development of double haploid lines from cucumber mosaic virus resistant pepper germplasm by anther culture. Horticulturae 11:293. doi: 10.3390/horticulturae11030293
Jabir, A.-A., Hasan, G. M. J., and Anam, M. M. (2021). Correlation between temperature, sea level rise and land loss: an assessment along the Sundarbans coast. J. King Saud Univ. Eng. Sci. doi: 10.1016/j.jksues.2021.07.012
Jamal, M. R., Kristiansen, P., Kabir, M. J., and Lobry de Bruyn, L. (2023). Challenges and adaptations for resilient Rice production under changing environments in Bangladesh. Land 12:1217. doi: 10.3390/land12061217
Jia, W., Sun, M., Lian, J., and Hou, S. (2022). Feature dimensionality reduction: a review. Complex Intell. Syst. 8, 2663–2693. doi: 10.1007/s40747-021-00637-x
Jollife, I. T., and Cadima, J. (2016). Principal component analysis: a review and recent developments. Philos. Trans. R. Soc. A Math. Phys. Eng. Sci. 374, 1–15. doi: 10.1098/rsta.2015.0202
Kandel, B. P., Joshi, L. P., Sharma, S., Adhikari, P., Koirala, B., and Shrestha, K. (2022). Drought tolerance screening of rice genotypes in mid-hills of Nepal using various drought indices. Acta Agric. Scand. Sec. B Soil Plant Sci. 72, 744–750. doi: 10.1080/09064710.2022.2072382
Karavolias, N. G., Greenberg, A. J., Barrero, L. S., Maron, L. G., Shi, Y., Monteverde, E., et al. (2020). Low additive genetic variation in a trait under selection in domesticated rice. G3 10, 2435–2443. doi: 10.1534/g3.120.401194
Kawamura, K., Asai, H., Yasuda, T., Soisouvanh, P., and Phongchanmixay, S. (2021). Discriminating crops/weeds in an upland rice field from UAV images with the SLIC-RF algorithm. Plant Prod. Sci. 24, 198–215. doi: 10.1080/1343943X.2020.1829490
Khan, M. M., Rahman, M. M., Hasan, M. M., Amin, M. F., Matin, M. Q. I., Faruq, G., et al. (2024). Assessment of the salt tolerance of diverse bread wheat (Triticum aestivum L.) genotypes during the early growth stage under hydroponic culture conditions. Heliyon 10:e29042. doi: 10.1016/j.heliyon.2024.e29042
Kinose, Y., Masutomi, Y., Shiotsu, F., Hayashi, K., Ogawada, D., Gomez-Garcia, M., et al. (2019). Impact assessment of climate change on the major rice cultivar Ciherang in Indonesia. J. Agric. Meteorol. 76, 19–28. doi: 10.2480/agrmet.D-19-00045
Kior, A., Yudina, L., Zolin, Y., Sukhov, V., and Sukhova, E. (2024). RGB imaging as a tool for remote sensing of characteristics of terrestrial plants: a review. Plants 13:1262. doi: 10.3390/plants13091262
Kleinknecht, K., Möhring, J., Singh, K. P., Zaidi, P. H., Atlin, G. N., and Piepho, H. P. (2013). Comparison of the performance of best linear unbiased estimation and best linear unbiased prediction of genotype effects from zoned Indian maize data. Crop Sci. 53, 1384–1391. doi: 10.2135/cropsci2013.02.0073
Koc, Y. E., Aycan, M., and Mitsui, T. (2024). Self-defense mechanism in rice to salinity: proline. J 7, 103–115. doi: 10.3390/j7010006
Korres, N. E., Loka, D. A., Gitsopoulos, T. K., Varanasi, V. K., Chachalis, D., Price, A., et al. (2022). Salinity effects on rice, rice weeds, and strategies to secure crop productivity and effective weed control. A review. Agron. Sustain. Dev. 42:58. doi: 10.1007/s13593-022-00794-4
Kumar, P., Choudhary, M., Halder, T., Prakash, N. R., Singh, V., Vineeth, V. T., et al. (2022). Salinity stress tolerance and omics approaches: revisiting the progress and achievements in major cereal crops. Heredity (Edinb) 128, 497–518. doi: 10.1038/s41437-022-00516-2
Kumar, K. P., Pushpam, R., Manonmani, S., Raveendran, M., Santhiya, S., and Senthil, A. (2024). Enhancing stress resilience in rice (Oryza sativa L.) through profiling early-stage morpho-physiological and molecular responses to multiple abiotic stress tolerance. Front. Plant Sci. 15:1342441. doi: 10.3389/fpls.2024.1342441
LaBudde, R. A., and Harnly, J. (2012). Probability of identification: a statistical model for the validation of qualitative botanical identification methods. J. AOAC Int. 95, 273–285. doi: 10.5740/jaoacint.11-266
Lantos, C., Jancsó, M., Székely, Á., Nagy, É., Szalóki, T., and Pauk, J. (2022). Improvement of anther culture to integrate doubled haploid technology in temperate rice (Oryza sativa L.) breeding. Plants 11, 1–16. doi: 10.3390/plants11243446
Laraswati, A. A., Padjung, R., Farid, M., Nasaruddin, N., Anshori, M. F., Nur, A., et al. (2021). Image based-phenotyping and selection index based on multivariate analysis for rice hydroponic screening under drought stress. Plant Breed. Biotechnol. 9, 272–286. doi: 10.9787/PBB.2021.9.4.272
Lestari, A. P., Sopandie, D., and Aswidinnoor, H. (2019). Estimation for stress tolerance indices of rice genotypes in low nitrogen condition. Agric. Sci. Soc. Thail. 52, 180–190.
Li, D., Quan, C., Song, Z., Li, X., Yu, G., Li, C., et al. (2021). High-throughput plant phenotyping platform (HT3P) as a novel tool for estimating agronomic traits from the lab to the field. Front. Bioeng. Biotechnol. 8, 1–24. doi: 10.3389/fbioe.2020.623705
Li, P., Xiao, L., Du, Q., Quan, M., Song, Y., He, Y., et al. (2023). Genomic insights into selection for heterozygous alleles and woody traits in Populus tomentosa. Plant Biotechnol. J. 21, 2002–2018. doi: 10.1111/pbi.14108
Lichtenthaler, H. K. (1987). Chlorophylls and carotenoids: pigments of photosynthetic biomembranes. Methods Enzymol. 148, 350–382. doi: 10.1016/0076-6879(87)48036-1
Liu, C., Chen, K., Zhao, X., Wang, X., Shen, C., Zhu, Y., et al. (2019). Identification of genes for salt tolerance and yield-related traits in rice plants grown hydroponically and under saline field conditions by genome-wide association study. Rice 12:88. doi: 10.1186/s12284-019-0349-z
Liu, C., Jiang, X., and Yuan, Z. (2024). Plant responses and adaptations to salt stress: a review. Horticulturae 10, 1–19. doi: 10.3390/horticulturae10111221
Liu, H., Wang, Q., Chen, M., Ding, Y., Yang, X., Liu, J., et al. (2020). Genome-wide identification and analysis of heterotic loci in three maize hybrids. Plant Biotechnol. J. 18, 185–194. doi: 10.1111/pbi.13186
Lone, A. A., Jumaa, S. H., Wijewardana, C., Taduri, S., Redona, E. D., and Raja Reddy, K. (2019). Drought stress tolerance screening of elite American breeding rice genotypes using low-cost pre-fabricated mini-hoop modules. Agronomy 9:199. doi: 10.3390/agronomy9040199
Lu, C., Li, L., Liu, X., Chen, M., Wan, S., and Li, G. (2023). Salt stress inhibits photosynthesis and destroys chloroplast structure by downregulating chloroplast development–related genes in Robinia pseudoacacia seedlings. Plants 12:1283. doi: 10.3390/plants12061283
Lutambi, K. K., Henry, A., De Ocampo, M., Chebotarov, D., Pedersen, O., Nchimbi-Msolla, S., et al. (2024). Genotypic screening for salinity tolerance of rice genotypes from eastern and southern Africa at seedling stage. J. Plant Interact. 19:2349623. doi: 10.1080/17429145.2024.2349623
Manavalan, L. P., Cui, I., Ambrose, K. V., Panjwani, S., DeLong, S., Mleczko, M., et al. (2021). Systematic approach to validate and implement digital phenotyping tool for soybean: a case study with PlantEye. Plant Phenome J. 4, 1–17. doi: 10.1002/ppj2.20025
Mazhar, S., Pellegrini, E., Contin, M., Bravo, C., and De Nobili, M. (2022). Impacts of salinization caused by sea level rise on the biological processes of coastal soils - a review. Front. Environ. Sci. 10, 1–18. doi: 10.3389/fenvs.2022.909415
Meena, M., Divyanshu, K., Kumar, S., Swapnil, P., Zehra, A., Shukla, V., et al. (2019). Regulation of L-proline biosynthesis, signal transduction, transport, accumulation and its vital role in plants during variable environmental conditions. Heliyon 5:e02952. doi: 10.1016/j.heliyon.2019.e02952
Miftahudin, M., Putri, R. E., and Chikmawati, T. (2020). Vegetative morphophysiological responses of four rice cultivars to drought stress. Biodiversitas J. Biol. Divers. 21, 3727–3734. doi: 10.13057/biodiv/d210840
Mishra, R., and Rao, G. J. N. (2016). In-vitro androgenesis in rice: advantages, constraints and future prospects. Rice Sci. 23, 57–68. doi: 10.1016/j.rsci.2016.02.001
Mochida, K., Koda, S., Inoue, K., Hirayama, T., Tanaka, S., Nishii, R., et al. (2018). Computer vision-based phenotyping for improvement of plant productivity: a machine learning perspective. Gigascience 8, 1–12. doi: 10.1093/gigascience/giy153
Mohidem, N. A., Hashim, N., Shamsudin, R., and Che Man, H. (2022). Rice for food security: revisiting its production, diversity, rice milling process and nutrient content. Agriculture 12:741. doi: 10.3390/agriculture12060741
Myllyaho, L., Raatikainen, M., Männistö, T., Mikkonen, T., and Nurminen, J. K. (2021). Systematic literature review of validation methods for AI systems. J. Syst. Softw. 181:111050. doi: 10.1016/j.jss.2021.111050
Nasaruddin, N., Farid, M., Iswoyo, H., and Anshori, M. F. (2024). Utilizing stress tolerance index and principal component analysis for rice selection in hydroponic drought screening based on physiological traits. Int. J. Agric. Biosci. 13, 736–743. doi: 10.47278/journal.ijab/2024.176
Nayak, P., Mukherjee, A. K., Pandit, E., and Pradhan, S. K. (2018). Application of statistical tools for data analysis and interpretation in rice plant pathology. Rice Sci. 25, 1–18. doi: 10.1016/j.rsci.2017.07.001
Nelson, N., Stubbs, C. J., Larson, R., and Cook, D. D. (2019). Measurement accuracy and uncertainty in plant biomechanics. J. Exp. Bot. 70, 3649–3658. doi: 10.1093/jxb/erz279
Nguyen, H. T. T., Das Bhowmik, S., Long, H., Cheng, Y., Mundree, S., and Hoang, L. T. M. (2021). Rapid Accumulation of Proline Enhances Salinity Tolerance in Australian Wild Rice Oryza australiensis Domin. Plants 10:2044. doi: 10.3390/plants10102044
Niazian, M., and Shariatpanahi, M. E. (2020). In vitro-based doubled haploid production: recent improvements. Euphytica 216:69. doi: 10.1007/s10681-020-02609-7
Nisbett, K. J., Alokozai, A., Hyun ElizabethKo, S., AdamMott, G., and Brown, J. C. L. (2024). Degradation and resynthesis of chlorophyll during increased oxidative stress and prolonged darkness differ between annual and perennial flax (Linum L.). Oil Crop Sci. 9, 121–130. doi: 10.1016/j.ocsci.2024.04.001
Nong, D. H., Ngo, A. T., Nguyen, H. P. T., Nguyen, T. T., Nguyen, L. T., and Saksena, S. (2021). Changes in coastal agricultural land use in response to climate change: an assessment using satellite remote sensing and household survey data in Tien Hai District, Thai Binh Province, Vietnam. Land 10:627. doi: 10.3390/land10060627
Olson, S., Jansen, M. F., Abbot, D. S., Halevy, I., and Goldblatt, C. (2022). The effect of ocean salinity on climate and its implications for earth’s habitability. Geophys. Res. Lett. 49, e2021GL095748–e2021GL095749. doi: 10.1029/2021GL095748
Pabuayon, I. C. M., Pabuayon, I. L. B., Singh, R. K., Ritchie, G. L., and de los Reyes, B. G. (2022). Applicability of hyperspectral imaging during salinity stress in rice for tracking Na+ and K+ levels in planta. PLoS One 17, 1–18. doi: 10.1371/journal.pone.0270931
Paul, P. L. C., Jahan, A., Kundu, P. K., Roy, D., Bell, R. W., Hossain, M. B., et al. (2024). Rice growth and yield responses to saline water irrigation are related to Na+/K+ ratio in plants. PLoS One 19, 1–14. doi: 10.1371/journal.pone.0312372
Phanniphong, K., and Na-Nan, K. (2025). Development and validation of a factor analysis-validated comprehensive scale for measuring innovative work behavior. Sustain. Futures 9:100704. doi: 10.1016/j.sftr.2025.100704
Purbajanti, E. D., Kusmiyati, F., Fuskhah, E., Rosyida, R., Adinurani, P. G., and Vincēviča-Gaile, Z. (2019). Selection for drought-resistant rice (Oryza sativa L.) using polyethylene glycol. IOP Conf. Ser. Earth Environ. Sci. 293, 1–7. doi: 10.1088/1755-1315/293/1/012014
Rahimi, M., and Debnath, S. (2023). Estimating optimum and base selection indices in plant and animal breeding programs by development new and simple SAS and R codes. Sci. Rep. 13:18977. doi: 10.1038/s41598-023-46368-6
Rahman, M. A., Thomson, M. J., De Ocampo, M., Egdane, J. A., Salam, M. A., Shah-E-Alam, M., et al. (2019). Assessing trait contribution and mapping novel QTL for salinity tolerance using the Bangladeshi rice landrace capsule. Rice 12:63. doi: 10.1186/s12284-019-0319-5
Reddy, I. N. B. L., Kim, B. K., Yoon, I. S., Kim, K. H., and Kwon, T. R. (2017). Salt tolerance in rice: focus on mechanisms and approaches. Rice Sci. 24, 123–144. doi: 10.1016/j.rsci.2016.09.004
Reed, M. S., Ferré, M., Martin-Ortega, J., Blanche, R., Lawford-Rolfe, R., Dallimer, M., et al. (2021). Evaluating impact from research: a methodological framework. Res. Policy 50:104147. doi: 10.1016/j.respol.2020.104147
Ren, J., Wu, P., Trampe, B., Tian, X., Lübberstedt, T., and Chen, S. (2017). Novel technologies in doubled haploid line development. Plant Biotechnol. J. 15, 1361–1370. doi: 10.1111/pbi.12805
Ridwan, I., Farid, M., Haring, F., Widiayani, N., Yani, A., Amier, N., et al. (2025). Optimized framework for evaluating F3 transgressive segregants in cayenne pepper. BMC Plant Biol. 25:156. doi: 10.1186/s12870-025-06182-w
Rocha, J. R. d. A. S. d. C., Machado, J. C., and Carneiro, P. C. S. (2018). Multitrait index based on factor analysis and ideotype-design: proposal and application on elephant grass breeding for bioenergy. GCB Bioenergy 10, 52–60. doi: 10.1111/gcbb.12443
Rumanti, I. A., Hairmansis, A., Nugraha, Y., Nafisah,, Susanto, U., Wardana, P., et al. (2018). Development of tolerant rice varieties for stress-prone ecosystems in the coastal deltas of Indonesia. F. Crop. Res. 223, 75–82. doi: 10.1016/j.fcr.2018.04.006
Sakinah, A. I., Farid, M., Musa, Y., Hairmansis, A., and Anshori, M. F. (2024). Seedling stage image-based phenotyping selection criteria through tolerance indices on drought and salinity stress in rice. Plant Breed. Biotechnol. 12, 43–58. doi: 10.9787/PBB.2024.12.43
Sakinah, A. I., Musa, Y., Farid, M., Hairmansis, A., Anshori, M. F., and Nasaruddin, N. (2022). Rice selection criteria based on morphological and image-based phenotyping under drought- and salinity-stress conditions. SABRAO J. Breed. Genet. 54, 686–699. doi: 10.54910/sabrao2022.54.4.1
Sarwendah, M., Lubis, I., Junaedi, A., Purwoko, B. S., Sopandie, D., and Dewi, A. K. (2022). Application of selection index for rice mutant screening under a drought stress condition imposed at reproductive growth phase. Biodiversitas 23, 5446–5452. doi: 10.13057/biodiv/d231056
Satpathi, A., Setiya, P., Das, B., Nain, A. S., Jha, P. K., Singh, S., et al. (2023). Comparative analysis of statistical and machine learning techniques for Rice yield forecasting for Chhattisgarh, India. Sustainability 15, 1–18. doi: 10.3390/su15032786
Sekaranom, A. B., Nurjani, E., and Nucifera, F. (2021). Agricultural climate change adaptation in Kebumen, Central Java, Indonesia. Sustainability 13, 1–16. doi: 10.3390/su13137069
Singh, R. K., Kota, S., and Flowers, T. J. (2021). Salt tolerance in rice: seedling and reproductive stage QTL mapping come of age. Theor. Appl. Genet. 134, 3495–3533. doi: 10.1007/s00122-021-03890-3
So, C. P., Sibolibane, M. M., and Weis, A. E. (2022). An exploration into the conversion of dominance to additive genetic variance in contrasting environments. Am. J. Bot. 109, 1893–1905. doi: 10.1002/ajb2.16083
Soltabayeva, A., Ongaltay, A., Omondi, J. O., and Srivastava, S. (2021). Morphological, physiological and molecular markers for salt-stressed plants. Plants 10:243. doi: 10.3390/plants10020243
Sugasi, Y. D., Srivastava, A., Badri, J., Pandey, M., Parmar, B., Singh, A. K., et al. (2024). Mapping quantitative trait loci (QTLs) for reproductive stage salinity tolerance in rice. Crops 4, 684–700. doi: 10.3390/crops4040047
Tabassum, R., Tahjib-Ul-Arif, M., Hasanuzzaman, M., Sohag, A. A. M., Islam, M. S., Shafi, S. M. S. H., et al. (2021). Screening salt-tolerant rice at the seedling and reproductive stages: an effective and reliable approach. Environ. Exp. Bot. 192:104629. doi: 10.1016/j.envexpbot.2021.104629
Ubaidillah, M., Farooq, M., and Kim, K. M. (2024). Enhancing salt tolerance in rice genotypes through exogenous melatonin application by modulating growth patterns and antistress agents. Sci. Rep. 14:25217. doi: 10.1038/s41598-024-77161-8
Vârban, R., Vidican, R., Ona, A. D., Vârban, D., Stoie, A., Gâdea, Ș., et al. (2022). Modelling plant morphometric parameters as predictors for successful cultivation of some medicinal Agastache species modelling plant morphometric parameters as predictors for successful cultivation of some medicinal Agastache species. Not. Bot. Horti. Agrobot. Cluj.-Na. 50, 12638–12618. doi: 10.15835/nbha50112638
Villiers, K., Voss-Fels, K. P., Dinglasan, E., Jacobs, B., Hickey, L., and Hayes, B. J. (2024). Evolutionary computing to assemble standing genetic diversity and achieve long-term genetic gain. Plant Genome 17:e20467. doi: 10.1002/tpg2.20467
Voitsekhovskaja, O. V., Apollonov, V. I., Murtuzova, A. V., Rabadanova, C. K., Charnysh, M. A., Drozdova, I. V., et al. (2020). Photosynthetic activity as assessed via chlorophyll a fluorescence suggesta role of potassium channels in root to shoot signaling. Photosynthetica 58, 608–621. doi: 10.32615/ps.2020.025
Wang, X., Chen, Z., and Sui, N. (2024). Sensitivity and responses of chloroplasts to salt stress in plants. Front. Plant Sci. 15, 1–11. doi: 10.3389/fpls.2024.1374086
Wang, H., Zou, Z., Wang, S., and Gong, M. (2013). Global analysis of transcriptome responses and gene expression profiles to cold stress of Jatropha curcas L. PLoS One 8:e82817. doi: 10.1371/journal.pone.0082817
Wellmann, R. (2023). Selection index theory for populations under directional and stabilizing selection. Genet. Sel. Evol. 55, 10–17. doi: 10.1186/s12711-023-00776-4
Wiwart, M., Fordoński, G., Żuk-Gołaszewska, K., and Suchowilska, E. (2009). Early diagnostics of macronutrient deficiencies in three legume species by color image analysis. Comput. Electron. Agric. 65, 125–132. doi: 10.1016/j.compag.2008.08.003
Wu, H., Guo, J., Wang, C., Li, K., Zhang, X., Yang, Z., et al. (2019). An effective screening method and a reliable screening trait for salt tolerance of Brassica napus at the germination stage. Front. Plant Sci. 10, 1–12. doi: 10.3389/fpls.2019.00530
Keywords: BLUE, colorimetric index, image processing, morphometric index, Oryza sativa
Citation: Anshori MF, Purwoko BS, Carsono N, Dewi IS, Suwarno WB, Ardie SW, Bahrun AH, Baharuddin AK, Khaerani PI, Ali Z, Alotaibi M, Ali N and Seleiman MF (2025) Optimizing hydroponic salinity screening: a novel approach using image-based phenotyping for double haploid rice selection. Front. Sustain. Food Syst. 9:1659331. doi: 10.3389/fsufs.2025.1659331
Edited by:
Shaowu Hu, Yangzhou University, ChinaReviewed by:
Victoria Freitas De Oliveira, University of Padua, ItalyDunliang Wang, Suzhou Academy of Agricultural Sciences, China
Copyright © 2025 Anshori, Purwoko, Carsono, Dewi, Suwarno, Ardie, Bahrun, Baharuddin, Khaerani, Ali, Alotaibi, Ali and Seleiman. This is an open-access article distributed under the terms of the Creative Commons Attribution License (CC BY). The use, distribution or reproduction in other forums is permitted, provided the original author(s) and the copyright owner(s) are credited and that the original publication in this journal is cited, in accordance with accepted academic practice. No use, distribution or reproduction is permitted which does not comply with these terms.
*Correspondence: Muhammad Fuad Anshori, ZnVhZC5hbnNob3JpQHVuaGFzLmFjLmlk