 Réussite Bugale Malembaka1*
 Stephan Pfister2
 Braida Thom1Rosângela Pezza Cintrão3Maria Isabel Trivilin4Johanna Jacobi1
- 1Agroecological Transitions, Institute of Agricultural Sciences, ETH Zurich, Zurich, Switzerland
- 2Ecological System Design, Institute of Environmental Engineering, ETH Zurich, Zurich, Switzerland
- 3Centre of Reference in Food Security and Sovereignty, CERESAN, Rural Federal University of Rio de Janeiro, UFRRJ, Rio de Janeiro, Brazil
- 4Graduate Program in Social Anthropology at the National Museum, PPGAS/MN/UFRJ, Rio de Janeiro, Brazil
The predominant agro-industrial soybean production in Brazil has led to a significant socio-ecological crisis. Alternative agriculture has been increasingly marketed as a viable solution to the multifaceted challenges engendered by this intensive production system in the Atlantic Forest biome of Brazil and its related global value chains. Accurate evaluation of their true transformative impact on sustainable food system transitions is needed. We conducted a Life Cycle Assessment (LCA) of five different soybean production systems in the States of Minas Gerais and Paraná: conventional GM (genetically modified seeds), and four alternatives [(1) conventional GM inputs-reduced, (2) conventional non-GM, (3) conventional non-GM soybean–coffee intercropped, and (4) organic]. We collected life cycle inventory data through interviews and observations over a 2-year period and assessed environmental impacts on climate change, biodiversity loss, soil quality, acidification, eutrophication, ecotoxicity, human toxicity, particulate matter formation, and energy use. Results obtained showed significant variability in footprints of the studied systems, with alternatives scoring similar or higher impacts in climate change, acidification, eutrophication, and non-renewable energy use compared to conventional production systems. Organic and soybean–coffee intercropped productions had the lowest biodiversity loss, ecotoxicity, and soil quality impacts. Our sensitivity analysis indicated that a 10% reduction in fertilizers and diesel could decrease emissions by 0 to 14.4% across production systems, with most impact categories exhibiting impact reductions below 10%. Alternative productions faced challenges such as weed control, bioinput production, and efficiency, as well as contamination from conventional neighboring farms. Addressing these led to an increased use of diesel and biopesticides. From an LCA perspective, organic and non-GM production did not outperform conventional GM production. However, organic production, followed by soybean–coffee intercropping, achieved significantly higher on-farm agrobiodiversity scores. A diversification of soybean cropping systems and improved management of crop residues would effectively reduce inputs, favor closing nutrient loops locally, and avoid replicating the environmental impacts of intensive monocultures. However, the initial decrease in soybean production volumes might lead to additional land use elsewhere.
Highlights
• Alternative soybean production systems can have lower, similar, or higher environmental impacts compared to the conventional GM system.
• The lowest GHG emissions per kg of soybean were obtained in the soybean–coffee intercropped system with 0.58 kg CO2e.
• Organic production faces challenges with weeds, bio-inputs, and contamination from neighboring conventional farms.
• Reducing environmental impact requires not only minimizing inputs but also intercropping.
• Different functional units and agroecological metrics are needed for a comprehensive sustainability assessment.
1 Introduction
Brazilian agricultural production is among the most expansive and the fastest transforming in history (Søndergaard et al., 2023). Brazil stands as the world’s leading producer of soybean (Glycine max (L) Merr.), as the crop has emerged as a key commodity in global agribusiness, significantly contributing to the country’s gross domestic product (USDA, 2024; CONAB, 2025; FAOSTAT, 2025). In 2025, the country produced a record of 171 million tons of soybean, on a record area of 47 million hectares, and exported an unprecedented 107 million tons (63% of total production), worth over $53 billion, of which 73% headed to China (CONAB, 2025; CEPEA/ESALQ, 2025). In 2024, increases of around 2.5% were projected in both area planted and total production, driven mainly by the steady increase in global demand for feed proteins (Weis, 2013; Escher and Wilkinson, 2019) to record values (Trase, 2023; IBGE, 2024).
Brazil officially authorized genetically modified (GM) crops in 2003, and by 2023, over 95% of its soybeans were grown conventionally1 with GM seeds (de Almeida et al., 2017; Embrapa, 2023; Proterra, 2024). This predominant production pathway is input-intensive, especially in terms of mineral fertilizers, pesticides, and diesel. Over 80% of mineral fertilizers used in Brazil are imported, primarily from Russia, Canada, China, and Morocco (ANDA, 2024). Moreover, Brazil accounts for over 20% of global pesticide use, of which more than half is applied to soybeans (Bombardi, 2017; de Almeida et al., 2017).
Soybean expansion has spanned all Brazilian biomes (Bustamante et al., 2023) and continues to spread (Bombardi, 2017; Song et al., 2021; IBGE, 2024; CONAB, 2025). This growth follows the productive model of the industrial grain–oilseed–livestock complex and reflects a food regime dominated by a corporate hegemony and capitalism (Weis, 2013; Escher and Wilkinson, 2019). The expansion and intensification of agriculture is the root cause of the global ecological crisis (Campbell et al., 2017; Rasmussen et al., 2018; Song et al., 2021), such as deforestation, land use change, greenhouse gasses (GHGs) emissions, biodiversity loss, seed genetic erosion, soil compaction, acidification, eutrophication, water and air pollutions, and human health effects (da Silva et al., 2015; Fehlenberg et al., 2017; Balmford et al., 2018; Escobar et al., 2020; Garofalo et al., 2022), as well as social injustices (Søndergaard et al., 2023; Maluf et al., 2023). Humanity has already transgressed six out of the nine planetary boundaries, and the share of agriculture to environmental impacts is large, amounting to 25% of GHGs, 80% of land system change, 80% of loss of biodiversity integrity, and over 85% of biogeochemical flows of nitrogen and phosphorus, causing acidification and eutrophication (Campbell et al., 2017; Richardson et al., 2023).
There is an urgency to transition to sustainability in food systems and adopt imperative post-growth paradigms of regeneration rather than intensive extraction (McGreevy et al., 2022; Søndergaard et al., 2023). Recently, scientists have increasingly called for converging to more sustainability in soybean production and related food systems (Muller et al., 2017; Poore and Nemecek, 2018; Sun et al., 2020; McGreevy et al., 2022; Maluf et al., 2023; Søndergaard et al., 2023). Increasing attention has been paid to the environmental footprints of agricultural production systems as indicators of environmental performance (Campbell et al., 2017; Rajão et al., 2020; Sun et al., 2020; Song et al., 2021; McGreevy et al., 2022; Søndergaard et al., 2023). Alternative production systems have been expanding and increasingly marketed as “sustainable” solutions to the multifaceted challenges engendered by the intensive production system (Tricase et al., 2018; Costantini and Bacenetti, 2021; Durham and Mizik, 2021; Kremsa, 2021). As these alternative production systems co-exist with the conventional system in the dynamic interplay with markets and unbalanced power relations among the many local and global value chain stakeholders (Maluf et al., 2023), there is therefore a need for a comprehensive understanding of the performance and actual transformative contribution of different soybean production systems to environmental sustainability.
Our two studied regions, located in the states of Minas Gerais and Paraná, are part of the Atlantic Forest biome, which is the Brazilian biome very deforested, with the lowest percentage of native forests left, and where soybean is still driving deforestation, though to a small extent compared to other biomes (Trase, 2023; IBGE, 2024; USDA, 2024). The biome is also a harbor of a rich biodiversity with over 20,000 plant species, of which around 6,000 are endemic, 850 birds, 370 amphibians, 200 reptiles, and 270 mammal species (Fundação SOS Mata Atlântica, 2023). Traditionally known for coffee production, the south of Minas Gerais state has been recently one of the regions with the highest rates of soybean expansion, while the west of Paraná is in the second largest soybean producer state of Brazil, with a history of over three decades of soybean production and with a continuous expansion of the area planted with soybeans (Fundação SOS Mata Atlântica, 2023; CONAB, 2025). Differently organized soybean production systems and related value chains have been emerging in these regions, with different degrees of innovative alternative systems, such as organic and conventional non-GM soybean production, and varying levels of input reduction or substitution (Conte et al., 2019; Kremsa, 2021; IDR-Paraná, 2025).
Life Cycle Assessment (LCA) has been widely adopted to compare production systems and the environmental performance of agricultural products (Naudin et al., 2014; Clark and Tilman, 2017; Acosta-Alba et al., 2019; Nemecek et al., 2019; van der Werf et al., 2020; Hashemi et al., 2024). The environmental impacts of soybean production can vary significantly depending on the study’s assumptions and spatio-temporal considerations. Escobar et al. (2020) estimated average GHG emissions of 0.6 and 0.4 kg CO2-eq kg−1 soybean in Minas Gerais and Paraná states, respectively. Raucci et al. (2015) found very low emissions of 0.18 CO2-eq kg−1 soybean in Mato Grosso state, while with high spatio-temporal differences, Romeiko et al. (2020) found much larger variations in the same production systems, and between production systems, Matsuura et al. (2017) found substantial variations in several environmental impacts of monocropped and intercropped soybean.
In recent years, many LCA studies of soybean in Brazil have often emphasized conventional production, often with carbon footprint as the main impact category, and sometimes no consideration of land use change in the assessment (Raucci et al., 2015; Maciel et al., 2015; Escobar et al., 2020). This leaves the assessments incomplete and unable to capture the complexity of agricultural systems. Alternative production systems can approach, match, and even exceed the productivity and the gross economic margin of industrial systems if they are measured by other metrics, beyond the yield and carbon footprint, like the food biomass produced per unit area or the number of people fed per unit of land (Gliessman, 2015; Sukhdev et al., 2016; Durham and Mizik, 2021). Furthermore, little emphasis has been made on soil quality impacts such as soil carbon, erosion, and compaction in LCA reports of agricultural systems, even though soil degradation is a major concern due to intensive land use (Sonderegger et al., 2020; De Laurentiis et al., 2024).
Accurate evaluation of their true transformative impact on sustainable food system transitions is needed, supported by ground-truth data, regionalized characterization factors, and context-relevant impact categories (Bartl et al., 2012; Kamali et al., 2017). We aimed to fill these research gaps by answering the question of how sustainable are the conventional and innovative alternative soybean systems from an environmental and agroecological perspective? How sensitive are the systems to input reduction? Site-specific inventory and emission estimations integrating local biophysical conditions and advanced LCA methods are necessary for more precise assessment and quality of results (Steubing et al., 2020; Romeiko et al., 2020; Matsuura et al., 2022). This study is groundbreaking as we used relevant metrics and agroecological parameters, such as on-farm agrobiodiversity and soil health (Meier et al., 2015; FAO, 2019; Lucas et al., 2025), to complement LCA’s results.
The objective of this study was to assess the environmental footprints of conventional and alternative soybean production systems in Paraná and Minas Gerais, Brazil. Given the various soybean cultivation pathways in Brazil, and for a comprehensive assessment, we identified the following impact categories as essential to investigate for their relevance in crop production systems: climate change, acidification potential, eutrophication potential, ecotoxicity potential, human toxicity potential, ozone depletion, particulate matter formation, non-renewable energy use, land use, biodiversity loss impact, and soil quality (Bartl et al., 2012; Naudin et al., 2014; Legaz et al., 2017; Matsuura et al., 2017; Nemecek et al., 2019; De Laurentiis et al., 2024; Lucas et al., 2025). In addition to LCA, we also assessed the extent of on-farm agrobiodiversity (FAO, 2019). Thus, this study provides a robust empirical foundation and a broader perspective on the sustainability of soybean production systems, facilitating informed decision-making in the design of environmentally sustainable food systems.
2 Methods
2.1 Study area
This study was carried out in the south of Minas Gerais state, municipalities of Paraguaçu, São Gonçalo do Sapucaí, Luminarias, Três Coraçoes, and Machado; and in the west of Paraná state, municipalities of Cascavel, Toledo, Ubiratã, Capanema, Realeza, Manguierinha, and Cruseiro do Iguacu (Figure 1). In both areas, alternative soybean value chains have evolved to meet market needs and societal changes. These value chains were particularly relevant to our research questions, as they are designed to somehow enhance farmers’ knowledge, participation, technology adoption, and overall environmental performance. The landscape in the west of the Paraná region is relatively flat and shaped by crops (soybeans, maize, and wheat) and animal farms, mainly poultry, while in the south of Minas Gerais, it is characterized by highlands, slightly hilly terrain, and a dominant presence of coffee, soybeans, and maize. Figure 1 presents the investigated farms’ locations in the study area.
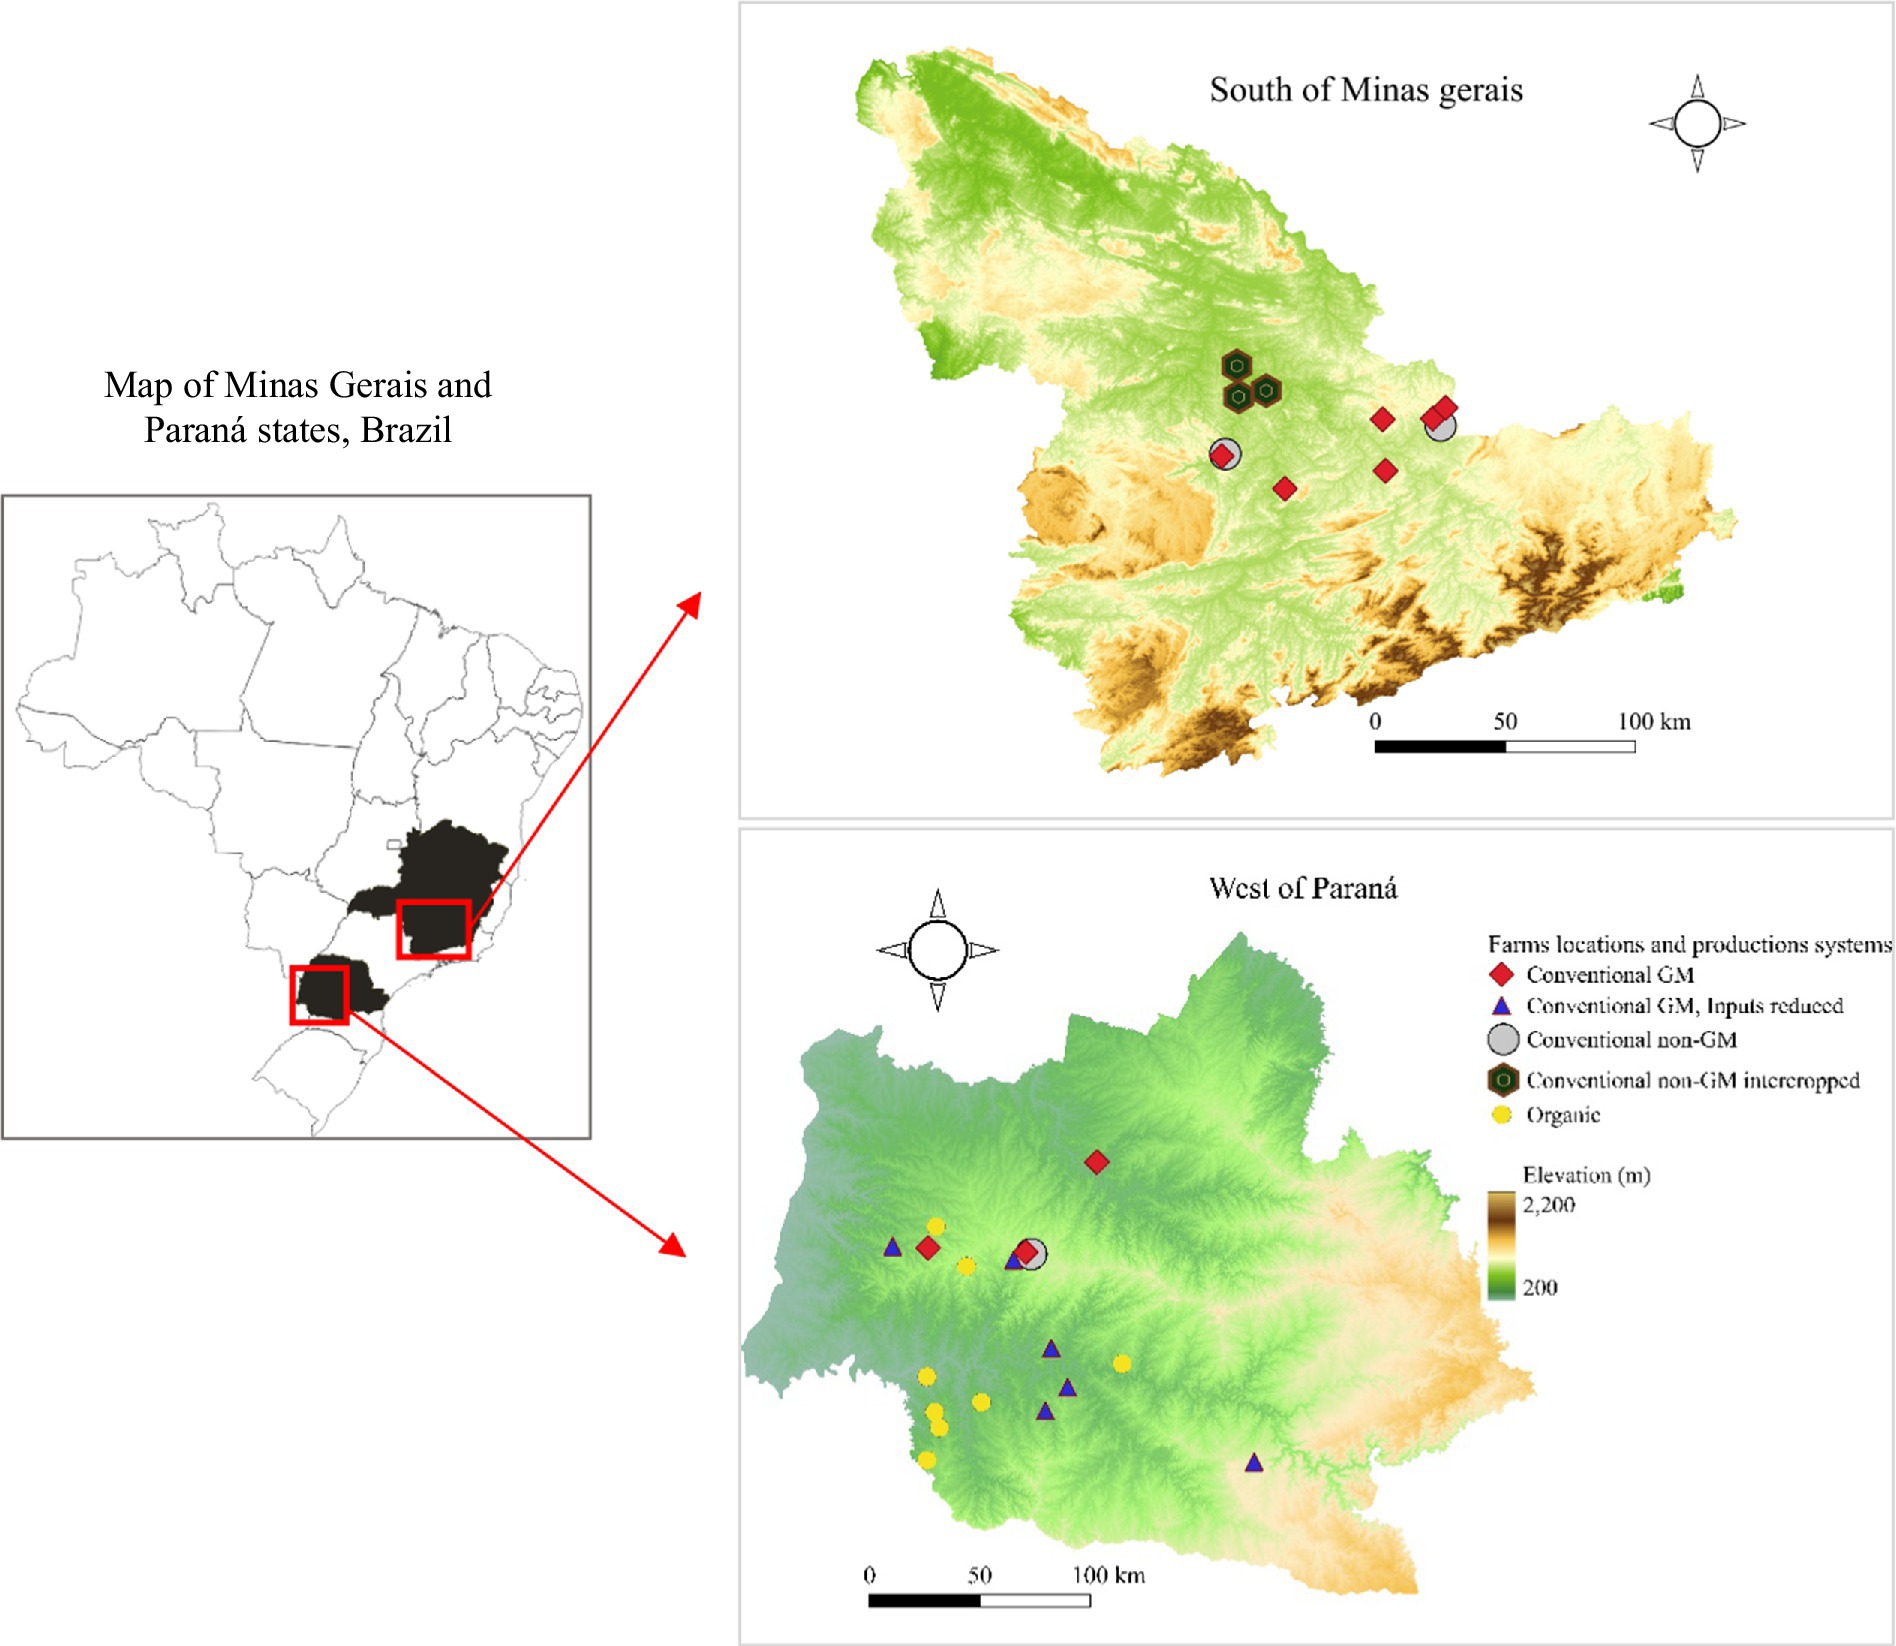
Figure 1. Farms locations and their related production systems in the two study areas.
Farmers’ cooperatives served as a crucial starting point for studying soybean systems, given their central role in value chain development. In many cases, cooperatives facilitated the collection and storage of soybeans from farms for export or processing. With the assistance of local scientists and collaborators, cooperative technicians, and rural development extensionists, we mapped soybean value chains that were linked to regional and global supply chains and subsequently selected soybean farms to represent typical systems (Table 1).
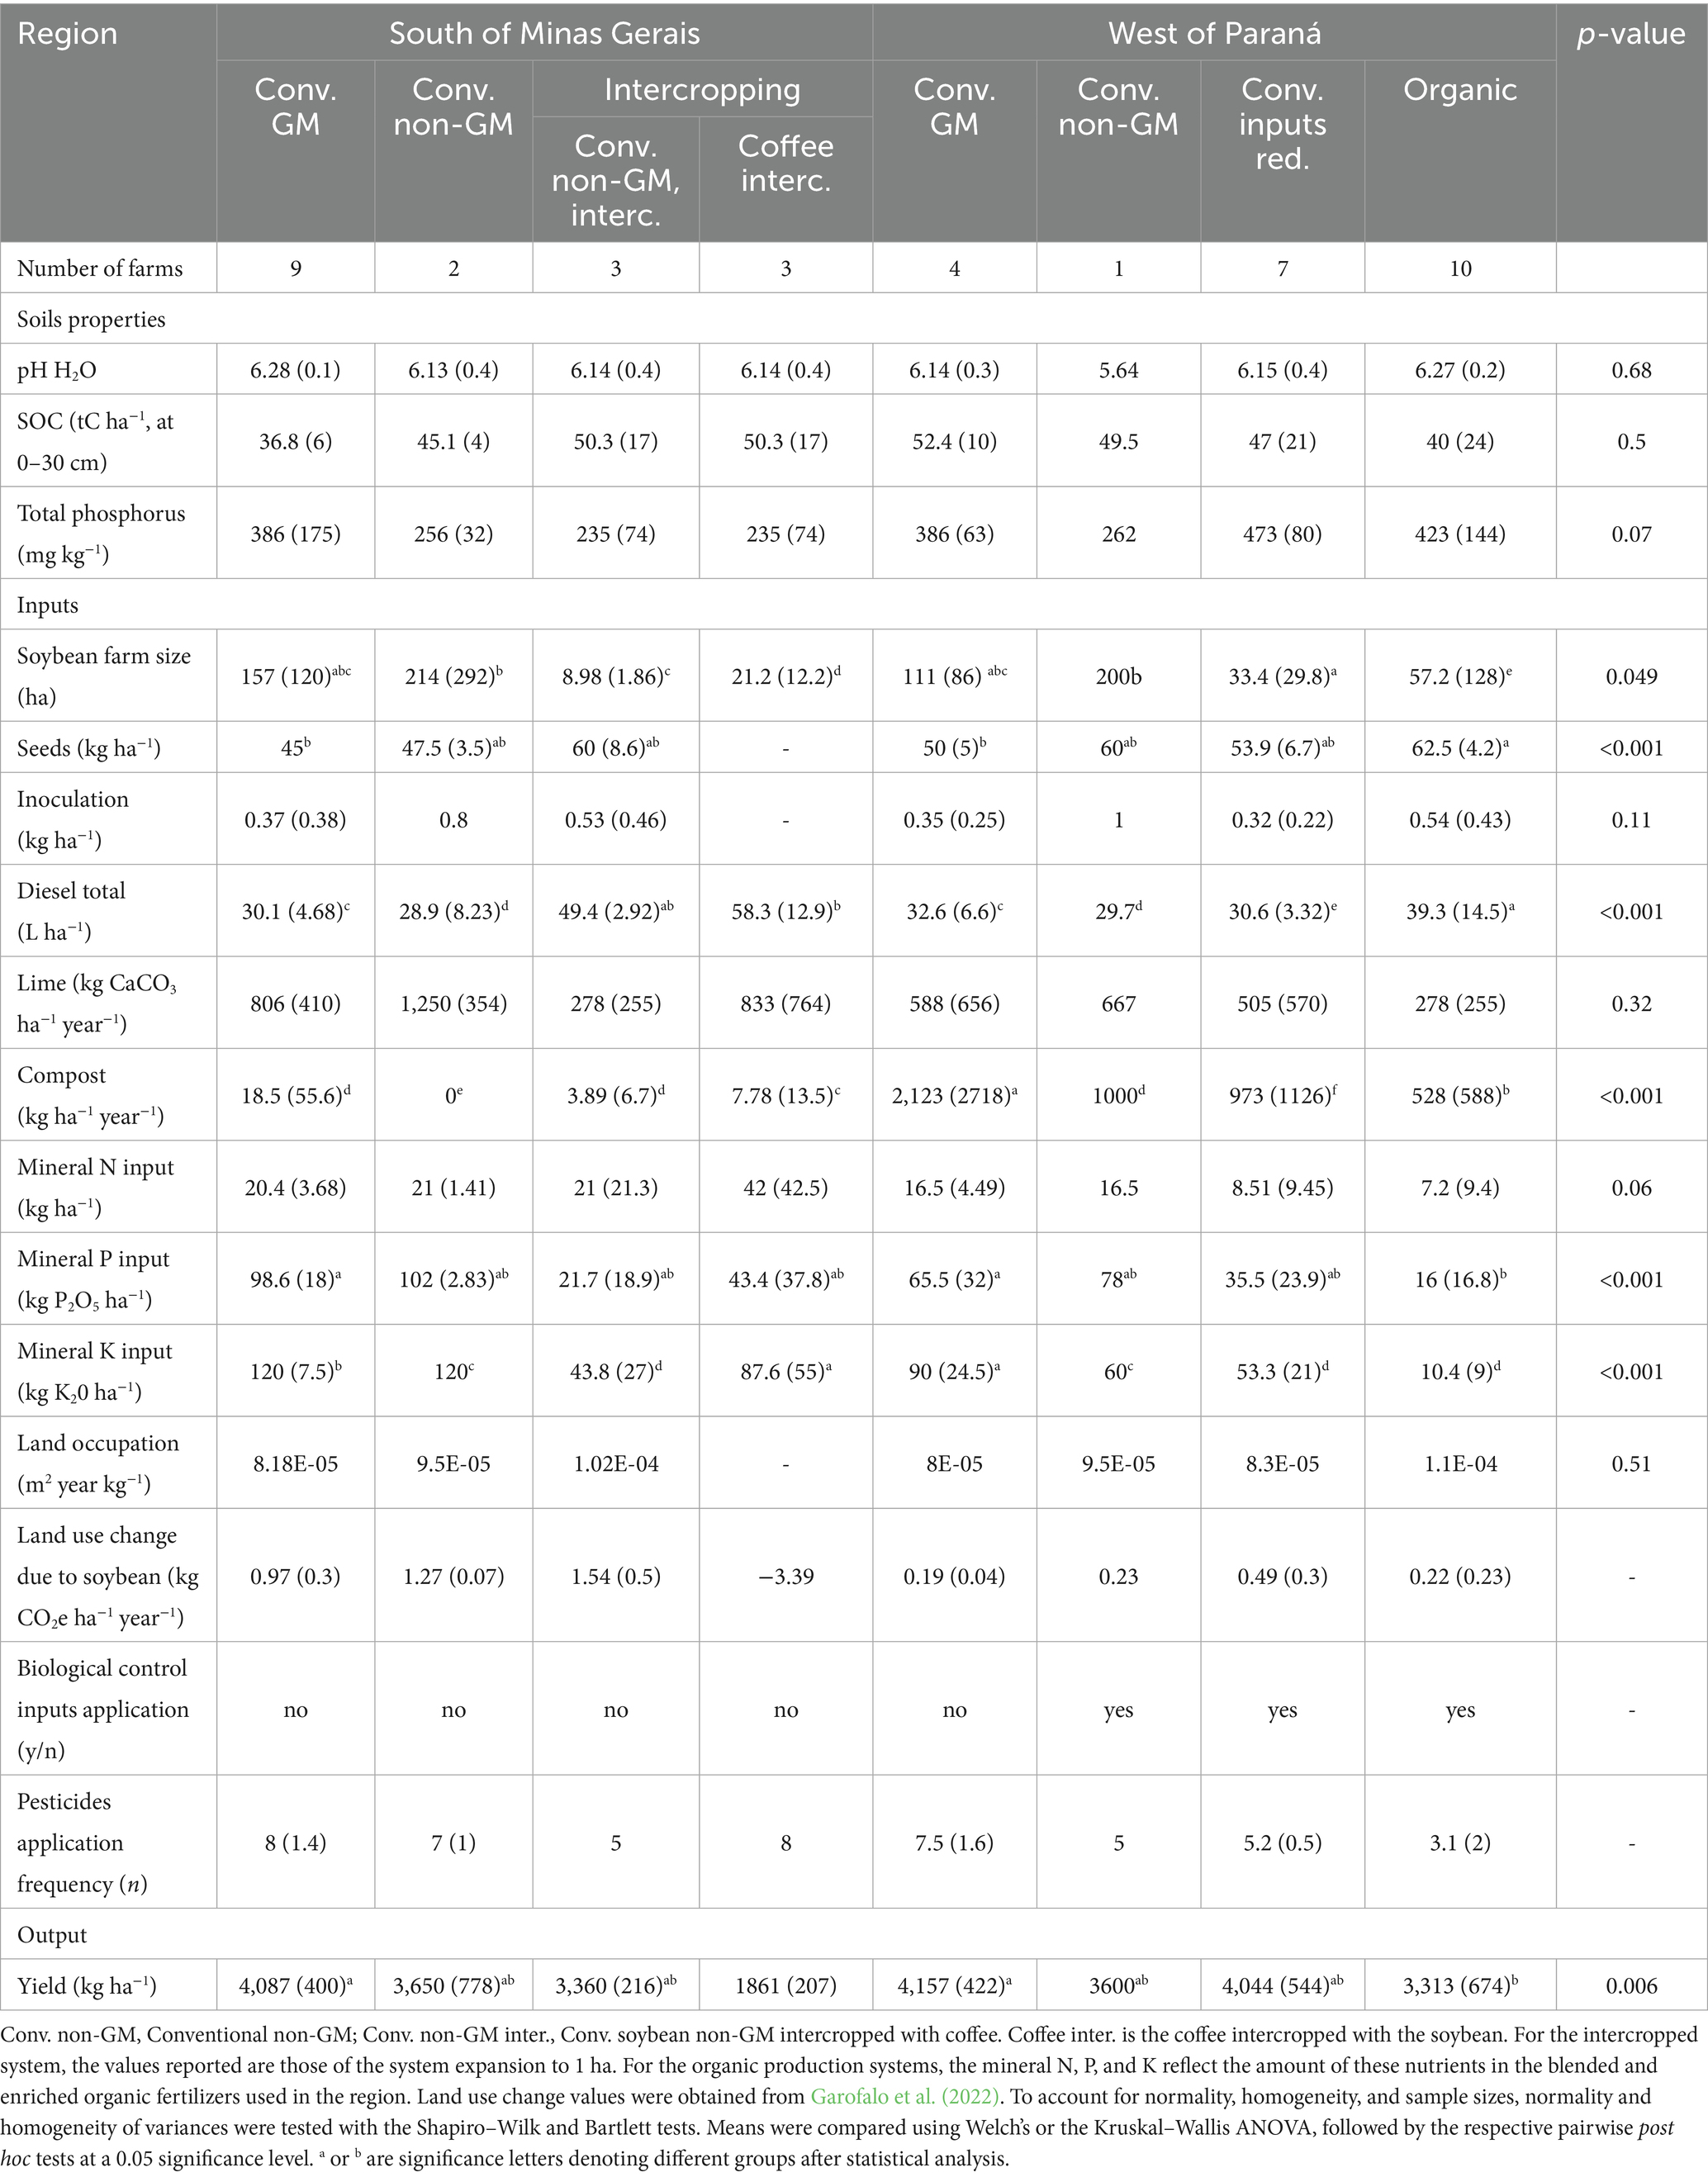
Table 1. Main inventoried inputs of soybean production systems.
2.2 Case studies
Based on an initial exploratory study, we identified five soybean production systems: conventional GM, conventional GM inputs-reduced, conventional non-GM, conventional non-GM intercropped, and organic (Table 2). These systems were differentiated by inputs, seed types, farming practices, and value chain organizations. A brief description of each system is provided in the following section:
(1) Conventional GM system
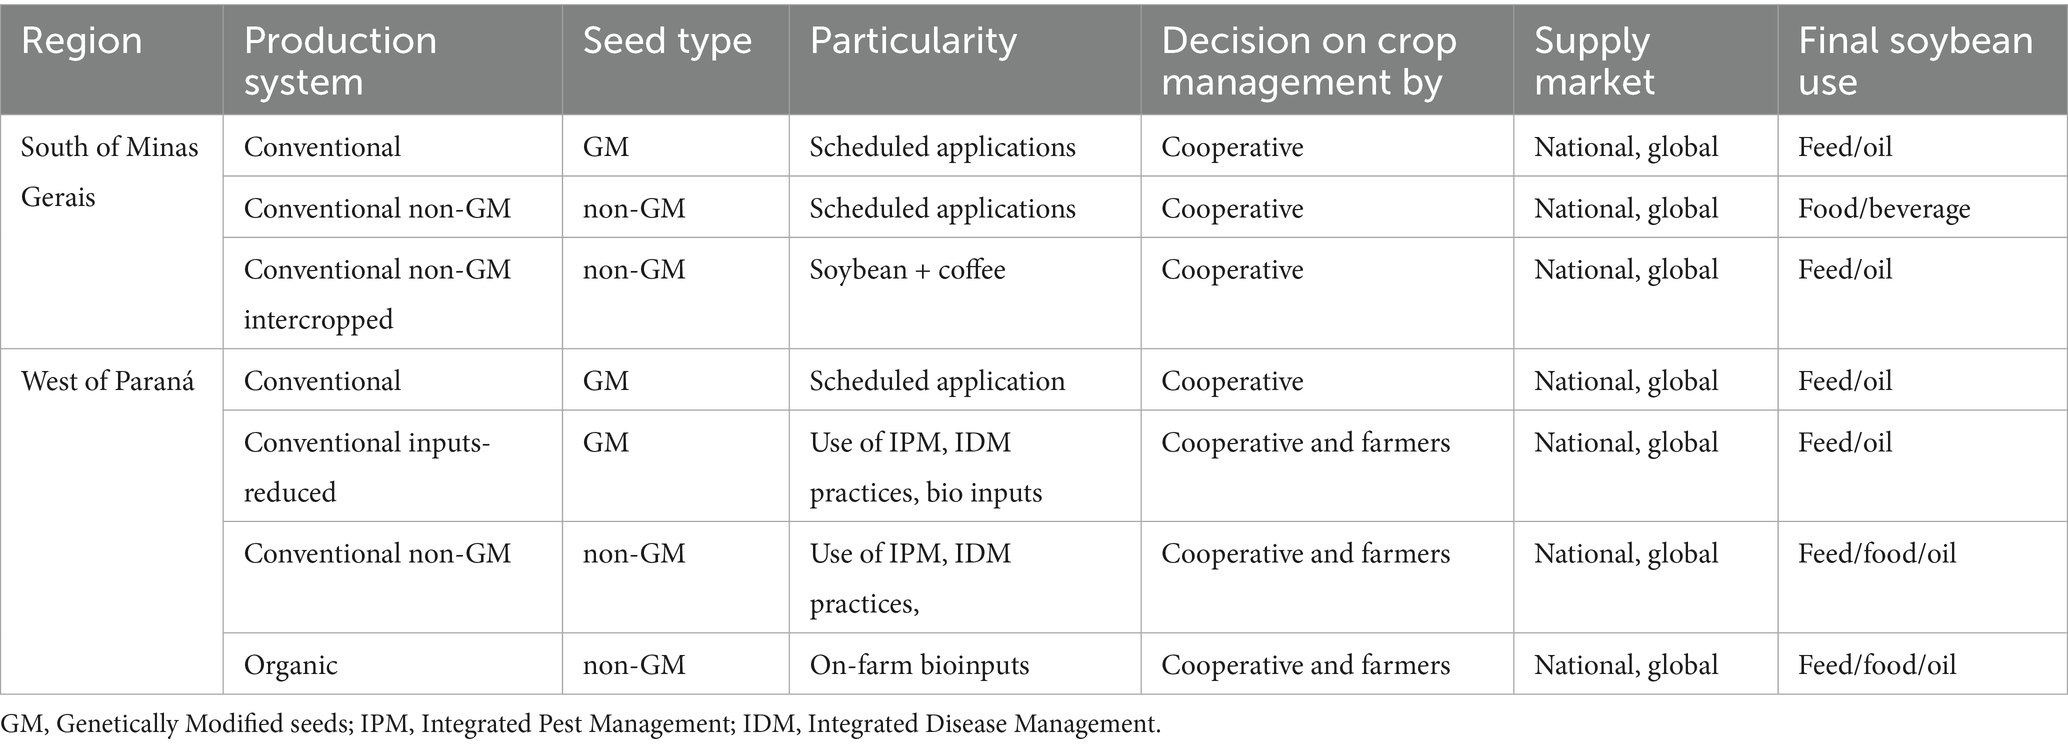
Table 2. Characteristics of the production systems studied and their related value chains.
In both study areas, conventional GM soybean production was the predominant system. It is intensive, utilizing GM seeds, monocropped on large fields, and coupled with scheduled preventive management of the crop cycle and inputs, all of which are mechanized, with the ultimate objective of maximizing productivity. As of 2023, over 95% of soybean seeds in Brazil were genetically engineered (Proterra, 2024) and grown in monocultures with conventional methods. Different types of GM seeds were found to be used, and the most used were varieties of the third generation of transgenicity: “Intacta RR2 IPRO” and “Intacta 2 Xtend.” These transgenic varieties have the Bacillus thuringiensis (Bt) and/or Roundup Ready (RR) technologies, creating tolerance to different herbicides and toxins against pests (Embrapa, 2023). Compared to non-GM soybeans, the GM varieties are promoted as mitigating ecological damage through reduced pesticide applications and higher yields, but controversies exist as they induce resistance in weeds, leading to an increased use of higher dosages and harmful pesticides (Stirle et al., 2024; Freitas et al., 2024).
(2) Conventional GM inputs-reduced
This production system represented conventional farms that followed the integrated pest and disease management (IPM and IDM) protocols (Conte et al., 2019; IDR-Paraná, 2025). The GM seeds were still used, but instead of a scheduled preventive application of pesticides, a monitoring and needs-based application was adopted in farms. According to IDR-Paraná (2025), the use of IPM and IDM can reduce the use of pesticides by up to 50% and increase the yield by an average of 150 kg ha−1. In addition, some practices linked to regenerative agriculture were used on most of the surveyed farms in this system, such as the mixed cover crops after the second crop season “safrinha,”2 before growing soybean as the first crop; and the combination of both bioinputs and chemical inputs in soybean production. The bioinputs, locally termed ‘TMT’ (standing for ‘Tomita’, named after the developer Celso Tomita), were organic inputs produced on farms and used as biofertilizer and biopesticides. The SI provides details on the composition of bioinputs.
(3) Conventional non-GM system
As an alternative system to the conventional GM production, the conventional non-GM soybean production used non-GM, also called transgenic-free, seeds, but operated similarly to the conventional GM soybean production in all other agricultural management practices, such as fertilizer use. However, certain pesticides were restricted in non-GM soybean production due to their use in direct human consumption, beverages, feed, and oil, or export to the European market. Developed by Embrapa, the non-GM soybean varieties were claimed to also have high productivity as the GM soybean when produced under good pest and disease management (Embrapa, 2023). Despite the dominance of GM soybeans, the non-GM soybeans represented less than 5% of the total soybeans grown in Brazil, but were recently increasingly cultivated to respond to an increasing demand for transgenic-free products (Proterra, 2024). Additionally, transgenic-free soybean production was encouraged by a premium price over GM soybean (Proterra, 2024).
(4) Conventional non-GM soybean–coffee intercropped
In the coffee-dominated region in the south of Minas Gerais, conventional soybean was also intercropped with coffee, with soybean grown in three rows in between coffee rows and occupying in total one-third of the total surface. This system was relatively recent (< 5 years in most cases) for coffee producers in the region, and intercropping was a strategy for efficient land use, increasing the resilience of the farming system to pests and diseases, and providing an opportunity for extra income generation. The inputs and management were similar to those of conventional non-GM soybean production and conventional coffee production.
(5) Organic soybean
Organic soybean was produced with non-GM seeds and without synthetic fertilizers or pesticides. This production also used the “TMT” bioinputs produced on farms, as well as copper oxychloride and sulfur-based mineral pesticides allowed in organic production. The premium price, and sometimes the minimum price in case of harvest losses, incentivizes the organic system, which has generally lower yields compared to the GM soybean in the regions. More description of the bioinputs is presented in the Supplementary Information, section 1 (Malembaka, 2025).
Table 2 presents an overview of the studied production systems’ characteristics. In most cases, farm management and decisions regarding input use were made by the agricultural extension services of the associated cooperative on behalf of the farmer, and value chains were extended to national and global markets.
2.3 Life cycle assessment methodology
The lifecycle assessment method was used following the ISO 14044 standard (ISO, 2006).
2.3.1 Goal of the LCA
The goal of the LCA was to assess the environmental impacts of conventional and alternative systems of soybean production in the Atlantic Forest biome in Brazil.
2.3.2 Scope of the LCA
The system boundaries were from cradle to farm gate. Figure 2 presents the system boundary of the studied production systems.
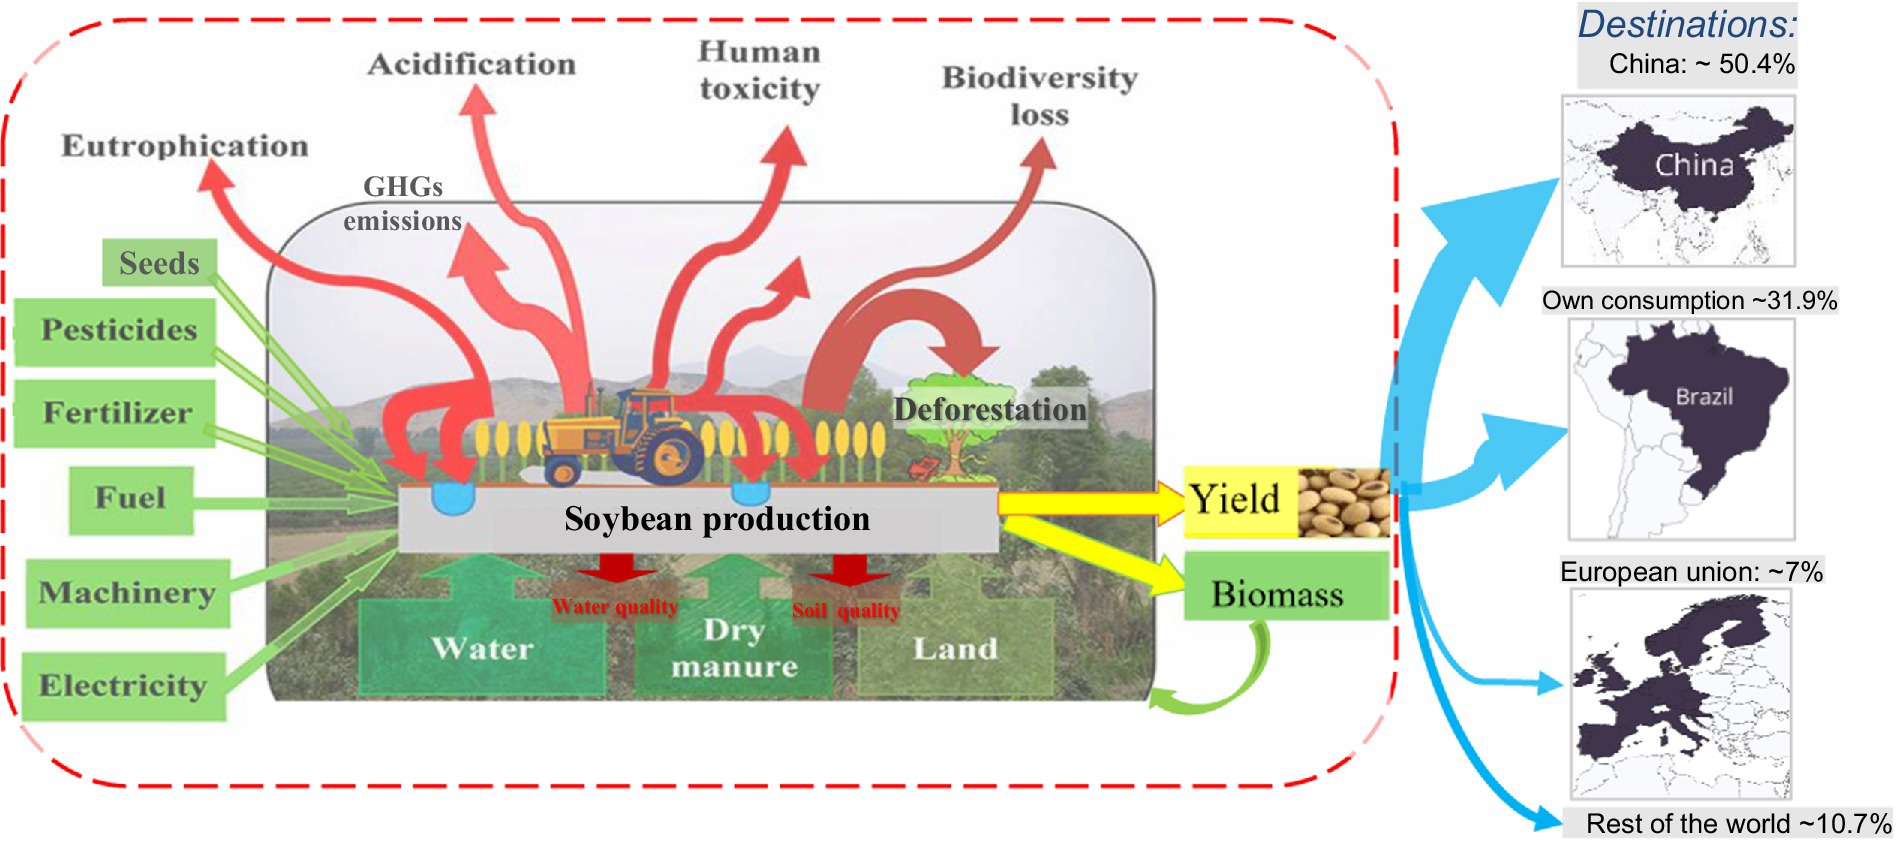
Figure 2. System boundaries from cradle to farmgate of the studied soybean value chains [graph adapted from Bartl et al. (2012), and main destinations of Brazilian soybean (CONAB, 2025)].
We used the mass (1 kg) and area (1 ha) of soybeans as functional units (FU). Multiple FUs are important for comparing different cropping systems, including organic (Hashemi et al., 2024). The mass FU helped for a comparison with results of other similar studies, while the area FU helps to account for the regional character of the impact categories assessed, as environmental impacts of the agricultural activities on a local or regional level have a strong area-related aspect (Bartl et al., 2012; Hashemi et al., 2024).
2.3.3 Life cycle inventory
2.3.3.1 Data collection
The field data collection, referred to as foreground inventory, encompassed all agricultural operations and management practices (Figure 2), such as soil preparation, fertilizer and lime application, diesel usage, seed application, pesticide applications, and soybean harvest, over two seasons. We collected data through interviews and observations on 36 farms in total for the two production years 2022–2023 and 2023–2024 for more consistent average data of production in the regions (Nemecek et al., 2015). For the soybean–coffee intercropping system, data on the production of the associated coffee were also collected. To observe soil properties, we sampled soils on farms in the rhizosphere, at 0–30 cm depth, and made composite samples of four subsamples taken at locations that appeared to represent the field conditions well. We then analyzed the soils for pH, total carbon, total nitrogen, total phosphorus, and texture. Details on the soil analysis methods are presented in the Supplementary Information, section 2.
On-farm emissions were modeled using the BR-Calc methodology of the ICVCalc tool version 1.0, an inventory and emission modeling tool, developed for tropical agriculture and considers regional biophysical conditions at the municipality level in Brazil (Matsuura et al., 2022). The soil properties were used in this emissions modeling, in the soil quality assessment, and for enhanced comprehension of the results. In addition, we accounted for carbon emissions from land use change related to soybeans in each municipality studied, which were obtained from the BRLUC v2.05 tool (Garofalo et al., 2022).
The background inventory data of inputs, production, and transports, and agricultural machinery and their associated emissions were modeled using the Ecoinvent database, version 3.9.1. which contains updated background inventory data from the Brazilian lifecycle network (Ecoinvent, 2024).
2.3.3.2 Allocation methods and handling of co-products
For soybeans grown in monocropping, mass allocation and area allocation were considered, and all impacts were allocated to the harvested beans, as there were no co-products. In the soybean–coffee intercropping system, soybeans occupied one-third of the land surface and lasted 4 months, while coffee plants were permanent throughout the year. The system expansion was conducted to ascertain the avoided burden of producing soybeans elsewhere rather than on the same coffee farm. The avoided burden impacts were subtracted from the overall system impacts, which were then allocated based on the area occupied by each crop and the duration of its cultivation. Economic allocation was avoided due to the significant economic disparity between coffee and soybean, with coffee valued nearly 10 times higher than soybean, and the volatile market prices of both commodities (CEPEA/ESALQ, 2025). This approach also facilitated comparisons with other monocropped soybean systems.
2.3.4 Life cycle impact assessment
2.3.4.1 General impact categories assessed
We carried out Life Cycle Impacts Assessment (LCIA) for the following impact categories: climate change, acidification, eutrophication, ecotoxicity, human toxicity, ozone depletion, particulate matter formation, cumulative non-renewable energy demand, biodiversity loss potential, and soil quality. The climate change impact was assessed with the IPCC 2021 GWP100a. The ReCiPe midpoint characterization factors (CFs) were used (Huijbregts et al., 2016) to assess the acidification, eutrophication, ecotoxicity, human toxicity, ozone depletion, particulate matter formation, and cumulative energy demand impacts. Pesticide emissions were calculated using the emissions fractions of the harmonized OLCA-Pest (Nemecek et al., 2022), and the impact on human toxicity and freshwater ecotoxicity was assessed using the USEtox CFs (Fantke et al., 2021).
The LCIA was computed using Activity Browser software version 2.7, built on the Brightway2 advanced LCA framework (Steubing et al., 2025) for all the impact categories besides biodiversity loss potential and soil quality.
2.3.4.2 Biodiversity loss potential impact
The potential biodiversity loss impact was assessed to determine the different production systems’ impact on potential global species loss due to land use in each ecoregion of the study areas. We used the recently updated CFs of biodiversity loss (Scherer et al., 2023). Farms studied were in the ecoregions: Alto Paraná Atlantic forests, Campos Rupestres montane savanna, and Araucaria moist forests. From the observed data on agricultural processes, crop rotation, or succession, farms were classified into the following land use intensity types: “minimal,” “light,” or “intense” following the criteria in Scherer et al. (2023), presented in the Supplementary Information, section 3. Then, the biodiversity impact of land use due to soybean cultivation was calculated using the global CFs of the related land use intensity, derived from the species–area relationships model that relates the level of land use intensity to the potential biodiversity loss of the specific ecoregion. The biodiversity impact of soybean production, expressed in Potentially Disappeared Fraction (PDF) of global species, was then calculated as in Equation 1:
where CFglobal,i is the CF of global species loss of land occupation (PDF / m2), i is land use intensity, and Y is the soybean yield (kg / m2 yr). We used the global marginal CFs of land occupation as they are more suitable for standard LCAs of products, and since the different systems studied are in two different ecoregions (Scherer et al., 2023).
2.3.4.3 Soil quality impact of land use
We used the recommended method of De Laurentiis et al. (2024), which assesses soil organic carbon (SOC) as a robust indicator for soil quality. SOC has often been recognized as the best stand-alone indicator for soil quality as it relates to a wide range of soil properties responsible for soil resilience and fertility (Legaz et al., 2017). The soil quality impact of land use by occupation was assessed using the CF of the soil quality index, calculated as the difference between the potential SOC of the native undisturbed soil and the SOC of the soil under the studied soybean land use (Grant et al., 2019; De Laurentiis et al., 2024), as given in Equation 2:
where CFocc, LUi is the soil quality index of occupation of the land by soybean. SOCref is the SOC stock of the undisturbed situation under native vegetation, with values derived from Bernoux et al. (2002) and Assad et al. (2013) that evaluated SOCref to around 64 and 70 t C ha−1 in native vegetation in the south of Minas Gerais and the west of Paraná, respectively. SOCLUi is the SOC measured in the current land use and, results are presented in Table 1. Lower CFocc, LUi values indicate reduced negative impacts of soybean cultivation on soil quality.
2.3.5 Uncertainty and sensitivity analysis
To study the robustness of the results obtained and enhance the interpretation of the results, uncertainty analyses were performed. Uncertainties for each elementary flow in inputs from the technosphere and output to the biosphere were estimated using the pedigree approach (Weidema and Wesnæs, 1996) and complemented by the uncertainty in background data reported by Igos et al. (2019), Wei et al. (2015). The data variability among surveyed farms was used as input for sensitivity modeling (Bartl et al., 2012). A coefficient of variation of about 19% in the total diesel use and 40% mineral fertilizer use was observed across production systems. In this regard, we assumed that with better management, such as crop rotation, mixed cover crops, IPM, and IDM, a reduction of inputs could be possible. Therefore, we tested the sensitivity of the environmental impacts to a reduction of at least 10% in the diesel and mineral fertilizer application on all production systems.
2.4 On-farm agrobiodiversity assessment
We observed on-farm agrobiodiversity following the Tool for Agroecological Performance Evaluation (TAPE) method (FAO, 2019). This observation was to complement the biodiversity loss impact assessed in LCA, which measures the potential disappeared fraction of global species at the level of ecoregions. On-farm agrobiodiversity data were collected through transect observations across the soybean field, which involved counting crop species and varieties, assessing their relative areas, and documenting the presence of natural vegetation, trees, and pollinators. These observations were used to calculate the Gini-Simpson index and the “natural vegetation, trees, and pollinators” index, with their average constituting the agrobiodiversity score (FAO, 2019; Mottet et al., 2020).
3 Results
3.1 Inventory of soybean production systems
The inventoried results of different production systems in terms of soil properties, main inputs, and outputs are presented in Table 1. Values are annualized and represent the average of the two crop years investigated. Values in brackets are standard deviations. The nutrients N, P, and K inputs from fertilizers were calculated from their elemental concentrations in the specific mineral and organic fertilizers inventoried.
We observed considerable variability in farm size across nearly all production systems. In the south of Minas Gerais, soybean–coffee intercropping was on the smallest farms with (8.98 ± 1.86 ha covered by soybean), while conventional GM monocropped farms of >300 ha were observed. In the west of Paraná, organic soybean was grown on smaller farms (17 ha on average). In general, conventional GM production systems were grown on significantly larger farms than on intercropped and organic farms (p = 0.049). Organic with 62.5 ± 4.2 kg seeds ha−1 and soybean–coffee intercropped systems with 60 ± 8.6 kg seeds ha−1 use more seeds per hectare compared to conventional systems (around 50 kg ha−1) (p < 0.001). Similarly, diesel consumption per hectare was significantly higher (p < 0.01) in organic (39.3 ± 14.5 L ha−1) and soybean–coffee intercropped (49.4 ± 2 L ha−1) than in conventional GM. The conventional GM inputs-reduced used the least diesel (30.6 ± 3.32 L ha−1). This increased diesel consumption in organic and intercropped systems may be attributed to the fact that, despite generally having lower frequencies of pesticide applications, they often involve tilling the soil or using smaller, less efficient machinery that consumes more diesel.
Conventional GM production systems were notably input-intensive, relying on high quantities of phosphorus and potassium synthetic fertilizers, as well as a range of hazardous ingredients. Pesticides were applied systematically, with approximately eight applications during the soybean growth cycle. We noticed that as farm size increased, pesticide application frequency rose. Notably, a single organic soybean farm of 420 ha observed to apply the TMT biopesticides at a similar frequency as conventional GM farms, in addition to manual labor for weeding throughout the cropping season. This simple substitution of synthetic pesticides with the TMT biopesticides resulted in higher diesel consumption due to the lower efficiency of the biopesticides used. Details on the inventoried pesticide quantities in each system, active ingredients, and hazard classifications are provided in Supplementary Information, section 6.
Yields were significantly higher in conventional GM systems (4,157 ± 422 kg ha−1), followed by the conventional GM inputs-reduced (4,044 ± 544 kg ha−1), and conventional non-GM (3,600 kg ha−1). Organic production yielded 3,313 kg ha−1, approximately 20% less than the conventional GM. There was no correlation between farm size and productivity (R2 ~ 0.02), primarily because mechanization enabled consistent management across the entire farm.
3.2 Environmental impacts of soybean production systems
3.2.1 LCIA scores of soybean production
An overview of the LCIA scores revealed significant variability, with no single system consistently outperforming others across multiple impact categories. The LCIA results of soybean production are illustrated in Figure 3, with detailed results provided in the Supplementary Information, section 4.
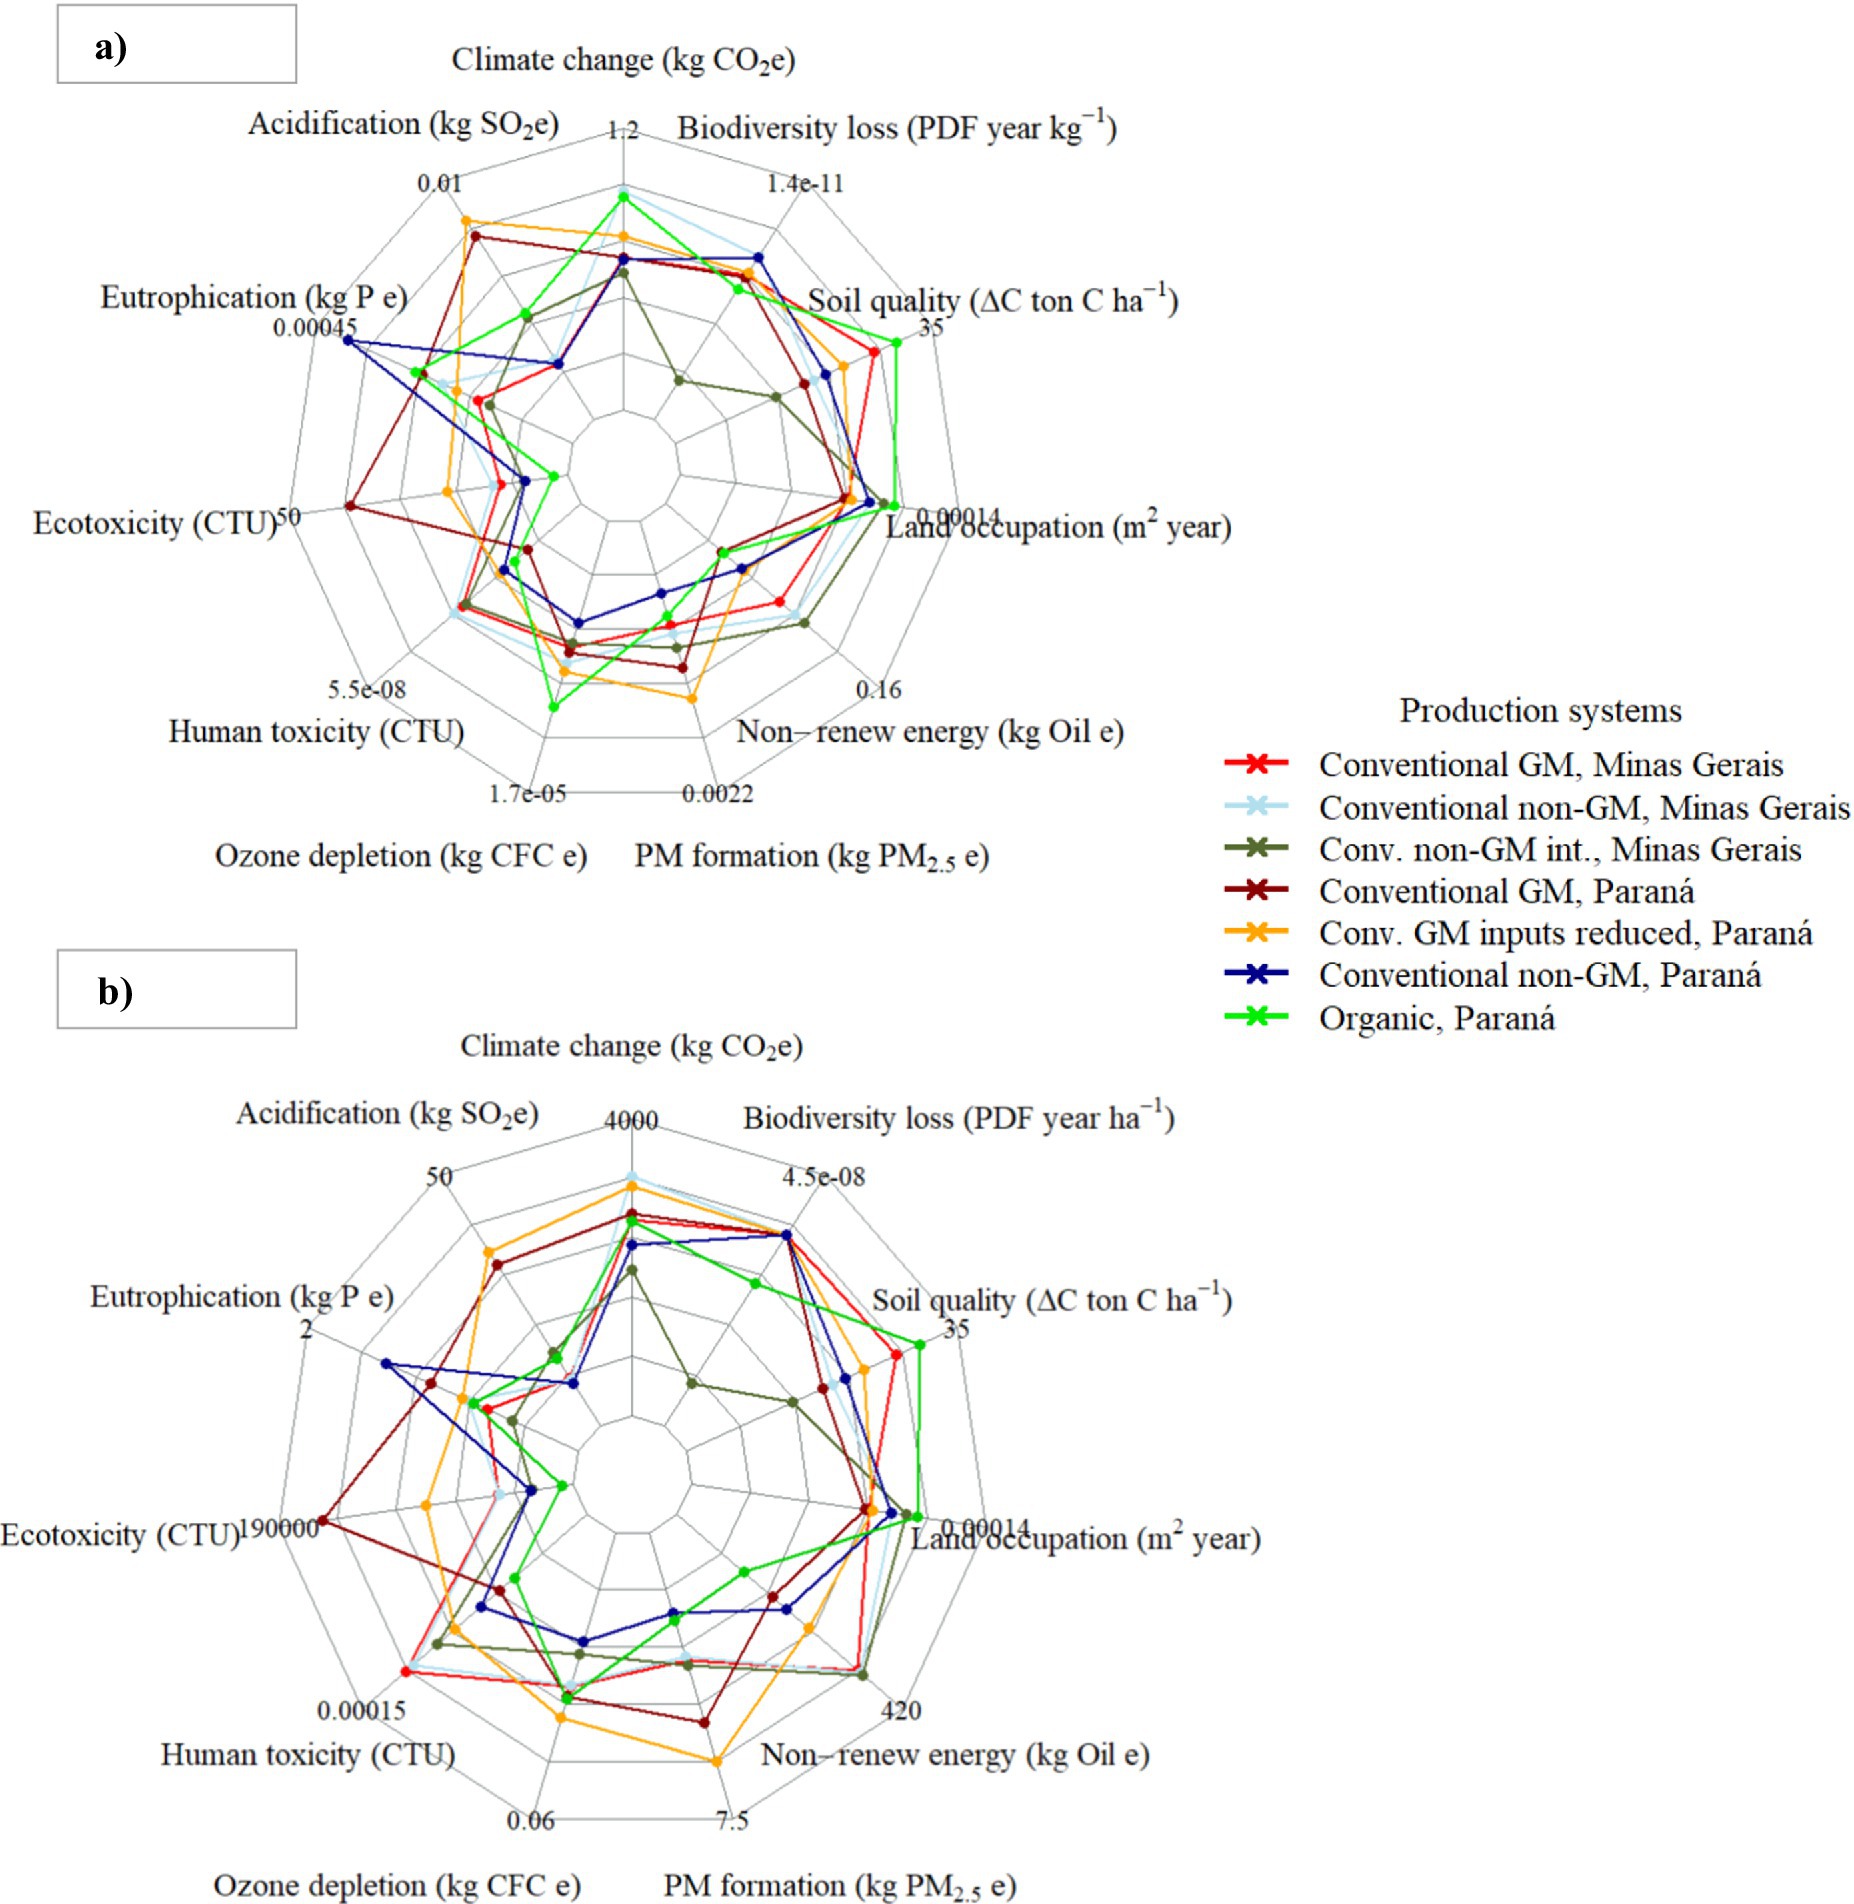
Figure 3. Footprints of soybean production systems (a) per kilogram, and (b) per ha of soybean.
Conventional GM soybean emitted 0.65 and 0.64 kg CO2e per kg, while conventional non-GM soybean emitted 0.93 and 0.63 kg CO2e in the south of Minas and west of Paraná, respectively. Organic production emitted up to 0.9 kg CO2e, and the lowest emissions were obtained in the soybean–coffee intercropped system with 0.58 kg CO2e kg−1 soybean. Specifically, in the west of Paraná, both conventional GM and conventional GM inputs-reduced systems demonstrated the highest impacts for acidification (0.0077 and 0.0083 kg SO2e), ecotoxicity (39.01 and 21.7 CTU), and particulate matter formation potential (0.0011 and 0.0014 kg PM2.5e). This could originate mainly from the diesel use, mineral fertilizers, and mineralization of manure.
Organic production exhibited the lowest impacts in terms of ecotoxicity and non-renewable energy demand, and the second lowest impacts on human toxicity and biodiversity loss potential, following the intercropped system. Yet organic production was taking place in monocultures, alike the conventional system, and therefore scored the highest in land occupation and ozone depletion potential impacts.
Compared to the impact per kg, impact per hectare shifted in almost all impact categories with reductions in organic and soybean–coffee intercropping systems. For instance, in the west of Paraná, conventional GM soybean emitted slighter higher GHGs with a total of 2,723 kg CO2e ha−1 compared to organic production that reached 2,623 kg CO2e ha−1 on average. In the south of Minas Gerais, the highest emissions were from the conventional non-GM (3,224 kg CO2e ha−1), while the lowest emissions were obtained in the soybean–coffee intercropped system (1959 kg CO2e ha−1). Note that in Figure 3, soil quality was not expressed per FU, as it was a result expressed only per hectare since this difference in SOC is rather attributed to the farm than the sole soybean produced. In addition, the land occupation, as an inventory, was already a function of area, and thus, per hectare, it could come in all systems to 0.342 ha/year.
We observed that in both FUs, conventional systems in the west of Paraná showed a high acidification potential. This could be largely explained by the frequent application of fresh poultry manure on these farms, which was not common in the south of Minas Gerais.
The biodiversity loss potential indicates how land use intensity threatens the biodiversity in the ecoregion. Conventional production leads to increased land stress, resulting in further biodiversity loss in the Atlantic Forest biome. Organic soybean production resulted in the lowest biodiversity loss impact, particulate matter formation, and ecotoxicity per hectare. The Atlantic Forest biome, where this research was conducted, is currently experiencing a significant soybean expansion, even though almost 90% of this biome’s forest has already been destroyed (Fundação SOS Mata Atlântica, 2023).
The soil quality, assessed as differences in the SOC (ΔC t Cha−1) between the native conditions and land use, was, however, not statistically different between the different soybean production systems (p = 0.076). We found that the organic system had the highest difference in SOC of 30.12 kg C ha−1 while the soybean–coffee intercropped system had only 13.7 kg C ha−1. This high CF in the organic system means less carbon compared to soils in undisturbed conditions and was explained by frequent tillage for weed control, compared to conventional systems with direct planting and the mixed cover crops before planting soybean, favoring SOC build up. The intercropped soybean had the lowest CF of soil quality, likely due to the coffee trees’ influence on storing and maintaining soil carbon. It’s important to note that the 64 and 70 t C ha−1 in native vegetation, respectively, in the south of Minas Gerais and the west of Paraná, and the subtractions from the current observed SOC to get the CFs are claimed to be simplistic indicators and debatable (De Laurentiis et al., 2024).
Uncertainty distributions enhanced the understanding and interpretation of the discrete scores. They also allowed us to compare the systems statistically. Figure 4 presents the uncertainty distributions of climate change impacts of soybean production per kg and per hectare. For instance, the climate change impact was significantly different between systems (p < 0.001), with organic soybean scoring highest due to the relatively high use of machinery, while intercropped soybean scored lowest. However, the propagation overlap between systems is also high. The uncertainty propagation results of all the impact categories are presented in the Supplementary Information, section 5.
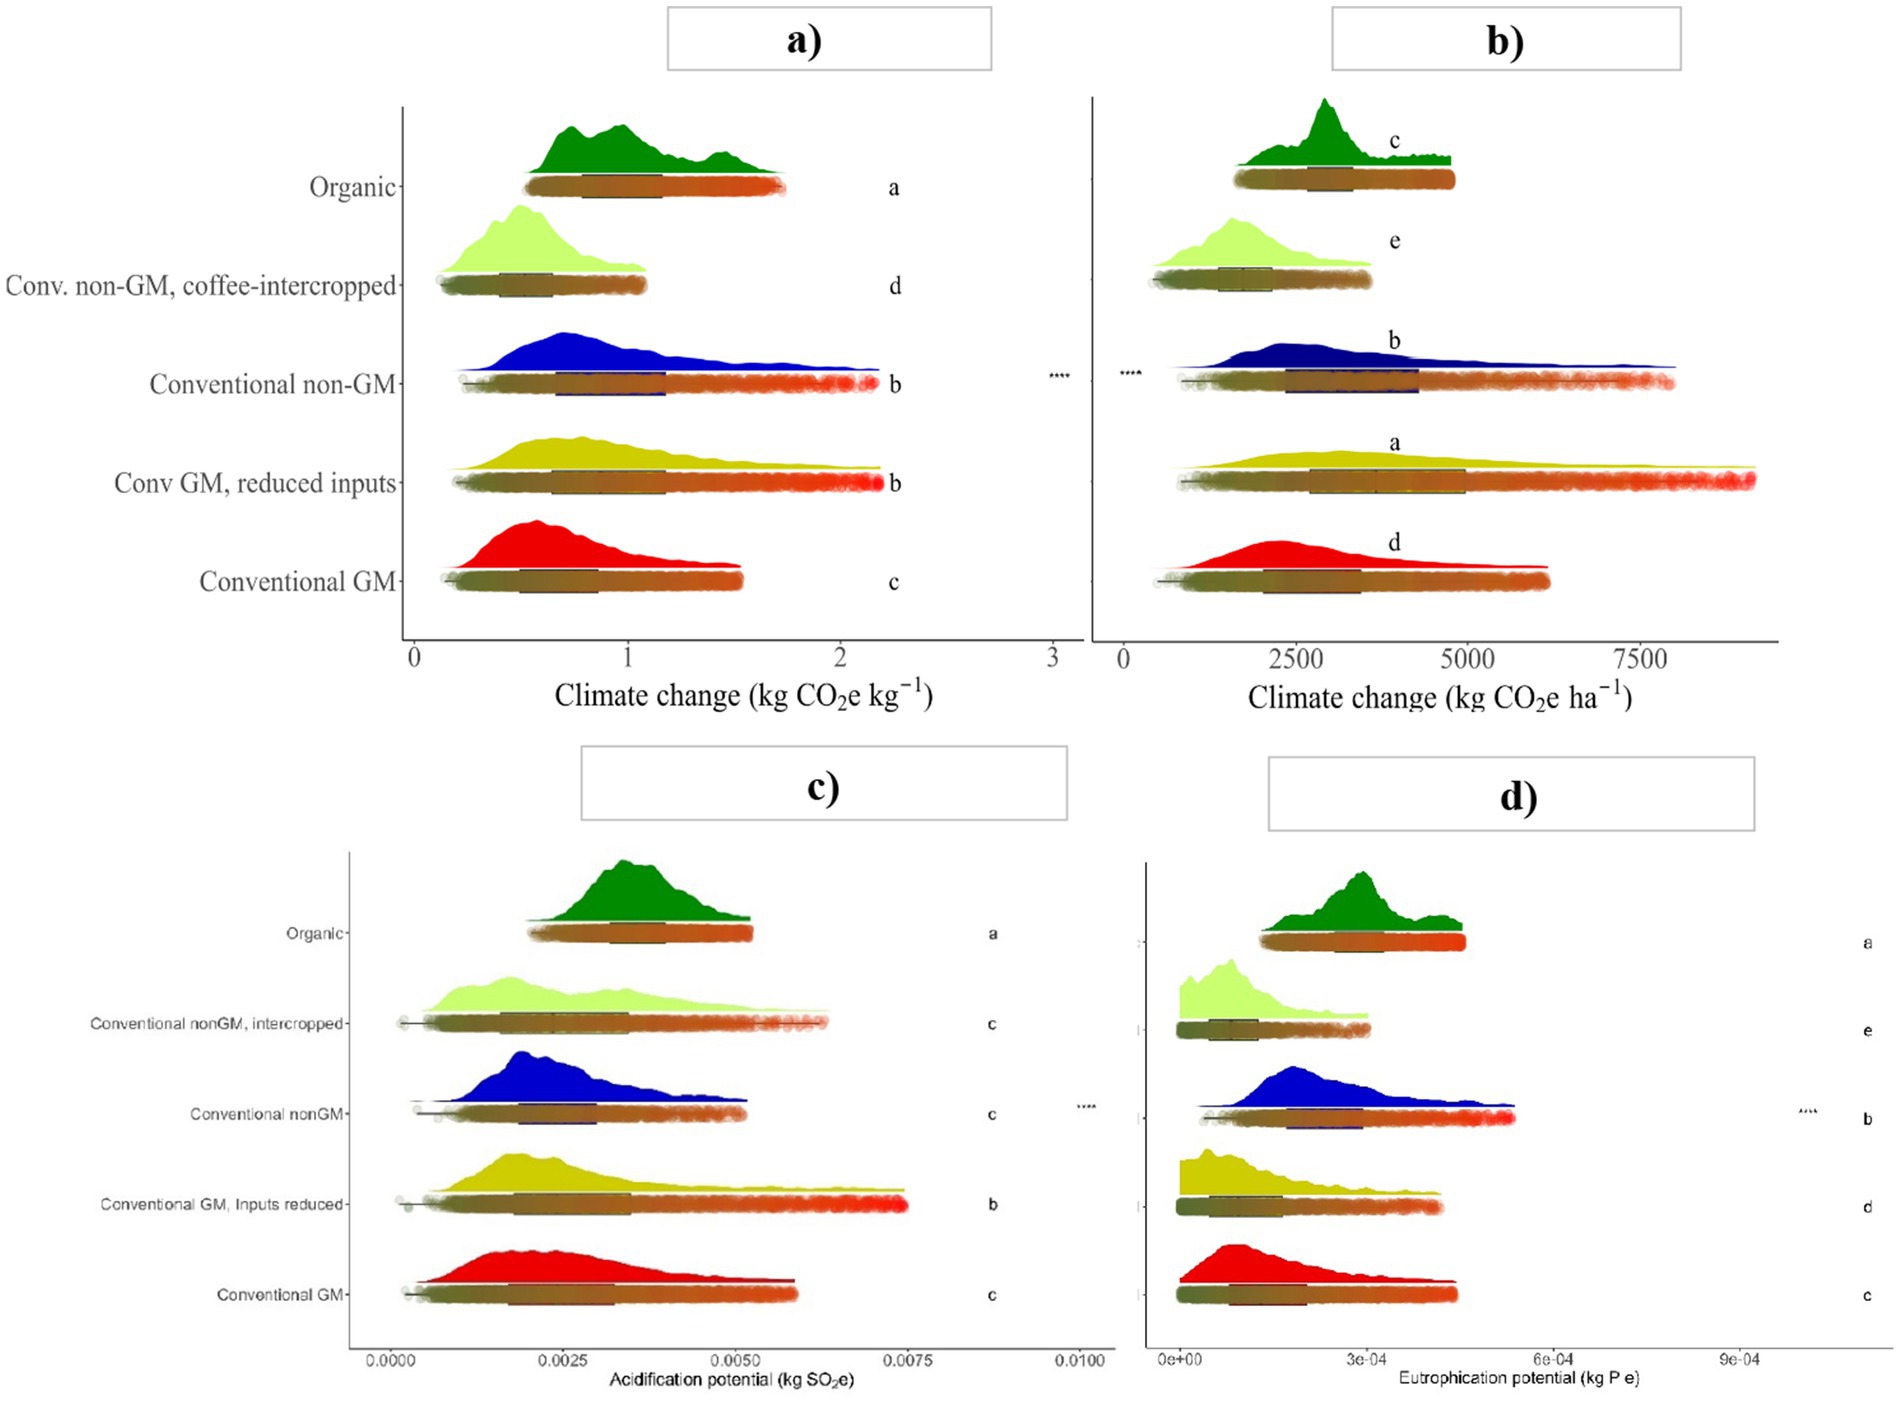
Figure 4. Uncertainty distributions of the climate change impact of soybean production systems (a) per kg, (b) per ha, (c) acidification per kg, and (d) eutrophication per kg.
3.2.2 Sensitivity results
Our sensitivity analysis indicated that a 10% reduction in fertilizers and diesel could decrease emissions by 0 to 14.4% across production systems, with most impact categories exhibiting reductions below 10%. Climate change impacts were reduced by only up to 2.6% in conventional production, by 3.9% in organic, but by 11.3% in intercropped soybean. The lowest change in acidification was in conventional soybean production, with 0.5%, while acidification in organic could be reduced by 9.5%. Figure 5 presents the sensitivity results of all the resulting emissions to changes in the inputs. The sensitivity analysis suggests that a mere reduction of fertilizers and diesel has a limited impact on footprints reduction. Therefore, better environmental performance can be obtained through the reduction of inputs by implementing and leveraging intercropping systems. However, efforts in transitioning to less input-intensive systems often came with major challenges in limited knowledge, inadequate technical support, and the need for bioinputs production on-farm.
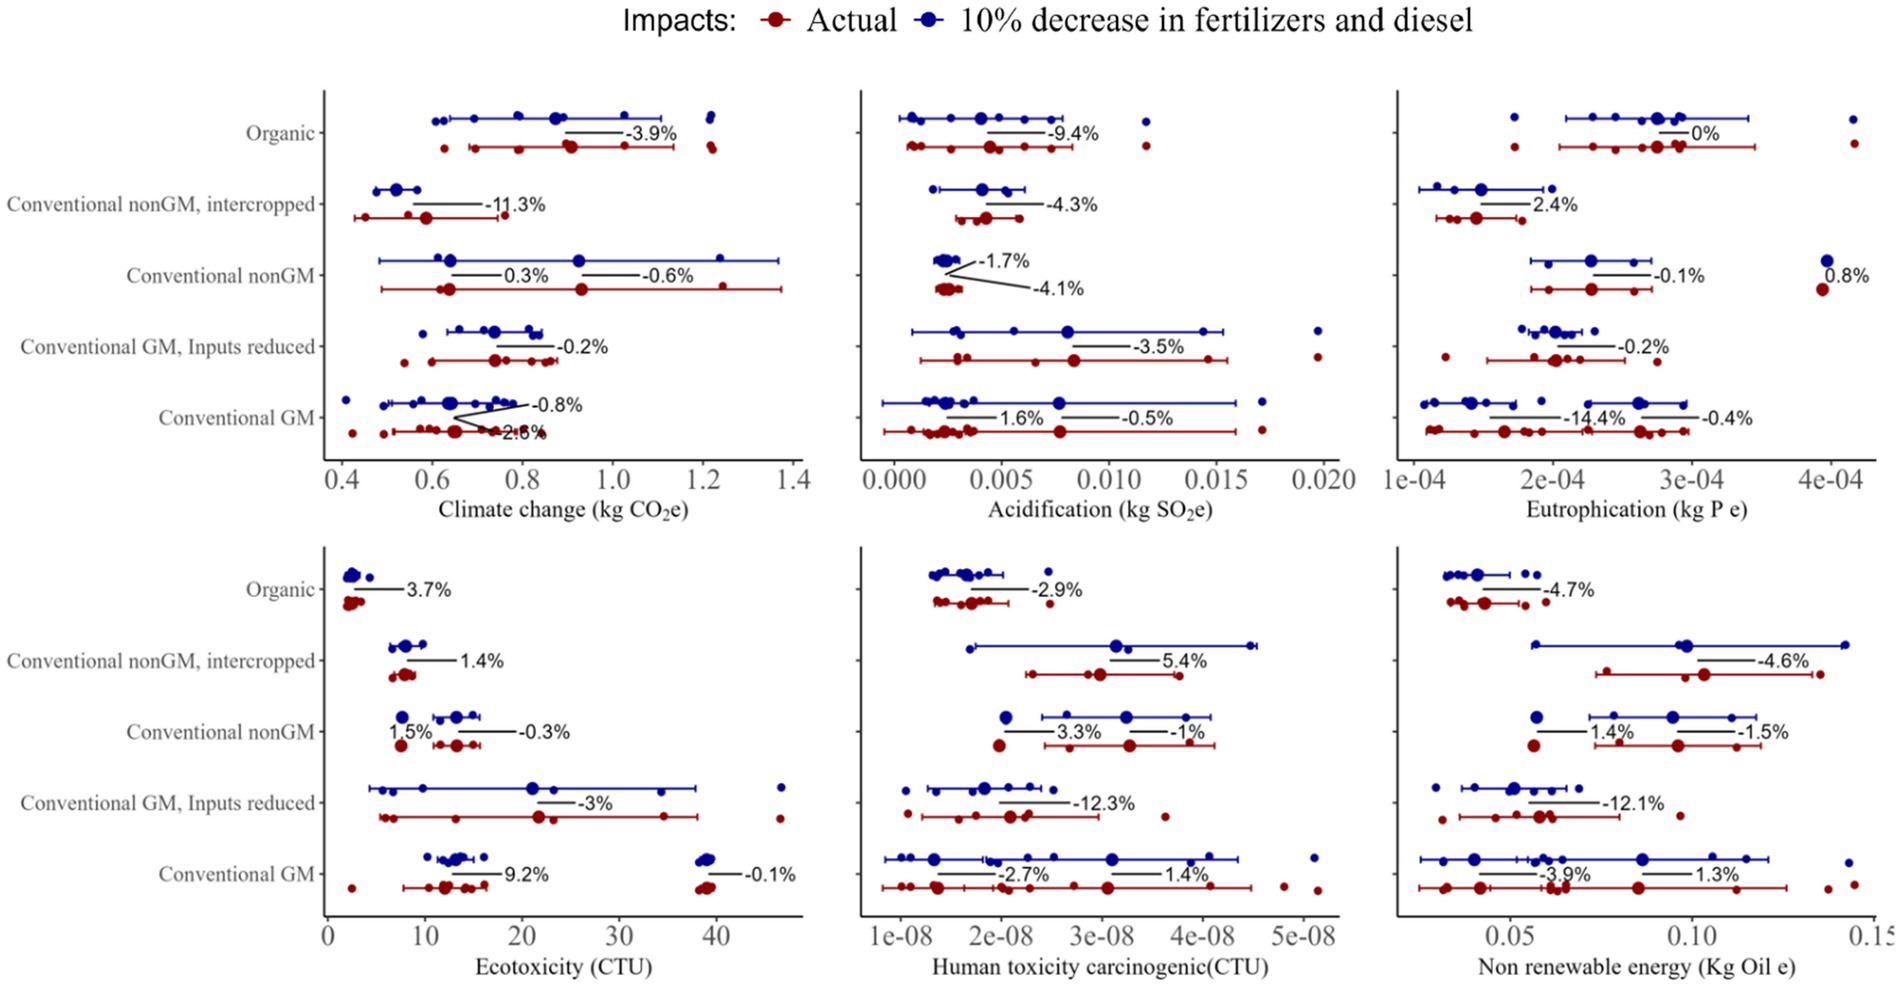
Figure 5. Sensitivity to changes in inputs in soybean production systems. The percentage are the resulting average changes between the actual impact and the impact after 10% inputs reduction.
3.3 On-farm agrobiodiversity
The agrobiodiversity score indicates the extent to which a farm is effectively biodiverse, as it accounts for the crop species and varieties grown, and the presence of trees and pollinators on the farm plot. Figure 6 presents the agrobiodiversity scores for each system and reveals that for organic and soybean–coffee intercropped systems, the scores were mainly acceptable–desirable (80 and 66%). We found that, overall, only 11.1% of farms showed a desirable agrobiodiversity score of at least 0.7; and 20.5% of farms surveyed had an acceptable score of 0.5–0.7. The rest of the farms, which were mainly conventional farms, around 69.5%, had scores below 0.5, deemed to be unsustainable (FAO, 2019). Detailed results of the Gini–Simpson index and final scores are presented in the Supplementary Information, section 7.
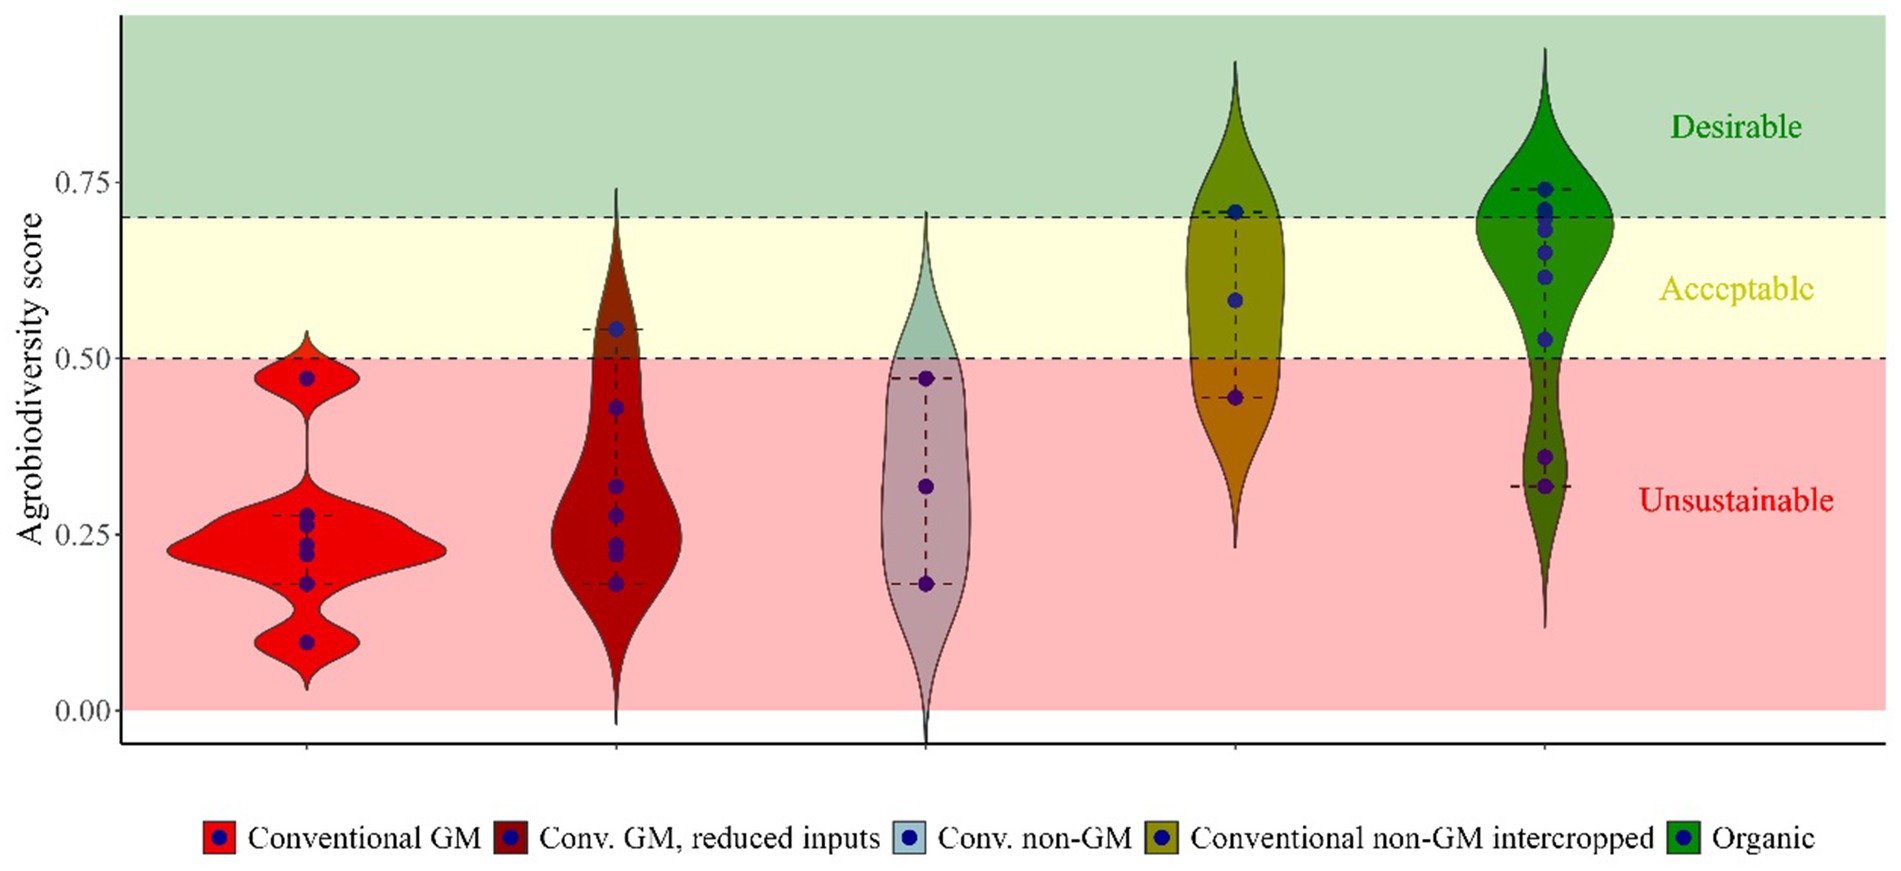
Figure 6. Agrobiodiversity scores of soybean farms in their production systems.
From this agroecological indicator, the contrast between productivity and sustainability is depicted, with conventional systems having less biodiversity of living organisms on farms.
4 Discussion
4.1 Environmental footprints of soybean production systems
Alternative systems to the conventional production of soybean exhibited variabilities in their impacts, with none of them consistently scoring lower impact across multiple impact categories. At the farm gate level, we found an average emission of 0.65 kg CO2e kg−1 soybean for conventional GM soybean. This value is close to the estimates of Escobar et al. (2020), who reported 0.6 kg CO2e kg−1 soybean in Minas Gerais and 0.4 CO2e kg−1 soybean in Paraná state. However, our values were different from the much lower values of 0.18 kg CO2e kg−1 soybean obtained by Raucci et al. (2015), who did not consider the land use change emissions in the calculations. The latter argues as well that much of the emissions are from crop residues decomposition, and as in Brazil, the size of the soybean biomass residues market is huge. Lopes et al. (2025) looked beyond the composting option and proposed several valorization approaches, such as processing into fiber for further uses. Our impact scores exhibited greater consistency compared to the substantial variability in conventional soybean’s GHG emissions (−11.4 to 22.0 kg CO2-eq kg−1), documented by Romeiko et al. (2020). Their study, spanning multiple years and locations, accounted for emissions from soil carbon, nitrogen, and irrigation, and they concluded that limited irrigation and continuous organic matter application fostered soil carbon sequestration, resulting in overall reductions in GHG emissions. These contrasts emphasized the regionalized LCA for precision in results, which is what we strived for in this study.
Organic and conventional non-GM soybeans had the highest climate change and land use impacts per kg of soybean due to more diesel use and relatively lower yields (p = 0.006). This is consistent with other studies which concluded that, in the case of monocultures, organic agriculture often uses more land, yields around 20% less, and emits more GHGs (Muller et al., 2017; Clark and Tilman, 2017; de la Cruz et al., 2023). This is because, although not using GHG-intensive synthetic fertilizers, the organic system uses manure that increases the availability of reactive nitrogen in the soil and converts it into nitrous oxide over time; yet, per hectare, conventional systems have a higher climate change impact than the other systems.
The highest acidification potential was surprisingly in the conventional GM inputs-reduced system, followed closely by conventional GM, organic, and conventional non-GM-coffee intercropped. Sources of soil acidification could be the nitrogen mineral fertilizations, diesel burning emissions, fresh manure applied, and rapid decomposition in the soils. The same trends have been found by other studies. Clark and Tilman (2017) also found, in a meta-analysis, that alternative systems have a similar acidification potential and even 37% more eutrophication than conventional production systems. Bartl et al. (2012) identified ammonia emissions from urea and manure applied as the primary contributors to acidification, accounting for 94%. These emissions, along with nitrogen leaching that leads to eutrophication, were significant drivers of environmental impact in tropical farming systems, as Lucas et al. (2025) reported in the Paraná state as well.
Our study highlights the trade-offs between the impacts of different farming systems, particularly organic and intercropped systems versus conventional systems (GM, non-GM soybeans, and input-reduced systems). While organic and soybean–coffee intercropped systems had lower impacts on biodiversity loss, non-renewable energy use, acidification, and human and environmental toxicity, they scored higher impacts on land occupation and soil quality. Mixed results were found between systems regarding climate change impact, eutrophication, and non-renewable energy use. This suggests that only substituting inputs in production systems shifts impacts from one category to another, emphasizing that sustainability requires evaluating multiple environmental factors rather than relying on a one-size-fits-all approach.
In organic production, controlling weeds manually or mechanically was a major concern, especially when the farm size was larger. Furthermore, pesticides drifting from neighboring conventional farms damaged protective vegetation barriers and increased infestation risks from surrounding farms, making organic farming even more difficult. The spillover effect of this proximity has been demonstrated to lead to more pesticides being used on both sides (Larsen et al., 2024). In the studied regions, a legal reserve of native forest of 20% of the total farm area is required on medium (20–300 has) and large farms (>300 ha) (Embrapa, 2024), and this was mostly spared aside on parts of the farm or entirely in other regions. However, a land sharing approach and more vegetation and perennial barriers between farms or windbreaks within fields could foster more ecological interactions and less pesticide application in different neighboring systems (Larsen et al., 2024).
The soybean–coffee intercropped production system had better efficiency, meaning producing lower environmental externalities as they had better SOC, lower GHG emissions, biodiversity impacts, and eutrophication potential. Our findings are consistent with Balmford et al. (2018), who proved that land-efficient systems have low externalities, and high-yielding monocrops have high environmental costs. Optimizing soybean–coffee intercropping by increasing the number of soybean rows to more than three could reduce diesel use and minimize soil compaction by decreasing the frequency of spraying. Research is needed to investigate ideal crop combinations and rotations to optimize inputs and minimize emissions in soybean farming.
4.2 Sensitivity analysis of impacts to input reduction
We found that a 10% reduction in fertilizers and diesel led to reductions in emissions ranging from 0 to 14.4%, with most impact categories showing reductions below 10% across production systems. In the acidification and eutrophication potential, the low variability of impacts can be attributed to the low base saturation levels and cation exchange capacity of acidic soils, the predominance of acidic to neutral pH levels (Table 1), and the specific management practices of each farm. Many farms have been applying limestone and poultry manure, as it is more available in the region, for several years, irrespective of their production systems, which likely contributes to these observed differences. Low sensitivity results have been observed by other authors (Bartl et al., 2012), who found that increasing inputs did not necessarily increase all emissions; instead, the variability differed for each impact category. Additionally, Romeiko et al. (2020) observed that acidification and eutrophication in soybean systems are primarily driven by the application of soil organic matter and nitrogen. These results signal that attention is to be paid to which input to use, and to their possible optimization.
Our findings further indicate that intercropping significantly reduces GHG emissions, acidification, human toxicity, and energy demand through decreased input use, in line with Matsuura et al. (2017) and Nemecek et al. (2015). Other authors confirmed that land use change was the largest source of GHG emissions in soybeans in Brazil, followed by decomposition of crop residues (Raucci et al., 2015; Matsuura et al., 2017). This suggests that a substantial reduction in environmental impact requires not only minimizing fertilizers and diesel but also prioritizing the diversification of cropping systems and better crop residue management. Diversification is crucial not only for reducing pest and disease pressure but also for adding systems’ biomass, preventing erosion, increasing land use efficiency, enhancing plant–soil–microorganism interactions, crucial for nitrogen fixation, and reducing external fertilizer requirements (McBratney et al., 2014; Tang et al., 2021; Altieri et al., 2024), and is proven to be even more economically sustainable in the long term (Durham and Mizik, 2021). To reduce overall footprints and promote circularity, soybean crop residues (stalk) that were often left over at the soil surface after harvest can be valorized and processed further into compost or animal feed, films, particle board, or food additives (Bramorski et al., 2024; Lopes et al., 2025).
4.3 Pesticide use, ecotoxicity, and human toxicity impact
We identified a notable disparity in the distribution of active ingredients among various production systems. Specifically, conventional GM systems contained at least 37 active ingredients, whereas conventional non-GM systems had 21 active ingredients, because the latter was a Fairtrade certified and had restrictions on some pesticides as per certifier rules, and at least two in organic soybean production, namely copper hydroxide and sulfur. The organic soybean and conventional non-GM systems consistently recorded lower ecotoxicity and human toxicity, both per kg and per ha. The integrated pests and diseases management used in the inputs-reduced system, though claimed to reduce pesticide use by 51% (IDR-Paraná, 2025) had the lowest human toxicity but high ecotoxicity, and still yielded comparably to conventional GM with scheduled preventive pesticide applications in the west of Paraná. It is important to keep in mind that we considered only carcinogenic substances for human toxicity and used the recent CFs (Fantke et al., 2021) that were not yet parametrized for the Brazilian context at the time of research.
The GM seeds, farm size, and weed resistance partly explained the use of more pesticides and the many active ingredients observed. We observed several weeds, such as Digitaria insularis, Amaranthus spp., Euphorbia heterophylla, Conyza spp., and Bidens pilosa on the farms, that have developed resistance to several herbicides such as 2,4 D, glyphosate, clethodim, and Diquat (Cerdeira et al., 2011; Merotto et al., 2022; Heap, 2024). Also, resistance developed by pests influenced more pesticide use (Cerdeira et al., 2011; de Almeida et al., 2017; Larsen et al., 2024). As an effort to manage resistant weeds, farmers applied a mixture of concentrated herbicides at higher doses than the recommended ones. The existing practice of scheduled and preemptive pesticide application in conventional GM production is contested as not the best ecological or economic practice, as, despite high yields, the gross economic margin is smaller compared to other systems (Leonidas Zorzi, personal communication, January 23, 2023).
Furthermore, some of these active ingredients, such as Epoxiconazole, Cyproconazole, Tebuconazole, 2,4-D, Haloxyfop-R, Fipronil, and Copper hydroxide, were classified as hazardous to human health or the environment, and have been blacklisted and prohibited in various regions of the world (Neumeister, 2016). The complete list of active ingredients in each system and their hazard classes are presented in the Supplementary Information, section 6.
The consequences of pesticide use on human health and water quality are enormous, as evidenced by correlations between pesticide use in soybean cultivation, endocrine disturbances, and human mortality (da Silva et al., 2015; Tang et al., 2021). While the active ingredients were typically disclosed, the adjuvants, surfactants, and inert ingredients were not disclosed in the products’ composition. Furthermore, the residues and dispersion post-application remain largely uncharacterized. Most of the Atlantic Forest biome is at high risk of pesticide pollution since pesticide residues in the environment have exceeded the predicted no-effect concentrations by threefold magnitude (Tang et al., 2021). Therefore, since insects and fungi only attack bad or incorrectly grown plants (Howard, 1943), we advocate for reducing pesticide use to safeguard biodiversity, soil health, and human health through crop diversification and land-sharing strategies wherever possible.
4.4 Multiple functional units to compare production systems
Impacts per kilogram of outputs tended to favor the most productive systems, while the area is argued to be a better operational indicator for a fair basis of comparison. Alternative soybean systems resulted in lower impacts per unit area than per unit mass in many impact categories compared to the conventional GM. Classical LCA may underestimate the ecological performance of less intensive agroecological systems, such as organic farming (Meier et al., 2015; Meier et al., 2017; van der Werf et al., 2020; Hashemi et al., 2024), because of a narrow perspective on the functions of agricultural systems and an inconsistent modeling of indirect effects (van der Werf et al., 2020). Examples include nutrients carried over between crop successions, nutrient retention in cover crops, and improved soil health associated with agroecological practices observed in these alternatives. Our findings are in agreement with Sukhdev et al. (2016), Meier et al. (2017), and Hashemi et al. (2024) who found that multiple FUs could capture the multifunctionality of alternative systems that were not only aiming at productivity.
4.5 Agroecological considerations in LCA
Intensive systems with crop specializations were found to have unsustainable agrobiodiversity scores on 70% of the farms. The diversity of living organisms managed on a farm is a production factor, as sheltering pollinators and natural enemies of pests contributes directly to the regulation and control of pests and diseases while improving yields (Altieri et al., 2024). Its role has been linked to sustainability, resilience of the system, and food security (Kremsa, 2021). Given the lower agrobiodiversity scores in conventional systems, integrating more biological diversity on farms is desirable for productivity and sustainability.
In contrast to the LCA results, the high-yielding systems did not achieve better agrobiodiversity scores. However, the soybean–coffee intercropped and organic systems achieved superior agrobiodiversity scores. Efforts to increase agrobiodiversity in the soybean production would need to integrate several aspects of land-use planning at the landscape level for reconciling resource conservation and agricultural production (Bustamante et al., 2023; Lucas et al., 2025), which are sometimes in opposition with the conventional agriculture model that specializes in a few crops rather than diversifying. Less emphasis has been put on agrobiodiversity considerations of cropping systems (Jones et al., 2021), but it should ultimately be placed among the major criteria of sustainability, along with other agroecological metrics (Sukhdev et al., 2016; McGreevy et al., 2022), to complement LCA reports.
Agroecological practices are knowledge-intensive and require leveraging local knowledge and resources, emphasizing co-creation, co-design of solutions, and environmental awareness. Lan and Yao (2019), as well as Romeiko et al. (2020), found that information exchange, environmental awareness, and access to data are key factors influencing environmental impacts. However, the larger the farm gets, the more difficult it is to implement agroecological practices.
4.6 Practical implications and outlook
Since most environmental impacts in soybean agri-food value chains occur at the farm level, the findings of this research can be used to support farmers, regional authorities, and policymakers in decision-making to reduce the environmental footprint of soybean value chains. The prevailing trends in conventional GM soybean production systems were environmentally destructive and kept farmers trapped in a vicious cycle of dependency on seeds and input supplies, raising concerns about long-term sustainability, as they prioritize farm profitability and economic growth while causing socio-ecological issues (Ofstehage and Nehring, 2021; McGreevy et al., 2022). Unfortunately, the alternative systems studied seemed to replicate this model. However, rather than achieving true sustainability, we observed that some of these alternatives simply redistributed environmental burdens into other environmental impact categories or maybe into social impacts. Additionally, while striving to meet economic objectives, alternative systems faced challenges, such as certification costs and social pressure from neighbors. This was evident from the numerous certification schemes governing organic and non-GM soybean production, which were absent in the predominant conventional GM soybean systems.
Alternative systems, such as intercropping and crop rotation, optimized for better nutrient recycling and with lower external inputs, and organic farming (when practiced on manageable farm sizes) could reduce environmental footprints while providing better gross economic margin (Durham and Mizik, 2021). Further research is needed on how to scale farm management complexity on large farms and in intercropping and how to account for ecosystem services provided by the alternative practices (Tittonell et al., 2020). Finally, it is essential to combine soybean value chain LCA results with agent-based modeling to better understand how demand shifts could influence overall environmental footprints (Lan and Yao, 2019; Romeiko et al., 2020). In agreement with Maluf et al. (2023), this is particularly relevant in the Brazilian soybean context, where global demand, especially from China, significantly influences production pathways, with private strategies often viewed as false solutions to sustainability.
5 Conclusion
We assessed the environmental sustainability of soybean production systems in Brazil’s Atlantic Forest biome. This is one of the first studies with a wide range of indicators extended to environmental, agroecological, soil quality, and biodiversity aspects, accounting for regional land use change impacts. The analysis included conventional GM production and alternative systems: conventional GM inputs-reduced, conventional non-GM, no-GM soybean–coffee intercropping, and organic soybean production.
Our findings showed that all systems had significant environmental impacts until the farm gate. Alternative systems displayed variable impacts, with none consistently performing better across multiple impact categories, suggesting that substituting inputs may only shift the impacts from one category to another. Notably, organic production showed similar emissions to more intensive systems in several impact categories. Against a sensitivity to input reduction, each system offered potential for environmental outcomes improvement, with the soybean–coffee intercropping being most promising. While organic and intercropped systems enhanced agrobiodiversity, challenges to their adoption included direct planting, weed control, manual labor, and on-farm bioinputs production, among others. Drawing near imperative environmental sustainability would be facilitated through intercropping and land sharing, which foster ecological interactions and closed nutrient cycles. Although the initial decrease in soybean production volumes may lead to additional land use elsewhere, an optimized solution reconciling socio-economically acceptable production with environmental preservation would be ideal to seek out.
Data availability statement
The datasets presented in this study can be found in online repositories. The names of the repository/repositories and accession number(s) can be found in the article/Supplementary material.
Ethics statement
This research received the ethical approval no. EK 2022-N-190. The participants provided written informed consent to participate in this study.
Author contributions
RM: Conceptualization, Data curation, Formal analysis, Funding acquisition, Investigation, Methodology, Software, Validation, Visualization, Writing – original draft, Writing – review & editing. SP: Conceptualization, Methodology, Software, Supervision, Writing – review & editing. BT: Investigation, Software, Writing – review & editing. RC: Data curation, Investigation, Writing – review & editing. MT: Data curation, Investigation, Writing – review & editing. JJ: Conceptualization, Funding acquisition, Investigation, Methodology, Project administration, Resources, Supervision, Writing – review & editing.
Funding
The author(s) declare that financial support was received for the research and/or publication of this article. This research was funded by the Swiss National Science Foundation (grant number PCEFP1_194578). Part of the fieldwork was also supported by the Swiss Leading House for the Latin American Region, grant number: ECG2213. Open access funding by ETH Zurich.
Acknowledgments
We thank the farmers and agronomists from the cooperatives who facilitated our field data collection. A special thanks to Mr. Diogo Barbosa and Luzia Trivilin for their welcoming assistance in Minas Gerais and Paraná, respectively. We extend our gratitude to Vanessa Schenker, Shuntian Wang, and Dario Pedolin from ETH Zurich for their contributions to the LCA and Brightway discussions, as well as the reviewers.
Conflict of interest
The authors declare that the research was conducted in the absence of any commercial or financial relationships that could be construed as a potential conflict of interest.
Generative AI statement
The authors declare that no Gen AI was used in the creation of this manuscript.
Any alternative text (alt text) provided alongside figures in this article has been generated by Frontiers with the support of artificial intelligence and reasonable efforts have been made to ensure accuracy, including review by the authors wherever possible. If you identify any issues, please contact us.
Publisher’s note
All claims expressed in this article are solely those of the authors and do not necessarily represent those of their affiliated organizations, or those of the publisher, the editors and the reviewers. Any product that may be evaluated in this article, or claim that may be made by its manufacturer, is not guaranteed or endorsed by the publisher.
Supplementary material
The Supplementary material for this article can be found online at: https://www.frontiersin.org/articles/10.3389/fsufs.2025.1681792/full#supplementary-material
Footnotes
1. ^In Brazil, the term “conventional soybean” is used mainly to refer to non-GM soybean. To avoid any confusion, in this article, we always specify the type of soybean we are referring to by using the exact terms “conventional GM” or “conventional non-GM.”
2. ^Safrinha is the second crop, often maize, planted in the second season (summer), after the first crop, which is often soybean.
References
Acosta-Alba, I., Chia, E., and Andrieu, N. (2019). The LCA4CSA framework: using life cycle assessment to strengthen environmental sustainability analysis of climate smart agriculture options at farm and crop system levels. Agric. Syst. 171, 155–170. doi: 10.1016/j.agsy.2019.02.001
Altieri, M. A., Nicholls, C. I., Dinelli, G., and Negri, L. (2024). Towards an agroecological approach to crop health: reducing pest incidence through synergies between plant diversity and soil microbial ecology. NPJ Sustain. Agric. 2:6. doi: 10.1038/s44264-024-00016-2
ANDA (2024). Setor de fertilizantes, Anuário estatístico. Principais Indicadores 2024. São Paulo: ANDA-Associação Nacional Para Difusão De Adubos.
Assad, E. D., Pinto, H. S., Martins, S. C., Groppo, J. D., Salgado, P. R., Evangelista, B., et al. (2013). Changes in soil carbon stocks in Brazil due to land use: paired site comparisons and a regional pasture soil survey. Biogeosciences 10, 6141–6160. doi: 10.5194/bg-10-6141-2013
Balmford, A., Amano, T., Bartlett, H., Chadwick, D., Collins, A., Edwards, D., et al. (2018). The environmental costs and benefits of high-yield farming. Nat. Sustain. 1, 477–485. doi: 10.17865/ghgno606
Bartl, K., Verones, F., and Hellweg, S. (2012). Life cycle assessment based evaluation of regional impacts from agricultural production at the Peruvian coast. Environ. Sci. Technol. 46, 9872–9880. doi: 10.1021/es301644y
Bernoux, M., da Conceição Santana Carvalho, M., Volkoff, B., and Cerri, C. C. (2002). Brazil’s soil carbon stocks. Soil Sci. Soc. Am. J. 66, 888–896. doi: 10.2136/sssaj2002.0888
Bombardi, L. M. (2017). Geografia do uso de agrotóxicos no Brasil e conexões com a União Europeia. São Paulo: FFLCH-USP.
Bramorski, J., Lopes, H. S. M., De Jesus Barros, M. F., Mathias, S. L., and De Menezes, A. J. (2024). “Agricultural Crop Residues Biomass” in Handbook of biomass. eds. S. Thomas, M. Hosur, D. Pasquini, and C. Jose Chirayil (Singapore: Springer Nature Singapore), 195–229.
Bustamante, M. M. C., Calaça, F. J. S., Pompermaier, V. T., da Silva, M. R. S. S., and Silveira, R. (2023). “Effects of land use changes on soil biodiversity conservation” in Sustainability challenges of Brazilian agriculture: Governance, inclusion, and innovation. eds. N. Søndergaard and A. F. Barros-Platiau (Cham: Springer International Publishing), 125–143.
Campbell, B. M., Beare, D. J., Bennett, E. M., Hall-Spencer, J. M., Ingram, J. S. I., Jaramillo, F., et al. (2017). Agriculture production as a major driver of the earth system exceeding planetary boundaries. Ecol. Soc. 22:408. doi: 10.5751/ES-09595-220408
CEPEA/ESALQ (2025). Cotações de Soja. Noticia agricolas. Available online at: https://www.noticiasagricolas.com.br/cotacoes/soja/2024-03-20. [Accessed April 22, 2025]
Cerdeira, A. L., Gazziero, D. L. P., Duke, S. O., and Matallo, M. B. (2011). Agricultural impacts of glyphosate-resistant soybean cultivation in South America. J. Agric. Food Chem. 59, 5799–5807. doi: 10.1021/jf102652y
Clark, M., and Tilman, D. (2017). Comparative analysis of environmental impacts of agricultural production systems, agricultural input efficiency, and food choice. Environ. Res. Lett. 12:064016. doi: 10.1088/1748-9326/aa6cd5
CONAB (2025). Acompanhamento da Safra Brasileira de Grãos, safra 2024/25, 12o levantamento. Brasília, DF: Companhia Nacional de Abastecimento.
Conte, O., Oliveira, F. T., Harger, N., Corrêa-Ferreira, B. S., Roggia, S., Prando, A. M., et al. (2019). Resultados do manejo integrado de pragas da soja na safra 2018/19 no Paraná. Londrina: Embrapa Soja.
Costantini, M., and Bacenetti, J. (2021). Soybean and maize cultivation in South America: environmental comparison of different cropping systems. Clean. Environ. Syst. 2:100017. doi: 10.1016/j.cesys.2021.100017
da Silva, J. F. S., da Silva, A. M. C., Lima-Luz, L., Aydos, R. D., and Mattos, I. E. (2015). Correlação entre produção agrícola, variáveis clínicas-demográfcas e câncer de próstata: um estudo ecológico. Ciênc. Saúde Coletiva 20, 2805–2812. doi: 10.1590/1413-81232015209.00582015
de Almeida, V. E. S., Friedrich, K., Tygel, A. F., Melgarejo, L., and Carneiro, F. F. (2017). Use of genetically modified crops and pesticides in Brazil: growing hazards. Ciênc. Saúde Coletiva 22, 3333–3339. doi: 10.1590/1413-812320172210.17112017
de la Cruz, V. Y., Tantriani, V., Cheng, W., and Tawaraya, K. (2023). Yield gap between organic and conventional farming systems across climate types and sub-types: a meta-analysis. Agric. Syst. 211:103732. doi: 10.1016/j.agsy.2023.103732
De Laurentiis, V., Maier, S., Horn, R., Uusitalo, V., Hiederer, R., Chéron-Bessou, C., et al. (2024). Soil organic carbon as an indicator of land use impacts in life cycle assessment. Int. J. Life Cycle Assess. 29, 1190–1208. doi: 10.1007/s11367-024-02307-9
Durham, T. C., and Mizik, T. (2021). Comparative economics of conventional, organic, and alternative agricultural production systems. Economies 9:64. doi: 10.3390/economies9020064
Ecoinvent (2024). Ecoinvent v3.11. database (cut-off version). Available online at: https://ecoinvent.org/. [Accessed March 2, 2025].
Embrapa. (2024). Legal Reserve Areas - Portal Embrapa. Available online at: https://www.embrapa.br/en/codigo-florestal/area-de-reserva-legal-arl. [Accessed November 24, 2024]
Escher, F., and Wilkinson, J. (2019). A economia política do complexo Soja-Carne Brasil-China. Rev. Econ. Sociol. Rural. 57, 656–678. doi: 10.1590/1806-9479.2019.191017
Escobar, N., Tizado, E. J., Ermgassen, E. K., Löfgren, P., Börner, J., and Godar, J. (2020). Spatially-explicit footprints of agricultural commodities: mapping carbon emissions embodied in Brazil’s soy exports. Glob. Environ. Chang. 62:102067. doi: 10.1016/j.gloenvcha.2020.102067
Fantke, P., Chiu, W. A., Aylward, L., Judson, R., Huang, L., Jang, S., et al. (2021). Exposure and toxicity characterization of chemical emissions and Chemicals in Products: global recommendations and implementation in USEtox. Int. J. Life Cycle Assess. 26, 899–915. doi: 10.1007/s11367-021-01889-y
FAO (2019). Tool for agroecology performance evaluation (TAPE) - test version: Process of development and guidelines for application. Rome, Italy: FAO.
FAOSTAT (2025). FAOSTAT. Available online at: https://www.fao.org/faostat/en/#home. [Accessed September 26, 2025]
Fehlenberg, V., Baumann, M., Gasparri, N. I., Piquer-Rodriguez, M., Gavier-Pizarro, G., and Kuemmerle, T. (2017). The role of soybean production as an underlying driver of deforestation in the south American Chaco. Glob. Environ. Chang. 45, 24–34. doi: 10.1016/j.gloenvcha.2017.05.001
Freitas, L. M., Souza, B. H. S., Ferreira, F. S., Antunes, A. P. A., and Bruzi, A. T. (2024). Resistance of Bt and non-Bt soybean cultivars adapted to novel growing regions of Brazil to Chrysodeixis includens and Spodoptera frugiperda. Neotrop. Entomol. 53, 1332–1342. doi: 10.1007/s13744-024-01208-8
Fundação SOS Mata Atlântica (2023). Soja também desmata a Mata Atlantica | SOS Mata Atlântica. Available online at: https://www.sosma.org.br/artigos/soja-tambem-desmata-a-mata-atlantica. [Accessed February 28, 2025]
Garofalo, D. F. T., Novaes, R. M. L., Pazianotto, R. A. A., Maciel, V. G., Brandão, M., Shimbo, J. Z., et al. (2022). Land-use change CO2 emissions associated with agricultural products at municipal level in Brazil. J. Clean. Prod. 364:132549. doi: 10.1016/j.jclepro.2022.132549
Gliessman, S. R. (2015). Agroecology: The ecology of sustainable food systems. Boca Raton, Florida, USA: CRC Press.
Grant, T., Bessou, C., Mila-i-Canals, L., Grann, B., De, V., Ugayav, C., et al. (2019). “Land use impacts on soil quality” in Global guidance on environmental life cycle impact assessment indicators. eds. T. Grant and C. Bessou (Paris: UNEP/SETAC Life Cycle Initiative).
Hashemi, F., Mogensen, L., van der Werf, H. M. G., Cederberg, C., and Knudsen, M. T. (2024). Organic food has lower environmental impacts per area unit and similar climate impacts per mass unit compared to conventional. Commun. Earth Environ. 5, 1–18. doi: 10.1038/s43247-024-01415-6
Heap, I. (2024). The international herbicide-resistant weed database. Available online at: https://www.weedscience.org/Home.aspx. [Accessed November 24, 2024]
Huijbregts, M. A., Steinmann, Z. J., Elshout, P. M., Stam, G., Verones, F., Vieira, M. D. M., et al. (2016). ReCiPe 2016: a harmonized life cycle impact assessment method at midpoint and endpoint level report I: characterization. Nijmegen: National Institute for Public Health and the Environment.
IBGE (2024). Levantamento Sistemático da Produção Agrícola (LSPA). Available online at: https://www.ibge.gov.br/estatisticas/todos-os-produtos-estatisticas.html. [Accessed October 14, 2024]
IDR-Paraná (2025). Manejo Integrado de Pragas na Soja - MIP-Soja. Instituto de Desenvolvimento Rural do Paraná. Available online at: https://www.idrparana.pr.gov.br/Pagina/Manejo-Integrado-de-Pragas-na-Soja-MIP-Soja. [Accessed October 15, 2024]
Igos, E., Benetto, E., Meyer, R., Baustert, P., and Othoniel, B. (2019). How to treat uncertainties in life cycle assessment studies? Int. J. Life Cycle Assess. 24, 794–807. doi: 10.1007/s11367-018-1477-1
ISO (2006). ISO 14044 - environmental management: life cycle assessment; requirements and guidelines. Geneva, Switzerland: ISO.
Jones, S. K., Estrada-Carmona, N., Juventia, S. D., Dulloo, E., Laporte, M.-A., Villani, C., et al. (2021). Agrobiodiversity index scores show agrobiodiversity is underutilized in national food systems. Nat. Food 2, 712–723. doi: 10.1038/s43016-021-00344-3
Kamali, F. P., Meuwissen, M. P. M., de Boer, I. J. M., van Middelaar, C. E., Moreira, A., and Lansink, A. O. (2017). Evaluation of the environmental, economic, and social performance of soybean farming systems in southern Brazil. J. Clean. Prod. 142, 385–394. doi: 10.1016/j.jclepro.2016.03.135
Kremsa, V. (2021). “Sustainable management of agricultural resources (agricultural crops and animals)” in Sustainable resource management. eds. C. M. Hussain and J. F. Velasco-Muñoz (London: Elsevier), 99–145.
Lan, K., and Yao, Y. (2019). Integrating life cycle assessment and agent-based modeling: a dynamic modeling framework for sustainable agricultural systems. J. Clean. Prod. 238:117853. doi: 10.1016/j.jclepro.2019.117853
Larsen, A. E., Noack, F., and Powers, L. C. (2024). Spillover effects of organic agriculture on pesticide use on nearby fields. Science 383:eadf2572. doi: 10.1126/science.adf2572
Legaz, V. B., Maia De Souza, D., Teixeira, R. F. M., Antón, A., Putman, B., and Sala, S. (2017). Soil quality, properties, and functions in life cycle assessment: an evaluation of models. J. Clean. Prod. 140, 502–515. doi: 10.1016/j.jclepro.2016.05.077
Lopes, H. S. M., de Góes, T. S., Khiari, R., Mathias, S. L., Barros, M. F., Bramorski, J., et al. (2025). Soybean economic values and waste valorization through different approaches. Lumen Virtus 16, 1240–1262. doi: 10.56238/levv16n45-044
Lucas, K. R. G., Ventura, M. U., Debiasi, H., Ralisch, R., Dos Santos, J. C. F., and Folegatti-Matssura, M. I. S. (2025). Soil chemical quality indicators for agricultural life cycle assessment: a case of study in Brazil. Int. J. Environ. Sci. Technol. 22, 5193–5210. doi: 10.1007/s13762-024-05859-3
Maciel, V. G., Zortea, R. B., Menezes da Silva, W., Cybis, L. F., Einloft, S., and Seferin, M. (2015). Life cycle inventory for the agricultural stages of soybean production in the state of Rio Grande do Sul Brazil. J. Clean. Prod. 93, 65–74. doi: 10.1016/j.jclepro.2015.01.016
Malembaka, R. B.. (2025). Supplementary information: are alternatively organized value chains more environmentally sustainable? Evidence from soybean production in Minas Gerais and Paraná states, Brazil. 771929 bytes. Available online at: https://figshare.com/articles/dataset/Supplementary_information_Are_alternatively_organized_value_chains_more_environmentally_sustainable_Evidence_from_soybean_production_in_Minas_Gerais_and_Paran_states_Brazil/29852204. [Accessed August 7, 2025]
Maluf, R. S., Burlandy, L., Cintrão, R. P., Jomalinis, E., Santarelli, M., and Tribaldos, T. (2023). Global value chains, food and just transition: a multi-scale approach to Brazilian soy value chains. J. Peasant Stud. 7, 2642–2665. doi: 10.1080/03066150.2022.2105700
Matsuura, M. I. S. F., Cardoso, F. H., Pighinelli, A. L. M. T., Maciel, V. G., Ramos, N. P., Garofalo, D. F. T., et al. (2022). Workbook for life cycle inventories of agricultural products, according to different methodological guides. Available online at: http://www.infoteca.cnptia.embrapa.br/handle/doc/1148618. [Accessed December 4, 2023]
Matsuura, M. I. S. F., Dias, F. R. T., Picoli, J. F., Lucas, K. R. G., de Castro, C., and Hirakuri, M. H. (2017). Life-cycle assessment of the soybean-sunflower production system in the Brazilian Cerrado. Int. J. Life Cycle Assess. 22, 492–501. doi: 10.1007/s11367-016-1089-6
McBratney, A., Field, D. J., and Koch, A. (2014). The dimensions of soil security. Geoderma 213, 203–213. doi: 10.1016/j.geoderma.2013.08.013
McGreevy, S. R., Rupprecht, C. D. D., Niles, D., Wiek, A., Carolan, M., Kallis, G., et al. (2022). Sustainable agrifood systems for a post-growth world. Nat. Sustain. 5, 1011–1017. doi: 10.1038/s41893-022-00933-5
Meier, M., Hörtenhuber, S., Schader, C., and Stolze, M. (2017). Organic farming and sustainability: Life cycle assessments of organic foods. Frick, Switzerland: Research Institute of Organic Agriculture FiBL.
Meier, M., Stoessel, F., Jungbluth, N., Juraske, R., Schader, C., and Stolze, M. (2015). Environmental impacts of organic and conventional agricultural products – are the differences captured by life cycle assessment? J. Environ. Manag. 149, 193–208. doi: 10.1016/j.jenvman.2014.10.006
Merotto, A., Gazziero, D. L. P., Oliveira, M. C., Scursoni, J., Garcia, M. A., Figueroa, R., et al. (2022). Herbicide use history and perspective in South America. Adv. Weed Sci. 40:e020220050. doi: 10.51694/AdvWeedSci/2022
Mottet, A., Bicksler, A., Lucantoni, D., De Rosa, F., Scherf, B., Scopel, E., et al. (2020). Assessing transitions to sustainable agricultural and food systems: a tool for agroecology performance evaluation (TAPE). Front. Sustain. Food Syst. 4:579154. doi: 10.3389/fsufs.2020.579154
Muller, A., Schader, C., El-Hage Scialabba, N., Brüggemann, J., Isensee, A., Erb, K.-H., et al. (2017). Strategies for feeding the world more sustainably with organic agriculture. Nat. Commun. 8:1290. doi: 10.1038/s41467-017-01410-w
Naudin, C., van der Werf, H. M. G., Jeuffroy, M.-H., and Corre-Hellou, G. (2014). Life cycle assessment applied to pea-wheat intercrops: a new method for handling the impacts of co-products. J. Clean. Prod. 73, 80–87. doi: 10.1016/j.jclepro.2013.12.029
Nemecek, T., Antón, A., Basset-Mens, C., Gentil-Sergent, C., Renaud-Gentié, C., Melero, C., et al. (2022). Operationalising emission and toxicity modelling of pesticides in LCA: the OLCA-pest project contribution. Int. J. Life Cycle Assess. 27, 527–542. doi: 10.1007/s11367-022-02048-7
Nemecek, T., Bengoa, X., Lansche, J., Roesch, A., Faist-Emmenegger, M., Rossi, V., et al. (2019). World food LCA database: methodological guidelines for the life cycle inventory of agricultural products. Lausanne and Zurich, Switzerland: Quantis and Agroscope.
Nemecek, T., Hayer, F., Bonnin, E., Carrouée, B., Schneider, A., and Vivier, C. (2015). Designing eco-efficient crop rotations using life cycle assessment of crop combinations. Eur. J. Agron. 65, 40–51. doi: 10.1016/j.eja.2015.01.005
Ofstehage, A., and Nehring, R. (2021). No-till agriculture and the deception of sustainability in Brazil. Int. J. Agric. Sustain. 19, 335–348. doi: 10.1080/14735903.2021.1910419
Poore, J., and Nemecek, T. (2018). Reducing food’s environmental impacts through producers and consumers. Science 360, 987–992. doi: 10.1126/science.aaq0216
Proterra (2024). The 2023/24 non-GMO soybean crop in Brazil. Available online at: https://www.proterrafoundation.org/news/the-2023-24-non-gmo-soybean-crop-in-brazil-2/. [Accessed December 4, 2024]
Rajão, R., Soares-Filho, B., Nunes, F., Börner, J., Machado, L., Assis, D., et al. (2020). The rotten apples of Brazil’s agribusiness. Science 369, 246–248. doi: 10.1126/science.aba6646
Rasmussen, L. V., Coolsaet, B., Martin, A., Mertz, O., Pascual, U., Corbera, E., et al. (2018). Social-ecological outcomes of agricultural intensification. Nat. Sustain. 1, 275–282. doi: 10.1038/s41893-018-0070-8
Raucci, G. S., Moreira, C. S., Alves, P. A., Mello, F. F. C., Frazão, L. A., Cerri, C. E. P., et al. (2015). Greenhouse gas assessment of Brazilian soybean production: a case study of Mato Grosso state. J. Clean. Prod. 96, 418–425. doi: 10.1016/j.jclepro.2014.02.064
Richardson, K., Steffen, W., Lucht, W., Bendtsen, J., Cornell, S. E., Donges, J. F., et al. (2023). Earth beyond six of nine planetary boundaries. Sci. Adv. 9:eadh2458. doi: 10.1126/sciadv.adh2458
Romeiko, X. X., Lee, E. K., Sorunmu, Y., and Zhang, X. (2020). Spatially and temporally explicit life cycle environmental impacts of soybean production in the U.S. Midwest. Environ. Sci. Technol. 54, 4758–4768. doi: 10.1021/acs.est.9b06874
Scherer, L., Rosa, F., Sun, Z., Michelsen, O., De Laurentiis, V., Marques, A., et al. (2023). Biodiversity impact assessment considering land use intensities and fragmentation. Environ. Sci. Technol. 57, 19612–19623. doi: 10.1021/acs.est.3c04191
Sonderegger, T., Pfister, S., and Hellweg, S. (2020). Assessing impacts on the natural resource soil in life cycle assessment: methods for compaction and water Erosion. Environ. Sci. Technol. 54, 6496–6507. doi: 10.1021/acs.est.0c01553
Søndergaard, N., de Sa, C. D., and Platiau, A. F. B. (2023). “Introduction: the sustainability challenges of Brazilian agriculture” in Sustainability challenges of Brazilian agriculture: governance, inclusion, and innovation. eds. N. Søndergaard and A. F. Barros-Platiau (Brazil: Springer International Publishing), 1–16.
Søndergaard, N., Thives, V., and Inoue, C. (2023). “The Shanghai connection: governing the sustainability impacts of Brazilian Agri-exports to China” in Sustainability challenges of Brazilian agriculture: governance, inclusion, and innovation. eds. N. Søndergaard and A. F. Barros-Platiau (Cham: Springer International Publishing), 19–44.
Song, X.-P., Hansen, M. C., Potapov, P., Adusei, B., Pickering, J., Adami, M., et al. (2021). Massive soybean expansion in South America since 2000 and implications for conservation. Nat. Sustain. 4, 784–792. doi: 10.1038/s41893-021-00729-z
Steubing, B., De Koning, D., Haas, A., and Mutel, C. L. (2020). The activity browser — an open source LCA software building on top of the brightway framework. Softw. Impact. 3:100012. doi: 10.1016/j.simpa.2019.100012
Steubing, B., De Koning, D., Haas, A., Mutel, C., van der Meide, M., and Visscher, M. (2025). Activity-browser. Available online at: https://github.com/LCA-ActivityBrowser/activity-browser. [Accessed October 12, 2024]
Stirle, J. L., Matias, J. E. F., Mendes, G. R., Moscardini, V. F., Maia, J. B., Michaud, J., et al. (2024). Differential susceptibility of (Lepidoptera: Noctuidae) to single versus pyramided traits in Brazilian soybean: what doesn’t kill you makes you stronger? Pest Manag. Sci. 80, 6535–6544. doi: 10.1002/ps.8391
Sukhdev, P., May, P., and Müller, A. (2016). Fix food metrics. Nature 540, 33–34. doi: 10.1038/540033a
Sun, Z., Scherer, L., Tukker, A., and Behrens, P. (2020). Linking global crop and livestock consumption to local production hotspots. Glob. Food Secur. 25:100323. doi: 10.1016/j.gfs.2019.09.008
Tang, F. H. M., Lenzen, M., McBratney, A., and Maggi, F. (2021). Risk of pesticide pollution at the global scale. Nat. Geosci. 14, 206–210. doi: 10.1038/s41561-021-00712-5
Tittonell, P., Piñeiro, G., Garibaldi, L. A., Dogliotti, S., Olff, H., and Jobbagy, E. G. (2020). Agroecology in large scale farming—a research agenda. Front. Sustain. Food Syst. 4:584605. doi: 10.3389/fsufs.2020.584605
Trase (2023). Trase - data explorer. Available online at: https://explore.trase.earth. [Accessed December 4, 2023]
Tricase, C., Lamonaca, E., Ingrao, C., Bacenetti, J., and Lo Giudice, A. (2018). A comparative life cycle assessment between organic and conventional barley cultivation for sustainable agriculture pathways. J. Clean. Prod. 172, 3747–3759. doi: 10.1016/j.jclepro.2017.07.008
USDA. (2024). Livestock and poultry: world markets and trade. Available online at: https://apps.fas.usda.gov/psdonline/circulars/livestock_poultry.pdf. [Accessed March 30, 2025]
van der Werf, H. M. G., Knudsen, M. T., and Cederberg, C. (2020). Towards better representation of organic agriculture in life cycle assessment. Nat. Sustain. 3, 419–425. doi: 10.1038/s41893-020-0489-6
Wei, W., Larrey-Lassalle, P., Faure, T., Dumoulin, N., Roux, P., and Mathias, J.-D. (2015). How to conduct a proper sensitivity analysis in life cycle assessment: taking into account correlations within LCI data and interactions within the LCA calculation model. Environ. Sci. Technol. 49, 377–385. doi: 10.1021/es502128k
Weidema, B. P., and Wesnæs, M. S. (1996). Data quality management for life cycle inventories—an example of using data quality indicators. J. Clean. Prod. 4, 167–174. doi: 10.1016/S0959-6526(96)00043-1
Keywords: agroecological transition, conventional agriculture, input reduction, land-use change, soybean, spatially explicit LCA, Atlantic Forest biome
Citation: Malembaka RB, Pfister S, Thom B, Cintrão RP, Trivilin MI and Jacobi J (2025) Are alternatively organized value chains more environmentally sustainable? Evidence from soybean production in Minas Gerais and Paraná states, Brazil. Front. Sustain. Food Syst. 9:1681792. doi: 10.3389/fsufs.2025.1681792
Edited by:
Hendrik Hänke, Welthungerhilfe, GermanyReviewed by:
Álvaro Acevedo-Osorio, National University of Colombia, ColombiaHenrique Lopes, São Paulo State Technological College, Brazil
Copyright © 2025 Malembaka, Pfister, Thom, Cintrão, Trivilin and Jacobi. This is an open-access article distributed under the terms of the Creative Commons Attribution License (CC BY). The use, distribution or reproduction in other forums is permitted, provided the original author(s) and the copyright owner(s) are credited and that the original publication in this journal is cited, in accordance with accepted academic practice. No use, distribution or reproduction is permitted which does not comply with these terms.
*Correspondence: Réussite Bugale Malembaka, YnVnYWxlY2hpdGVAZ21haWwuY29t