 Mauricio Céspedes Tenorio
 Carlos A. Wattson Sánchez
 Diego S. Dumani
- 1School of Electrical Engineering, University of Costa Rica, San Pedro, Costa Rica
- 2Research Center on Surgery and Cancer (CICICA), University of Costa Rica, San Pedro, Costa Rica
Photothermal therapy (PTT) is a type of cancer treatment capable of damaging tumors using laser irradiation. This procedure can be a promising approach to complement current cancer therapies, due in part to its minimal invasiveness. One of the challenges of photothermal therapy is the potential collateral damage to the surrounding healthy tissue, as well as excessive temperature increase in the target tumor region that can cause tissue carbonization and evaporation. With the aim of increasing the performance of photothermal therapy in damaging targeted tumor while keeping healthy nearby tissue unaffected, this research proposes the use of a feedback control system that considers the cumulative thermal damage to both types of tissue. Two separate control algorithms (fuzzy logic and PI) were designed and tested in silico using simulations made in MATLAB® and Python. Results showed that both controllers successfully accomplished the proposed goals. Therefore, the feasibility of using these automated systems to improve the efficacy and safety of PTT was demonstrated.
1 Introduction
Cancer kills almost 10 million patients per year globally. In 2020, over 19 million new cases were diagnosed (Ferlay et al., 2021). According to the National Institute of Cancer, radiation emitting equipment, surgery, and chemotherapy, are common treatments against cancer (National Institute of Cancer, 2022). While radiation therapy frequently shows remarkable results, it carries a risk of causing DNA and tissue damage. The use of ionizing radiation may cause several problems in particular populations, such as children, for whom exposure increases the risk of leukemia, as well as breast and thyroid cancer (Kutanzi et al., 2016).
In order to increase the efficacy of cancer treatments, alternatives such as photothermal therapy (PPT) can be used as a complement to the existing ones. Photothermal therapy is a laser-mediated hyperthermia method with benefits such as improved selectivity, minimal invasiveness, and reduced side effects (Zhi et al., 2020). The selectivity can be achieved with the use of contrast agents that enhance the optical absorption, and thus thermal dose in the target region. However, PTT has limitations such as penetration depth, as well as temperature limitations, because an excessive temperature increase can cause tissue carbonization and damage to the surrounding healthy tissue (Yarmolenko et al., 2011). Thus, the ideal temperatures for PTT are close to 46°C, which are likely to induce apoptosis (Chen et al., 1995; Haghniaz et al., 2015).
While the tissue temperature is critical to induce the desired damage, the exposure time is also a variable that determines the overall damage in a region (Henriques, 1947; Aliannezhadi et al., 2018). A significant problem with PTT is the lack of control of the laser light distribution in tissue, which might cause unwanted damage to healthy tissue around tumors (Deng et al., 2021; Zhao, 2021).
Thus, real-time temperature monitoring is critical in this type of treatment. Moreover, a system that can use the temperature information and track the thermal damage would allow to control the laser power in order to optimize the damage induced in the target regions while keeping damage to healthy tissues at a minimum.
In this work, we present an in silico PTT system with temperature monitoring integrated with a damage-tracking control system to automate the delivered thermal dose and optimize the therapeutic outcome. The main goal of the control system is to eliminate the entire tumor area, with minimum collateral damage to healthy surrounding tissue.
The PTT system was implemented by simulating a contrast agent-loaded tumor irradiated by a continuous wave laser. The control system operates the laser power, while the input to the control system is the real-time temperature data that is assumed to be available from an image-guided thermometry technique such as ultrasound and/or photoacoustic imaging (Shah et al., 2008a; Shah et al., 2008b). Two types of controllers were developed to demonstrate the feasibility of controlling the laser power in real time to maximize the thermal damage in the target tissue, while minimizing damage to healthy surrounding tissue.
The design and tuning of both controllers, as well as their integration with the PTT system for therapy simulation were made using MATLAB® and Python.
2 Methods
2.1 Mathematical modelling of light propagation and thermal damage
Temperature distribution in tissue: The behavior of heat diffusion in tissue follows the Pennes bioheat equation (Pennes, 1948; Ferrás et al., 2015):
where
In Eq. 2,
In this case,
Light propagation in tissue: Monte Carlo technique was used to calculate the laser light fluence (
Tissue thermal damage: Thermal damage was estimated using Arrhenius equation (Henriques, 1947; Jasiński, 2015):
where
Thus, a thermal damage (
2.2 Controller design
Previous studies have proposed several control techniques for photothermal therapy, specifically PID and fuzzy logic schemes have been designed (Chen et al., 1995; Nguyen et al., 2016). However, these studies considered only temperature-related metrics. In this research, it is intended to design a controller that not only takes temperature into account, but also the real-time thermal damage in tissue. The main aim of this research is to demonstrate that it is possible to create a closed-loop system able to predict the thermal response in different regions of the tissue and take automated decisions based on these metrics and the estimated thermal damage.
Here, a closed-loop system is proposed, as shown in Figure 1. In this proposal, a thermometry technique such as photoacoustic (PA) imaging and/or ultrasound is assumed to be available to acquire real-time temperature distribution in the tissue. Although non-invasive thermometry techniques have their own challenges and limitations (Tenorio and Dumani, 2021), those are out of the scope of this study. Based on the temperature data, thermal damage for each pixel in the images can be estimated using the Arrhenius equation. These metrics (thermal damage and temperature) from specific chosen points act as the input of the controller, which modulates the power from the laser until the desired damage conditions are met. These conditions can be defined by physicians according to the clinical protocols. Based on this scheme, two controller alternatives were designed: a Fuzzy Logic Controller (FLC) and a PID controller. The design strategy and specific parameters for each controller are described in the subsection below.
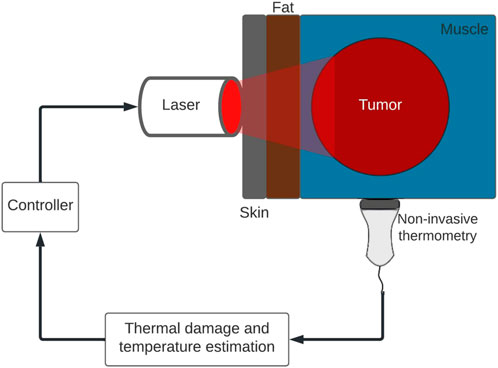
Figure 1. Work scheme for tissue damage-tracking control system with image-guided thermometry.
2.2.1 Fuzzy logic controller design
The first controller approach that was considered was a fuzzy logic controller (FLC). This control scheme provides the advantage of being able to manipulate its output based on multiple inputs and logic rules, which is a useful property for this study as it is intended to not only take in consideration one unique metric but several of them, such as metrics from tumor and surrounding healthy tissue. Furthermore, this algorithm is capable of managing non-linear systems, which is the case for the thermal process during photothermal therapy. In addition, the FLC offers the possibility of easily readjusting its parameters in accordance with the tissue characteristics and the physician’s criteria on the characteristics and goals of each therapy.
The proposed FLC has the goal of maximizing tumor thermal damage, thus the effectiveness of the therapy. Additionally, it was designed to minimize damage to surrounding healthy tissue and to keep the temperature high enough to induce cellular damage, but low enough to avoid tissue evaporation and carbonization. The controller error inputs consisted of:
1 Error in target tumor thermal damage (
2 Future error in the highest temperature point of the tumor (
where
where
3 Future error in the healthy tissue maximum temperature (
where
Each error input is associated with a membership function. The FLC controller output determines the change in laser power (
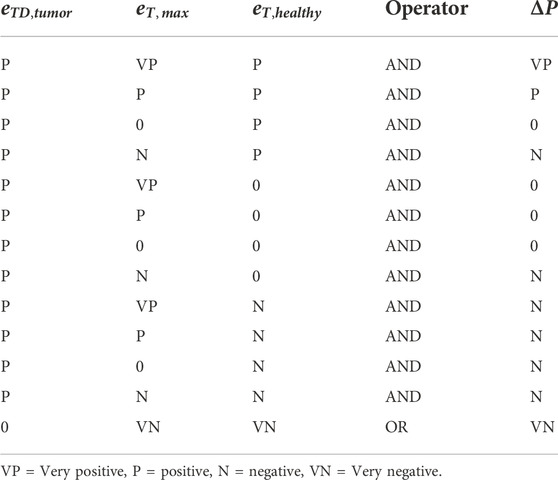
Table 1. Fuzzy logic rules used for the controller design.
Functionally, the logic rules from Table 1 can be condensed into three general rules that are followed hierarchically by the FLC:
1) If the tumor reaches 100% of thermal damage, i.e, if
2) If the limit on maximum healthy tissue temperature is exceeded, i.e., if
3) If none of the above conditions are met, the FLC will change the laser power to try to reach the maximum allowed tumor temperature (
Lastly, a saturation limit was set for the laser power output signal. This limit is based on the type of laser chosen and its maximum power. This allows the controller output to stay within the laser power delivery capacity. Because negative power is not possible, an additional limit exists such that the minimum power output set by the controller is 0 W.
The controller was implemented as a Sugeno fuzzy logic controller using MATLAB’s Fuzzy Logic Toolbox. The operating ranges of the FLC were defined empirically. The controller was tested considering a 4 W laser, which is consistent with the power range of continuous wave lasers used for photothermal therapy; however, the controller can be modified by the end-user to control lasers with higher maximum power if needed in a particular clinical setting.
2.2.2 PI controller design
A second controller was implemented separately, to evaluate another alternative of controlling photothermal therapy as proposed in this study. A PID controller was designed by defining tissue temperature as the process variable and the laser power as the manipulated variable. Unlike the FLC, the PID has a single input-single output (SISO) nature, which only provides one path to control to target variable. Thus, the PID was designed to solely control the temperature within the tumor, i.e.
Another difference from the FLC is that the PID requires a linear model to be controlled. Given that the thermal process of photothermal therapy is nonlinear, linearization was required to tune the PID. A 4 W maximum power was again considered for the laser. Given the power limits of the laser (0 W–4 W), the process was linearized considering four operation ranges as shown in Table 2. On each region, a “half-step” response was evaluated to determine similarities in the process response at different operating points.
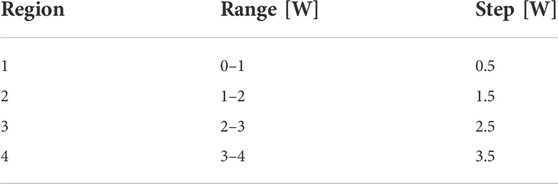
Table 2. Range and steps values in Watts used to generate the linear model in each section.
Based on the step responses from each region, the linear approximations for the models were obtained using MATLAB’s System Identification Toolbox. All four linear equations generated by the toolbox share one similarity: all of them were approximated using two poles and two zeros on the respective Transfer Function (TF). Furthermore, during the evaluation of each model, it was observed that the differences between the TF’s for the regions 2-3 and four were negligible. This allowed to reuse a TF and merge the operating regions 2, 3, and four into a single region. Therefore, only two regions were considered for the PID controller design, the first region from 0 W to 1 W, and the second region from 1 W to 4 W.
Next, the proportional, integral and derivative constants (P, I, D) were obtained. The values were tuned using MATLAB’s function pidtune, which receives a linear plant model and returns the parameters of a PID controller, based on stability, performance, robustness and reference tracking to perform a better output from the model (MathWorks, 2022).
The transfer function, and proportional (Kp) and integral (Ki) gains obtained for each model are shown in Table 3. Although a PID was considered for the design, the derivative constants (Kd) obtained from the pidtune function were equal to zero. Thus, the PID controller will henceforth be referred to as a PI controller.
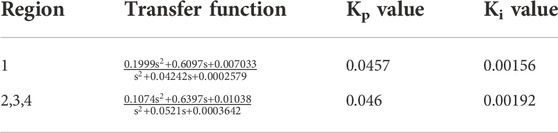
Table 3. Transfer functions and gains for the PI controller according to region of interest.
Because the thermal process is a relatively slow system, the predictive technique used in the FLC (Eq. 8) was implemented for the PI to speed up the system response. Thus,
2.3 Photothermal therapy simulation parameters
To simulate the photothermal therapy process, an open-source code was used along with two MALTAB®. First, ValoMC was used to approximate the 3D light propagation in tissue. Then, the Fuzzy Logic Toolbox was utilized to design and implement the FLC. Last, the Partial Differential Equation Toolbox was used to simulate the thermal response and heat diffusion within the tissue during the therapy.
An external 1064-nm continuous wave (CW) laser source was considered to take advantage of the minimal invasiveness of PTT. The laser spot radius at the skin surface was equal to 5 mm. Four types of tissue were simulated: (Hong, et al., 2009; Mechelli et al., 2020).
• Skin: Outermost layer with dimensions of
• Subcutaneous fat: Layer between skin and muscle. Dimensions of
• Muscle: Deeper layer considered with dimensions of
• Tumor: The tumor consisted of a superficial half-sphere of 10 mm in diameter, i.e., the diameter was coincident with the outermost part of the skin.
The optical and thermal properties of each tissue layer are shown in Tables 4 and 5, respectively.
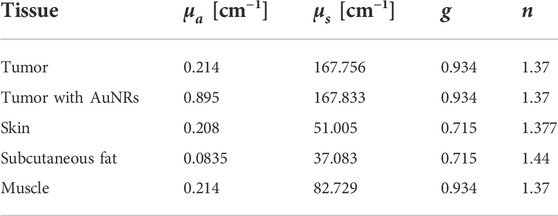
Table 4. Optical properties of simulated tissues at 1064 nm. Recovered from (Prahl, 1999, 2017; Bashkatov et al., 2011; Jacques, 2013; Ren et al., 2017).
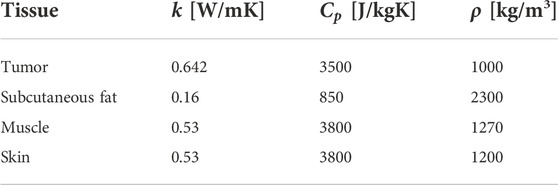
Table 5. Thermal properties of simulated tissues. Recovered from (Wilson and Spence, 1988; Lang et al., 1999).
The blood perfusion parameters from Eq. 3 were set following Drizdal et al. (2010) and Lang et al. (1999):
• Blood specific heat
• Blood temperature
• Blood mass flow rate, in
The metabolic heat generation was set to
Gold nanorods (AuNRs) were simulated to be injected in the tumor to enhance optical absorption. To calculate the optical properties of the AuNRs, they were considered to have a radius of 11.43 nm and an aspect ratio of 6.83. A volume fraction of
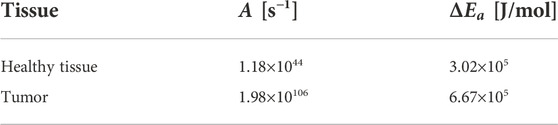
Table 6. Thermal properties of simulated tissues. Recovered from (Paruch, 2020).
Finally, the boundary conditions for the finite element geometry included:
- External boundary: natural convection with room temperature of 25°C and heat transfer coefficient of 5 W/(m2K) (Ren et al., 2017).
- Internal boundaries: isothermal with temperature of 37°C (normal body temperature).
- Initial condition: temperature of 37°C for the entire tissue sample (normal body temperature).
All the optical, thermal, and controller parameters were imported into MATLAB to perform the simulations. The light propagation model (Monte Carlo) for the tissue was obtained once and normalized to 1 W. Thus, the same light distribution was used to find the optical power in the tissue by multiplying the normalized matrix by the laser power on each time step.
Each controller was evaluated individually in separate simulations. The controller parameters were used to manipulate the laser power, i.e., Eq. 4, and solve the partial differential equations of the thermal process during the therapy. The tissue temperature values from each simulation step were used as an input to the controller and the damage-tracking calculation. This process was repeated until the end of the therapy, i.e., when 100% damage was obtained in the tumor region.
3 Results
Simulations were made to evaluate the ability of the controllers to maximize tumor damage, while trying to minimize surrounding healthy tissue damage. Two different tests were conducted to assess the performance of the designed controller. In the first stage, the maximum temperature setpoint (the desired hyperthermia temperature
Figure 2 shows that complete thermal damage was achieved for this first test with both controllers. The times required to reach 100% tumor damage were 520 s and 540 s for the PI and FL controllers, respectively. Therefore, the main goal of the controllers was accomplished, with a considerably small difference between the proposed solutions.
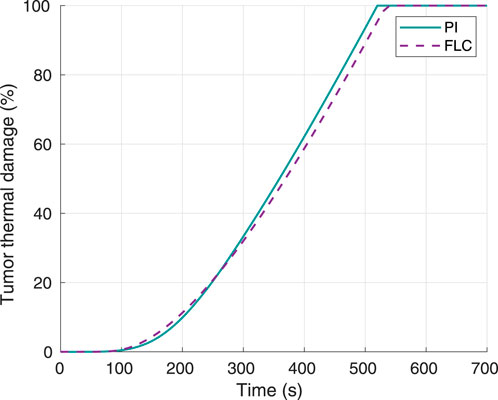
Figure 2. Tumor thermal damage percentage, using 60°C as desired hyperthermia temperature. Obtained from simulations.
Hyperthermia temperature responses for both controllers can be observed in Figure 3. In the case of the FLC, the settling time, i.e. time to remain within 2% of the 60°C setpoint, was 80 s with a temperature of 59.68°C. On the other hand, the PI had a settling time of 120 s with a temperature of 59.25°C. Furthermore, the maximum overshoot for the FL and PI controllers were approximately 0.65°C and 0.53°C, respectively.
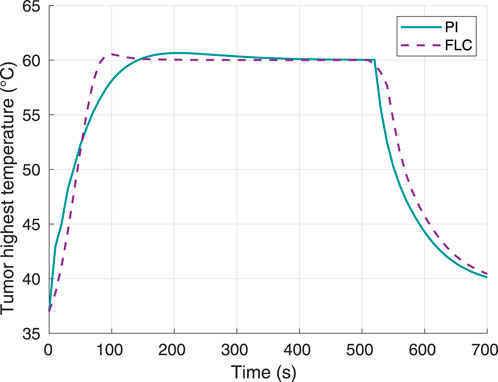
Figure 3. Tumor highest temperature, using 60°C as desired hyperthermia temperature. Obtained from simulations.
Figure 4 shows the highest temperature responses in the healthy tissue. None of the controllers caused this temperature to reach the maximum setpoint of 46°C. The maximum temperature obtained was virtually the same for both controllers: 43.77°C for the FLC and 43.75°C for the PI controller. Thus, the control system allowed to keep the thermal damage to the surrounding tissue below 1%.
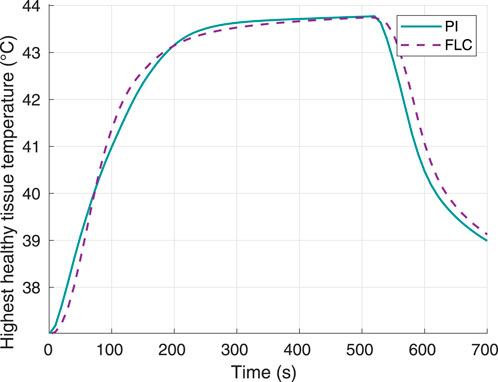
Figure 4. Surrounding healthy tissue temperature, using 60°C as desired hyperthermia temperature. Obtained from simulations.
The laser power output when using each of the controllers was measured and plotted as shown in Figure 5. The FLC generated a smoother response in the laser power, and the maximum power peak around 1.4 W was well below the maximum set limit of 4 W. On the other hand, the PI controller had a lower overshoot but higher oscillation in the laser power, with a peak power close to 1 W.
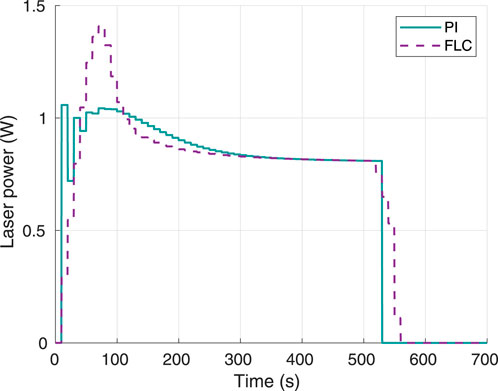
Figure 5. Instant laser power, using 60°C as desired hyperthermia temperature. Obtained from simulations.
To validate obtained results, a second experiment was conducted where the desired hyperthermia temperature was set to 70°C. Tumor thermal damage responses for both controllers are shown in Figure 6. For this scenario, the times to achieve 100% tumor thermal damage for the FL and PI controllers were 180 s and 190 s, respectively.
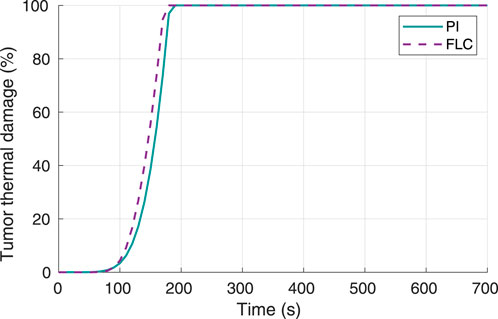
Figure 6. Tumor thermal damage percentage, using 70°C as desired hyperthermia temperature. Obtained from simulations.
The hyperthermia temperature response was plotted (Figure 7) to verify the tracking ability of the controller with respect to the setpoint of 70°C. The settling time to within 2% band was approximately 90 s for the FLC and 140 s for the PI controller. In this case, the times required to reach 100% tumor damage were 190 s and 180 s for the PI and FL controllers, respectively. Furthermore, the maximum overshoot was 0.79°C for the FLC and 0.91°C for the PI controller.
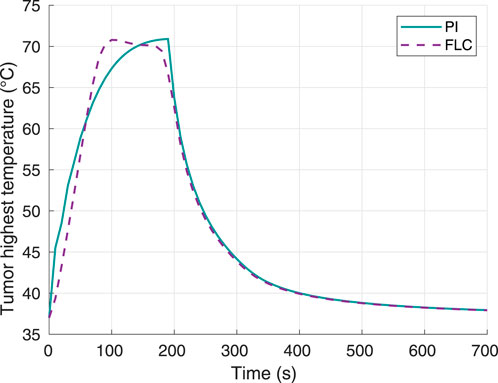
Figure 7. Tumor highest temperature, using 70°C as desired hyperthermia temperature. Obtained from simulations.
Figure 8 shows the highest temperature responses in healthy tissue. The curves for both controllers are comparable, and the highest temperature value reached was 46.12°C for the FLC and 46.27°C for the PI controller. With these data, thermal damage of healthy tissue was calculated using Eqs. 5, 6. The maximum thermal damage in the healthy tissue was 0.0580% and 0.0581% for the FL and PI controllers, respectively.
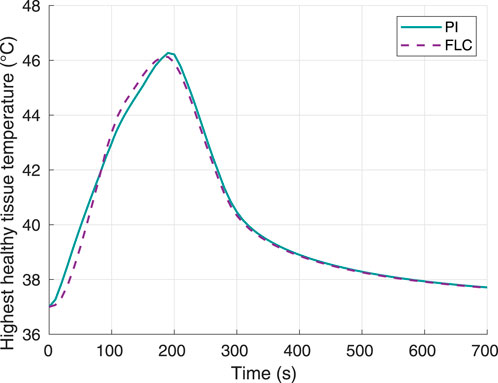
Figure 8. Surrounding healthy tissue temperature, using 70°C as desired hyperthermia temperature. Obtained from simulations.
The laser power response using 70°C as the temperature setpoint is shown in Figure 9. Again, both controllers required a laser power well below the maximum limit of 4 W, with the FLC having a higher overshoot around 1.95 W, and the PI having higher power oscillations around an operating point of approximately 1.5 W. Both controllers required approximately 0.5 W more than the power required for the 60°C setpoint case (Figure 5).
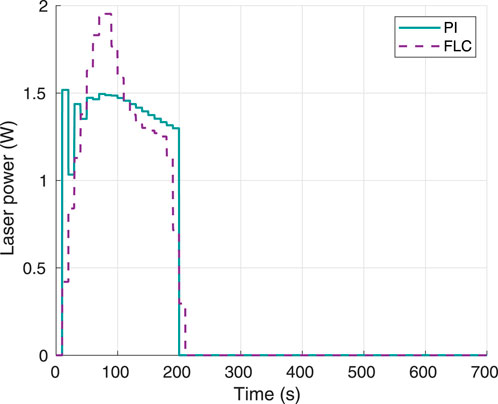
Figure 9. Instant laser power, using 70°C as desired hyperthermia temperature. Obtained from simulations.
4 Discussion
The results in Figure 2, Figure 6 show that both controllers were successful in maximizing thermal damage in the target tumor, which reached 100% in all four experiments (two controllers with two different temperature setpoints). Both types of controllers were comparable in terms of performance. While the PI was faster than the FLC to achieve complete thermal damage when using a 60°C setpoint (Figure 2), the FLC was faster when using a 70°C setpoint. For both controllers, the time required to complete tumor damage was considerably lower when defining a setpoint of 70°C, as expected. This can be explained by the concept of critical temperature, defined as the temperature at which the thermal damage rate is equal to 1, and it is unique for each tissue. For operating temperatures above the critical temperature value, the thermal damage slope increases exponentially. The tumor modeled in this study had a critical temperature value of approximately 54.61°C (Pearce, 2018); thus, any increase in the maximum temperature limit beyond the critical temperature will highly increase the therapy speed. In terms of hyperthermia temperature reference tracking, the FLC controller was faster to achieve the maximum target temperature. As shown in Figure 7, in the second experiment the PI controller was not able to get the tumor maximum temperature to a stationary value before complete thermal damage was achieved and the laser was turned off. Despite this fact, both controllers successfully reached the 100% tumor damage with a negligible time difference.
In addition to achieving maximum thermal damage, both controllers had the goal of keeping thermal damage of healthy surrounding tissue to a minimum. Both the FLC and the PI were able to keep the healthy tissue damage below 1% for all the studied scenarios. This result can also be explained by looking at the critical temperature. Even if the healthy tissue reaches temperatures around or slightly above 46°C, the time exposure required to induce damage at this temperature range is much higher than the total duration of the therapy. Having an estimation of the critical temperature of the surrounding healthy tissue, can help define the safety limits such as
It was also observed that thermal damage of healthy tissue was smaller when using a higher hyperthermia setpoint in the tumor of 70°C (as opposed to 60°C). This can be explained by the decrease in laser exposure time to the overall tissue. By allowing to achieve a 100% thermal damage faster at the tumor, the healthy tissue experiences lower laser exposure and collateral damage. The total therapy time was approximately three times shorter in the second simulation (70°C setpoint) according to the data collected. Therefore, results confirm that damage to healthy tissue close to the target tumor not only depends on temperature, but also on the exposure time, which is proportional to the therapy duration. This finding can be taken into account by physicians when choosing the target hyperthermia temperature for a particular condition.
Lastly, the behavior of the controller output was also collected and analyzed (Figures 5, 9) to verify whether any saturation was present, based on the established hard limit of 4 W. No saturation or sharp response was seen for any of the controllers in the conducted experiments for any of the temperature setpoints.
Depending on the temperature setpoint and type of controller used, the laser power behavior over time will be different. In this study, only a maximum laser power value limit was imposed. However, in an experimental setting, the characteristics of the specific laser model, such as the laser power resolution and slew rate, must be considered as a limitation to the capabilities of each controller. For example, certain CW lasers may only be turned on or off, with the controller output being restricted to either 0% or 100% laser power. Nevertheless, such kind of lasers can still benefit from the closed loop damage-tracking control system presented in this work, with minimal modifications, for example using a pulse-width modulated output stage. Other lasers may allow to vary the power continuously but require a minimum power (higher than 0%) or have restrictions as to how fast these changes can occur. A slow laser may not be able to follow the tuning signal coming from a fast-varying controller, thus acting as a low pass filter in terms of the desired laser power time response. These limitations can also be overcome by limiting the amplitude and slew rate of the controller output, based on the specifications of the laser model.
In summary, both controllers successfully provided damage-tracking control of the photothermal therapy procedure. The slight differences in performance were negligible; thus, the choice of controller can be based on other factors such as versatility, ease of design, and ease of operation. While PIDs are traditionally used controllers in thermal processes, the complexity of photothermal therapy can benefit from the versatility that the FLC provides. The FLC shown in this work would allow clinicians to set restrictions such as maximum damage permitted in the healthy tissue regions, minimum and maximum temperature limits, among others. On the other hand, although the PID is a SISO system, a MIMO (multiple input, multiple output) could be designed by pairing different PIDs together, thus providing more versatility.
The results presented are valid for the implemented tissue model and the following assumptions are required for the proposed system: a superficial tumor where laser light can reach with sufficient power density; the presence of tumor-specific contrast agents that enhance the thermal dose at the tumor, but also allow to identify the tumor vs healthy regions; last, the availability of a reliable real-time temperature measurement system is critical so that the thermal damage can be calculated adequately.
Depending on the tissue model, the simulations used to validate the implemented control system could be designed using various thermal models, such as dual-phase-lag models (Kumar et al., 2016), porous media-based models (Tucci et al., 2021), or the Pennes model used in this study. However, the slight variations among different models would not change the conclusions of this study, which shows the possibility of controlling photothermal therapy procedures via damage-tracking control systems.
Furthermore, the proposed controllers might need additional optimizations prior to use in real-life clinical scenarios. Because of the inherent risks of any medical procedure, this tool is expected to be used as an aid to physicians during photothermal therapy, rather than entirely substituting the need for supervision by medical personnel.
5 Conclusion
A closed-loop damage-tracking system for photothermal therapy was demonstrated in silico. The system consisted of an external temperature-tracking system, a real-time thermal damage calculation, a fuzzy logic or a PI controller, and a continuous wave laser. The entire system was able to control the photothermal therapy procedure by attaining 100% thermal damage in the tumor while keeping damage to healthy tissue below 1%. Future work will focus on testing this approach with different tissue models, both created with simulations and using tissue-mimicking phantoms.
Data availability statement
The raw data supporting the conclusion of this article will be made available by the authors, without undue reservation.
Author contributions
MC and DD conceived the study. MC designed the simulations and generated the preliminary results. CW generated additional results. DD supervised the project. All authors analyzed the data, discussed the results, and contributed to the final manuscript.
Funding
This work was supported by the University of Costa Rica under grants C0232 and C1464.
Conflict of interest
The authors declare that the research was conducted in the absence of any commercial or financial relationships that could be construed as a potential conflict of interest.
Publisher’s note
All claims expressed in this article are solely those of the authors and do not necessarily represent those of their affiliated organizations, or those of the publisher, the editors and the reviewers. Any product that may be evaluated in this article, or claim that may be made by its manufacturer, is not guaranteed or endorsed by the publisher.
References
Aliannezhadi, M., Minbashi, M., and Tuchin, V. V. (2018). Effect of laser intensity and exposure time on photothermal therapy with nanoparticles heated by a 793-nm diode laser and tissue optical clearing. Quantum Electron. 48 (6), 559. doi:10.1070/QEL16505
Bashkatov, A. N., Genina, E. A., and Tuchin, V. V. (2011). Optical properties of skin, subcutaneous, and muscle tissues: A review. J. Innov. Opt. Health Sci. 4 (1), 9–38. doi:10.1142/s1793545811001319
Chen, W. R., Adams, R. L., Heaton, S., Dickey, D. T., Bartels, K. E., and Nordquist, R. E. (1995). Chromophore-enhanced laser-tumor tissue photothermal interaction using an 808-nm diode laser. Cancer Lett. 88 (1), 15–19. doi:10.1016/0304-3835(94)03609-M
Deng, X., Shao, Z., and Zhao, Y. (2021). Solutions to the drawbacks of photothermal and photodynamic cancer therapy. Adv. Sci. (Weinh). 8, 2002504. doi:10.1002/advs.202002504
Drizdal, T., Togni, P., Visek, L., and Vrba, J. (2010). Comparison of constant and temperature dependent blood perfusion in temperature prediction for superficial hyperthermia. Radioengineering 19 (2), 281–289.
Ferlay, J., Colombet, M., Soerjomataram, I., Parkin, D. M., Pineros, M., Znaor, A., et al. (2021). Cancer statistics for the year 2020: An overview. Int. J. Cancer 149 (4), 778–789. doi:10.1002/ijc.33588
Ferrás, L. L., Ford, N. J., Morgado, M. L., Nobrega, J. M., and Rebelo, M. S. (2015). Fractional Pennes’ bioheat equation: Theoretical and numerical studies. Fract. Calc. Appl. Anal. 18 (4), 1080–1106. doi:10.1515/fca-2015-0062
Haghniaz, R., Umrani, R. D., and Paknikar, K. M. (2015). Temperature-dependent and time-dependent effects of hyperthermia mediated by dextran-coated La0. 7Sr0. 3MnO3: in vitro studies. Int. J. Nanomedicine 10, 1609. doi:10.2147/IJN.S78167
Henriques, F. C. (1947). Studies of thermal injury; the predictability and the significance of thermally induced rate processes leading to irreversible epidermal injury. Arch. Pathol. 43 (5), 489–502.
Hong, H., Jo, Y., Choi, Y., Park, H., and Kim, B. (2009). “An optical system to measure the thickness of the subcutaneous adipose tissue layer,” in Sensors, 2009 IEEE, Christchurch, New Zealand, 25-28 October 2009 (IEEE), 695–698. doi:10.1109/ICSENS.2009.5398349
Jacques, S. L. (2013). Corrigendum: Optical properties of biological tissues: A review. Phys. Med. Biol. 58 (11), 5007–5008. doi:10.1088/0031-9155/58/14/5007
Jasiński, M. (2015). Modelling of thermal damage process in soft tissue subjected to laser irradiation. J. Appl. Math. Comput. Mech. 14 (4), 29–41. doi:10.17512/jamcm.2018.2.03
Kumar, D., Singh, S., and Rai, K. N. (2016). Analysis of classical Fourier, SPL and DPL heat transfer model in biological tissues in presence of metabolic and external heat source. Heat. Mass Transf. 52 (6), 1089–1107. doi:10.1007/s00231-015-1617-0
Kutanzi, K. R., Lumen, A., Koturbash, I., and Miousse, I. (2016). Pediatric exposures to ionizing radiation: Carcinogenic considerations. Int. J. Environ. Res. Public Health 13 (11), 1057. doi:10.3390/ijerph13111057
Lang, J., Erdmann, B., and Seebass, M. (1999). Impact of nonlinear heat transfer on temperature control in regional hyperthermia. IEEE Trans. Biomed. Eng. 46 (9), 1129–1138. doi:10.1109/10.784145
Leino, A. A., Pulkkinen, A., and Tarvainen, T. (2019). ValoMC: A Monte Carlo software and MATLAB toolbox for simulating light transport in biological tissue. OSA Contin. 2 (3), 957–972. doi:10.1364/osac.2.000957
MathWorks (2022). PID tuning algorithm for linear plant model. Available at: https://www.mathworks.com/help/control/ref/lti.pidtune.html (Accessed June 9, 2022).
Mechelli, F., Arendt-Nielsen, L., Stokes, M., and Agyapong-Badu, S. (2020). Ultrasound imaging for measuring muscle and subcutaneous fat tissue thickness of the anterior thigh: A 2 year longitudinal study in middle age. JCSM Clin. Rep. 5 (1), 3–7. doi:10.1002/crt2.7
National Institute of Cancer (2022). Treating a cancer of unknown primary. Available at: https://www.cancer.org/cancer/cancer-unknown-primary/treating.html (Accessed June 21, 2022).
Nguyen, T. H., Park, S., Hlaing, K. K., and Kang, H. W. (2016). Temperature feedback-controlled photothermal treatment with diffusing applicator: Theoretical and experimental evaluations. Biomed. Opt. Express 7 (5), 1932–1947. doi:10.1364/BOE.7.001932
Paruch, M. (2020). Mathematical modeling of breast tumor destruction using fast heating during radiofrequency ablation. Materials 13 (1), 136. doi:10.3390/ma13010136
Pearce, J. (2018). Irreversible tissue thermal alterations: Skin burns, thermal damage and cell death. Theory Appl. Heat Transf. Humans 2, 553–590. doi:10.1002/9781119127420.ch26
Pennes, H. (1948). Analysis of Tissue and arterial blood Temperatures in the resting human forearm. J. Appl. Physiology 1 (2), 93–122. doi:10.1152/jappl.1948.1.2.93
Prahl, S. A. (1988). Light transport in tissue. Available at: https://omlc.org/∼prahl/pubs/pdf/prahl88.pdf (Accessed June 22, 2022).
Prahl, S. (2017). Light absorption by water. Available at: https://omlc.org/spectra/water/(Accessed June 22, 2022).
Prahl, S. (1999). Optical absorption of hemoglobin. Available at: https://omlc.org/spectra/hemoglobin/(Accessed June 22, 2022).
Ren, Y., Qi, H., Chen, Q., and Ruan, L. (2017). Thermal dosage investigation for optimal temperature distribution in gold nanoparticle enhanced photothermal therapy. Int. J. Heat Mass Transf. 106, 212–221. doi:10.1016/j.ijheatmasstransfer.2016.10.067
Shah, J., Aglyamov, S. R., Sokolov, K., Milner, T. E., and Emelianov, S. Y. (2008a). Ultrasound imaging to monitor photothermal therapy – feasibility study. Opt. Express 16 (6), 3776–4331. doi:10.1364/oe.16.003776
Shah, J., Park, S., Aglyamov, S., Larson, T., and Sokolov, K. (2008b). Photoacoustic imaging and temperature measurement for photothermal cancer therapy. J. Biomed. Opt. 13 (3), 034024. doi:10.1117/1.2940362
Soni, S., Tyagi, H., Taylor, R. A., and Kumar, A. (2015). The influence of tumour blood perfusion variability on thermal damage during nanoparticle-assisted thermal therapy. Int. J. Hyperth. 31 (6), 615–625. doi:10.3109/02656736.2015.1040470
Tenorio, M. C., and Dumani, D. S. (2021). “Modeling thermometry image perturbations during photoacoustic imaging-guided photothermal therapy,” in 2021 IEEE UFFC Latin America Ultrasonics Symposium (LAUS), Gainesville, FL, USA, 04-05 October 2021 (IEEE). doi:10.1109/laus53676.2021.9639142
Tucci, C., Trujillo, M., Berjano, E., Iasiello, M., Andreozzi, A., and Vanoli, G. P. (2021). Pennes’ bioheat equation vs. porous media approach in computer modeling of radiofrequency tumor ablation. Sci. Rep. 11 (1), 5272–5313. doi:10.1038/s41598-021-84546-6
Wilson, S. B., and Spence, V. A. (1988). A tissue heat transfer model for relating dynamic skin temperature changes to physiological parameters. Phys. Med. Biol. 33 (8), 895–912. doi:10.1088/0031-9155/33/8/001
Yarmolenko, P. S., Moon, E. J., Landon, C., Manzoor, A., Hochman, D. W., Viglianti, B. L., et al. (2011). Thresholds for thermal damage to normal tissues: An update. Int. J. Hyperth. 27 (4), 320–343. doi:10.3109/02656736.2010.534527
Zhao, L. (2021). Recent advances in selective photothermal therapy of tumor. J. Nanobiotechnology 19 (1), 1–15. doi:10.1186/s12951-021-01080-3
Keywords: photothermal therapy, image-guided therapy, hyperthermia, thermometry, biomedical system modeling, fuzzy logic, PID controller, control system
Citation: Céspedes Tenorio M, Wattson Sánchez CA and Dumani DS (2022) Tissue damage-tracking control system for image-guided photothermal therapy of cancer. Front. Therm. Eng. 2:1005117. doi: 10.3389/fther.2022.1005117
Received: 27 July 2022; Accepted: 10 October 2022;
Published: 01 November 2022.
Edited by:
Yatao Ren, Harbin Institute of Technology, ChinaReviewed by:
Mehran Minbashi, Tarbiat Modares University, IranXuelan Zhang, University of Science and Technology Beijing, China
Shuangcheng Sun, Chongqing University, China
Copyright © 2022 Céspedes Tenorio, Wattson Sánchez and Dumani. This is an open-access article distributed under the terms of the Creative Commons Attribution License (CC BY). The use, distribution or reproduction in other forums is permitted, provided the original author(s) and the copyright owner(s) are credited and that the original publication in this journal is cited, in accordance with accepted academic practice. No use, distribution or reproduction is permitted which does not comply with these terms.
*Correspondence: Diego S. Dumani, ZGllZ28uZHVtYW5pQHVjci5hYy5jcg==