 Peimiao Li1
 Hui Wang
- 1School of Aeronautics, Northwestern Polytechnical University, Xi’ an, China
- 2Unmanned System Research Institute, Northwestern Polytechnical University, Xi’ an, China
Aiming to study the electrical characteristics of photovoltaic cells during the flight of solar-powered unmanned aerial vehicles, this work combines a photovoltaic cell equivalent circuit model and a thermodynamic model. The influence of wing surface temperature and its influencing factor-solar radiation is of primary concern. A solar radiation model is established to explore the impact of solar irradiance on temperature and photovoltaic cell output. Atmospheric temperature and four basic parameters of photovoltaic cell, including open-circuit voltage, short-circuit current, voltage, and current at maximum power point under standard conditions are treated as input parameters. The surface temperature, the variation of output voltage, current, and power are studied with the altitude changing from 0 to 35 km and time from 0 to 24 h in spring equinoxes. Results find that with the increase in altitude, the surface temperature of the photovoltaic cell decreases first and then increases. The voltage of the photovoltaic cell decreases as the temperature increases, and the voltage-time curve varies at altitudes below 25 km and above 30 km. The peak power is available at an altitude between 15 and 20 km. The above findings can be applied to study energy generations and flows of solar-powered vehicles.
Introduction
Solar-powered unmanned aerial vehicles (UAVs) are a kind of electric aircraft that uses optical energy as their only source of power (Ma et al., 2020). Due to their advantages, solar-powered UAVs are gradually attracting the attention of aviation workers in such availability, reliability, and environmentally friendly characteristic (Khatib et al., 2012). High-altitude long-endurance solar-powered aircraft can be used for high altitude communication, border surveillance, power transmission line construction, and forest firefighting (Barbosa et al., 2014; Ni et al., 2021). As a significant part of the solar-powered UAV, the photovoltaic (PV) cell converts a portion of the solar energy into electricity and ensures the use of energy in aircraft (Wang and Chen, 2021). However, it has been documented that the power conversion of PV cells is inefficient, about 0.3–0.4 (Solangi et al., 2011). Most of the energy it absorbs is dissipated as heat, which is one of the critical technologies that hinder the development of solar-powered UAVs (Rawa et al., 2022; Wang et al., 2022). When aircraft fly, reducing unnecessary energy waste on the premise of the existing PV cell is crucial. It is worth investigating the value of power, the energy conversion efficiency of PV cells, and the other electrical characteristics. Furthermore, enabling PV cells to operate with efficiencies.
The output electrical characteristics of photovoltaic cells mentioned include power, current, and voltage, especially the voltage and current at the maximum power point, open-circuit voltage, and short-circuit current. Since the energy of photovoltaic cells is obtained from the external environment, these output characteristics are closely related to environmental conditions, such as the value of solar irradiance, environmental temperature, the flight altitude of the aircraft, atmospheric mass, and even atmospheric density (Ouédraogo et al., 2021). To better estimate the output characteristics of PV cells under different environmental conditions, it is necessary to consider the changes of various circumstance parameters at different times and altitudes comprehensively, particularly the main influencing factors.
Solar radiation and temperature are two factors that need paying attention to (Ouédraogo et al., 2021). Studies on the relationship between the two factors and the output of PV cells have been done for years. To simulate solar energy at different altitudes, Bernhard, (2000) designed a mathematical model suitable for future automatic calculation programs for all basic aircraft systems and environmental conditions. The existing solar power generation model was coordinated and combined. However, the impact of temperature on the PV cell was not considered. Gao et al. (2021) discussed in detail a simplified equivalent circuit model and its output characteristics of PV cells changing with solar radiation. However, as solar radiation can not only directly affect the output of PV cells but also indirectly affect the output by affecting surface temperature, temperature influence on the output characteristics is lack consideration. To study the temperature change of aircraft during flight, Haws and Bowman, (1999) proposed a thermodynamic model of the wing surface. By establishing an adiabatic model and thermodynamic equation, the influence of thermal radiation, thermal convection, and heat conduction on wing temperature was comprehensively considered, and the temperature of the wing surface was analyzed. Chang et al. (2013) established the power characteristics model of PV cells on the wing of solar-powered UAVs operating from sea level to the stratosphere. Based on the linear relationship between energy conversion efficiency and surface temperature, the power characteristics of PV cell is focused on. Although the above studies have breakthroughs in certain aspects, there is still a lack of a complete and systematic description of the output characteristics and their influencing factors of PV cells on the wing of solar-powered aircraft.
This study aims at studying the influence of temperature and solar irradiance on the output of the PV cell when the aircraft is flying at various altitudes and time conditions. A solar radiation model is established for the issue that solar radiation varies with time and elevation. Considering the influence of thermal radiation, heat convection, and solar radiation on the PV cell, a simplified PV cell equivalent circuit model combining a thermodynamic model is applied. Eventually, surface temperature, conversion efficiency, peak power, voltage, and current at the maximum power point were studied at different altitudes and times.
Model Description
When the PV cell installed on the solar-powered UAV comes to work, it converts some of the solar radiation perpendiculars to the surface into electricity and the rest into heat. In this progress, the temperature of the PV cell increases, thus affecting the conversion efficiency and output characteristics. As altitude and time change, the solar radiation and atmosphere temperature change as well, which also have a critical influence on the PV cell.
Solar Radiation Model
The solar irradiance can be affected by the longitude and latitude of aircraft, the distance between the earth and the PV cell, flight date, and clock time. When the solar radiation passes through the atmosphere, the scattering and attenuation of the solar radiation from atmospheric conditions will also affect the solar irradiance received by the photovoltaic cell.
Solar radiation received by the photovoltaic cell can be divided into direct radiation and scattered radiation, which is given by Eq. 1:
where Stotal is the total radiation. Sbeam is direct radiation, which is solar radiation that reaches the earth without changing direction. Sdiffuse is scattered radiation, which refers to the solar radiation scattered by the atmosphere and eventually reaches the ground.
Direct radiation can be calculated by Eq. 2 (Ouédraogo et al., 2021):
where Gsc stands for the solar constant, which is 1357 W/m2; cs is a constant, valued at 0.357; h is the elevation of an aircraft; hs and hb are height constants, which are 7000 m and 40000 m, respectively; nd stands for the day of the year; αdep represents depression angle, which is a correction of solar elevation angle; Ss is a constant, valued at 0.678; Son stands for the solar radiation outside the atmosphere, which is relevant to the distance between the earth and the PV cell; RE is the earth radius measured at 45° North latitude, valued at 6356.8 km; αs stands for the solar elevation angle.
In the low-humidity cloudless air, the scattered radiation accounts for a small proportion, only accounting for 8% of the direct radiation, and has little influence on the overall calculation. Therefore, assuming that the angle and magnitude of the scattered radiation are the same in all directions. (Ouédraogo et al., 2021). The scattered radiation can be calculated by:
From the equations above, we can get the value of total solar radiation in a unit area at different altitudes, latitudes, and longitudes at various clock times.
Only the component of solar radiation in the normal direction of the photovoltaic cell can be absorbed by the PV cell, the direction of direct radiation is needed. Figure 1 shows angles among the sun, PV cell, and ground coordinate system. The vectors shown in the figure are all unit vectors.
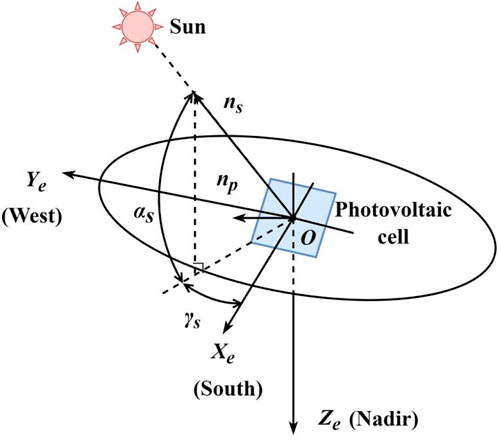
Figure 1. Angles between the sun, PV cell and ground coordinate system.
According to the geometric relationship in Figure 1, the unit vector of solar radiation can be expressed in the ground coordinate system by:
where γs stands for the solar azimuth angle. Both the solar elevation angle and the solar azimuth angle can be derived from latitude, flight date, and clock time.
To accurately calculate the solar radiation received by the PV cell, the influence of attitude angle needs to be considered. A body axis system is established in this work. Supposing the photovoltaic cell is attached closely to the wing, the solar radiation that the PV cell receives can be acquired according to the transformation of the ground coordinate system and the body axis system. Figure 2 shows the relationship between arbitrary coordinate system Ox1y1z1 to Ox2y2z2.
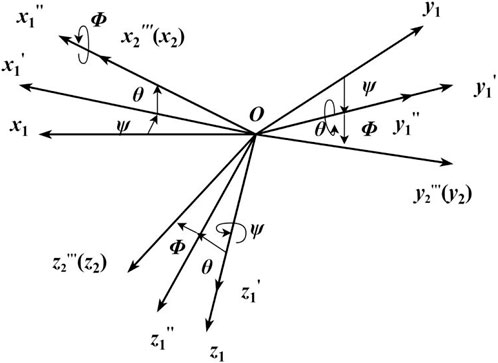
Figure 2. Transformation from arbitrary coordinate system Ox1y1z1 to Ox2y2z2.
The transformation matrix between two coordinate systems can be expressed by:
where e represents the ground coordinate system, and b represents the body coordinate system.
The angle χ between the vector of the direct solar radiation ns and the normal vector of the PV cell np can be calculated by:
where nb is a unit vector parallel to the z-axis of the body axis system, and it can be represented in the body axis system by:
Solar radiation received by PV cell at unit area treated as Spv can be calculated by:
The solar radiation model is established.
Equivalent Circuit Model of Photovoltaic Cell
PV cell manufacturers generally provide users with short-circuit parameters, open-circuit parameters, and the maximum power point parameters measured under standard conditions (atmospheric quality valued at 1.5, solar radiation valued at 1000 W/m2, temperature valued at 298.15 K). Under standard conditions, values of the short-circuit current Iscref, open-circuit voltage Vocref, the maximum power point current Imref, and the maximum power point voltage Vmref are available when the PV cell output power reaches the maximum value.
To facilitate engineering calculation, a simplified equivalent circuit model of PV cell was established by Eq. 9 by using the above four parameters. The output of characteristics under arbitrary environmental conditions is approximated by introducing corresponding compensation coefficients (Liu et al., 2016; Gao et al., 2021).
where Vpv and Ipv are the output voltage and output current of the PV cell, respectively; Iscpv and Vocpv are the short-circuit current and open-circuit voltage, respectively, Impv and Vmpv are the current and voltage when the battery output power reaches the maximum under any condition, respectively, and can be expressed by (Liu et al., 2016; Gao et al., 2021):
where Spv is the solar radiation received by the PV cell per unit area, affected by the longitude and latitude, time, altitude, and other parameters; Sref is the solar radiation under the standard condition, valued as 1000 W/m2; ΔT is the difference between the actual temperature of the PV cell and the reference temperature of the PV cell (Tref = 298.15 K), which can be expressed by ΔT = T - Tref. ΔS is the difference between the actual solar irradiance incident on the PV cell and the solar radiation under standard condition Sref, which can be calculated by ΔS = S - Sref; e = 2.71838; a1, a2, a3 are the compensation coefficients, which are obtained by fitting a large amount of experimental data, and their typical values are shown by:
As one of the crucial parameters of the PV cell, the power conversion efficiency is defined as the ratio of the electrical energy generated to the solar radiation incident on the cell. Suppose the above calculation is about the electrical characteristics of the PV cell per unit area. With the usage of short-circuit parameters, open-circuit parameters, the power conversion efficiency of PV cell ηpv can be calculated by (Singh et al., 2021):
where FF is the fill factor, which is calculated by:
In this work, the maximum power can be obtained directly from the maximum power point parameters under standard conditions expressed by:
The equivalent circuit model of PV cell is established.
Thermodynamic Model of Airfoil Surface
The energy conversion efficiency of PV cell ηpv varies with temperature (Durisch et al., 1996; Scheiman et al., 1996; Baur et al., 2017). Thus, it is vital to pay attention to the temperature of the airfoil surface, and a thermodynamic model is needed as illustrated in Figure 3.
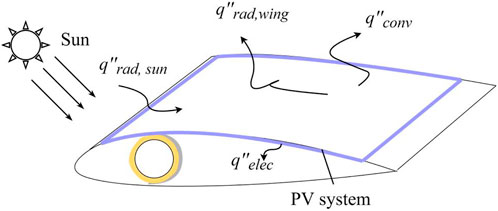
Figure 3. Thermodynamic model of airfoil surface.
The model is described using a simple balance of energy. The low conductance of air in the wing, the temperature difference between the top surface and the bottom surface, which prevents free convection from taking place, as well as the less connection between the top surface and the bottom surface lead to an adiabatic boundary condition on the bottom of the top surface (Haws and Bowman, 1999; Chang et al., 2013). The energy flow on the top surface involves the radiation of the external circumstances (mainly the sun) to the wing
Where Ein represents the rate of energy flowing into the model; Eout represents the rate of energy flowing out of the model; Eheat represents the rate of energy that causes temperature change; ρpv is the density of the PV panel in kg/m2; (cp)pv is the specific heat for the PV panel.
The difference between the radiation of the external circumstances to the wing and the electricity generated can be described by:
where αpv is the absorptivity of PV cell. According to the Eqs 17 and 18, an increase in solar radiation causes an increase in
The sum of the radiation from the wing to the external circumstances and the heat convection between the wing and the external circumstances can be described by:
where εpv is the emissivity of PV cell; σ is the Stefan-Boltzmann constant, valued
Nusselt number represents the intensity of convection and is the ratio of heat conduction resistance to convection heat transfer resistance. It contains free convection and forced convection, which can be expressed by Eq. 20 and 21, respectively (Chang et al., 2013):
where Ra represents the Rayleigh number; Pr represents the Prandtl number; Re represents the Reynolds number; Rex represents the local Reynolds number. These four dimensionless quantities can be expressed by:
where ρ is the atmosphere density; μ is the dynamic viscosity of the atmosphere; (cp)atm is the specific heat for the atmosphere; V is the velocity of the fluid relative to the wing; rlam is the ratio of laminar flow.
The total Nusselt number can be expressed by:
When the model is in a balance of energy, dTsur/dt = 0, an iterative method can be used to solve Eq. 17. The iterative function can be expressed by:
The iterative formula can be expressed by:
The flow chart for calculating surface temperature is shown in Figure 4.
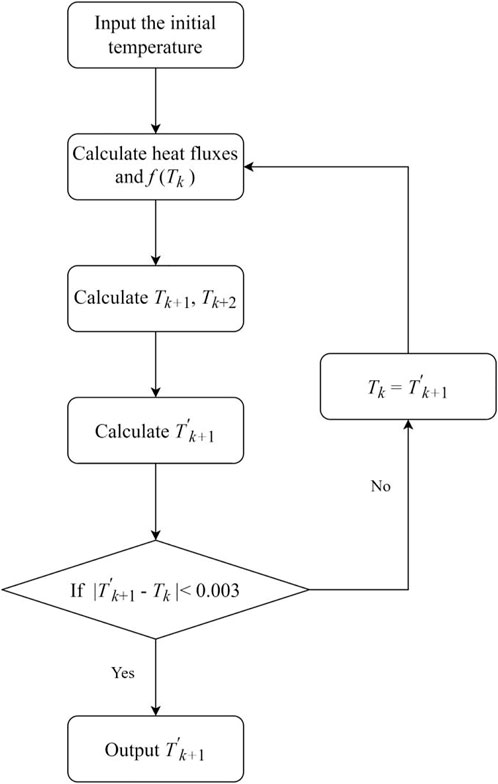
Figure 4. Flow chart for calculating surface temperature.
The thermodynamic model of airfoil surface is established.
Output Characteristic Analysis of PV Cell
Performance Evaluation
To verify the acceptability and feasibility of the model, a performance evaluation is launched, and the results are compared with the previous experiment conducted by Das et al. (2019). As shown in Figure 5, the black curve represents the data calculated by models in this paper, and the red curve represents the experimental data carried out in September. It can be seen from the results that the calculated solar irradiance and temperature curves are smoother than those of the experimental results. The calculated data of surface temperature is slightly smaller than the experimental one, with a maximum error of 5.8 K at 15.5 h.
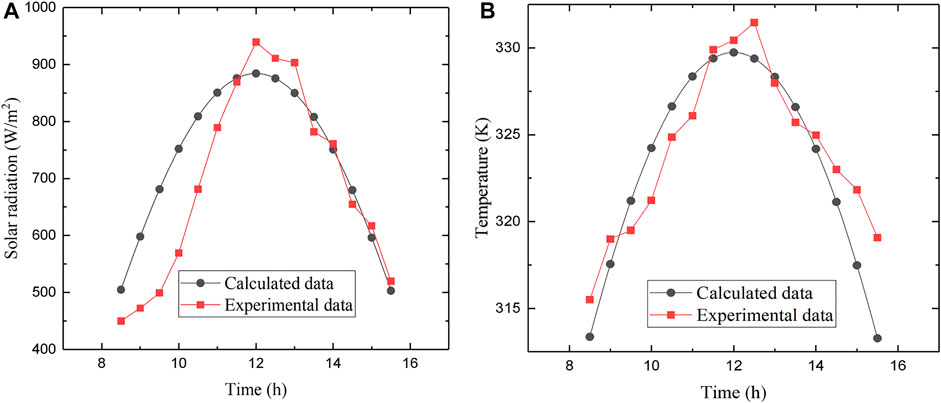
Figure 5. Comparison of calculated data with experimental data. (A) Solar radiation variation. (B) Surface temperature variation
Parameters Setting
The parameters related to models are displayed in Tables 1–3, respectively. Values of k, Tatm, ρ, and μ are available in the atmosphere database.
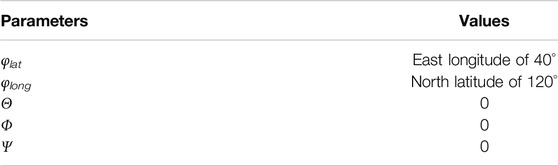
Table 1. Parameters related to solar radiation model.
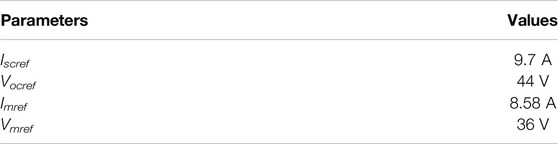
Table 2. Parameters related to equivalent circuit model.
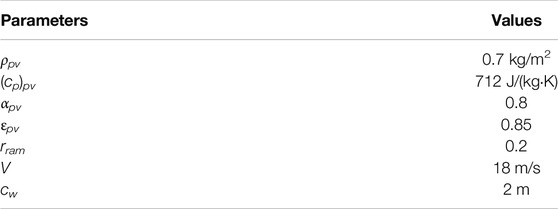
Table 3. Parameters related to thermodynamic model of airfoil surface.
Results and Discussion
The influence of solar irradiance on the output of the PV cell has been reflected in many works (Liu et al., 2016; Gao et al., 2021). To prove the influence of temperature on the output of the PV cell, this work first compares the output results of the PV cell with and without the thermodynamic model under the same solar radiation. Results show that compared with taking atmospheric temperature as the actual temperature of the photovoltaic cell, the output of the photovoltaic cell is different when considering the influence of thermal effect (including thermal radiation, thermal convection, and the like.) on temperature. As shown in Figures 6A,B, at standard solar radiation and an altitude of 15 km, after including thermal effects, the overall characteristic curve of the PV cell moves forward, the open-circuit voltage decreases by 6.0 V, while the short-circuit current rises by 1.1 A, and the maximum power point moves forward and peak power increases by 6.6 W.
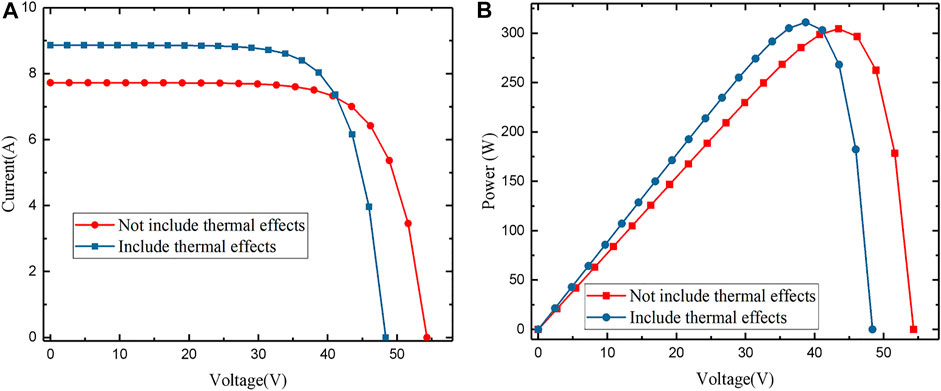
Figure 6. Comparing conditions of including thermal effects with that not including thermal effects. (A) Current-voltage curves. (B) Power-voltage curves
To more accurately study the working situation of the PV cell during the flight condition, the output electrical characteristics and surface temperature characteristics of the PV cell at different altitudes and clock times under the condition of considering the thermal effect of the PV cell are studied. Considering the actual situation, this work only studies the voltage, current, and power at the maximum power point. nd is set to 80, which is near the vernal equinox.
The variation of solar radiation at different times and altitudes is shown in Figure 7. At a single altitude, the solar radiation rises first and then decreases with the change of time in a day. The solar radiation received by the PV cell reaches the peak value at about 12.2 h. The reason is that, with the change of time, the angle between the vector parallels the direction of solar radiation and the aircraft body coordinate system gradually changes. At the same time, with the increase in altitude, solar radiation gradually increases. When the altitude is more than 15 km, the solar radiation changes slowly. The difference between 20 and 35 km at 12.2 h is only 13 W/m2, while the difference between 5 and 20 km at 12.2 h is 100.8 W/m2. Because the higher the altitude is, the thinner the atmosphere is, and the attenuation effect of the atmosphere on solar radiation is weakened.
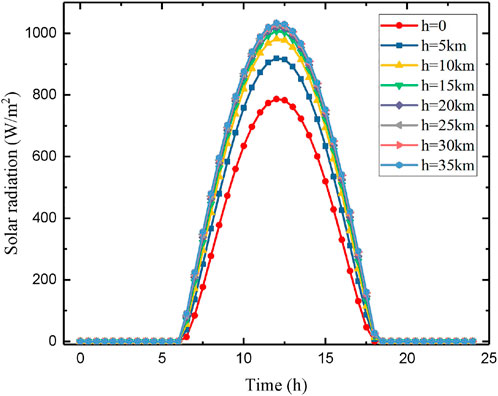
Figure 7. The variation of solar radiation at different times and altitudes.
The variation of surface temperature at different times and altitudes is shown in Figure 8. At the same altitude, the surface temperature of the PV cell is the highest at about 12.2 h. When the altitude is 15 km, the surface temperature is 255.2 K at 12.2 h. The reason is that the solar radiation is higher at this time, which leads to high thermal radiation from the sun to the PV cell. When the solar radiation is 0 at night, the surface temperature of the PV cell returns to the atmospheric temperature, and the surface temperature is 216.7 K when the altitude is 15 km. The difference between the maximum temperature and the minimum temperature is 38.5 K. At the same time, with the increase of altitude, the surface temperature of the PV cell decreases first and then increases after 10 km between 7.7 and 16.6 h due to the influence of ambient atmospheric temperature and thermal convection. It is worth noting that the maximum temperature difference between day and night of the PV cell also rises with the increase in altitude. The maximum temperature difference is 8.0 K at the horizontal altitude, while the maximum temperature difference between day and night can reach 87.1 K at 35 km. At altitudes above 20 km, the temperature at night stays constant and then gradually increases, because the ozone layer absorbs a lot of solar radiation during the day. The surface temperature of photovoltaic cells is greatly affected by the environment, and the temperature difference between day and night is large: when the solar radiation is weak in the high sky, the surface temperature of photovoltaic cells is low; however, when the solar radiation is strong in the high sky, the surface temperature of photovoltaic cells is higher than 330 K. For high-altitude long-endurance solar-powered UAV, a large range and periodic surface temperature change is unfavorable to the improvement of aircraft characteristics. Therefore, the aircraft structure material with good heat dissipation performance can be considered, and the thermal convection inside the wing can be fully utilized. In the daytime when the surface temperature of the photovoltaic cell is high, the heat can be effectively dispersed; at night, when the surface temperature is low, heat from other heating devices can be transferred to the surface of the wing, preventing the UAV from freezing.
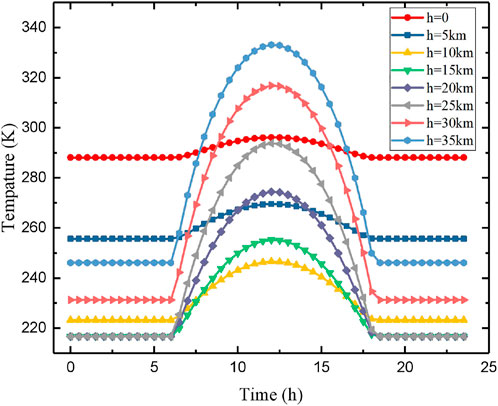
Figure 8. The variation of surface temperature at different times and altitudes.
All other things being equal, the voltage of the PV cell decreases as the temperature increases and the current increases as the temperature increases (Chander et al., 2015). The voltage variation at maximum power point at different times and altitudes is shown in Figure 9. When the altitude is 25 km or less, the voltage of the PV cell reaches the maximum at 12.2 h. The reason is that, in addition to temperature, solar radiation is also a factor affecting the voltage of the PV cell. With the change in time, solar radiation has a more significant impact on the PV cell. Although the surface temperature of the PV cell is the highest at 12.2 h, the PV cells can receive more solar radiation at the same time, and the voltage is higher. However, due to the high temperature, voltage changes little with time during the daytime between 30 and 35 km. Meanwhile, during the day and at different altitudes, when the altitude is below 10 km, solar radiation changes dramatically with altitude, and voltage increases when altitude changes. When the altitude is 15 km and above, the voltage decreases with the increase of the height at 12.2 h. The reason is that, the temperature at the same altitude at 15 km and above changes dramatically with time, temperature becomes an crucial factor affecting the output of the PV cell.
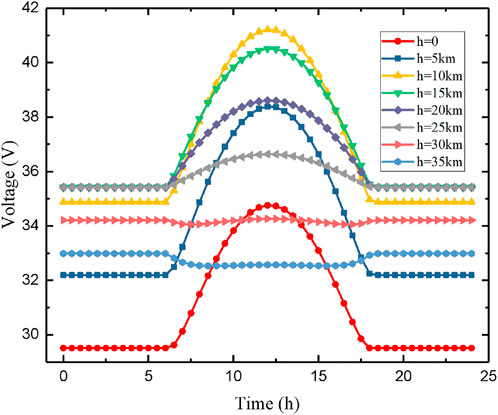
Figure 9. The variation of maximum power point voltage of PV cell at different times and altitudes.
It is worth mentioning that the current trend of the PV cell at the same altitude is similar to that of solar radiation. As the altitude rises, the current gradually increases, in the meantime. The reason is that the temperature has a relatively small impact on the current, which is mainly influenced by the intensity of solar radiation.
The variations of peak power and the power conversion efficiency of the PV cell at different times and altitudes are shown in Figures 10, 11, respectively. It is found that, at the same altitude, the power of the photovoltaic cell increases first and then begins to decrease at 12.2 h with time, which is mainly affected by solar radiation. The influence of voltage on the power of the photovoltaic cell is mainly reflected in the power output changes at different altitudes. As the altitude rises from sea level to 35 km, the peak power increases first and then decreases. There is a maximum power between 15 and 20 km. When the time is 12.2 h, the peak power at the altitudes of 15 and 20 km is about 319.7 W. It is found that the power conversion efficiency of the PV cell increases first and then decreases with time at the same altitude. As the altitude increases, the peak value of the efficiency-time curve increases first and then decreases. The efficiency reaches the maximum value between 20 and 25 km at about noon, and at 20 km, the efficiency reaches 0.31 at 12.2 h.
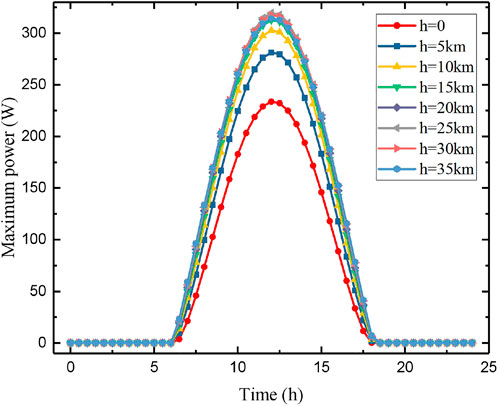
Figure 10. The variation of peak power at different times and altitudes.
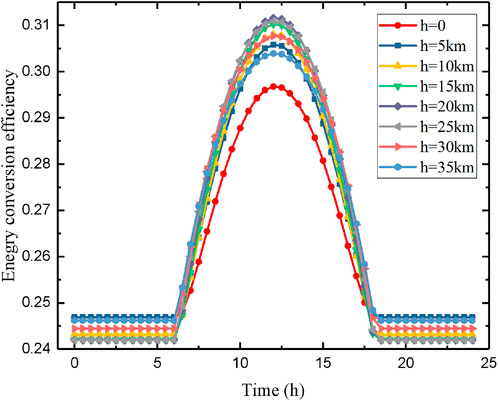
Figure 11. The variation of the power conversion efficiency of PV cell at different times and altitudes.
Conclusion
A solar radiation model is applied, and a thermodynamic model of airfoil surface combining the equivalent circuit of the photovoltaic cell is made use of in this work. The effects of solar irradiance and temperature on the output characteristics of the photovoltaic cell at different times and altitudes are discussed in detail. After including thermal effects under standard conditions, the maximum power point moves forward, and the peak power decreases by 6.6 W. With the increase in altitude, the solar radiation gradually increases. The solar irradiance changes slowly above 15 km. The difference between 20 and 35 km at 12.2 h is only 13 W/m2, while the difference between 5 and 20 km at 12.2 h is 100.8 W/m2. With the rise in altitude, the surface temperature of the photovoltaic cell decreases before 10 km and increases after 15 km due to the influence of ambient atmospheric temperature and thermal convection. When the altitude is 25 km or less, the voltage at the maximum power point reaches the maximum value at 12.2 h; due to the high temperature, voltage changes little with time during the day between 30 and 35 km. There is a peak power between 15 and 20 km. When the time is 12.2 h, the peak power at the altitudes of 15 and 20 km is about 319.7 W. The power conversion efficiency of the photovoltaic cell reaches the maximum value between 20 and 25 km at about noon, and at 20 km, the efficiency values at 0.31 at 12.2 h.
Data Availability Statement
The original contributions presented in the study are included in the article/supplementary material, further inquiries can be directed to the corresponding author.
Author Contributions
Drafting the manuscript: PL; revising the manuscript critically for important intellectual content: HW, MC, and JB.
Funding
This work was supported by the China Postdoctoral Science Foundation (No. 2021M692632).
Conflict of Interest
The authors declare that the research was conducted in the absence of any commercial or financial relationships that could be construed as a potential conflict of interest.
Publisher’s Note
All claims expressed in this article are solely those of the authors and do not necessarily represent those of their affiliated organizations, or those of the publisher, the editors and the reviewers. Any product that may be evaluated in this article, or claim that may be made by its manufacturer, is not guaranteed or endorsed by the publisher.
References
Barbosa, R., Escobar, B., Sanchez, V. M., Hernandez, J., Acosta, R., and Verde, Y. (2014). Sizing of a Solar/hydrogen System for High Altitude Long Endurance Aircrafts. Int. J. Hydrogen Energy 39, 16637–16645. doi:10.1016/j.ijhydene.2014.05.152
Baur, C., Khorenko, V., Siefer, G., Inguimbert, V., Park, S., Boizot, B., et al. (2017). Status of Solar Generator Related Technology Development Activities Supporting the Juice Mission. E3S Web Conf. 16, 04005. doi:10.1051/e3sconf/20171604005
Bernhard, K. (2000). Auslegung und simulation von hochfliegenden dauerhaft stationierbaren solardrohnen. [Ph.D. Dissertation]. München: Technischen Universität München.
Chander, S., Purohit, A., Sharma, A., Nehra, S. P., and Dhaka, M. S. (2015). Impact of Temperature on Performance of Series and Parallel Connected Mono-Crystalline Silicon Solar Cells. Energy Rep. 1, 175–180. doi:10.1016/j.egyr.2015.09.001
Chang, M., Zhou, Z., and Wang, R. (2013). Power Characteristics of Photovoltaic Modules of Solar-Powered Airplanes Including Thermal Effects. Adv. Mater. Res. 805-806, 58–62. doi:10.4028/www.scientific.net/amr.805-806.58
Das, D., Kalita, P., Dewan, A., and Tanweer, S. (2019). Development of a Novel Thermal Model for a PV/T Collector and its Experimental Analysis. Sol. Energy 188, 631–643. doi:10.1016/j.solener.2019.06.005
Durisch, W., Urban, J., and Smestad, G. (1996). Characterisation of Solar Cells and Modules under Actual Operating Conditions. Renew. Energy 8, 359–366. doi:10.1016/0960-1481(96)88878-1
Gao, M., Yu, W. C., Wang, S. S., Wang, R. C., and Shi, J. J. (2021). Multidimensional Coupled Modeling for Solar-Powered UAV Enegry System. Acta Aeronautica Astronautica Sinica. 42, 224461. doi:10.7527/S1000-6893.2020.24461
Haws, T. D., and Bowman, W. J. (1999). Thermal Analysis of the Pathfinder Aircraft. American Institute of Aeronautics & Astronautics, 99–0735.
Khatib, T., Mohamed, A., and Sopian, K. (2012). A Review of Solar Energy Modeling Techniques. Renew. Sustain. Energy Rev. 16, 2864–2869. doi:10.1016/j.rser.2012.01.064
Liu, L., Du, M. Y., Zhang, X. H., Zhang, C., Xu, G. T., and Wang, Z. P. (2016). Conceptual Design and Enegry Management Strategy for UAV with Hybrid Solar and Hydrogen Energy. Acta Aeronautica Astronautica Sinica 37, 144–162. doi:10.7527/S1000-6893.2015.0273
Ma, D. L., Zhang, L., Yang, M. Q., Xia, X. L., and Wang, S. Q. (2020). Review of Key Technologies of Ultra-long-endurance Solar-Powered Unmannned Aerial Vehicle. Acta Aeronautica Astronautica Sinica. 41, 623418. doi:10.7527/S1000-6893.2019.23418
Ni, W. J., Bi, Y., Wu, D., and Ma, X. P. (2021). Energy-optimal Trajectory Planning for Solar-Powered Aircraft Using Soft Actor-Critic. Chin. J. Aeronautics. In Press. doi:10.1016/j.cja.2021.11.009
Ouédraogo, A., Zouma, B., Ouédraogo, E., Guissou, L., and Bathiébo, D. J. (2021). Individual Efficiencies of a Polycrystalline Silicon PV Cell versus Temperature. Results Opt. 4, 100101. doi:10.1016/j.rio.2021.100101
Rawa, M., Al-Turki, Y., Sindi, H., Ćalasan, M., Ali, Z. M., and Aleem, S. H. E. A. (2022). Current-voltage Curves of Planar Heterojunction Perovskite Solar Cells – Novel Expressions Based on Lambert W Function and Special Trans Function Theory. J. Adv. Res. In Press. doi:10.1016/j.jare.2022.03.017
Scheiman, D. A., Jenkins, P. P., Brinker, D. J., and Appelbaum, J. (1996). Low-intensity Low-Temperature (LILT) Measurements and Coefficients on New Photovoltaic Structures. Prog. Photovolt. Res. Appl. 4, 117–127. doi:10.1002/(sici)1099-159x(199603/04)4:2<117::aid-pip123>3.0.co;2-c
Singh, B. P., Goyal, S. K., and Kumar, P. (2021). Solar PV Cell Materials and Technologies: Analyzing the Recent Developments. Mater. Today Proc. 43, 2843–2849. doi:10.1016/j.matpr.2021.01.003
Solangi, K. H., Islam, M. R., Saidur, R., Rahim, N. A., and Fayaz, H. (2011). A Review on Global Solar Energy Policy. Renew. Sustain. Energy Rev. 15, 2149–2163. doi:10.1016/j.rser.2011.01.007
Wang, X., Yang, Y., Wang, D., and Zhang, Z. (2022). Mission-Oriented Cooperative 3D Path Planning for Modular Solar-Powered Aircraft with Energy Optimization. Chin. J. Aeronautics 35, 98–109. doi:10.1016/j.cja.2021.04.015
Keywords: photovoltaic cell, operating altitude, solar-powered aircraft, solar radiation, thermodynamic model, electrical characteristic
Citation: Li P, Wang H, Chang M and Bai J (2022) Electrical Characteristics of Photovoltaic Cell in Solar-Powered Aircraft During Cruise. Front. Therm. Eng. 2:931069. doi: 10.3389/fther.2022.931069
Received: 28 April 2022; Accepted: 20 June 2022;
Published: 12 July 2022.
Edited by:
Marc Secanell, University of Alberta, CanadaReviewed by:
Pankaj Kalita, Indian Institute of Technology Guwahati, IndiaQiliang Wang, Hong Kong Polytechnic University, Hong Kong SAR, China
Copyright © 2022 Li, Wang, Chang and Bai. This is an open-access article distributed under the terms of the Creative Commons Attribution License (CC BY). The use, distribution or reproduction in other forums is permitted, provided the original author(s) and the copyright owner(s) are credited and that the original publication in this journal is cited, in accordance with accepted academic practice. No use, distribution or reproduction is permitted which does not comply with these terms.
*Correspondence: Hui Wang, d2FuZ2h1aTIwMThAbndwdS5lZHUuY24=