 Lauren M. Sanders1,2
 Hamed Chok3Finsam Samson4Ana Uriarte Acuna2,5San-Huei Lai Polo2,5Valery Boyko2,6Yi-Chun Chen2,5Marie Dinh2,7Samrawit Gebre2
 Jonathan M. Galazka2
 Sylvain V. Costes2
 Amanda M. Saravia-Butler2,5*
- 1Blue Marble Space Institute of Science, NASA Ames, Seattle, United States
- 2NASA Ames Research Center, Moffett Field, CA, United States
- 3GeneLab Multi-Omics Analysis Working Group, Houston, TX, United States
- 4Department of Computer Science, Stanford University, Stanford, CA, United States
- 5KBR, Space Biosciences Division, NASA Ames Research Center, Moffett Field, CA, United States
- 6The Bionetics Corporation, NASA Ames Research Center, Moffett Field, CA, United States
- 7Logyx, LLC, Mountain View, CA, United States
Introduction: RNA sequencing (RNA-seq) data from space biology experiments promise to yield invaluable insights into the effects of spaceflight on terrestrial biology. However, sample numbers from each study are low due to limited crew availability, hardware, and space. To increase statistical power, spaceflight RNA-seq datasets from different missions are often aggregated together. However, this can introduce technical variation or “batch effects”, often due to differences in sample handling, sample processing, and sequencing platforms. Several computational methods have been developed to correct for technical batch effects, thereby reducing their impact on true biological signals.
Methods: In this study, we combined 7 mouse liver RNA-seq datasets from NASA GeneLab (part of the NASA Open Science Data Repository) to evaluate several common batch effect correction methods (ComBat and ComBat-seq from the sva R package, and Median Polish, Empirical Bayes, and ANOVA from the MBatch R package). Principal component analysis (PCA) was used to identify library preparation method and mission as the primary sources of batch effect among the technical variables in the combined dataset. We next quantitatively evaluated the ability of each of the indicated methods to correct for each identified technical batch variable using the following criteria: BatchQC, PCA, dispersion separability criterion, log fold change correlation, and differential gene expression analysis. Each batch variable/correction method combination was then assessed using a custom scoring approach to identify the optimal correction method for the combined dataset, by geometrically probing the space of all allowable scoring functions to yield an aggregate volume-based scoring measure.
Results and Discussion: Using the method described for the combined dataset in this study, the library preparation variable/ComBat correction method pair out ranked the other candidate pairs, suggesting that this combined dataset should be corrected for library preparation using the ComBat correction method prior to downstream analysis. We describe the GeneLab multi-study analysis and visualization portal which will allow users to access the publicly available space biology ‘omics data, select multiple studies to combine for analysis, and examine the presence or absence of batch effects using multiple metrics. If the user chooses to perform batch effect correction, the scoring approach described here can be implemented to identify the optimal correction method to use for their specific combined dataset prior to analysis.
1 Introduction
Space biology research is essential for understanding physiological responses to spaceflight, and offers key insights into biological pathways that are impacted by the unique conditions of low Earth orbit and beyond (Institute of Medicine, Board on Health Sciences Policy and Committee on NASA’s Research on Human Health Risks, 2008; Garrett-Bakelman et al., 2019; da Silveira et al., 2020; Malkani et al., 2020). Resources aboard the International Space Station have allowed for multi-omic space biology studies involving complex model organisms, such as those conducted within the Rodent Research project (Rizzo et al., 2012; Jonscher et al., 2016; Chakravarty et al., 2017; Pecaut et al., 2017; Rettig et al., 2017; Shen et al., 2017; Tascher et al., 2017; Ward et al., 2018; Beheshti et al., 2019; Ronca et al., 2019; Choi et al., 2020). However, such research is often constrained by high costs, limited crew time and available space to conduct research. Thus, sample numbers from such studies are often low, limiting the statistical power of each individual experiment. To increase statistical power of a study, researchers often combine individual datasets with similar experimental conditions (Beheshti et al., 2019; da Silveira et al., 2020; Malkani et al., 2020).
However, merging datasets can introduce unwanted data variation due to technical differences between datasets, including variation in sample handling, processing, and sequencing platforms (Johnson et al., 2007; Lai Polo et al., 2020; Foox et al., 2021). Artificially introduced variation, or “batch effects”, can affect biologically relevant comparisons, such as spaceflight (FLT) vs ground control (GC) samples. Therefore, prior to any downstream analysis of a combined dataset, it is appropriate to first identify potential sources of technical batch effects and then if necessary, perform a statistical adjustment to correct the data values (Leek and Storey, 2007; Leek et al., 2010; Čuklina et al., 2020). Several statistical methods exist to correct for batch effects in genomics and transcriptomics data (Johnson et al., 2007; Akbani et al., 2018; Zhang et al., 2018; Zhang et al., 2020).
In the present work, we utilized publicly available transcriptomics data sourced from NASA GeneLab to evaluate the performance of five common batch effect correction methods (ComBat and ComBat-seq from the sva R package, and Median Polish, Empirical Bayes, and ANOVA from the MBatch R package) on combined RNA sequencing (RNA-seq) datasets. As part of the NASA Open Science Data Repository (https://osdr.nasa.gov/bio/repo/), GeneLab is an open access database that hosts datasets containing both raw and processed multi-omics data from spaceflight and ground-based analogue experiments (Ray et al., 2019; Berrios et al., 2021). In this study, we combined seven RNA-seq datasets containing spaceflown and ground control mouse liver samples. We selected only liver tissue datasets to limit additional biological sources of variation, such as tissue type. The seven datasets used spanned multiple different rodent research missions, sequencing facilities, and RNA-seq library preparation methods. We identified two primary sources of technical variation among the combined samples, and evaluated the performance of the five batch effect correction methods to correct for these technical batch variables using several criteria: BatchQC (Manimaran et al., 2016), principal component analysis (PCA), dispersion separability criterion (DSC) (Oseni et al., 2021), log fold change (LFC) correlation, and differential gene expression (DGE) analysis.
We also present the development of a standardized scoring approach to identify the optimal correction method for each technical batch variable in a combined dataset. The standardized scoring approach described herein iterates through the five batch effect correction methods listed above and geometrically probes the space of all allowable scoring functions to yield an aggregate volume-based scoring measure.
Lastly, we describe the implementation of an open-access, user-friendly multi-study analysis and visualization portal for GeneLab RNA-seq data, which allows users to select multiple studies, examine batch effects, choose whether to correct batch effects based on the scoring method, and then performs batch effect correction prior to downstream analysis.
2 Methods
2.1 GeneLab RNA-seq datasets
Unnormalized RNA sequencing counts tables for Open Science Datasets 47(Galazka et al., 2015), 48(Globus et al., 2015), 137(Smith et al., 2017), 168(Galazka, 2020), 173(Costes et al., 2018), 242(Galazka et al., 2019a), and 245 (Galazka et al., 2019b) were downloaded from the Open Science Data Repository (https://osdr.nasa.gov/bio/repo/). These counts tables were merged on the ENSEMBL ID column, non-overlapping genes were eliminated, and only spaceflight and respective ground control samples were used. The combined counts table was normalized using the DESeq2 (v1.30.1) (Love et al., 2014) median of ratios method prior to analysis and batch effect correction. For the log fold change correlation and DGE comparison evaluation criteria, FLT and GC samples from datasets GLDS-48 and GLDS-245 were each split into two sub-datasets. GLDS-48_C = samples derived via tissues extracted from frozen carcasses, GLDS-48_I = samples derived via tissues extracted immediately after euthanasia on the ISS (FLT) or on Earth (GC), GLDS-245_ISST = samples derived via tissues extracted immediately after euthanasia on the ISS (FLT) or on Earth (GC), GLDS-245_LAR = samples derived via tissues extracted immediately after euthanasia post live animal return to Earth.
2.2 Batch effect correction
All batch effect correction was performed in R v4.0.4. ComBat(Johnson et al., 2007) and ComBat-seq (Zhang et al., 2020) were accessed through the sva R package v3.38.0 (Leek et al., 2020), and MBatch Empirical Bayes, ANOVA, and Median Polish were accessed through the MBatch R package v5.4.7 (Akbani et al., 2018). Each batch effect correction was performed on the DESeq2-normalized combined counts table. Each correction algorithm was provided with the combined counts table and a metadata file specifying the batch assignment for each sample (Supplementary Table S1). After correction with each MBatch algorithm, negative counts were converted to zero for downstream processing.
2.3 Evaluation metrics
2.3.1 BatchQC
BatchQC (Manimaran et al., 2016) was run on the uncorrected and batch corrected counts tables, using the BatchQC R package v1.18.0. We calculated the skew and kurtosis values for each sample using scipy. stats (v1.7.3) skew and kurtosis implementations. A BatchQC improvement score was calculated as follows:
Where uncorrected = the skew or kurtosis value from the uncorrect data, and corrected = the skew or kurtosis value from the corrected data.
2.3.2 Principal component analysis (PCA)
PCA was run on the uncorrected and batch corrected counts tables, using the prcomp() function from the stats R package (v4.1.0) (R Core Team, 2021). In order to quantify the relationships within- and between-batches before versus after batch effect correction, we calculate two PCA improvement scores as follows:
For quantifying how effective a batch effect correction was, tech_score must be minimized and bio_score must be maximized.
2.3.3 Dispersion separability criterion (DSC)
We calculate the DSC metric on the pre- and post-corrected combined dataset using the PCA_Regular_Structures function in the R MBatch library (v1.7.6). DSC quantifies the amount of batch effect in data from a specific variable by measuring the ratio of dispersion between batches and within batches (Oseni et al., 2021). A higher DSC value indicates more batch effect because it means greater dispersion between the batches than within the batches. We calculate DSC values for each variable, take the mean across all biological variables and all technical variables, then calculate the difference in overall DSC values post-correction versus pre-correction. To assess the effectiveness of batch effect correction, the post-correction versus pre-correction differences in technical variables should be maximized while the differences in biological variables should be minimized.
2.3.4 Log fold change correlation
We calculate log2 fold change (LFC) for all genes in the FLT versus GC groups, then calculate the correlation of LFC pairwise between all datasets. We set pairwise comparisons from the same batch to 0, and calculate the average value across all pairwise datasets from different batches. This value should be maximized in an effective batch effect correction.
2.3.5 Differential gene expression (DGE) analysis
DGE analysis was performed between FLT and GC samples using DESeq2, from the DESeq2 R package v1.30.1. Genes with fewer than 10 counts across all samples were filtered before running size normalization. We perform two types of evaluation using this criterion: DGE within-dataset and DGE across-dataset comparisons.
For the DGE within-dataset evaluation we calculate the number of differentially expressed genes (DEGs) per dataset post-correction that match the pre-correction DEGs, or that are in addition (extra) to the pre-correction DEGs. We represent the match and extra DEGs as a fraction of the original for each dataset and then take the mean across all datasets. To quantify the effectiveness of a batch effect correction, the number of DEGs that match between pre- and post-correction should be maximized and the number of DEGs that are extra in post-correction compared to pre-correction should be minimized.
For the DGE across-dataset evaluation we assess whether DEGs are better preserved between datasets from different batches post-correction. In a pairwise manner, we calculate the percent overlapping DEGs which are preserved between each dataset from pre-to post-correction. We scale the values between 0–1, set pairwise comparisons from the same batch to 0, and calculate the average value across all pairwise datasets from different batches. This value should be maximized in an effective batch effect correction.
The values from each evaluation metric for each batch variable/correction method pair are used as input to the scoring method (see next section).
2.4 Scoring method
We developed a standardized scoring approach to identify the optimal correction method for technical batch variables for a specific dataset by geometrically probing the space of all allowable scoring functions from the evaluation criteria to yield an aggregate volume-based scoring measure.
The data may be interpreted as a point cloud in a multi-dimensional vector space with the number of points being the number of competing batch variable/correction method pair candidates. The evaluation criteria are evaluated across all candidate pairs. A linear scoring function in terms of the evaluation scores may be viewed as a hyperplane in the underlying vector space. In the case that all evaluation scores are to be maximized, then seeking the one or more candidate pairs that are optimized by any given choice of scoring function (weighted combination of evaluation criteria) amounts to maximizing the hyperplane offset over the point cloud. Additional details are available in the Supplementary Methods.
The scoring method was implemented using MATLAB version 9.10.0.1684407 with libraries convhulln (convex hull computation), delaunayn (simplicial decomposition), and vert2lcon (constraint generation) and lcon2vert (vertex enumeration) libraries from the Analyze N-dimensional Convex Polyhedra package (version 1.9.0.2).
3 Results
3.1 Identification of primary sources of batch effect in multi-study dataset
Seven RNA-seq datasets containing liver samples from spaceflown (FLT) and respective ground control (GC) mice were downloaded from the NASA Open Science Data Repository (processed GeneLab data) and combined as described in the Methods (OSD/GLDS-47, -48, -137, -168, -173, -242 and -245). The total sample number was 112 after combining datasets (57 FLT samples and 55 GC samples). These datasets differ from each other in key ways, including biological variables such as differences in age, strain, and sex, as well as technical variables, including differences in mission, preservation methods, and RNA library preparation methods that could be sources of batch effect (Table 1). Full sample-level metadata are available in Supplementary Table S1.
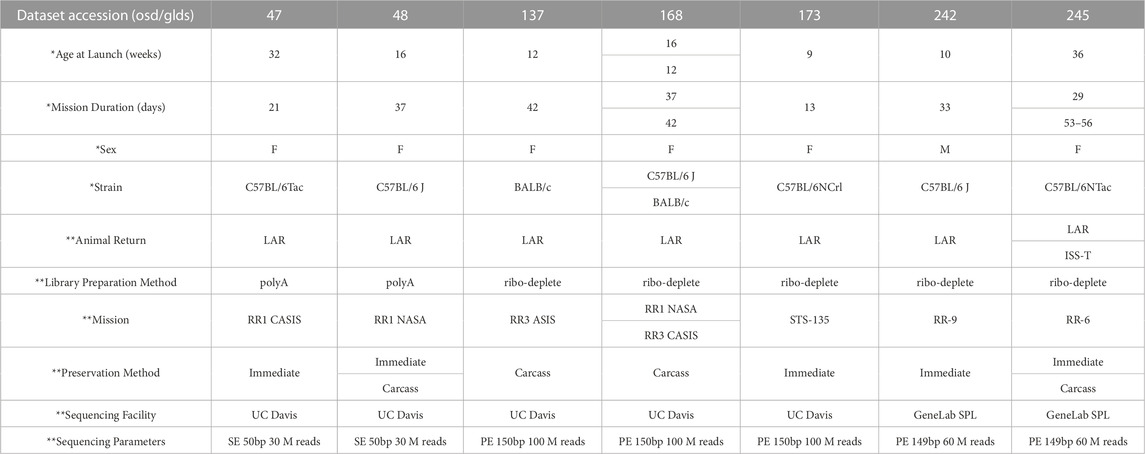
TABLE 1. Metadata associated with seven GeneLab RNA-seq liver datasets from space flown and ground control mice. RR = Rodent Research. CASIS = Center for the Advancement of Science in Space. STS = Space Transportation System. F = Female. M = Male. LAR = live animal return; animals returned to Earth prior to euthanization. ISS-T = International Space Station Terminal; animals euthanized in orbit. Carcass = tissue extraction from animals after freezing and returning to Earth. Immediate = tissue extraction immediately after euthanasia, either on the ISS or after live animal return to Earth. SE = single end. PE = paired end. Bp = base pairs. SPL = Sample Processing Lab. * indicates biological variables. ** indicates technical variables.
After read depth normalization with DESeq2 (see Methods), we performed principal component analysis (PCA) to identify potential sources of batch effect among the technical variables. We found that the library preparation method used was the primary source of variation among samples, and the mission the samples were derived from was an additional source of sample grouping (Figure 1, Supplementary Figure S1).

FIGURE 1. Principal Component Analysis (PCA) of the combined dataset. PCA plots with shapes representing either spaceflown (FLT) or ground control (GC) groups and samples colored by (A) library preparation method (LibPrep) or (B) by mission.
Based on the PCA plots in Figure 1 and Supplementary Figure S1, we concluded that library preparation method and mission were primary sources of batch effect in this combined dataset, which may be masking potential differences in gene expression between FLT and GC samples. We therefore sought to identify the most effective tool to correct for each source of batch effect while preserving biological differences. Five commonly used batch effect correction tools/algorithms (Johnson et al., 2007; Akbani et al., 2018; Zhang et al., 2020) were selected to independently correct for the two sources of batch effect (Table 2, Methods).
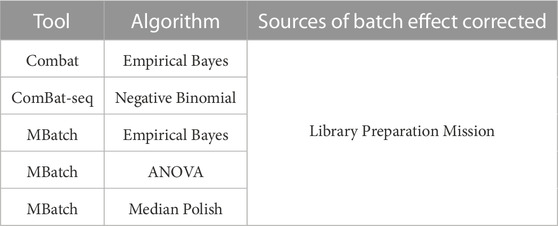
TABLE 2. Batch effect correction tools and associated algorithms and batch variables. Five batch effect correction methods, including tools and their associated algorithms were used to correct for each of the main sources of batch effect in the combined dataset.
To assess the effectiveness of each correction method for removing batch effect while preserving biological signal, the following six criteria were evaluated before and after correction (as detailed in Methods): BatchQC, PCA, Dispersion Separability Criterion (DSC), FLT vs. GC log2 fold change (LFC) correlation across datasets and differentially expressed genes (DEGs) within and across datasets. For each of the evaluation criteria, we calculated an improvement score (see Methods) to quantify how well each correction method removed batch effects according to the given technical source of batch effect. Lastly, a custom scoring methodology was developed and implemented to collectively compare all 10 batch variable/correction method combinations based on all the evaluation criteria.
3.2 Evaluation of batch effect correction with BatchQC, PCA, and DSC
BatchQC (Manimaran et al., 2016) was used to evaluate the skew and kurtosis of each sample before versus after correction (see Methods). Skew and kurtosis are mathematical assessments of how each data point deviates from the normal distribution (Okrah and Corrada Bravo, 2015). Here, the assumption is that deviance from normal may be caused by batch effects, so we expect samples from different technical batches to have more similar skew and kurtosis values after correction. For this evaluation, correcting for library preparation with MBatch Median Polish and correcting for mission with ComBat-seq, outperformed the other correction methods as evident by skewness and kurtosis values for samples from different respective batches becoming more similar post-correction (Supplementary Figure S2).
PCA was used to evaluate how samples cluster before and after correction. If technical variables are successfully corrected, samples in different technical variable batches would cluster closer together post-correction and allow for samples in different biological conditions (FLT or GC in the case presented here) to cluster further apart. For this evaluation, correcting for library preparation with MBatch ANOVA and correcting for mission with MBatch Median Polish, outperformed the other correction methods as evident by the reduced distance between samples in different respective technical variable batches and increased distance between samples in different biological conditions post-correction (Figure 2, Supplementary Figure S3).
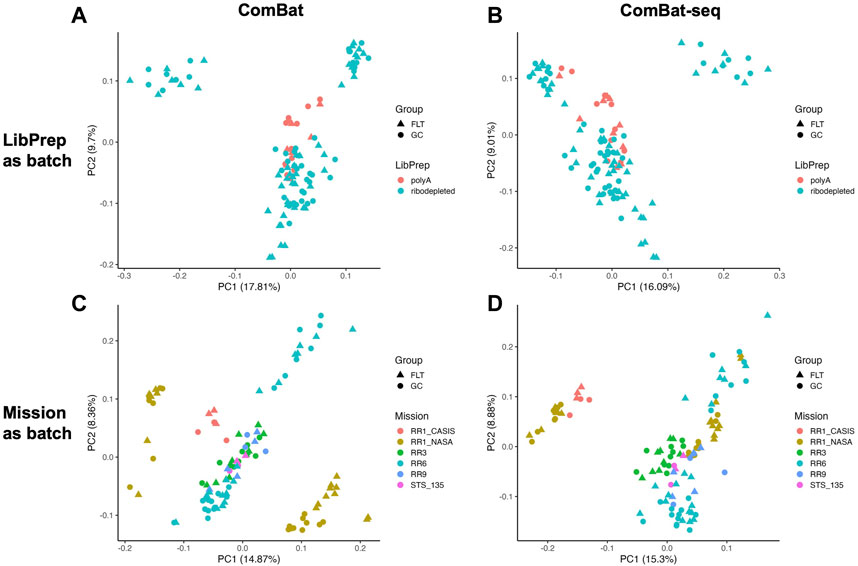
FIGURE 2. PCA plots of corrected data. PCA plots of sample data (A) after correcting for the library preparation batch variable using ComBat, samples colored by library preparation method (LibPrep); (B) after correcting for the library preparation batch variable using ComBat-seq, samples colored by library preparation method (LibPrep); (C) after correcting for the mission batch variable using ComBat, samples colored by Mission; (D) after correcting for the mission batch variable using ComBat-seq, samples colored by Mission. For each PCA plot, shapes represent either space flown (FLT) or ground control (GC) groups.
DSC (Oseni et al., 2021) was used to quantify the amount of batch effect within the data by calculating the ratio of dispersion between groups versus within groups before and after correction. Samples were grouped multiple ways, based on technical variables or biological variables, and the DSC metric was calculated for each type of grouping before batch correction and after batch correction using either library preparation or mission as the batch variable (see Methods). An effective batch correction method should result in a reduced DSC value for technical variable groupings and an elevated DSC value for biological variable groupings. For this evaluation, correcting for library preparation with MBatch Empirical Bayes and correcting for mission with MBatch ANOVA, outperformed the other correction methods as evident by minimizing the DSC value for technical variable groupings and maximizing the DSC value for biological variable groupings post-correction (Figure 3, Supplementary Figure S4).
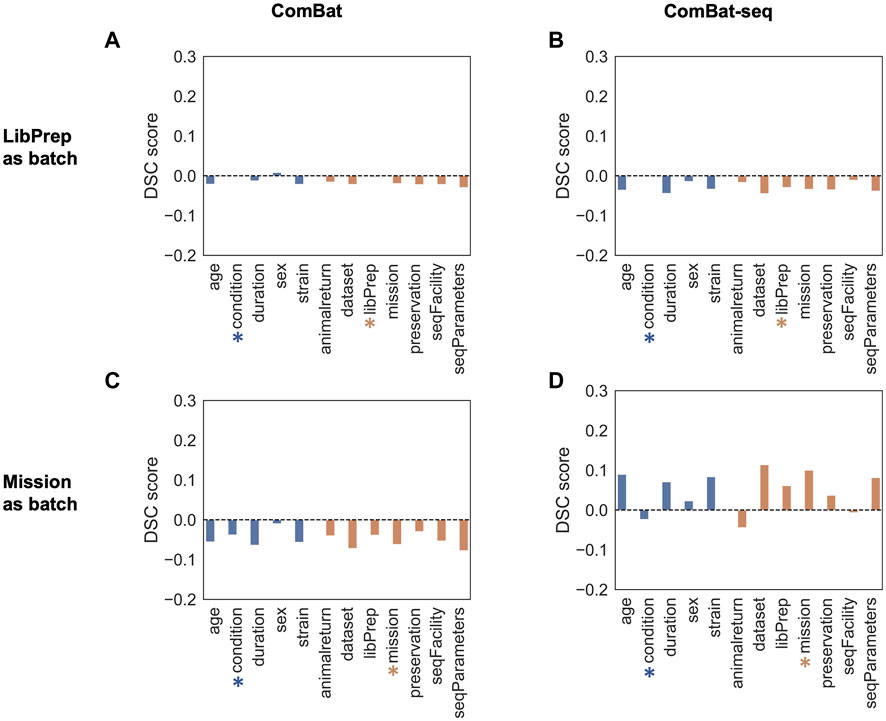
FIGURE 3. DSC scores of corrected data compared to uncorrected data. Barplots of sample data grouped by biological (blue) or technical (orange) variables for uncorrected DSC values subtracted from corrected DSC values (A) after correcting for the library preparation (LibPrep) batch variable using ComBat; (B) after correcting for the library preparation batch variable using ComBat-seq; (C) after correcting for the mission batch variable using ComBat; (D) after correcting for the mission batch variable using ComBat-seq. A blue star indicates the biological condition of interest (FLT or GC) and the orange star indicates the technical batch variable that was corrected for.
3.3 Evaluation of batch effect correction with LFC and DGE
All samples in the combined dataset were derived from livers of mice that were flown in space (FLT) and their respective ground controls (GC); we therefore expect the relative changes in gene expression in FLT versus GC samples in each original dataset to be similar. However, differences in technical variables among the original GLDS datasets (Table 1) may mask the correlation of relative FLT versus GC gene expression changes. Therefore the FLT versus GC gene expression changes were compared, pairwise, between original datasets to assess dataset to dataset correlation before and after batch correction. For this evaluation, correcting for library preparation with ComBat and correcting for mission with ComBat, outperformed the other correction methods as evident by the greatest overall increase in FLT versus GC log2 fold change (LFC) correlation for pairwise dataset comparisons post-correction (Figure 4, Supplementary Figure S5).

FIGURE 4. FLT vs. GC LFC correlation between liver datasets before and after batch correction. Correlation plots comparing space flight (FLT) versus ground control (GC) log2 fold change (LFC) in gene expression between original datasets (A) before batch correction; (B) after correcting for the library preparation (LibPrep) batch variable using ComBat; (C) after correcting for the library preparation batch variable using ComBat-seq; (D) after correcting for the mission batch variable using ComBat; (E) after correcting for the mission batch variable using ComBat-seq. FLT and GC samples from datasets GLDS-48 and GLDS-245 were each split into two sub-datasets as described in Methods.
We next evaluated differentially expressed genes (DEGs) between FLT and GC groups (adjusted p-value <0.05 and |LFC| > 1) for all GLDS datasets before and after batch correction. Changes in DEGs before and after correction were quantified within each dataset and across datasets.
We expect the DEGs within each dataset to be preserved after combining samples across datasets and correcting for technical differences. The number of preserved and newly identified DEGs within each dataset was calculated after correction and reported in Table 3 and Supplementary Table S2. For this evaluation, correcting for library preparation with MBatch Empirical Bayes and correcting for mission with ComBat, outperformed the other correction methods as evident by the most preserved DEGs within each dataset, and least additional DEGs, post-correction (Table 3 and Supplementary Table S2).

TABLE 3. Comparison of DEGs in FLT vs GC groups within each dataset before and after correction. The “Uncorrected” row shows the number of differentially expressed genes (DEGs) in each dataset before correction. For each batch variable and correction method combination, the number of DEGs that match the original uncorrected DEGs are shown outside of the parentheses, while the number of DEGs that were identified only after correction are shown within parentheses.
For cross dataset comparison of DEGs, the number of overlapping DEGs between pairwise GLDS datasets were quantified before and after batch correction and the percent of overlapping DEGs preserved after batch correction was calculated. For this evaluation, correcting for library preparation with ComBat-seq and correcting for mission with MBatch Median Polish, outperformed the other correction methods as evident by the greatest percent of overlapping DEGs preserved post-correction (Figure 5, Supplementary Figure S6).
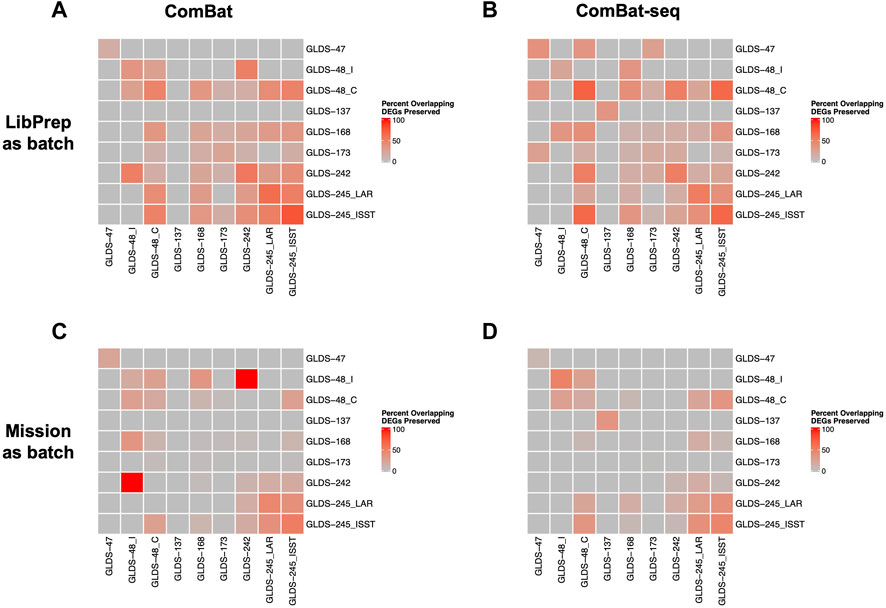
FIGURE 5. Comparison of preserved DEGs in FLT vs GC groups across datasets after correction. Plots showing the pairwise comparisons of the percent overlapping DEGs preserved in FLT versus GC groups across datasets after (A) correcting for the library preparation (LibPrep) batch variable using ComBat; (B) correcting for the library preparation batch variable using ComBat-seq; (C) correcting for the mission batch variable using ComBat; (D) correcting for the mission batch variable using ComBat-seq. FLT and GC samples from datasets GLDS-48 and GLDS-245 were each split into two sub-datasets as described in Methods.
3.4 Identifying optimum correction via a custom scoring categorization scheme
Thus far, improvement scores were calculated for each of the evaluation criteria described above to quantify the performance of each of the 10 batch variable/correction method pairs (2 batch variables, library preparation and mission, each corrected with one of five correction methods described in Table 2). To collectively compare all 10 batch variable/correction method pairs, a geometry-based categorization scheme for ranking the candidate pairs using their evaluation criteria performance scores was developed (Figure 6).
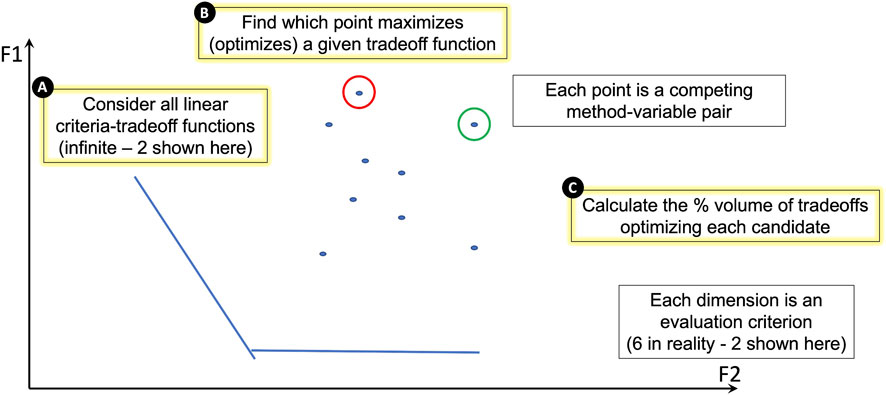
FIGURE 6. A geometry-based categorization scheme for ranking candidates against performance measures. In the schematic, dimensions F1 and F2 each represent one of the evaluation criteria. In reality, our study uses six evaluation criteria, but this figure represents only two for illustration purposes. Each point on the plot represents a competing batch variable/correction method pair. Each pair’s performance is dependent on the criterion. (A) The lines on the plot represent linear criteria tradeoff functions. There are an infinite number of these functions, but we show two for illustration purposes. (B) The batch variable/correction method pair that maximizes (optimizes) a given tradeoff function is identified. In this illustration, the candidate pair that maximizes the F1 criterion is circled in red and the candidate pair that maximizes the F2 criterion is circled in green. (C) The percent volume of criteria tradeoffs optimized by each candidate pair is calculated geometrically and used to rank all candidate pairs; the underlying geometric approach also yields a quantification of the contribution from each evaluation criterion (Methods, Supplementary Table S3).
After implementing the scoring categorization scheme, each batch variable/correction method pair was assigned a % volume related to the percentage of criteria tradeoffs (scoring functions) under which it is maximized. Using this method, the library preparation variable/ComBat correction method pair out ranked the other nine candidate pairs (Table 4). These results indicate that the best approach for minimizing batch effects, and thus maximizing biological signal, in the combined dataset is to correct for the library preparation technical variable using the ComBat batch correction method.
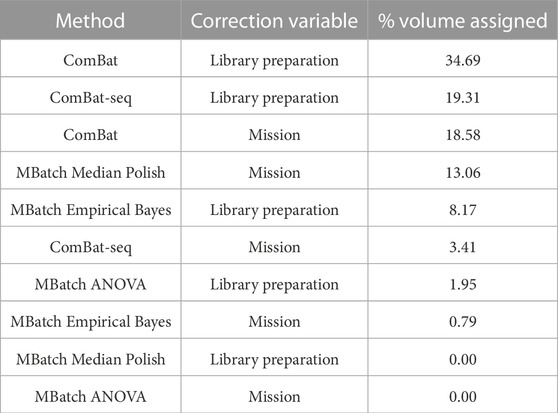
TABLE 4. Scoring categorization scheme results for all batch variable/correction method pairs. The table reports the final ranking of the batch variable/correction method pairs based on the percent volume assigned to each after applying the scoring categorization scheme.
3.5 GeneLab user portal for multi-study data analysis with batch effect correction
Providing a means to allow users to combine samples from various space-relevant GeneLab transcriptomics datasets hosted on the NASA Open Science Data Repository (Ray et al., 2019; Berrios et al., 2021) will undoubtedly enable more insights into how the space environment alters gene expression. The current GeneLab multi-study visualization portal allows users to combine samples from different transcriptomics datasets then perform differential gene expression analysis and visualize their results (Figure 7). Subsequent versions of the multi-study portal will also provide users the option to identify and correct for batch effects thereby reducing the likelihood of introducing artificial variation in the combined dataset. Implementation of the batch correction methodology described here will enhance user confidence in the results of their multi-study analyses. Figure 8 outlines a schematic of how we plan to implement the batch effect correction feature in the GeneLab multi-study data analysis and visualization portal.

FIGURE 7. Representative capabilities of the GeneLab Multi-Study Visualization Portal. (A) The search dashboard presents options for filtering datasets by multiple factors including assay type, organism, and tissue type. (B) After combining datasets, the platform automatically identifies all factors and characteristics represented in the combined dataset and provides users the ability to further select specific samples from each dataset. The platform will then automatically calculate the principal components of the combined data and using a series of drop-down menus, users can choose which factors or characteristics to use for labeling samples in the PCA plots. (C) Differential gene expression analysis results are automatically computed and displayed in a sortable table. (D) Gene set enrichment analysis is performed on significantly differentially expressed genes and represented in a variety of plots, including pathway normalized enrichment score (NES) plots.
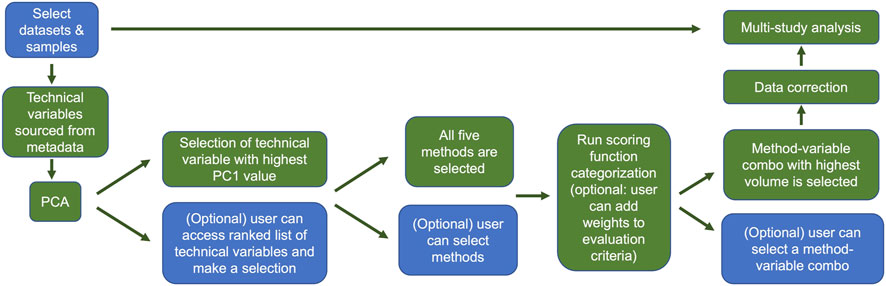
FIGURE 8. Overview of the GeneLab user portal for multi-study data analysis with batch effect correction. This batch effect correction pipeline will be publicly available to users in GeneLab’s upcoming multi-study analysis and visualization portal. Blue indicates user choices, while green indicates automated actions. Users can select datasets and samples and if they wish, bypass the correction and go straight to multi-study analysis. Otherwise users can evaluate potential batch effects using PCA. Users can manually select the variable or variables for correction, or the variable with the greatest first principal component will be selected by default. The user can then select which batch correction method(s) to evaluate, or the default is to evaluate all 5. After the batch variable/correction method pairs are selected, the categorization scoring function is run, and the candidate pair with highest ranked volume is selected automatically unless the user makes a manual selection. The data are then corrected and subsequently fed into the multi study analysis.
4 Discussion
Here we present a standardized approach for evaluating the effectiveness of computational batch effect correction in RNA-seq data. The introduction of technical batch effects is a particular concern for space biology research and analysis, as spaceflight experiments are expensive and time-consuming, which leads to small datasets that are often combined to increase statistical power (Beheshti et al., 2019; da Silveira et al., 2020; Malkani et al., 2020). Therefore, we demonstrate our standardized evaluation approach on a use-case of seven combined GeneLab RNA-seq datasets from the NASA Open Science Data Repository (https://osdr.nasa.gov/bio/repo/).
We show that our evaluation and scoring approach solves several common issues. First, there are many different batch correction methods available (Johnson et al., 2007; Akbani et al., 2018; Leek et al., 2020; Zhang et al., 2020) and several options for how to evaluate the performance of a selected correction method on a given dataset. However, many of these evaluation metrics are commonly evaluated visually, adding issues of subjectivity. Our approach converts metrics such as BatchQC (Manimaran et al., 2016) and PCA(R Core Team, 2021) that are commonly evaluated visually into quantifiable metrics that can be used in a scoring evaluation. Our approach also facilitates the incorporation of additional quantifiable evaluation metrics including dispersion separability criterion (DSC) (Oseni et al., 2021), log fold change correlation, and differential gene expression across datasets. Second, many computational batch effect correction methods have been developed over the past decade, and it is difficult and time-consuming to evaluate the performance of multiple correction methods as well as multiple options of technical variables to assess for batch effect. Our approach rapidly calculates the effectiveness of each batch variable/correction method pair according to several evaluation metrics, standardizing the output and removing subjectivity.
We also present a user portal which will make our approach easy to implement for users who wish to combine RNA-seq data from the Open Science Data Repository, evaluate the presence of batch effects, and identify and implement the most effective correction method. This user portal is a natural extension of the current GeneLab Multi-Study Visualization portal and will enhance the accessibility and reusability of space biology RNA-seq datasets in the Open Science Data Repository.
Although we demonstrate our approach on a space biology use-case, our approach is broadly applicable to scenarios in which multiple RNA-seq datasets are combined or when a large dataset must be processed in several batches, introducing technical variation. Furthermore, here we evaluate five commonly used computational methods for correcting batch effect but our approach can be used to evaluate and compare future methods that have not yet been developed, in order to benchmark the performance of new methods against previous ones.
With the low cost of high-throughput sequencing and the demonstrable influx of RNA-seq datasets in both space biology and the larger life sciences and biomedical fields, standardizing our approach to data sharing and data re-use is essential for reproducible research. We believe that the approach we present here is a vital addition to the open science and data sharing communities as it facilitates re-use of small and precious datasets and provides transparent, rigorous evaluation of computational batch correction methods.
Data availability statement
The datasets presented in this study can be found in online repositories. The names of the repository/repositories and accession number(s) can be found in the article/Supplementary Material.
Author contributions
LS, FS, JG, SC, and A-SB contributed to conception and design of the study. S-HP, VB, YC, and MD processed samples used in the study. S-HP and SG curated study metadata. FS performed initial combat and combat-seq correction and analyses. LS generated batch corrected data, performed statistical analysis for evaluation criteria, created most fingers and tables. HC developed and implemented the custom scoring categorization scheme, including respective figure and statistical analysis of the batch variable/correction method pairs. AA developed the GeneLab multi-study visualization portal. A-SB generated individual and combined un-corrected data, created some figures and tables. LS and A-SB co-wrote the first draft of the manuscript. All authors contributed to the article and approved the submitted version.
Funding
This work was funded by the NASA Space Biology Program within the NASA Science Mission Directorate’s (SMD) Biological and Physical Sciences (BPS) Division.
Acknowledgments
We thank the GeneLab Analysis Working Group members for their suggestions and feedback; all NASA GeneLab members for generating, hosting, and maintaining the datasets used in this study.
Conflict of interest
Author MD, was employed by the company Logyx, LLC.
The remaining authors declare that the research was conducted in the absence of any commercial or financial relationships that could be construed as a potential conflict of interest.
Publisher’s note
All claims expressed in this article are solely those of the authors and do not necessarily represent those of their affiliated organizations, or those of the publisher, the editors and the reviewers. Any product that may be evaluated in this article, or claim that may be made by its manufacturer, is not guaranteed or endorsed by the publisher.
Supplementary material
The Supplementary Material for this article can be found online at:https://www.frontiersin.org/articles/10.3389/fspas.2023.1200132/full#supplementary-material
References
Akbani, R., Casasent, T., Bradley, B., and Weinstein, J. (2018). MBatch: MD anderson batch assessment tools (MBatch) package. R package version 1.4.17. Available at: https://bioinformatics.mdanderson.org/public-software/mbatch/.
Beheshti, A., Chakravarty, K., Fogle, H., Fazelinia, H., Silveira, W. A. D., Boyko, V., et al. (2019). Multi-omics analysis of multiple missions to space reveal a theme of lipid dysregulation in mouse liver. Sci. Rep.9 (1), 19195. doi:10.1038/s41598-019-55869-2
Berrios, D. C., Galazka, J., Grigorev, K., Gebre, S., and Costes, S. (2021). NASA GeneLab: Interfaces for the exploration of space omics data. Nucleic acids Res.49 (1), D1515–D1522. doi:10.1093/nar/gkaa887
Chakravarty, K., Lai, S.-H., Boyko, V., Berrios, D. C., Fogle, H., Reinsch, S., et al. (2017). GeneLab: Multi-Omics investigation of rodent research-1 biobanked tissues. FASEB J.31 (1), 722.
Choi, S. Y., Saravia-Butler, A., Shirazi-Fard, Y., Leveson-Gower, D., Stodieck, L. S., Cadena, S. M., et al. (2020). Validation of a new rodent experimental System to investigate consequences of long duration space habitation. Sci. Rep.10 (1), 2336. doi:10.1038/s41598-020-58898-4
Costes, S., Chakravarty, K., Gebre, S., Lai Polo, S.-H., Butler, A. S., Fogle, H., et al. (2018). OSD-173: STS-135: Mouse liver transcriptomics using RNA-seq. Available at: https://osdr.nasa.gov/bio/repo/data/studies/OSD-173 (Accessed March 28, 2018).
Čuklina, J., Pedrioli, P. G. A., and Aebersold, R. (2020). “Review of batch effects prevention, diagnostics, and correction approaches,” in Mass spectrometry data analysis in proteomics. Editor R. Matthiesen (New York, NY: Springer New York), 373–387.
da Silveira, W. A., Fazelinia, H., Rosenthal, S. B., Laiakis, E. C., Kim, M. S., Meydan, C., et al. (2020). Comprehensive multi-omics analysis reveals mitochondrial stress as a central biological hub for spaceflight impact. Cell.183 (5), 1185–1201.e20. doi:10.1016/j.cell.2020.11.002
Foox, J., Tighe, S. W., Nicolet, C. M., Zook, J. M., Byrska-Bishop, M., Clarke, W. E., et al. (2021). Performance assessment of DNA sequencing platforms in the ABRF next-generation sequencing study. Nat. Biotechnol.39 (9), 1129–1140. doi:10.1038/s41587-021-01049-5
Galazka, J., Globus, R., and Cadena, S. (2015). OSD-47: Rodent research-1 (RR1) national Lab validation flight: Mouse liver transcriptomic, proteomic, and epigenomic data. Available at: https://osdr.nasa.gov/bio/repo/data/studies/OSD-47 (Accessed January 15, 2018).
Galazka, J. (2020). OSD-168: RR-1 and RR-3 mouse liver transcriptomics with and without ERCC control RNA spike-ins. Available at: https://osdr.nasa.gov/bio/repo/data/studies/OSD-168 (Accessed January 15, 2018).
Galazka, J., Polo, S.-H. L., Saravia-Butler, A., Fogle, H., Bense, N., Boyko, V., et al. (2019b). OSD-245: Transcriptional analysis of liver from mice flown on the RR-6 mission. Available at: https://data.nasa.gov/Earth-Science/Transcriptional-analysis-of-liver-from-mice-flown-/qakd-nw8w (Accessed January 27, 2023).
Galazka, J., Polo, S.-H. L., Saravia-Butler, A., Fogle, H., Bense, N., Chen, Y.-C., et al. (2019a). OSD-242: Effect of spaceflight on liver from mice flown on the ISS for 33 days: Transcriptional analysis. Available at: https://osdr.nasa.gov/bio/repo/data/studies/OSD-242 (Accessed June 28, 2019).
Garrett-Bakelman, F. E., Darshi, M., Green, S. J., Gur, R. C., Lin, L., Macias, B. R., et al. (2019). The nasa twins study: A multidimensional analysis of a year-long human spaceflight. Science364 (6436), eaau8650. doi:10.1126/science.aau8650
Globus, R., Galazkaemail, J., Marcu, O., Saravia-Butler, A., Fogle, H., Bense, N., et al. (2015). OSD-48: Rodent Research-1 (RR1) NASA Validation Flight: Mouse liver transcriptomic, proteomic, and epigenomic data. Available at: https://osdr.nasa.gov/bio/repo/data/studies/OSD-48 (Accessed December 11, 2015).
Institute of Medicine, Board on Health Sciences Policy and Committee on NASA’s Research on Human Health Risks (2008). Review of NASA’s human research Program evidence books. Washington, DC: National Academies Sciences Engineering Medicine.
Johnson, W. E., Li, C., and Rabinovic, A. (2007). Adjusting batch effects in microarray expression data using empirical Bayes methods. Biostatistics8 (1), 118–127. doi:10.1093/biostatistics/kxj037
Jonscher, K. R., Alfonso-Garcia, A., Suhalim, J. L., Orlicky, D. J., Potma, E. O., Ferguson, V. L., et al. (2016). Spaceflight activates lipotoxic pathways in mouse liver. PloS one11 (4), e0152877. doi:10.1371/journal.pone.0152877
Lai Polo, S. H., Saravia-Butler, A. M., Boyko, V., Dinh, M. T., Chen, Y. C., Fogle, H., et al. (2020). RNAseq analysis of rodent spaceflight experiments is confounded by sample collection techniques. iScience23 (12), 101733. doi:10.1016/j.isci.2020.101733
Leek, J. T., Johnson, W. E., Parker, H. S., Fertig, E. J., Jaffe, A. E., Zhang, Y., et al. (2020). sva: Surrogate Variable Analysis. R package version 3.38.0. Available at: https://bioconductor.org/packages/release/bioc/html/sva.html.
Leek, J. T., Scharpf, R. B., Bravo, H. C., Simcha, D., Langmead, B., Johnson, W. E., et al. (2010). Tackling the widespread and critical impact of batch effects in high-throughput data. Nat. Rev. Genet.11 (10), 733–739. doi:10.1038/nrg2825
Leek, J. T., and Storey, J. D. (2007). Capturing heterogeneity in gene expression studies by surrogate variable analysis. PLoS Genet.3 (9), e161–e1735. doi:10.1371/journal.pgen.0030161
Love, M. I., Huber, W., and Anders, S. (2014). Moderated estimation of fold change and dispersion for RNA-seq data with DESeq2. Genome Biol.15 (12), 550. doi:10.1186/s13059-014-0550-8
Malkani, S., Chin, C. R., Cekanaviciute, E., Mortreux, M., Okinula, H., Tarbier, M., et al. (2020). Circulating miRNA spaceflight signature reveals targets for countermeasure development. Cell. Rep.33 (10), 108448. doi:10.1016/j.celrep.2020.108448
Manimaran, S., Selby, H. M., Okrah, K., Ruberman, C., Leek, J. T., Quackenbush, J., et al. (2016). BatchQC: Interactive software for evaluating sample and batch effects in genomic data. Bioinformatics32 (24), 3836–3838. doi:10.1093/bioinformatics/btw538
Okrah, K., and Corrada Bravo, H. (2015). Shape analysis of high-throughput transcriptomics experiment data. Biostatistics16 (4), 627–640. doi:10.1093/biostatistics/kxv018
Oseni, S. O., Adebayo, O., Adebayo, A., Kwakye, A., Pavlovic, M., Asghar, W., et al. (2021). Integrative genomic and epigenomic analyses identified IRAK1 as a novel target for chronic inflammation-driven prostate tumorigenesis. Available at: https://www.biorxiv.org/content/10.1101/2021.06.16.447920v1 (Accessed June 16, 2021).
Pecaut, M. J., Mao, X. W., Bellinger, D. L., Jonscher, K. R., Stodieck, L. S., Ferguson, V. L., et al. (2017). Is spaceflight-induced immune dysfunction linked to systemic changes in metabolism?PloS one12 (5), e0174174. doi:10.1371/journal.pone.0174174
R Core Team (2021). R: A language and environment for statistical computing. Available at: https://www.R-project.org/.
Ray, S., Gebre, S., Fogle, H., Berrios, D. C., Tran, P. B., Galazka, J. M., et al. (2019). GeneLab: Omics database for spaceflight experiments. Bioinformatics35 (10), 1753–1759. doi:10.1093/bioinformatics/bty884
Rettig, T. A., Ward, C., Pecaut, M. J., and Chapes, S. K. (2017). Validation of methods to assess the immunoglobulin gene repertoire in tissues obtained from mice on the international space station. Gravitational space Res.5 (1), 2–23.
Rizzo, A. M., Corsetto, P. A., Montorfano, G., Milani, S., Zava, S., Tavella, S., et al. (2012). Effects of long-term space flight on erythrocytes and oxidative stress of rodents. PloS one7 (3), e32361. doi:10.1371/journal.pone.0032361
Ronca, A. E., Moyer, E. L., Talyansky, Y., Lowe, M., Padmanabhan, S., Choi, S., et al. (2019). Behavior of mice aboard the international space station. Sci. Rep.9 (1), 4717. doi:10.1038/s41598-019-40789-y
Shen, H., Lim, C., Schwartz, A. G., Andreev-Andrievskiy, A., Deymier, A. C., and Thomopoulos, S. (2017). Effects of spaceflight on the muscles of the murine shoulder. FASEB J. official Publ. Fed. Am. Soc. Exp. Biol.31 (12), 5466–5477. doi:10.1096/fj.201700320r
Smith, R., Cramer, M., Globus, R., and Galazka, J. (2017). OSD-137: Rodent Research-3-CASIS: Mouse liver transcriptomic, proteomic, and epigenomic data. Available at: https://osdr.nasa.gov/bio/repo/data/studies/OSD-137 (Accessed March 4, 2017).
Tascher, G., Brioche, T., Maes, P., Chopard, A., O’Gorman, D., Gauquelin-Koch, G., et al. (2017). Proteome-wide adaptations of mouse skeletal muscles during a Full month in space. J. proteome Res.16 (7), 2623–2638. doi:10.1021/acs.jproteome.7b00201
Ward, C., Rettig, T. A., Hlavacek, S., Bye, B. A., Pecaut, M. J., and Chapes, S. K. (2018). Effects of spaceflight on the immunoglobulin repertoire of unimmunized C57BL/6 mice. Life Sci. space Res.16, 63–75. doi:10.1016/j.lssr.2017.11.003
Zhang, Y., Jenkins, D. F., Manimaran, S., and Johnson, W. E. (2018). Alternative empirical Bayes models for adjusting for batch effects in genomic studies. BMC Bioinforma.19 (1), 262. doi:10.1186/s12859-018-2263-6
Keywords: RNA-seq, batch effect correction, NASA genelab, space biology, transcriptomics, combat, combat-seq, MBatch
Citation: Sanders LM, Chok H, Samson F, Acuna AU, Polo S-HL, Boyko V, Chen Y-C, Dinh M, Gebre S, Galazka JM, Costes SV and Saravia-Butler AM (2023) Batch effect correction methods for NASA GeneLab transcriptomic datasets. Front. Astron. Space Sci. 10:1200132. doi: 10.3389/fspas.2023.1200132
Received: 04 April 2023; Accepted: 10 May 2023;
Published: 01 June 2023.
Edited by:
Joseph Borg, University of Malta, MaltaReviewed by:
Nathaniel J. Szewczyk, Ohio University, United StatesJosef Borg, University of Malta, Malta
Copyright © 2023 Sanders, Chok, Samson, Acuna, Polo, Boyko, Chen, Dinh, Gebre, Galazka, Costes and Saravia-Butler. This is an open-access article distributed under the terms of the Creative Commons Attribution License (CC BY). The use, distribution or reproduction in other forums is permitted, provided the original author(s) and the copyright owner(s) are credited and that the original publication in this journal is cited, in accordance with accepted academic practice. No use, distribution or reproduction is permitted which does not comply with these terms.
*Correspondence: Amanda M. Saravia-Butler, YW1hbmRhLm0uc2FyYXZpYS1idXRsZXJAbmFzYS5nb3Y=