 Valerio Acocella
 Marco Neri
 Boris Behncke
 Alessandro Bonforte
 Ciro Del Negro
 Gaetana Ganci
- 1Dipartimento di Scienze, Università degli Studi Roma Tre, Roma, Italy
- 2Istituto Nazionale di Geofisica e Vulcanologia, Sezione di Catania, Osservatorio Etneo, Catania, Italy
Mature volcanoes usually erupt from a persistent summit crater. Permanent shifts in vent location are expected to occur after significant structural variations and are seldom documented. Here, we provide such an example that recently occurred at Etna. Eruptive activity at Mount Etna during 2007 focused at the Southeast Crater (SEC), the youngest (formed in 1971) and most active of the four summit craters, and consisted of six paroxysmal episodes. The related erupted volumes, determined by field-based measurements and radiant heat flux curves measured by satellite, totalled 8.67 × 10⁶ m3. The first four episodes occurred, between late-March and early-May, from the summit of the SEC and short fissures on its flanks. The last two episodes occurred, in September and November, from a new vent (“pit crater” or “proto-NSEC”) at the SE base of the SEC cone; this marked the definitive demise of the old SEC and the shift to the new vent. The latter, fed by NW-SE striking dikes propagating from the SEC conduit, formed since early 2011 an independent cone (the New Southeast Crater, or “NSEC”) at the base of the SEC. Detailed geodetic reconstruction and structural field observations allow defining the surface deformation pattern of Mount Etna in the last decade. These suggest that the NSEC developed under the NE–SW trending tensile stresses on the volcano summit promoted by accelerated instability of the NE flank of the volcano during inflation periods. The development of the NSEC is not only important from a structural point of view, as its formation may also lead to an increase in volcanic hazard. The case of the NSEC at Etna here reported shows how flank instability may control the distribution and impact of volcanism, including the prolonged shift of the summit vent activity in a mature volcano.
Introduction
Mature stratovolcanoes or composite volcanoes usually erupt from a persistent summit crater. Indeed, most volcanic edifices do not show variations in the location of summit volcanism, constantly erupting from the same vent, and especially on the short-term (100 of years or less). This persistency may be found also after major eruptions, and even when these are associated with important structural variations, as the development of sector collapses, as for example at Bezymianny in 1956 and at Mount St. Helens in 1980 (e.g., Belousov et al., 2007, and references therein). Of course, monogenic dike-fed eruptive fissures on the volcano flanks may develop at any time (Acocella and Neri, 2009, and references therein); however, these eruptions are usually not accompanied by permanent variations in the location of summit activity, so that future eruptions may be expected to occur again from the same summit vent.
Despite this persistency, the geological record of some active volcanoes, not only with calderas, as Sakurajima and Aso (Japan) or Okmok (Aleutians), but also including large edifices, as Etna, show a more complicated eruptive pathway; this displays multiple permanent (associated with stable polygenetic activity) craters or cones, suggesting that the location of volcanism within the edifice may vary. However, on the short term (decades or less) there is poor direct witnessing of any permanent shift (creating a new polygenetic cone or crater) in the location of the eruptive vents within a volcano. The rarity of such occurrence also underlines the difficulty in detecting and understanding the possible processes responsible for the variation in the location of volcanism, which at present remain largely elusive.
Possibly, one of the best-documented shifts in volcanic activity has recently occurred at Etna. Indeed, one of the most intriguing features of Etna is the growing number of its summit craters (Figure 1), which has increased from one (the former Central Crater, which had existed for many centuries; Guest, 1973) to four in an interval of just 60 years: the Northeast Crater (1911), the Voragine (1945), the Bocca Nuova (1968), and the Southeast Crater (1971) (Del Negro et al., 2013, and references therein). Since the late-1970s, the Southeast Crater (SEC) has been by far the most active, and evolved from a large collapse pit into a >200 m high cone (Behncke et al., 2006), becoming a distinctive landmark at Etna's summit from the south and the east. After an important episode of flank slip in late 2002, associated with the 2002–2003 eruption (Acocella et al., 2003; Neri et al., 2004), volcanic activity focused on the SEC and, from 2007, at a new vent at its SE base (proto-NSEC). This vent, fed by NW-SE striking dikes propagating from the SEC, formed an independent cone (the New Southeast Crater, or NSEC), starting from January 2011. The shift of the focus of activity from the SEC to the NSEC has been dealt with only marginally in studies dealing with other aspects of the activity in that period (Andronico et al., 2008; Langer et al., 2011; Behncke et al., 2014; Falsaperla et al., 2014; De Beni et al., 2015; Falsaperla and Neri, 2015), and so far remains essentially unexplained.
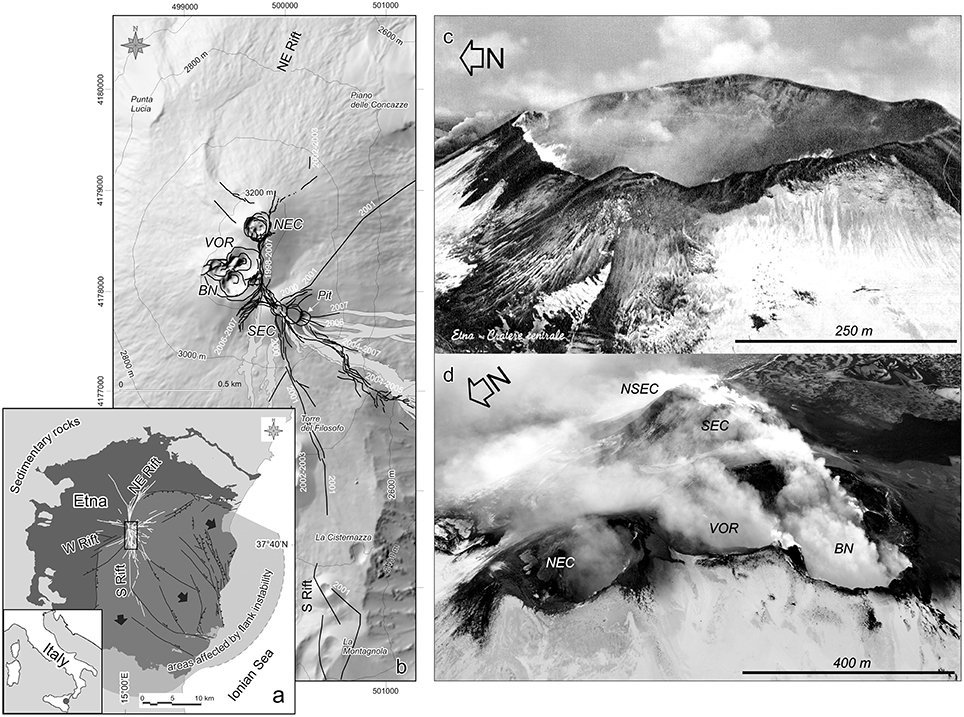
Figure 1. (A) Tectonic framework of Mount Etna, black arrows indicate the unstable eastern and southern flanks of the volcano. (B) Eruptive and dry fissures (black lines) opened at the summit of the volcano during 1998–2007, and lava flows erupted in this time interval (light gray). In the last 100 years Etna summit evolved from one Central Crater that existed in the early 20th century (C) to 5 summit craters in 2015 (D). VOR, Voragine crater; NEC, Northeast Crater; BN, Bocca Nuova crater; SEC, Southeast Crater; NSEC, New Southeast Crater. Pit, crater discontinuously active in spring 2007. Original photograph in (C) was scanned from a postcard that is out of print. The topography in (B) is based on a DEM from Bisson et al. (2016).
Here, we describe and quantify the main parameters of the eruptive activity, first at the SEC (spring 2007) and then at the proto-NSEC (summer-fall 2007), using field and satellite data to calculate eruption rates and volumes. Then, using field structural and geodetic (GPS) data, we provide an explanation for the development of the NSEC. In particular, our study at Etna shows how flank instability may control the distribution of volcanism, including the prolonged shift of the summit vent activity at a mature stratovolcano. Overall, this study provides one of the few cases of monitored variation in the location of activity on the summit of a volcanic edifice.
Recent Evolution and Dynamics of Etna
Since the second half of the 20th century, Etna's eruptive activity has undergone several notable changes. Firstly, it has intensified in terms of eruption frequency, long-term average eruption rate, and explosivity, which is most clearly recently expressed in the occurrence of two explosive flank eruptions (2001 and 2002–2003; Acocella and Neri, 2003; Andronico et al., 2005), and an increasing number of strongly explosive eruptions (“paroxysms”) at the summit craters (Allard et al., 2006, and references therein). This activity has been accompanied, in 2001–2010, by accelerated flank instability in the eastern to southern sectors of the volcano (Neri et al., 2004; Neri and Acocella, 2006; Bonforte et al., 2007; Falsaperla et al., 2010). This instability may have been caused by the pressurization induced by rapid and voluminous magma accumulation within and below the edifice (Allard et al., 2006), and may have been the most significant event of this type at Etna for many decades or more. During the 2001 and 2002–2003 eruptions and the flank slip episode, the shallow central conduit system—i.e., the magma pathways leading to the summit craters—was disrupted; activity ceased at the SEC for 5 years, whereas the Bocca Nuova remained largely inactive until 2011, and the Voragine reactivated only in 2013, after more than 13 years of quiescence.
In addition, one of the most peculiar characteristics in the recent change of Etna's dynamics is the appearance of numerous, prolonged series of paroxysmal eruptive episodes at the summit craters since the mid-1960s. Such events had previously occurred once or twice per decade (Behncke and Neri, 2003), but at the turn of the millennium they had become the most characteristic eruptive manifestation at Etna. In particular, out of a total of about 150 paroxysmal eruptive episodes at the summit craters between 1995 and 2001, 105 occurred at the SEC (Behncke et al., 2006). Many of the paroxysms at the SEC were characterized by activity from vents not only at its summit, but also from fissures extending down its north-eastern and southern flanks. This trend remained remarkably stable during the exceptional series of paroxysms in 2000 (Alparone et al., 2003; Behncke et al., 2006) and another sequence of paroxysms in 2001 (Figure 2A). In contrast, renewed episodic activity at the SEC in 2006 involved the opening of new vents and fissures on its SE, WNW, and W flanks (Neri et al., 2006; Behncke et al., 2008), marking a rotation by about 90° of the main structural trend at the SEC (Figure 2A). In late-2004, during a long-lived effusive lateral eruption from vents to the east of the SEC, a collapse pit opened on its eastern slope (Neri and Acocella, 2006). This pit was filled by renewed activity from the SEC in the fall of 2006 (Behncke et al., 2008), but a new collapse pit formed toward the end of this activity, only to be filled again by renewed SEC activity in the spring of 2007 (Behncke et al., 2014).
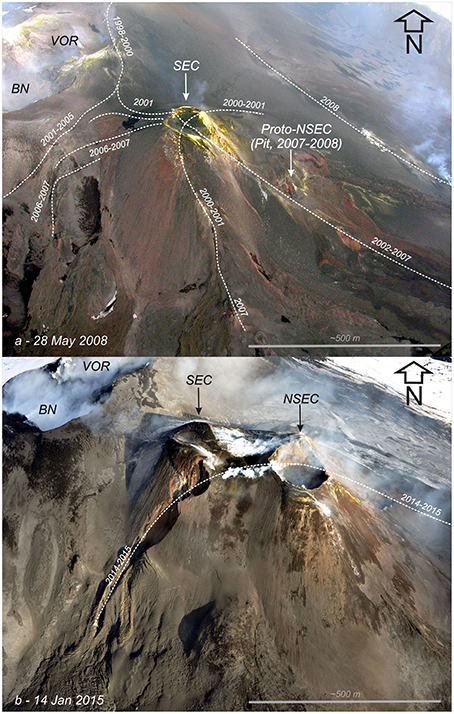
Figure 2. Morpho-structural evolution of the Southeast Crater (SEC) zone in the last decade, interpreting the aerial view from SE taken from a helicopter of the Italian Civil Defense (A) and of the Italian Coast Guard (B). The main eruptive and dry fissures and their age are marked by white dotted lines. (A) Location of the “pit crater,” formed in the spring of 2007, is the same of the “proto-NSEC” active since autumn 2007. (B) The proto-NSEC then evolved into the New Southeast Crater (NSEC), whose cone grew through several tens of paroxysmal eruptions since January 2011.
Finally, another pit crater formed on the lower east flank of the SEC cone in mid-May 2007 (Figure 2A), and 3 months later this became the focus of renewed eruptive activity, marking a definitive shift from the SEC to the vent which later would became known as the New Southeast Crater (NSEC, Figure 2B). Since this pit crater underwent further changes after the 2007 activity, which is described in detail below, we refer to it as “proto-NSEC” to distinguish it from the cone (the NSEC) that started properly growing during the eruptive period initiated in January 2011 (Figure 2).
Methods
Field Observations
Field observations, consisting of volcanological and structural data, were directly acquired in the field since the 1990s and have been integrated by the image analysis of the INGV camera network and by aerial photos taken from helicopters of the Italian Civil Defense and the Italian Coast Guard. Field observations and volcanological and structural mapping consisted of measurements of lava flow fields, eruptive/dry fractures and faults aided by hand-held GPS (lat/lon precision up to 2–4 m). The birth and growth of the NSEC have been documented in detail with the aid of range-finding binoculars connected to GPS (Behncke et al., 2014), as well as LiDAR surveys carried out in 2007 and 2010 (Behncke et al., 2016), and aerophotogrammetry acquired in 2012 and 2014 (De Beni et al., 2015).
Thermal Satellite Data
Satellite data processing techniques have proved well suited to complement field observations for timely detection of eruptive events, as well as extraction of parameters allowing lava flow tracking. Satellite imagery can provide a better understanding of eruptive activity simply by producing more frequent observations at a wide variety of wavelengths. In particular, in the case of short-lived events like lava fountaining episodes, geostationary satellites, with 15 min sample time, provide a unique opportunity to follow the fast evolution of the event from space.
As for the 2007 lava fountains at Mt Etna, data acquired by MODIS (Moderate Resolution Imaging Spectroradiometer) aboard EOS polar-orbiting satellites, and SEVIRI (Spinning Enhanced Visible and InfraRed Imager) aboard the geostationary satellites MSG, were processed via the HOTSAT multiplatform system (Ganci et al., 2011b, 2015). HOTSAT can detect thermal anomalies over volcanic areas and quantify the entity of thermal activity by means of the radiant heat flux computation. Weather conditions play an important role in volcanic activity detection and quantification from satellite, which is the reason why HOTSAT includes a cloud detection algorithm based on textons (Ganci et al., 2011a) and, for each processed images, it provides as output a cloud coverage index. A cloud coverage index equal to 1 means that all the pixels inside the volcanic area are flagged as cloudy; whereas an index of 0 means that no cloudy pixels are detected in the volcanic area. HOTSAT discards those images showing a cloud index >0.5, while a plot of the cloud index is provided with the radiant heat flux to visually check if an attenuated or missing thermal anomaly is due to cloud partial or total obscuration. The system is currently operational on Etna and Stromboli and was tested versus ground-based thermal camera measurements acquired on Etna (Ganci et al., 2013) and on the Nyiragongo lava lake (Spampinato et al., 2013).
Geodetic Data
Ground deformation measurements collected by GPS surveys carried out with the periodic network at Etna from 2005 to 2015 have been exploited to analyse the long-term strain affecting the volcano edifice, with particular focus on its summit. GPS data collected during the surveys, passing through a N-S profile crossing the volcano summit (Puglisi et al., 2004; Puglisi and Bonforte, 2004; Bonforte et al., 2009), allowed strain calculation. Geodetic measurements on the summit part of Etna are possible only in the summer, due to the snow cover during the rest of the year that prevents the access to the highest GPS points. The ground deformation here analyzed has been previously described in terms of displacements of the measurement stations (Bonforte et al., 2008, 2013; Bonaccorso et al., 2011, 2015). Conversely, here we calculate the horizontal strain tensor components by the GridStrain routine developed by Pesci and Teza (2007), already used for investigating the surface deformation of the eastern flank of Etna by Alparone et al. (2011). This algorithm allows us to analyse the strain tensor distribution over an area covered by a geodetic network, starting from station displacements. In our case, a 1500 m spaced grid was set up covering the Etna GPS network and a 2D strain tensor was then calculated at each node of the grid for every subsequent 1-year period from 2005 to 2015.
Results
From SEC to Proto-NSEC: the 2007 Eruptive Activity
The eruptive activity of the SEC in 2007 marks the important shift in the location of volcanism from the SEC to the proto-NSEC and, as such, it is here considered in detail. This activity occurred in two distinct phases. The first lasted from late March until early May and consisted of four paroxysmal episodes (29 March, 11 April, 29 April, and 6–7 May; Figures 3, 4A–D) from the SEC and its flanks, including the proto-NSEC. The first of these was probably the most violent explosive paroxysm at the SEC since 2000, with sustained lava fountaining and a tephra column that produced widespread ash and lapilli falls to the northeast, but its main phase lasted < 1 h. The next three eruptive episodes showed a tendency of the activity to become progressively less explosive and more effusive, lasting longer (up to ~13 h, see Table 1). This phase of activity was followed, in mid-May, by the formation of the new collapse pit (proto-NSEC) on the lower ESE flank of the SEC cone. The second phase of activity is characterized only by the activity from the proto-NSEC, without any contribution from the SEC. This second phase started with minor ash emissions from the proto-NSEC in mid-August, and culminated in two episodes of sustained lava fountaining, tephra emission and production of lava flows, on 4–5 September and 23–24 November 2007 (Figures 3, 4E,F). A third paroxysmal eruptive episode, which took place on 10 May 2008, marks the end of the second phase of activity and was followed 3 days later by the onset of Etna's latest flank eruption to date (13 May 2008–6 July 2009). Renewed episodic activity that has been occurring since January 2011 is considered the onset of the phase that has morphologically built the cone, now known as the NSEC, from the proto-NSEC (see Section From Proto-NSEC to NSEC).
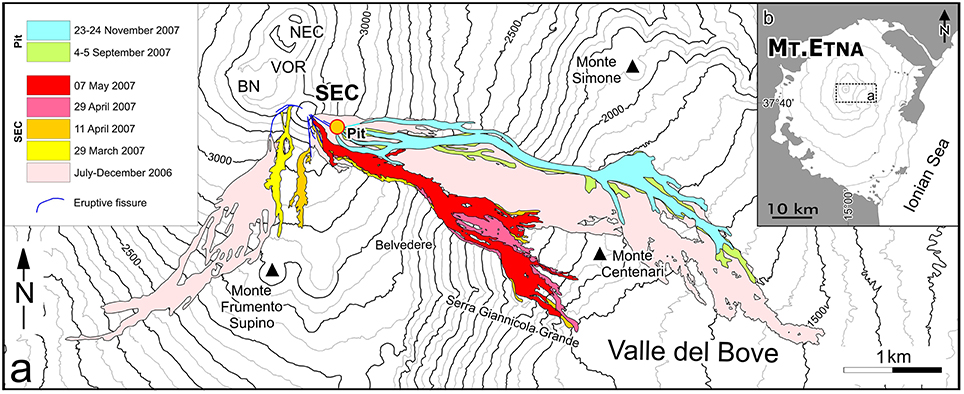
Figure 3. (A) Map of Etna's summit area and upper south and east flanks, showing lava flows emitted during 2007 in different colors and 2006 lavas in Pink. (B) Inset shows the location of the area in (A).
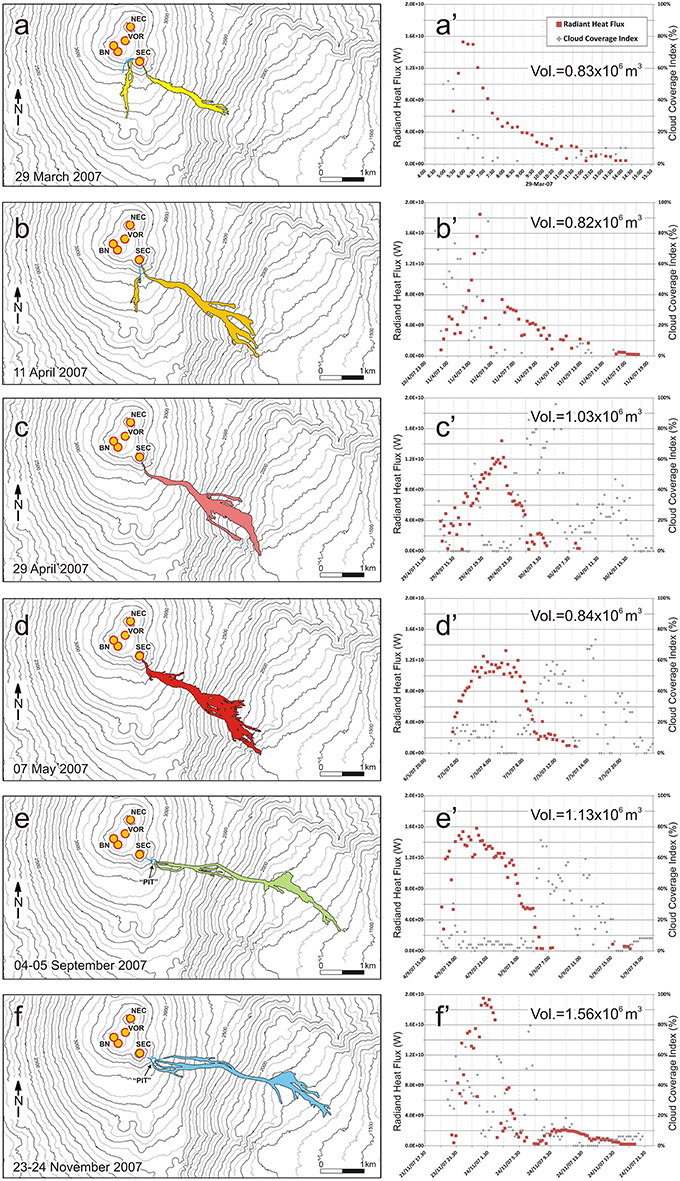
Figure 4. Lava flow maps (A–F) and radiant heat flux curves (A'–F') for the six paroxysmal eruptive episodes at the Southeast Crater and proto-NSEC in 2007.
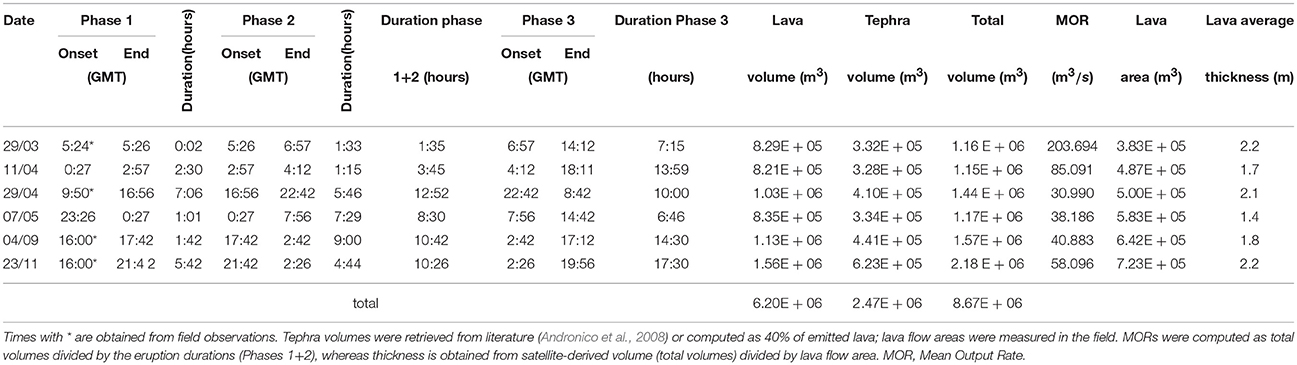
Table 1. Lava fountain durations and volumes as retrieved from SEVIRI data.
Phase 1
29 March Paroxysm
The first of the four eruptive episodes in the spring of 2007 occurred on the morning of 29 March and was probably the most violent paroxysm at the SEC since 2000. The start of the activity at 0524 (GMT = local time-2h) was marked by a sharp increase in the volcanic tremor amplitude. Shortly thereafter, lava fountaining from the summit vent of the SEC reached heights of 600–800 m, and a tephra column rose to several kilometers above the summit, feeding a plume that drifted NE and caused ash and scoria falls at ~6 km from the SEC, and as far as 35 km from Etna's summit (Andronico and Cristaldi, 2007). Fine ash was reported even in southern Calabria, more than 80 km away.
During the climactic activity, lava emission started from two vents located at 3200 and 3190 m above sea level W and SW of the SEC, feeding flows partially overlapped that advanced 1.25 km to the plain between Etna's summit cone complex and the Torre del Filosofo site (Figures 1, 4A). A decrease in the intensity of Strombolian explosions was evident by 0641, marking the imminent cessation of activity. Activity at the SEC summit had diminished to sporadic Strombolian explosions and emission of an ash column, although lava continued to flow through a channel carved into the SE flank of the SEC cone, and then down the steep slope toward the Valle del Bove, that advanced up to 2.35 km from the vent. Here, the lava flow went into contact with snow, producing phreatomagmatic explosions, which in turn produced pyroclastic density currents that sped down the slope. During the following 2 weeks, the volcanic tremor curve showed significant periodic increases similar to the signal accompanying the 29 March paroxysm, but none of these were accompanied by any visible eruptive activity. These events were interpreted as “failed” eruptions by Falsaperla et al. (2014).
11 April Paroxysm
The first signs of the second paroxysm from SEC in 2007 were recorded as a thermal anomaly evident in satellite imagery at 0027 GMT on 11 April. Like its predecessor, this paroxysm was characterized by lava fountaining, lava flow emission, and generation of a tephra column, which this time was driven to the SE, causing tephra falls up to the coastline. Lava was at first emitted from the summit through the channel in the SE flank, and followed a similar path as the 29 March main flow (Figure 4B).
Between 0200 and 0300 the activity continued to increase in vigor, and a shift in the wind direction caused ash falls further north. At the peak of the activity, between 0257 and 0412, a short eruptive fissure opened on the lower south flank of the SEC cone, producing fountains from a number of aligned vents and a lava flow, which advanced across the snow-covered plain to the south of the cone (Figure 4B). Explosive interaction between lava, snow and meltwater occurred while the flow extended southward, until it stopped at a distance of 0.93 km from its source. The activity at this new fissure lasted only a few hours, and by early morning the paroxysm was over, although both the lava flow to the south and the longer (3.55 km long) flow toward the Valle del Bove continued to advance for several hours during the morning and afternoon of 11 April.
29 April Paroxysm
The third paroxysm in the spring of 2007 started from the SEC during the late forenoon of 29 April, from 0950 GMT onward. The eruptive activity increased much more gradually than the early stages of the previous two paroxysms, and it was in full swing by the late afternoon. Explosive activity occurred from several closely spaced vents at the summit of the SEC cone, consisting of nearly continuous strong Strombolian bursts, and a rather dilute tephra column rose a few 100 m above the summit. Lava was delivered from a vent located immediately below the summit of the SEC cone, in a notch that lay at the head of the deep channel carved into the SE flank of the cone during the 2006 activity. The lava flow followed the same path as the main flows of 29 March and 11 April, splitting into numerous branches on the slope before reaching the bottom of the Valle del Bove late that evening, at about 3.6 km from the source (Figure 4C). Strombolian activity and lava emission continued until 2242, after which the activity decreased.
7 May Paroxysm
The last of the four paroxysms in the spring of 2007 started shortly before midnight on 6 May, with the onset of Strombolian explosions from a cluster of vents aligned along a short (a few tens of meters long) fissure on the upper SE flank of the SEC cone and at the summit. The climax phase began at 0027 on 7 May, and a lava flow issued from the lower end of the fissure, following the path of the previous lava flows in the direction of the Valle del Bove, reaching a maximum length of 3.38 km (Figure 4D). The activity continued at relatively constant levels until 0756, after which the volcanic activity rapidly decreased.
For several weeks, one vent located at the upper end of the 7 May fissure, just below the notch in the SE rim of the crater, was seen to be incandescent at night. In mid-May, a new collapse pit formed on the ESE flank of the SEC cone, in a somewhat lower position than the preceding collapse pits of 2004–2005 and fall 2006. This pit-crater marks the onset of formation of the “proto-NSEC.” Ash emissions from this pit occurred on 20 and 24 May, after which there were no eruptive manifestations until mid-August.
Phase 2
On the morning of 15 August, the newly formed proto-NSEC, on the ESE flank of the SEC cone, showed unusual emissions of white vapor, followed in the afternoon by a few bursts of brownish ash. From this moment, the eruptive activity focused at this vent only, without any contribution of the SEC. Similar emissions occurred during the following days, and by 20 August some incandescence could be observed in the emissions at night. From then until the end of August, the explosive activity progressively increased; from the 26th onward the ash content in the emissions decreased and the activity eventually became purely Strombolian. During the first days of September, the explosions produced detonations audible to tens of kilometers away, and sprays of incandescent bombs often fell all over the SEC cone and to distances of several 100 m from its base. Finally, a further increase of the eruptive activity started on the mid-afternoon of 4 September, around 1400 GMT on that day.
4–5 September Paroxysm
The start of sustained lava fountaining from the proto-NSEC (“Pit” in Figure 4E) occurred during cloudy weather sometime around 1600 GMT. Soon thereafter, a dark tephra plume rose above the weather clouds and drifted eastward, causing ash falls in areas close to the coastline. When weather clouds finally cleared away at nightfall, a robust jet of incandescent lava was shooting to heights of 400-600 m above the vent, and lava spilled over the rim of the active vent in two places, feeding a flow that advanced toward the Valle del Bove. This activity continued without significant changes for the next ~9 h, with the lava fountain remaining remarkably stable, and lava advancing 4.6 km across the Valle del Bove, mostly on top of October-December 2006 lavas (Figure 4E). At 0242 a decrease in the eruptive intensity was observed; the lava fountain became discontinuous before the end of the paroxysm and was marked by a series of detonations, which launched meter-sized bombs all over the SEC cone.
23–24 November Paroxysm
Following about 2 months of intermittent explosive activity from the proto-NSEC that had been active in August-September, Strombolian explosions began to increase on 22 November. At about 1600 GMT on the following day, a series of explosions from the Bocca Nuova produced dark ash plumes; these were followed by an increase in the intensity of Strombolian activity at the SEC. Between 2030 and 2142, the Strombolian activity passed into sustained fountaining, and lava flowed over the vent's rim in three places, feeding flows toward the ESE and SE (Figure 4F). Overall, this paroxysm was similar to that of 4–5 September, except for the following: (a) the fountain was often V-shaped, due to the presence of two closely-spaced vents, (b) the tephra plume was driven NNE, (c) the lava traveled less (~4 km), largely on top of the 4–5 September flow, and (d) the duration of the paroxysm was 5 h. Like its predecessor, the closing stage of the paroxysm at around 0226 was characterized by bursts of incandescent bombs resembling fireworks and causing detonations.
From Proto-NSEC to NSEC
A third paroxysmal episode from the proto-NSEC occurred on the afternoon of 10 May 2008. This event was less well observed than its two predecessors, because satellite data are sketchy due to dense cloud cover. This paroxysm erupted 5.73 × 10⁶ m3 of lava (Behncke et al., 2016), and was followed 3 days later by the onset of Etna's latest flank eruption to date (13 May 2008–6 July 2009; Bonaccorso et al., 2009).
Following the long-lived flank eruption of 2008–2009, the proto-NSEC showed occasional signs of reactivation, and its diameter was significantly widened by collapse and by the formation of an additional, but smaller, collapse pit on its eastern rim in November 2009, which soon merged with the proto-NSEC (Behncke et al., 2014, 2016).
Since January 2011, the pit-crater of the proto-NSEC started to build-up a relief (a cone) evolving into the NSEC. The NSEC has been the site of more than 50 eruptive episodes, but since late-2013 there has been a tendency for such episodes to last longer and be less explosive (De Beni et al., 2015). As this new cone began to grow around its eruptive vent, it became evident that the NSEC had permanently taken over the role of Etna's most active summit crater from the SEC.
As of 2016, the NSEC cone, which was built up on sloping terrain, stood at 250–300 m above the former surface, rivaling in height its older “sibling,” which it has partly overgrown. Its volume (50 × 106 m3 as of October 2014; De Beni et al., 2015) is somewhat inferior to that of the old SEC (72 × 106 m3; Behncke et al., 2006), but nearly all of it was constructed in < 3 years. Much of its activity involved the opening of eruptive fissures on the flanks of NSEC growing cone, first seen in August 2011. Between August 2011 and April 2013, much of this activity focused along a NW–SE striking fissure, precisely following the structural axis along which the shift from the SEC to the NSEC had occurred. As the NSEC grew more mature, eruptive vents and fissures opened also into other directions, namely to the SW, SSE, E, and NE of the NSEC.
Erupted Volumes in 2007 from Satellite Data
The six lava fountaining episodes that occurred at Etna during 2007 were detected and monitored by the HOTSAT system. Radiant heat flux curves, as well as cloud coverage index are given for each event in Figures 4A′–F′. Radiant heat flux curves generally show peak values around 16 GW during the climax of each event, except for those recorded on 11 April and 23 November, which are close to 20 GW.
These short-lived explosive events show the same features in the thermal signal we recorded during the 13 May 2008 and 2011–2013 lava fountaining episodes at Etna (Bonaccorso et al., 2011; Ganci et al., 2012). Three main phases can be recognized during each episode in the radiant heat flux curve. A first phase that includes the onset of thermal activity and a slow increase of the radiant heat flux; a second phase with scattered high levels of signal, often accompanied by saturated pixels in the MIR (medium infrared) images is linked to the main fountaining phase; and a third phase in which the signal slowly decreases and that is related to the cooling of the lava flow. Table 1 shows the timing of the different phases for each of the six eruptive episodes in 2007. The duration of the three phases is highly variable, spanning from impulsive events like the one on 29 March, where the first phase is nearly missing and the lava fountaining is brief, to longer events like that on 23 November, in which both the preparatory phase and the fountaining lasted about 5 h, respectively, with a cooling phase of about 17 h.
Since during this type of short-lived events no steady thermal state is reached, the simple conversion between lava flow area and time averaged discharge rate (TADR) cannot be applied (Garel et al., 2015). Therefore, in order to compute the lava volume, we applied the approach of Ganci et al. (2012) by modeling the cooling curve (phase 3) apparent in thermal data acquired by SEVIRI. We take the measured cooling curve and fit this to a theoretical cooling curve. Best fit is achieved by adjusting the area of cooling lava until the measured and theoretical curves match. This technique was tested using ground-based thermal camera images collected during the 12 August 2011 event (Ganci et al., 2013), and the volumes found for all the 2011–2013 events at Etna are in good agreement with field measurements (Behncke et al., 2013; De Beni et al., 2015) and strain meter data processing results (Bonaccorso and Calvari, 2013). Applying the cooling curve modeling we retrieve the lava volume for the six events spanning from 1.15 to 2.18 × 10⁶ m3, as given in Table 1.
The Geodetic Frame
The strain tensor evolution around the summit craters and, especially, at the location of SEC and NSEC, shows that, after the deflation accompanying the 2004–2005 eruption (Bonaccorso et al., 2006), an inflation was recorded by the GPS surveys (Bonforte et al., 2008). This inflation produced a dilatation of the summit area and, in particular, in the location of the future NSEC (Figure 5A), where an overall NE–SW dilatation of approximately 10 ppm is evident. It is remarkable that the pit crater, which later evolved in the proto-NSEC and finally in the NSEC, opened during this period. The eruptive activity that accompanied and followed the opening of this pit-crater on the eastern flank of SEC in 2007 produced a deflation of the volcano, but the contraction on the summit area was minor (around 2 ppm; Figure 5B), especially if compared to the previous dilatation (more than 10 ppm; Figure 5A). More significant contraction is visible on the NE flank of the volcano, across the easternmost segment of the Pernicana Fault System (Barreca et al., 2013), but this is a recurrent deformation in this sector of the fault (Bonforte et al., 2007). Later on, from 2007 to 2008, a significant NE–SW stretching of more than 40 ppm of the entire volcano summit has been recorded (Figure 5C); this is associated with the intrusion of the NNW-SSE oriented dike on 13 May 2008 that fed the lateral eruption on the upper eastern flank until July 2009 (Bonaccorso et al., 2011; Bonforte et al., 2013). This lateral eruption produced an overall deflation of the edifice but, again, no significant contraction is visible at summit (Figure 5D). Once the lateral eruption ended, the volcano inflated again and a homogeneous dilatation is visible on the summit and around the NSEC area after 2009, more intense in 2010 (Figure 5E), but continuing until 2011 (Figure 5F). From 2011, an overall deflation has been measured, with contraction of the summit area. The contraction of the summit was stronger (~7 ppm) until 2012, and ENE–WSW-oriented (Figure 5G), but it progressively decreased to about 3–4 ppm in the following year (Figure 5H) to almost disappear after 2013 (Figure 5I). Finally, during 2014–2015, dilatation reappeared, but it affected mostly the southern portion of the summit area, with a NW-SE orientation (Figure 5J). This may have prepared the ground for the NE–SW-striking dike intrusion accompanying the paroxysmal episode at the NSEC on 28 December 2014 (Bonforte and Guglielmino, 2015).
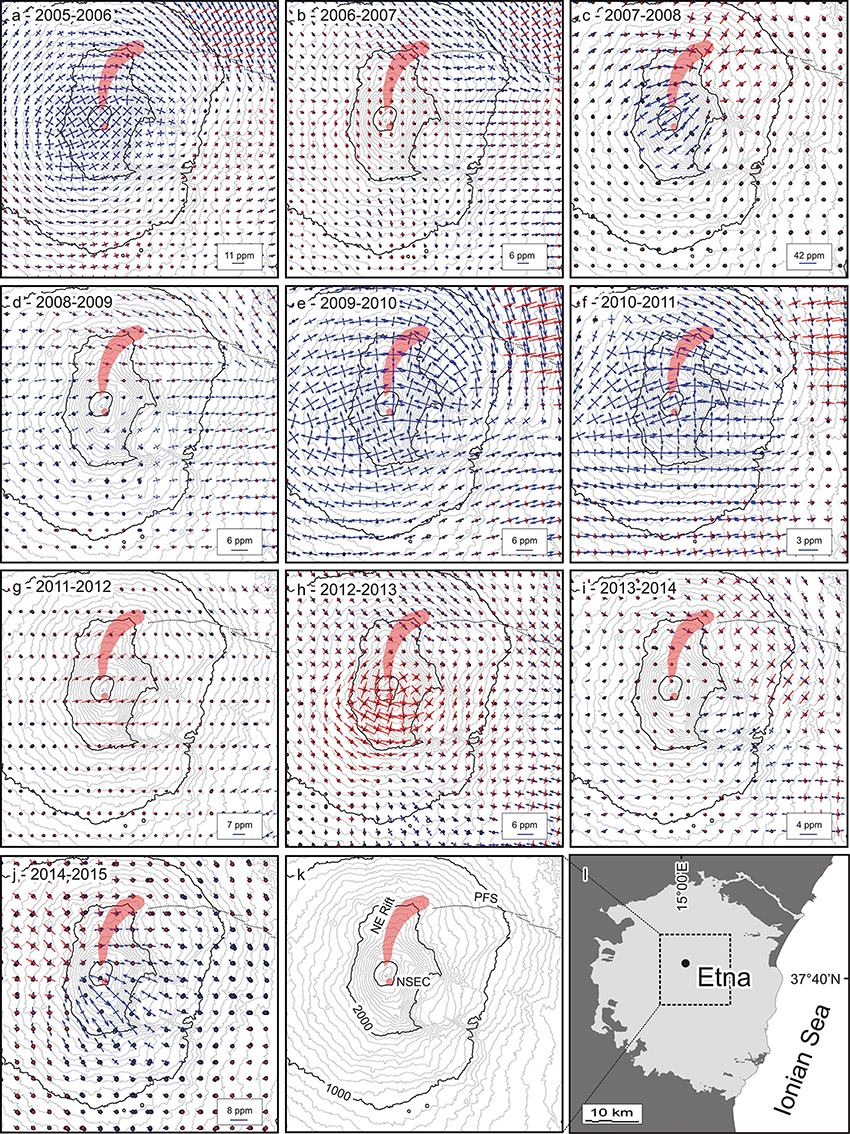
Figure 5. Maps of the horizontal strain tensors distribution above Mt. Etna for subsequent 1-year (from June to the successive June) intervals (A–J). Blue axes are for dilatation, red for contraction. Red shadowed areas indicate the location of NE-Rift and New Southeast Crater NSEC (K) in the frame of the volcanic edifice (L). Dashed lines (in A–K) mark the Pernicana Fault System (PFS), from Barreca et al. (2013).
Discussion
From SEC to NSEC: Changes in the Eruptive Dynamics
Although it was only with the onset of frequent paroxysmal lava fountaining in early 2011 that the NSEC cone became definitively established as a persistent new summit vent replacing the old SEC, the transition that led to its birth and development had begun as early as 2004, when a pit-crater opened for the first time on the upper east flank of the old SEC cone (Neri and Acocella, 2006). While initially it seemed that this pit resulted from subtraction of magma from below the SEC during the 2004–2005 lateral eruption (Allard et al., 2006), hindsight suggests that it may as well have formed as a result of a more general structural reorganization in the summit area, which eventually led to the birth and establishment of the NSEC.
This process went through several stages, marked by the consecutive formation and filling of a total of four pit-craters lying progressively further southeast (Behncke et al., 2014), as well as various eruptive periods, with activity shifting forth and back between the old SEC and the position of the pit-craters, located along the axis which would be defined by the future NSEC. The first activity at the SEC after 5 years of quiescence, in July 2006, occurred from new vents that lay immediately to the SE and downslope of the first pit crater formed in late-2004, but 1 month later the activity switched back to the summit vent of the SEC. The August-December 2006 eruptive period was concentrated at the summit vent, but activity also occurred from new vents and fissures at the SE base of the SEC cone as well as to the west, in the saddle between the SEC and the Bocca Nuova, and at the southern base of the Bocca Nuova (Behncke et al., 2008; Neri et al., 2008; Favalli et al., 2010). The western vents reactivated during the 29 March 2007 lava fountaining episode, but the later paroxysms in spring 2007, especially those of 29 April and 6-7 May, produced activity exclusively from a fissure that extended for a few tens of meters (< 100 m) from the summit down the SE flank of the SEC cone.
Paroxysmal eruptive episodes with lava fountaining, eruption columns and emission of tephra and lava flows have been the hallmark of the SEC since the late-1970s, although the crater also was the site of Strombolian activity accompanied by low-rate (< 0.7 m3/s) lava effusion, as in 1984 and 1996-1998 (Neri et al., 2011). Some of the paroxysms in 1989–1990 were particularly violent and voluminous (rate >120 m3/s; Bertagnini et al., 1990; Carveni et al., 1994; Neri et al., 2011). However, the paroxysms between 1998 and 2001 were mostly rather short and small-volume events (Behncke et al., 2006), and the eruptive episodes of 2006 and March–May 2007 were similar. During all of this activity, the main vent at the summit of the SEC maintained a diameter of 50–80 m.
In contrast, the paroxysmal episodes at the NSEC have been generally more voluminous since the earliest ones (then at the proto-NSEC) on 4–5 September and 23–24 November 2007 (the 10 May 2008 paroxysm was yet more voluminous). Nearly all of the paroxysms during the long sequence initiated in January 2011 were more voluminous than the largest episodes of 1998-2001. Some of the paroxysms, especially in 2013, feature among the most powerfully explosive events (up to ~400 m3/s) at the summit of Etna of the past few centuries (Behncke et al., 2016). Finally, the width of the main vent of the NSEC has been consistently larger (a few tens of meters) than that of the SEC until 2014, when its activity showed a tendency of becoming less violent.
All this points to a significant increase in the efficiency of magma transport through the conduit—of the SEC and, moreover, of the NSEC—that may be partly due also to the dilatation in the summit area that facilitated the shift of the axis of the conduit.
Overall, the depicted volcanic activity in the last decade points out to a clear SE shift, of ~0.4 km, in the location of the eruptive vents. This occurred through the development of NW-SE striking eruptive fissures along the SE flank of the SEC, as well as of pit-craters at its base (proto-NSEC), which replaced the activity of the SEC and then evolved in the NSEC. Both the fissures and the pit-craters suggest the lateral propagation of dikes from the SEC.
Evolution of the Fracture Field and Related Stress Conditions
Previous studies (Neri and Acocella, 2006) have shown that N–S oriented fractures formed in the summit crater area since early 1998, from the NE Crater (NEC) to the Voragine Crater (VOR; Figure 6A). During July–August 1998, this fracture system enlarged, affecting a larger portion of the summit (Figure 6B). During nearly all of its paroxysmal eruptive episodes in 2000, the SEC was affected by N–S eruptive fissures, parallel to the previously formed fracture system (Figure 6C). In 2001 the N–S fractures were reactivated and, at the SEC, propagated toward SE (Figure 6D). The NW–SE fissures developed in 2004–2005 beyond the SEC, induced by the lateral propagation of NW–SE striking dikes from the SEC, are the easternmost continuation of this newly-oriented fracture field (Figure 6E). In 2006–2007 this system was reactivated several times, accompanied by effusive and explosive eruptions (Figure 6F). The final shift from the main vent of the SEC cone to the pit crater (proto-NSEC) at its SE base occurred since September 2007.
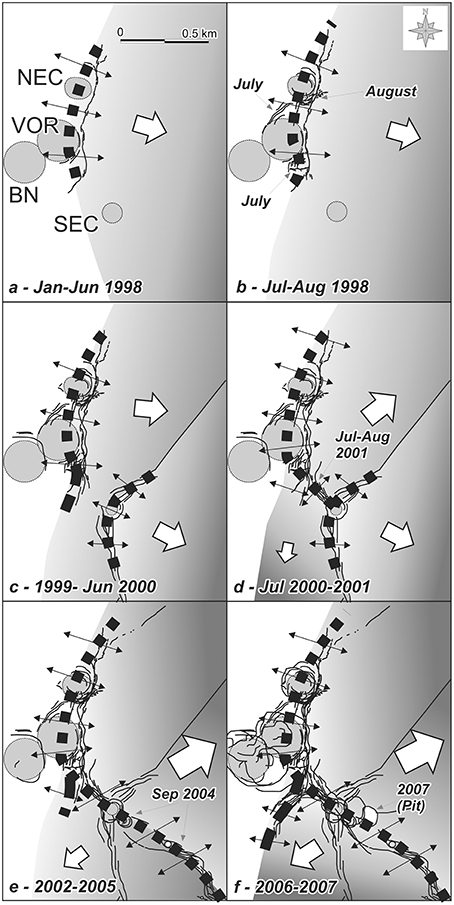
Figure 6. (A–F) Evolution of the summit deformation pattern at Etna from 1998 to 2007, involving the development of extensional fractures and normal faults (modified from Neri and Acocella, 2006).
The overall evolution of the summit fracture field seems to result from two main stress conditions. The first, active until a period between 2001 and 2004, is characterized by an overall E–W extension on the volcano summit. This condition corresponds to the presence of the stationary extensional stress field acting on the longer-term, both at the base and the summit of the volcano (e.g., McGuire and Pullen, 1989; Lanzafame et al., 1997; Solaro et al., 2010). The past decades of activity from the SEC have occurred within such a frame. Although minor shifts in the location of eruptive vents and the formation of fracture systems at the SEC have been common ever since its first eruptions in 1978–1979, the main focus of the activity has remained stable through early May 2007. It was indeed stable enough to build the large SEC cone, which is a true miniature stratovolcano (Behncke et al., 2006), with permanent summit vents and sporadically active, mostly ephemeral flank vent systems.
The second stress condition started to appear on the summit since sometime between 2001 and 2004, and has been characterized by an overall NE–SW trending extension direction (Figure 6). This extension, well-captured by the strain analysis in Figure 5A (2005) and, later, in Figure 5C (2007), was responsible for the development of the NW–SE striking fractures and fissures, as well as of the related feeder dikes, propagating from the SEC and responsible for the build-up of the NSEC (Figure 2B). The geodetic data show that the related NE–SW-oriented dilatation on the volcano summit has been transient, and mostly observed during periods of inflation (Figure 5).
It is proposed that this transient stress field results from the enhanced instability of the upper eastern flank of the volcano during inflation periods. Following the 2002–2003 eruption, the eastern flank of Etna underwent a major reorganization, with accelerated eastward slip of the area to the SW of the Pernicana Fault System (Piano Provenzana area, Figure 7; Neri et al., 2004, 2005, and references therein). In the following years, the eastward slip of the medium to lower slope immediately to the south of the Pernicana continued, promoting during periods of inflation an overall NE movement of the NE part of the summit, (Piano Provenzana area, Figure 7). In this way, this highest part of the edifice responded to the decrease in buttressing induced by the eastward slip of the medium slope of the volcano immediately to the south of the Pernicana Fault System. Therefore, the post 2002–2003 evolution of the volcano summit during periods of inflation has been characterized by an overall vortex-like kinematics, with NE trending displacement vectors from the SEC to the Piano Provenzana area, becoming E–W to the south of the central portion of the Pernicana Fault System, and then WNW–ESE in the distal portion of the volcano south of the Pernicana Fault System (Figure 7; Bonaccorso et al., 2011; Guglielmino et al., 2011; Alparone et al., 2013; Bonforte et al., 2013). This clockwise rotation of the slip vectors in the eastern flank of the volcano marks the relaxation of the significant acceleration of the instability that took place during the 2002–2003 eruption (Acocella et al., 2003). This clockwise rotation in the displacement vectors on the eastern flank of Etna may result from: (a) the curved geometry of the NE Rift—Pernicana Fault System, developing along a similar clockwise trend; (b) the presence of a topographic gradient dominated by the Etna summit (to the west-southwest) and the sea level (to the east); (c) the rotation of the displacement vectors to the side of active strike-slip faults producing earthquakes; these show motions toward the fault approaching the area epicenter, parallel to the fault nearby the epicenter and far from the fault passing the epicenter; a similar rotational pattern has been geodetically captured during recent earthquakes, as for example at the Hector Mine event in 1999 (Fialko et al., 2001).
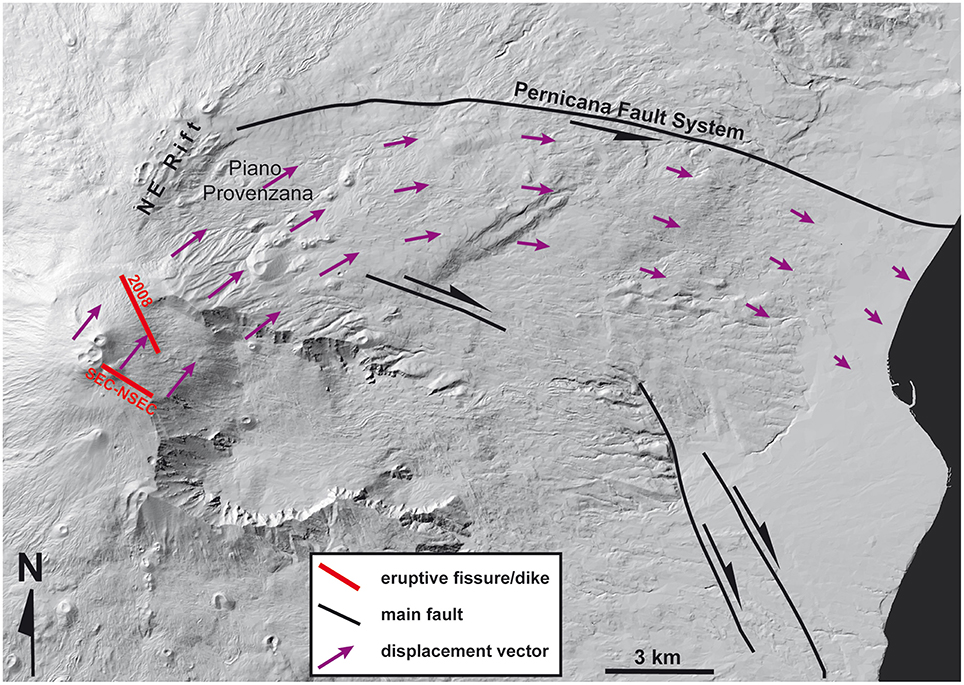
Figure 7. Schematic summary of the relationships between flank instability and the development of the recent (post-2003) eruptive fissures on the summit of Etna, during the repeated periods of inflation of the volcano. Flank instability is summarized by the direction and amount of displacement indicated by the purple arrows observed between 2003 and 2011 (based on the following sources: Figure 5 of this study; Neri et al., 2004; Solaro et al., 2010; Bonaccorso et al., 2011; Guglielmino et al., 2011; Alparone et al., 2013; Bonforte et al., 2013). The eruptive fissures refer to the dikes emplaced from the SEC, toward SE, from 2004 to 2015 (SEC–NSEC in Figure), as well as to the dike responsible for the 2008 eruption (Bonforte et al., 2013). The arcuate configuration of the displacement vectors is responsible for the eastward slip of the NE flank of the volcano, as well as for providing the dilatation accommodating the emplacement of the dikes feeding the shown eruptive fissures (in the summit area). The topography in (a) is based on a DEM from Bisson et al. (2016).
The post-2003 volcanic activity at Etna has been significantly affected by this major stress variation. The emplacement of the NW–SE striking dikes feeding the 2004–2005 and the 2006 eruptions, as well as of the long-standing 2008–2009 eruption, is related to the development of the ~NE–SW trending dilatational stress field at the summit of the volcano (Figure 7; Neri and Acocella, 2006; Neri et al., 2006; Bonaccorso et al., 2009; Bonforte et al., 2013). However, it is mostly with the development of the proto-NSEC, from 2007, that the shift in the axis of Etna's summit activity becomes evident. The development of the proto-NSEC in fact has provided a permanent gauge, or stress marker, highlighting this new condition of instability of the upper eastern flank of the volcano. This stress field promoted the formation of a new NW–SE oriented magmatic system through the development of multiple dikes, probably propagating from the conduit of the SEC. It is likely that this new magmatic system is very shallow, not deeper than 1–2 km, as it is resulting from flank instability. The increased eruptive frequency of the volcano since the development of this NW–SE trending system indicates that the accelerated instability of the volcano flank also somehow enhanced the shallow rise and extrusion of magma, leading to a greater efficiency of magma transport through the SEC–NSEC conduit.
The growth of the NSEC thus provides an interesting example of how instability-induced stress variations within a volcano may induce significant shifts in the locus of volcanic activity. Even though information is poor, it is likely that also the birth and development of the other summit craters at Etna (as for example the SEC) may have been promoted by similar variations in the summit stress field due to previous episodes of flank instability. Disruption of the portion of the central conduit system that feeds the Voragine and Bocca Nuova craters during the major intrusive and flank slip events of 2001 and 2002–2003 furthermore led to the deactivation of these craters for a decade; in fact, only in 2011–2015 did this portion of the feeder system (Voragine and Bocca Nuova) become fully re-established.
Increasing Volcanic Hazard?
The possibility to alter in a permanent way the shallow magmatic paths following episodes of flank instability remains an important feature to consider in the summit evolution of an active volcano, as well as to forecast the opening of new vents (Cappello et al., 2012, 2013). Indeed, the shift of the location of volcanism from the SEC to the NSEC is not only significant from a structural point of view, as it also changes, probably increasing, the context of volcanic hazards at the volcano. In particular, the growth of a new cone on the western rim of the Valle del Bove may promote further instability (as recently observed; Bonforte and Guglielmino, 2015), both of the cone itself and of the slope upon which it rests, which by now have merged into a continuum. Repeated intrusion of magma through the flanks of the cone, especially in its eastern sector, has in fact led to small to moderate size collapse events in late-2013 and early 2014; the largest of these events, on 11 February 2014, entrained hot, active lava, resulting in a hot, pyroclastic-flow-like avalanche. In addition, the heightened efficiency and faster speed of magma transport through the widened conduit has led to an increase in the vigor of lava fountaining and tephra generation, and many lava flows generated at the NSEC are significantly longer than the lava flows emitted by earlier paroxysms at the SEC. For example, the 10 May 2008 lava flow from the proto-NSEC reached a length of >6 km and stopped only 2 km from the outskirts of the town of Zafferana Etnea (Vicari et al., 2011; Behncke et al., 2016). Between 2011 and 2013, numerous villages on the south-eastern, eastern and north-eastern flanks of Etna have experienced repeated heavy tephra falls, often causing material damage. Higher upslope tourist facilities and popular hiking areas have repeatedly received rather intense tephra fallout, including clasts up to 0.5 m in diameter at more than 5 km distance from the NSEC (De Beni et al., 2015).
The growing number of these paroxysms (Behncke et al., 2005) inspired the development of a methodology for the near-real-time forecasting of lava flow hazards (Vicari et al., 2009). The methodology, based on near-real-time infrared satellite data to drive numerical simulations of lava flow paths, was tested at Etna to evaluate the hazard of lava flows emitted during the 12–13 January 2011 lava fountain (Vicari et al., 2011). By using SEVIRI satellite thermal data with low-spatial and high temporal resolution, we obtained a system of early warning combined with a preliminary estimate of the lava discharge rates. These satellite-derived discharge rate estimates were used as input to the MAGFLOW model (Del Negro et al., 2015; Cappello et al., 2016), allowing us to effectively simulate the rate of advancing and the maximum length of the lava flow. In this way, an eruptive scenario has been provided promptly enough for a response to be effective. Moreover, by simulating the inundation areas for diverse typologies of possible future eruptions at the NSEC, we produced a hazard map that may consider any abrupt change in the eruptive conditions, furnishing the probable paths of lava flows and the associated inundation probability. The results obtained from the hazard map suggest that summit eruptions like at the NSEC should generally pose no threat to the local population, with the added value that all the developed procedures required only a short time of intervention (from few minutes to hours), representing a critical point during an emergency.
In summary, the eruptive activity at the NSEC, with its frequent intense and widespread tephra falls and outpouring of lava flows capable of flowing over long distances enough to invade vulnerable areas on the flanks of Etna, may represent new challenges to population and authorities, where the notion of Etna being a largely effusive and non-explosive volcano is still widely held. The progressive intensification of summit activity at the volcano and the increased speed at which new summit vents are born and grow in locations that are structurally increasingly unstable, make us suspect that the problems caused by the activity of the NSEC will remain a constant feature of Etna's activity in the near future.
Conclusions
This study has shown how volcanic activity at Etna changed its location in the last decade. Activity migrated from the SE Crater to the New SE Crater, at the base of the former cone, in less than a decade. This shift involved the development of dike fed-eruptive fissures, pit craters and, finally, the NSEC cone itself. Geodetic and structural data suggest that the NSEC developed under the dilatational stress on the volcano summit promoted by accelerated flank instability, mainly along the Pernicana Fault System, during inflation periods. In particular, the NE–SW oriented dilatation in the NSEC area may result from a vortex-like displacement of the eastern flank of the volcano immediately to the south of the Pernicana Fault System. In fact, the direction of this displacement progressively rotates from NE–SW in the upper slope of the volcano (NSEC and Piano Provenzana areas) to E–W in the middle slope and ESE–WNW in the lower slope. The development of the NSEC is not only important from a structural point of view, as its formation may also have lead to an overall increase in the volcanic hazard; this is suggested by the increased proximity to the upper slope of the Valle del Bove, in a topographically more unstable area, and increased explosivity of the eruptions. The case of the NSEC at Etna shows how flank instability may control the distribution and impact of volcanism, including the prolonged shift of the summit vent activity in a mature volcano.
Author Contributions
MN and VA coordinated the research and mainly wrote the manuscript. AB provided geodetic data. BB, GG, and CN provided volcanological field and satellite data. All authors contributed ideas and input to the research and writing of the paper.
Conflict of Interest Statement
The authors declare that the research was conducted in the absence of any commercial or financial relationships that could be construed as a potential conflict of interest.
Acknowledgments
Editors A. Costa, G. Wadge, and R. Sulpizio promoted the Research Topic. Reviewers R. Sulpizio and A. Tibaldi provided constructive suggestions. Thanks are due to European Organisation for the Exploitation of Meteorological Satellites (EUMETSAT) for SEVIRI data (http://www.eumetsat.int) as well as to G. Aiesi, F. Calvagna, S. Consoli e B. Saraceno, and all INGV colleagues who collaborate to the GPS surveys on Etna.
References
Acocella, V., Behncke, B., Neri, M., and D'Amico, S. (2003). Link between major flank slip and eruptions at Mt. Etna (Italy). Geophys. Res. Lett. 30, 2286. doi: 10.1029/2003GL018642
Acocella, V., and Neri, M. (2003). What makes flank eruptions? The 2001 Etna eruption and its possible triggering mechanisms. Bull. Volcanol. 65, 517–529. doi: 10.1007/s00445-003-0280-3
Acocella, V., and Neri, M. (2009). Dike propagation in volcanic edifices: overview and possible developments. Tectonophysics 471, 67–77. doi: 10.1016/j.tecto.2008.10.002
Allard, P., Behncke, B., D'Amico, S., Neri, M., and Gambino, S. (2006). Mount Etna 1993–2005: anatomy of an evolving eruptive cycle. Earth Sci. Rev. 78, 85–114. doi: 10.1016/j.earscirev.2006.04.002
Alparone, S., Andronico, D., Lodato, L., and Sgroi, T. (2003). Relationship between tremor and volcanic activity during the Southeast Crater eruption on Mount Etna in early 2000. J. Geophys. Res. 108, 2241. doi: 10.1029/2002JB001866
Alparone, S., Barberi, G., Bonforte, A., Maiolino, V., and Ursino, A. (2011). Evidence of multiple strain fields beneath the eastern flank of Mt. Etna volcano (Sicily, Italy) deduced from seismic and geodetic data during 2003-2004. Bull. Volcanol. 73, 869–885. doi: 10.1007/s00445-011-0456-1
Alparone, S., Cocina, O., Gambino, S., Mostaccio, A., Spampinato, S., Tuvè, T., et al. (2013). Seismological features of the Pernicana – Provenzana Fault System (Mt. Etna, Italy) and implications for the dynamics of north-eastern flank of the volcano. J. Volcanol. Geotherm. Res. 251, 16–26. doi: 10.1016/j.jvolgeores.2012.03.010
Andronico, D., Branca, S., Calvari, S., Burton, M., Caltabiano, T., Corsaro, R. A., et al. (2005). A multi-disciplinary study of the 2002–03 Etna eruption: insights into a complex plumbing system. Bull. Volcanol. 67, 314–330. doi: 10.1007/s00445-004-0372-8
Andronico, D., and Cristaldi, A. (2007). Il Parossismo Eruttivo Del 4–5 Settembre 2007 al Cratere di SE: Caratteristiche Del Deposito di Caduta Distale. Internal report. Available online at: http://www.ct.ingv.it/Report/RPTVETCEN20070904.pdf
Andronico, D., Cristaldi, A., and Scollo, S. (2008). The 4–5 September 2007 lava fountain at South-East Crater of Mt Etna, Italy. J. Volcanol. Geotherm. Res. 173, 325–328. doi: 10.1016/j.jvolgeores.2008.02.004
Barreca, G., Bonforte, A., and Neri, M. (2013). A pilot GIS database of active faults of Mt. Etna (Sicily): a tool for integrated hazard evaluation. J. Volcanol. Geother. Res. 251, 170–186. doi: 10.1016/j.jvolgeores.2012.08.013
Behncke, B., Branca, S., Corsaro, R. A., De Beni, E., Miraglia, L., and Proietti, C. (2014). The 2011–2012 summit activity of Mount Etna: Birth, growth and products of the new SE crater. J. Volcanol. Geotherm. Res. 270, 10–21. doi: 10.1016/j.jvolgeores.2013.11.012
Behncke, B., Calvari, S., Giammanco, S., Neri, M., and Pinkerton, H. (2008). Pyroclastic density currents resulting from interaction of basaltic magma with hydrothermally altered rock: an example from the 2006 summit eruptions of Mount Etna, Italy. Bull. Volcanol. 70, 1249–1268. doi: 10.1007/s00445-008-0200-7
Behncke, B., De Beni, E., and Proietti, C. (2013). Misure GPS Del Nuovo Cono Discorie Del Cratere di SE, Etna. Report INGV of May 3, 2013. Available online at: www.ct.ingv.it (in Italian).
Behncke, B., Fornaciai, A., Neri, M., Favalli, M., Ganci, G., and Mazzarini, F. (2016). LiDAR surveys reveal eruptive volumes and rates at Etna, 2007-2010. Geophys. Res. Lett. 42, 4270–4278. doi: 10.1002/2016gl068495
Behncke, B., and Neri, M. (2003). Cycles and trends in the recent eruptive behavior of Mount Etna (Italy). Can. J. Earth Sci. 40, 1405–1411. doi: 10.1139/e03-052
Behncke, B., Neri, M., and Nagay, A. (2005). Lava flow hazard at Mount Etna (Italy): new data from a GIS-based study, in Kinematics and Dynamics of Lava Flows, Vol. 396, eds M. Manga and G. Ventura (Boulder, CO: Spec. Pap. Geol. Soc. Am.), 189–209.
Behncke, B., Neri, M., Pecora, E., and Zanon, V. (2006). The exceptional activity and growth of the Southeast Crater, Mount Etna (Italy), between 1996 and 2001. Bull. Volcanol. 69, 149–173. doi: 10.1007/s00445-006-0061-x
Belousov, A., Voight, B., and Belousova, M. (2007). Directed blasts and blasts-generated pyroclastic density currents: A comparison of the Bezymianni 1956, Mount St Helens 1980, and Soufrière Hills, Monteserrat 1997 eruptions and deposits. Bull. Volcanol. 69, 701–740. doi: 10.1007/s00445-006-0109-y
Bertagnini, A., Calvari, S., Coltelli, M., Landi, P., Pompilio, M., and Scribano, V. (1990). The 1989 eruptive sequence, in Mt. Etna 1989 Eruption, eds F. Barberi, A. Bertagnini and P. Landi (Giardini, Pisa: Consiglio Nazionale delle Ricerche-Gruppo Nazionale per la Vulcanologia), 10–22.
Bisson, M., Spinetti, C., Neri, M., and Bonforte, A. (2016). Mt. Etna volcano high-resolution topography: airborne LiDAR modelling validated by GPS data. Int. J. Digit. Earth 9, 710–732. doi: 10.1080/17538947.2015.1119208
Bonaccorso, A., Bonforte, A., Calvari, S., Del Negro, C., Di Grazia, G., Ganci, G., et al. (2011). The initial phases of the 2008–2009 Mount Etna eruption: a multidisciplinary approach for hazard assessment. J. Geophys. Res. 116, B03203. doi: 10.1029/2010JB007906
Bonaccorso, A., Bonforte, A., and Gambino, S. (2015). Twenty-five years of continuous bore-hole tilt and vertical displacement data at Mount Etna: insight on long-term volcanic dynamics. Geophys. Res. Lett. 42, 10,222–10,229. doi: 10.1002/2015GL066517
Bonaccorso, A., Bonforte, A., Gambino, S., Mattia, M., Guglielmino, F., Puglisi, G., et al. (2009). Insight on recent stromboli eruption inferred from terrestrial and satellite ground deformation measurements. J. Volcanol. Geotherm. Res. 182, 172–181. doi: 10.1016/j.jvolgeores.2009.01.007
Bonaccorso, A., Bonforte, A., Guglielmino, F., Palano, M., and Puglisi, G. (2006). Composite ground deformation pattern forerunning the 2004–2005 Mount Etna eruption. J. Geophys. Res. 111, B12207. doi: 10.1029/2005JB004206
Bonaccorso, A., and Calvari, S. (2013). Major effusive eruptions and recent lava fountains: balance between erupted and expected magma volumes at Etna volcano. Geophys. Res. Lett. 40, 6069–6073. doi: 10.1002/2013GL058291
Bonforte, A., Bonaccorso, A., Guglielmino, F., Palano, M., and Puglisi, G. (2008). Feeding system and magma storage beneath Mt. Etna as revealed by recent inflation/deflation cycles. J. Geophys. Res, 113, B05406. doi: 10.1029/2007JB005334
Bonforte, A., Branca, S., and Palano, M. (2007). Geometric and kinematic variations along the active pernicana fault: implication for the dynamics of Mount Etna NE flank. J. Volcanol. Geotherm. Res. 160, 210–222. doi: 10.1016/j.jvolgeores.2006.08.009
Bonforte, A., Gambino, S., and Neri, M. (2009). Intrusion of eccentric dikes: the case of the 2001 eruption and its role in the dynamics of Mt. Etna volcano. Tectonophysics 471, 78–86. doi: 10.1016/j.tecto.2008.09.028
Bonforte, A., and Guglielmino, F. (2015). Very shallow dike intrusion and potential slope failure imaged by ground deformation: the 28 december 2014 eruption on Mount Etna. Geophys. Res. Lett. 42, 2727–2733. doi: 10.1002/2015GL063462
Bonforte, A., Guglielmino, F., and Puglisi, G. (2013). Interaction between magma intrusion and flank dynamics at Mt. Etna in 2008, imaged by integrated dense GPS and DInSAR data. Geochem. Geophys. Geosyst. 14, 2818–2835. doi: 10.1002/ggge.20190
Cappello, A., Bilotta, G., Neri, M., and Del Negro, C. (2013). Probabilistic modeling of future volcanic eruptions at Mount Etna. J. Geophys. Res. 118, 1–11. doi: 10.1002/jgrb.50190
Cappello, A., Ganci, G., Calvari, S., Pérez, N. M., Hernández, P. A., Silva, S. V., et al. (2016). Lava flow hazard modeling during the 2014–2015 fogo eruption, Cape Verde. J. Geophys. Res. 121, 2290–2303. doi: 10.1002/2015jb012666
Cappello, A., Neri, M., Acocella, V., Gallo, G., Vicari, A., and Del Negro, C. (2012). Spatial vent opening probability map of Mt. Etna volcano (Sicily, Italy). Bull. Volcanol. 74, 2083–2094. doi: 10.1007/s00445-012-0647-4
Carveni, P., Romano, R., Caltabiano, T., Grasso, M. F., and Gresta, S. (1994). The exceptional explosive activity of 5 January 1990 at SE-Crater of Mt Etna volcano (Sicily). Boll. Soc. Geol. It. 113, 613–631.
De Beni, E., Behncke, B., Branca, S., Nicolosi, I., Carluccio, R., D'Ajello Caracciolo, F., et al. (2015). The continuing story of Etna's New Southeast Crater (2012-2014): evolution and volume calculations based on field surveys and aerophotogrammetry. J. Volcanol. Geotherm. Res. 303, 175–186. doi: 10.1016/j.jvolgeores.2015.07.021
Del Negro, C., Cappello, A., and Ganci, G. (2015). Quantifying lava flow hazards in response to effusive eruption. Geol. Soc. Am. Bull. 128, 752–763. doi: 10.1130/B31364.1
Del Negro, C., Cappello, A., Neri, M., Bilotta, G., Hérault, A., and Ganci, G. (2013). Lava flow hazards at Mount Etna: constraints imposed by eruptive history and numerical simulations. Sci. Rep. 3:3493 doi: 10.1038/srep03493
Falsaperla, S., Behncke, B., Langer, H., Neri, M., Salerno, G. G., Giammanco, S., et al. (2014). “Failed” eruptions revealed by pattern classification analysis of gas emission and volcanic tremor data at Mt. Etna, Italy. Int. J. Earth Sci. (Geol Rundsch) 103, 297–313. doi: 10.1007/s00531-013-0964-7
Falsaperla, S., Cara, F., Rovelli, A., Neri, M., Behncke, B., and Acocella, V. (2010). Effects of the 1989 fracture system in the dynamics of the upper SE flank of Etna revealed by volcanic tremor data: the missing link? J. Geophys. Res. 115, B11306. doi: 10.1029/2010JB007529
Falsaperla, S., and Neri, M. (2015). Seismic footprints of shallow dyke propagation at Etna, Italy. Sci. Rep. 5, 11908. doi: 10.1038/srep11908
Favalli, M., Fornaciai, A., Mazzarini, F., Harris, A. J. L., Neri, M., Behncke, B., et al. (2010). Evolution of an active lava flow field using a multitemporal LIDAR acquisition. J. Geophys. Res. 115, B11203. doi: 10.1029/2010JB007463
Fialko, Y., Simons, M., and Agnew, D. (2001). The complete (3-D) surface displacement field in the epicentral area of the 1999 Mw7.1 Hector Mine earthquake, California, from space geodetic observations. Geophys. Res. Lett. 28, 3063–3066. doi: 10.1029/2001GL013174
Ganci, G., Bilotta, G., Cappello, A., Hérault, A., and Del Negro, C. (2015). HOTSAT: a multiplatform system for the satellite thermal monitoring of volcanic activity, in Detecting, Modelling and Responding to Effusive Eruptions, eds A. Harris, T. De Groeve, F. Garel, and S. A. Carn (London: Geological Society of London Special Publication), 426.
Ganci, G., Harris, A. J. L., Del Negro, C., Guéhenneux, Y., Cappello, A., Labazuy, P., et al. (2012). A year of fountaining at Etna: Volumes from SEVIRI. Geophys. Res. Lett. 39, L06305. doi: 10.1029/2012GL051026
Ganci, G., James, M. R., Calvari, S., and Del Negro, C. (2013). Separating the thermal fingerprints of lava flows and simultaneous lava fountaining using ground-based thermal camera and SEVIRI measurements. Geophys. Res. Lett. 40, 5058–5063. doi: 10.1002/grl.50983
Ganci, G., Vicari, A., Bonfiglio, S., Gallo, G., and Del Negro, C. (2011a). A texton-based cloud detection algorithm for MSG-SEVIRI multispectral images. Geomatics Nat. Hazards Risk 2, 279–290. doi: 10.1080/19475705.2011.578263
Ganci, G., Vicari, A., Fortuna, L., and Del Negro, C. (2011b). The HOTSAT volcano monitoring system based on combined use of SEVIRI and MODIS multispectral data. Ann. Geophys. 54, 544–550.
Garel, F., Kaminski, E., Tait, S., and Limare, A. (2015). A fluid dynamics perspective on the interpretation of the surface thermal signal of lava flows, in Detecting, Modelling and Responding to Effusive Eruptions, eds A. J. L. Harris, T. De Groeve, F. Garel, and S. A. Carn, S.A (Geological Society of London Special Publication), 426.
Guest, J. E. (1973). The summit area of Mount Etna prior to the 1971 eruption. Philos. Trans. R. Soc. London A 274, 63–78. doi: 10.1098/rsta.1973.0026
Guglielmino, F., Bignami, C., Bonforte, A., Briole, P., Obrizzo, F., Puglisi, G., et al. (2011). Analysis of satellite and in situ ground deformation data integrated by the SISTEM approach: the April 3, 2010 earthquake along the Pernicana fault (Mt. Etna – Italy) case study. Earth Planet. Sci. Lett. 312, 327–336. doi: 10.1016/j.epsl.2011.10.028
Langer, H., Falsaperla, S., Messina, A., Spampinato, S., and Behncke, B. (2011). Detecting imminent eruptive activity at Mt Etna, Italy, in 2007–2008 through pattern classification of volcanic tremor data. J. Volcanol. Geotherm. Res. 200, 1–17. doi: 10.1016/j.jvolgeores.2010.11.019
Lanzafame, G., Neri, M., Coltelli, M., Lodato, L., and Rust, D. (1997). North-south compression in the Mt. Etna region (Sicily): spatial and temporal distribution. Acta Vulcanologica 9, 121–133.
McGuire, W. J., and Pullen, A. D. (1989). Location and orientation of eruptive fissures and feeder-dykes at Mount Etna: influence of gravitational and regional stress regimes. J. Volcanol. Geotherm. Res. 38, 325–344. doi: 10.1016/0377-0273(89)90046-2
Neri, M., and Acocella, V. (2006). The 2004–05 Etna eruption: Implications for flank deformation and structural behaviour of the volcano. J. Volcanol. Geotherm. Res. 158, 195–206. doi: 10.1016/j.jvolgeores.2006.04.022
Neri, M., Acocella, V., and Behncke, B. (2004). The role of the Pernicana Fault System in the spreading of Mount Etna (Italy) during the 2002–2003 eruption. Bull. Volcanol. 66, 417–430. doi: 10.1007/s00445-003-0322-x
Neri, M., Acocella, V., Behncke, B., Giammanco, S., Mazzarini, F., and Rust, D. (2011). Structural analysis of the eruptive fissures at Mount Etna (Italy). Ann. Geophys. 54, 464–479. doi: 10.4401/ag-5332
Neri, M., Acocella, V., Behncke, B., Maiolino, V., Ursino, A., and Velardita, R. (2005). Contrasting triggering mechanisms of the 2001 and 2002–2003 eruptions of Mount Etna (Italy). J. Volcanol. Geotherm. Res. 144, 235–255. doi: 10.1016/j.jvolgeores.2004.11.025
Neri, M., Behncke, B., Burton, M., Giammanco, S., Pecora, E., Privitera, E., et al. (2006). Continuous soil radon monitoring during the July 2006 Etna eruption. Geophys. Res. Lett. 33, L24316. doi: 10.1029/2006GL028394
Neri, M., Mazzarini, F., Tarquini, S., Bisson, M., Isola, I., Behncke, B., et al. (2008). The changing face of Mount Etna's summit area documented with Lidar technology. Geophys. Res. Lett. 35, L09305. doi: 10.1029/2008GL033740
Pesci, A., and Teza, G. (2007). Strain rate analysis over the central Apennines from GPS velocities: the development of a new free software. Bollettino Geodesia Sci. Affini 56, 69–88.
Puglisi, G., and Bonforte, A. (2004). Dynamics of Mount Etna Volcano inferred from static and kinematic GPS measurements. J. Geophys. Res. 109, B11404. doi: 10.1029/2003JB002878
Puglisi, G., Briole, P., and Bonforte, A. (2004). Twelve years of ground deformation studies on Mt. Etna volcano based on GPS surveys, in Mt. Etna: Volcano Laboratory. AGU Geophys. Monograph series, eds A. Bonaccorso, S. Calvari, M. Coltelli, C. Del Negro, and S. Falsaperla (Washington, DC: AGU), 143, 321–341.
Solaro, G., Acocella, V., Pepe, S., Ruch, J., Neri, M., and Sansosti, E. (2010). Anatomy of an unstable volcano through InSAR: multiple processes affecting flank instability at Mt. Etna, 1994–2008. J. Geophys. Res. 115, B10405. doi: 10.1029/2009JB000820
Spampinato, L., Ganci, G., Hernández, P. A., Calvo, D., Tedesco, D., Pérez, N. M., et al. (2013). Thermal insights into the dynamics of Nyiragongo lava lake from ground and satellite measurements. J. Geophys. Res. 118, 5771–5784. doi: 10.1002/2013jb010520
Vicari, A., Ciraudo, A., Del Negro, C., Herault, A., and Fortuna, L. (2009). Lava flow simulations using discharge rates from thermal infrared satellite imagery during the 2006 Etna eruption. Nat. Hazards 50, 539–550. doi: 10.1007/s11069-008-9306-7
Keywords: eruptive vents, volcano, stress, flank instability, Etna
Citation: Acocella V, Neri M, Behncke B, Bonforte A, Del Negro C and Ganci G (2016) Why Does a Mature Volcano Need New Vents? The Case of the New Southeast Crater at Etna. Front. Earth Sci. 4:67. doi: 10.3389/feart.2016.00067
Received: 31 March 2016; Accepted: 23 May 2016;
Published: 14 June 2016.
Edited by:
Geoffrey Wadge, University of Reading, UKReviewed by:
Roberto Sulpizio, Università degli Studi di Bari, ItalyAlessandro Tibaldi, University of the Studies of Milan Bicocca, Italy
Copyright © 2016 Acocella, Neri, Behncke, Bonforte, Del Negro and Ganci. This is an open-access article distributed under the terms of the Creative Commons Attribution License (CC BY). The use, distribution or reproduction in other forums is permitted, provided the original author(s) or licensor are credited and that the original publication in this journal is cited, in accordance with accepted academic practice. No use, distribution or reproduction is permitted which does not comply with these terms.
*Correspondence: Valerio Acocella, YWNvY2VsbGFAdW5pcm9tYTMuaXQ=