 Edgar U. Zorn1,2*
 Nicolas Le Corvec1
 Nick R. Varley3
 Jacqueline T. Salzer1
 Thomas R. Walter1
 Carlos Navarro-Ochoa4Dulce M. Vargas-Bracamontes5
 Samuel T. Thiele6
 Raúl Arámbula Mendoza4
- 1German Research Centre for Geosciences GFZ, Potsdam, Germany
- 2Institute of Geosciences, University of Potsdam, Potsdam, Germany
- 3Colima Intercambio e Investigación en Vulcanología, Universidad de Colima, Colima, Mexico
- 4Centro Universitario de Estudios e Investigaciones de Vulcanología, Universidad de Colima, Colima, Mexico
- 5CONACYT-CUEIV, Universidad de Colima, Colima, Mexico
- 6School of Earth, Atmosphere and Environment, Monash University, Clayton, VIC, Australia
During eruptive activity of andesitic stratovolcanoes, the extrusion of lava domes, their collapse and intermittent explosions are common volcanic hazards. Many lava domes grow in a preferred direction, in turn affecting the direction of lava flows and pyroclastic density currents. Access to active lava domes is difficult and hazardous, so detailed data characterizing lava dome growth are typically limited, keeping the processes controlling the directionality of extrusions unclear. Here we combine TerraSAR-X satellite radar observations with high-resolution airborne photogrammetry to assess morphological changes, and perform finite element modeling to investigate the impact of loading stress on shallow magma ascent directions associated with lava dome extrusion and crater formation at Volcán de Colima, México. The TerraSAR-X data, acquired in ~1-m resolution spotlight mode, enable us to derive a chronology of the eruptive processes from intensity-based time-lapse observations of the general crater and dome evolution. The satellite images are complemented by close-range airborne photos, processed by the Structure-from-Motion workflow. This allows the derivation of high-resolution digital elevation models, providing insight into detailed loading and unloading features. During the observation period from Jan-2013 to Feb-2016, we identify a dominantly W-directed dome growth and lava flow production until Jan-2015. In Feb-2015, following the removal of the active summit dome, the surface crater widened and elongated along a NE-SW axis. Later in May-2015, a new dome grew toward the SW of the crater while a separate vent developed in the NE of the crater, reflecting a change in the direction of magma ascent and possible conduit bifurcation. Finite element models show a significant stress change in agreement with the observed magma ascent direction changes in response to the changing surface loads, both for loading (dome growth) and unloading (crater forming excavation) cases. These results allow insight into shallow dome growth dynamics and the migration of magma ascent in response to changing volcano summit morphology. They further highlight the importance of detailed volcano summit morphology surveillance, as changes in direction or location of dome extrusion may have major implications regarding the directions of potential volcanic hazards, such as pyroclastic density currents generated by dome collapse.
Introduction
The growth of lava domes is a common volcanic phenomenon, being recorded at over 120 volcanoes worldwide (Ogburn et al., 2015), with many varying growth styles. Understanding the growth of lava domes at stratovolcanoes is one of the most important tasks in volcanology as domes can pose a severe threat to human lives and infrastructure. The collapse of a lava dome can produce destructive pyroclastic density currents (PDCs), a hazard responsible for many volcano-related deaths (Witham, 2005). One of the most prominent examples of the destructive potential of a lava dome occurred in 1902 with the sudden collapse of the Mount Pelee, Martinique, lava spine. This resulted in a PDC that destroyed the nearby town St. Pierre, causing ~28,000 deaths within a few minutes (Tanguy, 1994). More recently, during the 2010 eruption of Merapi, Indonesia, PDCs resulting from dome collapse extended for >15 km from the summit, leading to the evacuation of a third of a million of people (Surono et al., 2012; Cronin et al., 2013). Lava domes that are emplaced on slopes or grow by oblique extrusion are especially prone to gravitational collapse due to potential oversteepening (Voight, 2000), so a clear understanding of the dome growth dynamics is highly important.
Inclined or directional dome growth as well as extrusion from multiple vents are commonly observed at many volcanoes producing very viscous lava domes. Dome growth at Soufrière Hills, Montserrat, between 1995 and 1998 produced several oblique spines in different directions (Watts et al., 2002). Similar observations were made during the 2004–2006 dome extrusion of Mount St. Helens, USA, which also produced directional spines likely originating from the same vent (Vallance et al., 2008), episodically extruding, spreading and sliding laterally (Walter, 2011; Salzer et al., 2016). At Chaiten, Chile, such spines eventually collapsed in 2008 and produced far reaching PDCs (Pallister et al., 2013b). At Merapi, Indonesia, a clear lava dome growth directionality was identified toward the populated southern slopes years before the 2010 eruption (Walter et al., 2013b).
While it is clear that lava domes regularly display directional or oblique growth patterns, the reasons and mechanisms behind the growth asymmetry are still poorly understood. Emplacement on an inclined slope and a complex morphology of the lava dome or crater can result in a preferred growth direction (Harnett et al., 2018). Based on numerical modeling and observations at Soufrière Hills, Montserrat (Husain et al., 2014), another proposed mechanism is the change of dome extrusion direction after plugging of ascent pathways and the pileup of extruded lava. The resulting transition from endogenous to exogenous growth and the establishment of new shear zones causes further spine extrusions to be deflected in other directions (Hale and Wadge, 2008). Similarly, the occurrence of multiple vent extrusions at Volcán de Colima has been attributed to a dense plug which deflects magma ascent around it (Lavallée et al., 2012). Furthermore, the growth of lava domes and their directionality might be largely controlled by shear bands and slip behavior at the conduit walls (Hale and Wadge, 2008). Pre-existing morphology can also direct dome growth through channeling (Walter et al., 2013b). Therefore, these previous studies suggest that shallow extrusion processes at the conduit and the local morphology play an important role in establishing directional lava dome growth. Here, we contribute to this discussion by providing new and detailed geomorphological data from Volcán de Colima. Our analysis of aerial photogrammetry suggests a relationship between morphology change and the directionality of dome growth. To investigate this observed relationship, we perform numerical modeling on the influence of local stress changes in response to loading and unloading associated with dome growth and crater formation. We further propose stress changes as a principal mechanism to explain the developments of new vents and directional dome extrusion.
Lava Dome Monitoring
While dome building volcanoes can be well monitored by traditional seismic and geodetic techniques, domes at steep sided volcanoes are often hazardous to approach and are therefore monitored by remote sensing. Studies increasingly utilize Synthetic Aperture Radar (SAR) as a tool independent of cloud cover to assess the topography, structure and deformation of volcanoes. Most studies analyse either the reflected amplitude or perform interferometric processing of the signal phase values. Interferometric SAR (InSAR) measures the phase difference between satellite radar acquisitions, but resolving the growth on lava domes remains challenging as the phase images require good correlation between acquisitions (Walter et al., 2015). Thus, most InSAR studies focus on crustal deformation affecting the flanks of dome-growing volcanoes (Salzer et al., 2014; Welch and Schmidt, 2017). Lava dome cooling and subsidence (Salzer et al., 2017) and cracks splitting a lava dome have also been detected (Walter et al., 2015). For monitoring lava domes, the analysis of the SAR amplitude is particularly valuable as it can be used to document and quantify lava dome growth e.g., at Merapi and Sinabung, Indonesia (Pallister et al., 2013c, 2018) and Mount Cleveland, Alaska (Wang et al., 2015). SAR data also allow the construction of DEMs, which provide a detailed quantification of volume changes at growing lava domes (Kubanek et al., 2015).
In addition to radar monitoring, aerial photogrammetric surface reconstructions have become a widespread tool in geosciences (Bemis et al., 2014) especially as the development of the Structure-from-Motion Multi-View Stereo (SfM-MVS) workflow has allowed the reconstruction of a three dimensional point cloud and digital terrain modeling based on oblique and nadir photogrammetric data (Westoby et al., 2012). At dome building volcanoes, these photogrammetrically built models can be used to identify detailed features of the dome surface (Darmawan et al., 2018), monitor growth and extrusion rates (Diefenbach et al., 2012, 2013) and characterize interaction of lava domes with snow (Walder et al., 2007). A comparison of sequential models can also allow the estimation of volume changes from ground movement, dome collapse (Herd et al., 2005), lava flow/PDC emplacement (Dai and Howat, 2017; Pedersen et al., 2018), or the study of secondary volcano hazards such as lahars (Gomez et al., 2018; Walter et al., 2018). In this paper, we combine both SAR and SfM-MVS photogrammetry to investigate the oblique dome growth processes at one of the most active volcanoes in Central America.
Regional Background
Volcán de Colima (or sometimes referred to as Fuego de Colima) is an andesitic stratovolcano located in western Mexico (Figure 1) as part of the Trans-Mexican Volcanic Belt. The volcano is situated within a 5 km wide collapse scar, which is open to the south and originated from a large flank-collapse, likely older than 23 ka (Roverato et al., 2011). Its recent activity has been dominated by dome growth and intermittent Vulcanian explosions originating at the summit crater with several instances of effusion that were recorded between 1998 and 2010 (Varley et al., 2010), and lasted until 2011. Following a quiescence from 2011 to 2012, a short inflation heralded a new dome-growing phase in January 2013 (Salzer et al., 2014; Walter et al., 2019) and transitioned to explosive activity in 2015. The July 2015 eruption marked the most hazardous event in over a century (Reyes-Dávila et al., 2016). It featured two major dome collapses and produced PDCs extending for more than 10 km (Reyes-Dávila et al., 2016; Capra et al., 2018). The eruption caused strong morphologic changes, as it left an amphitheater-shaped scar at the summit, which is breached to the south. Moderate activity, including vulcanian explosions, dome growth and lava flow effusion, continued until February 2017, when the most recent active period terminated. In this work we further elucidate the 2013–2016 activity, and quantify the large morphology changes associated with summit growth and destruction.
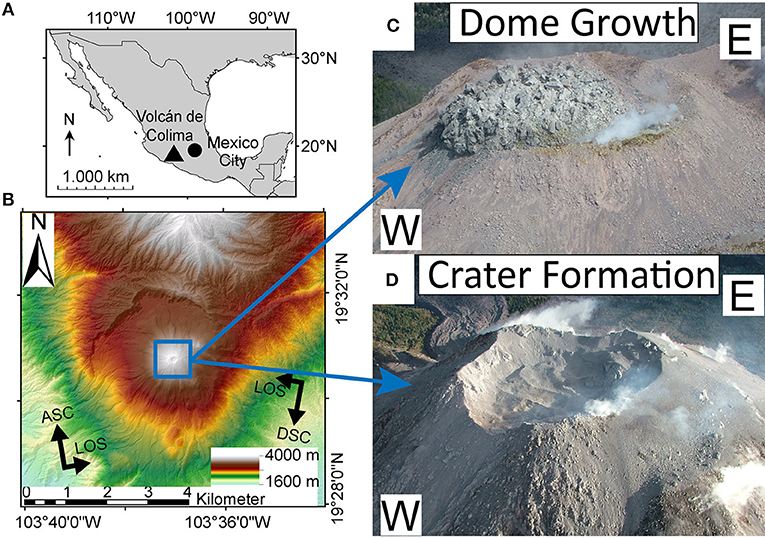
Figure 1. (A) The map shows the location and (B) the local topography of Volcán de Colima. The SAR acquisition geometry with Line of Sight (LOS) for the ascending (ASC) and descending (DSC) orbit are also indicated. The two photos highlight the dynamic morphological changes occurring at the summit of andesitic stratovolcanoes. These involve (C) repeated cycles of dome growth (photo from 13.03.2013), and (D) destruction by the collapse of the dome or explosive excavation, forming a crater (photo from 25.03.2015).
The activity of Volcán de Colima shows a ~100-year cycle, characterized by lava flow effusion, dome growth and moderate explosions, with an intensification in activity before culminating in a large sub-plinian to plinian eruption (Luhr and Carmichael, 1980; González et al., 2002; Luhr, 2002). The last large eruptions occurred in 1818 (Macías et al., 2017) and 1913 (Saucedo et al., 2010; Massaro et al., 2018), making close monitoring of the volcano an important topic due to the possibility of a plinian eruption in the near future. Therefore, many recent studies are aimed at monitoring and understanding the dynamics of volcano deformation. Small-scale deformation has been observed with interferometrically processed TerraSAR-X (TSX) data (Salzer et al., 2014, 2017), identifying shallow pressurization and suggesting the existence of a dense plug and a complex conduit system at shallow depth. At the surface, morphological and volumetric observations of the lava dome at Volcán de Colima have previously been studied based on airborne LiDAR in 5 m resolution (Davila et al., 2007) and TanDEM-X satellites in an approximate 10 m resolution (Kubanek et al., 2014). However, these rather rare datasets could hardly be used for year-long monitoring, and were only realized for distinct years and eruptive episodes. The SfM-MVS workflow has also been used to model the summit dome and crater from both optical (James and Varley, 2012) and thermal (Thiele et al., 2017) surveys, allowing morphologic studies each time an overflight is realized.
Data and Methodology
Volcán de Colima has a continuous seismic monitoring network (Arámbula-Mendoza et al., 2018). To obtain an overview of the volcanic activity in the observation period from Jan 2013 to Feb 2016, we employed the records from the seismic station closest to the investigated dome. For this, data from the vertical component of the broadband Guralp CMG-6TD seismic station SOMA, located on the NW flank at 1.7 km from the summit, were decomposed and normalized employing the discrete wavelet transform (DWT). A 0.5 Hz high-pass filter was applied to reduce microseismic noise. This type of signal decomposition has been previously used at Volcán de Colima observatory (Vargas-Bracamontes et al., 2009) and, similar to previous seismic studies at Volcán de Colima (Lamb et al., 2014), allows for the identification of dome growth phases as these are associated with characteristic frequency distributions (Figure 2). Phases of dome growth, collapse and crater formation were further investigated in remote sensing data as described below.
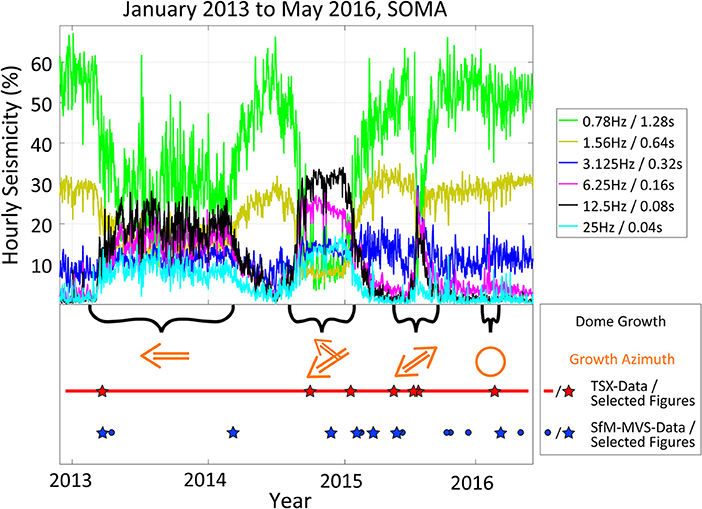
Figure 2. Overview of the seismic activity of Volcán de Colima during the study period characterized by the decomposed frequency content of the seismic signal. The seismicity is presented as the rate of normalized seismic energy per hour at scales of 2j samples (Vargas-Bracamontes et al., 2009), the associated frequencies are indicated at the top-right corner of the figure. While in a dome-growing stage, the seismicity is dominantly characterized by high-frequencies due to regular rockfalls. During an explosive stage, lower frequencies dominate, indicating the explosive activity from a pressurized conduit. The bottom of the plot shows a timeline of the multiple dome growth phases as well as the growth directions. The main azimuth shown is based on the direction of advancing lava flows/lobes originating from the dome. The last growth phase had no clear growth direction and is indicated with a circle. The TSX/SfM data used for the study are also included. Stars indicate that the data are shown in Figures 4, 5, respectively.
High-Resolution Satellite Radar Observations
We processed amplitude SAR data from the German TerraSAR-X satellite (TSX) acquired between January 2013 and February 2016 at Volcán de Colima. The satellite has a continuous 11 day return orbit and a 12 h time gap between the chosen ascending and descending acquisitions, resulting in constant temporal data acquisition and providing a good overview of the visible changes at Volcán de Colima and thus its eruptive activity. Due to the rapid changes and temporal decorrelation of the SAR signal at dome building volcanoes (Walter et al., 2015; Wang et al., 2015; Arnold et al., 2017; Chaussard, 2017), we investigate the amplitude information rather than the phase information.
For this study, we consider a total of 166 SAR-images in both ascending (86 images) and descending geometries (80 images), which we acquired in spotlight mode for high resolution (Roth et al., 2003) (Figures 1, 3). The resulting TSX footprint captures an area of ~12 × 10 km around Volcán de Colima, providing a ground resolution of ~1 m, although distortions are common due to the nature of the radar acquisition and the steep terrain. The radar images were geocoded based on coregistration with the simulated backscatter from a digital elevation model (DEM) using the GAMMA software (Werner et al., 2000). Because the DEM has a major influence on the geometric correction of SAR data, we used a DEM based on a tri-stereo photogrammetric dataset (acquired 10.01.2016) processed in Erdas Imagine. We follow the workflow proposed by Bagnardi et al. (2016), i.e., photogrammetric terrain reconstructed based on three optical high resolution stereo-images. The resulting DEM was resampled at 1 m and allowed accurate geocoding of the TSX data. These were then speckle-filtered to enhance the image quality. We analyse the radar intensity images, yielding the reflectivity measure of the ground. By this, topography can be assessed indirectly, as those slopes facing the satellite appear brighter, while those at the opposite sites are darker.
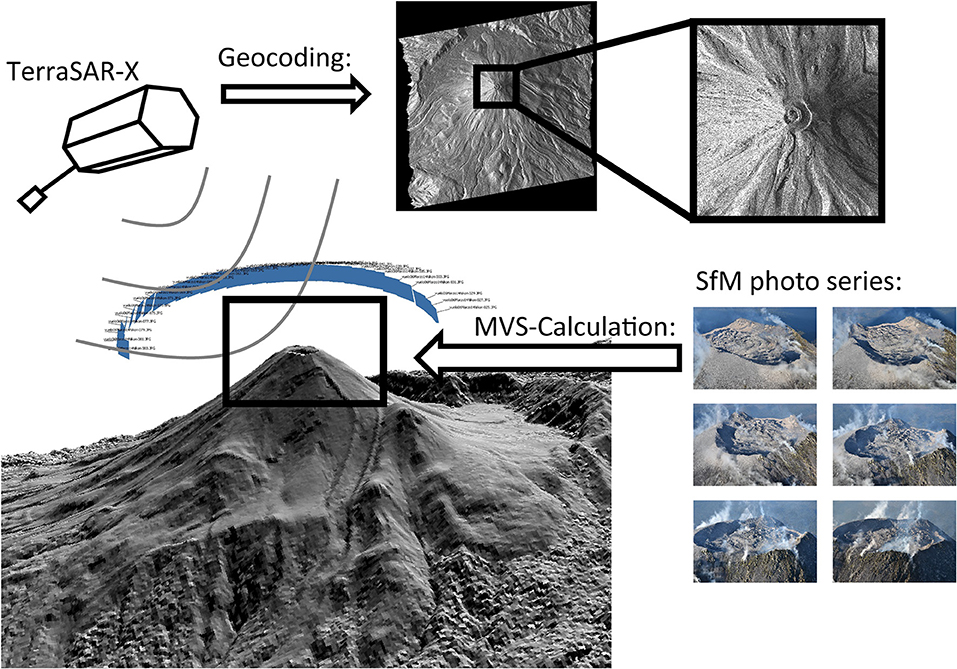
Figure 3. Illustrated remote sensing methods including radar amplitude images from the TerraSAR-X satellite, oblique aerial photos and the workflow of the SfM-MVS approach.
High-Resolution Airborne Photogrammetry
Flights were conducted by helicopter or plane with flight paths comprised of single or multiple circles around the crater and an oblique viewing geometry (Figure 3). Airborne photogrammetric data were acquired at irregular intervals, depending on weather and flight access, though allowing a high spatial resolution. Our photogrammetric survey data consist of 13 flights between 2013 and 2016, each capturing the crater area with digital single-lens reflex handheld cameras (DSLR). The image sizes and resolution varied due to the number of different cameras used (Canon, Nikon, Sony, Fujifilm) and are between 1,280 × 960 and 6,000 × 4,000 pixels, while the image to ground distances vary between a few hundred meters to a kilometer. Image input also varied greatly between 61 and 344 photos per survey. This is due to the overflight taking place over several years and the imaging was conducted by several different camera operators with changing equipment.
Photogrammetric reconstruction was performed using Agisoft Photoscan Professional (Version 1.4.1.5925), which uses SfM-MVS to locate and orient each image and produce a dense point cloud of the terrain (Westoby et al., 2012). As the images were acquired by handheld cameras they have no geotagging, and as no ground control point could be measured in the field due to hazardous crater access, the resulting point clouds were not referenced. Here, georeferencing was achieved using the ~1 m resolution point cloud from the Pleiades tri-stereo DEM. We use this dataset to reference the photogrammetric point cloud closest to the Pleiades acquisition date (here 02.12.2015) by using point pair-picking registration in CloudCompare. As the SfM photogrammetry point clouds have a much higher resolution compared to the Pleiades point cloud, and to ensure internal consistency within our dataset, all other point clouds were referenced directly against this (02.12.2015) high-resolution SfM point cloud using the same manual point-matching method. The georeferencing to the Pleiades dataset could be achieved with an RMS of ±2.4 m plus an additional error between ±0.2 m and ±0.5 m from the subsequent point-matching of the other clouds to the first reference cloud.
Using the referenced SfM point clouds, detailed DEMs could be constructed using ESRI ArcMap (Version 10.5). Here all DEMs were built at 10 cm resolution after performing a statistical outlier subsampling on the point clouds, removing any singular points outside of the standard deviation for the average point distance. This is used to prevent misplaced points from affecting the final DEMs. From the 13 flights realized between 2013 and 2016 we derived 13 DEMs, providing a detailed view of morphology gain and loss at the summit of Volcán de Colima.
Modeling
The stress-field pattern of a volcano is known to influence or even control the path of ascending magmas (Nakamura, 1977; Rivalta et al., 2015; Sulpizio and Massaro, 2017). In addition, recent studies show that loading or unloading of a volcanic edifice (Maccaferri et al., 2017) or a crater excavation and filling (Le Corvec et al., 2018) can reorient magma propagation. Here we investigate the response of edifice-stresses to load-changes associated with the addition and removal of the summit dome. We develop a model using DEM changes in the finite-element method implemented with COMSOL Multiphysics®. Sequential topographic profiles derived from our photogrammetric data of different eruptive stages were used to calculate the changes in surface-loading. We further assess the impact of the stress changes on the shallow magma ascent direction by implementing a slip-failure based approach.
The direction of magma propagation is controlled by the least compressive principal stress. Such low viscosity magmas accordingly propagate through tensile mode-I type cracks opening in ascent direction (Rubin, 1995). For this study however, we model a case revolving around the extrusion of a lava dome fed by a high viscosity or even solid magma. In this case, magma propagates upwards by pushing through a pipe-like conduit, developing shear fault-like features and slip surfaces on the walls of the conduit (Iverson et al., 2006; Pallister et al., 2013a; Kendrick et al., 2014; Ryan et al., 2018) or, in the case of less viscous magma, form ductile shear bands (Tuffen and Dingwell, 2005). If conduit walls are fault-like, we may apply quasi-static metrics of stress changes such as normal stress, shear stress and accordingly Coulomb failure stress. These are concepts that are normally applied in the study of earthquake distributions (Stein et al., 1997; Freed, 2005), but they have been used in numerical modeling of lava dome extrusions before, successfully predicting extrusion volumes and deformation data (Chadwick et al., 1988).
Our model consists of an elastic domain and assumes andesitic composition with a Young's Modulus (Ec) of 10 GPa, a density (ρc) of 2,290 kg m−3, and a Poisson's ratio (μ) of 0.33, which are typical values for andesites such as those at Volcán de Colima (Heap et al., 2014). We consider a 2D axisymmetric domain of linear elastic materials with cylindrical coordinates (r, φ, z), i.e., a 2D profile is revolved on its z axis to construct a 3D environment. The axisymmetric simplifications allows for the simulation of a dense mesh and for the consideration of small topographic changes. To avoid boundary effects, the area of the elastic domain is set to 100 km × 100 km and is subjected to gravitational loads expressed by an initial lithostatic stress (Grosfils, 2007):
with σr, σφ, σz being the normal stresses acting in the radial, azimuthal, vertical direction. Z corresponds to the vertical coordinates and is negative downwards, therefore considering the convention that negative stress values indicate compression, and g is the Earth's gravitational acceleration (−9.81 m s−2). The model is further subjected to a volume load equal to
For our scenario, we infer magma ascent to occur by slip at the conduit walls. To assess the direction of the expected slip, we calculate Mohr-Coulomb slip planes, acting as conduit wall analogs, assuming a rock cohesion of 25 MPa, this being an average value of a medium strength rock that is highly fractured (Hoek and Brown, 1997). The orientation of the slip-planes was calculated using the visualization method developed by Grosfils et al. (2015).
We further consider the conduit position of the ascending magma column inferred from the photogrammetric data, and define the observed conduit walls (assumed to be initially vertical) as stress change receiver faults. For consistency with the use of Mohr-Coulomb slip planes, we infer the conduit walls to act as shear faults for the extrusion of magma representing the side of a hypothetical conduit. These are included as two imaginary vertical lines, with the Mohr-Coulomb slip planes acting as continuations paths for the conduit wall slip, thus deflecting magma ascent. The change in CFS was calculated along the two imaginary vertical lines using:
where Δτ is the shear stress change, Δσn the normal stress change and u is the coefficient of internal friction defined by the angle of internal friction (here u = tan(25) as a common value for dry volcanic rock) (Byerlee, 1978). The change in CFS on the conduit faults can indicate the tendency to encourage (positive ΔCFS) or discourage (negative ΔCFS) fault failure with depth.
We evaluate stress changes based on morphological changes in the “elastic domain/volcano” for two case scenarios: (1) “the dome-building case,” and (2) “the crater-forming case.” For the dome-building (loading) case, the dome domain is created based on the natural topography (cf. section High-Resolution Airborne Photogrammetry) to which we added the andesitic physical characteristics and gravitational loads. For the crater-forming (unloading) case, a later profile representing the excavation created by explosive activity in early 2015 is used. Here, for Z < 0 an additional unloading force equal to the negative lithostatic stress is applied at the surface of the crater and pulling it upwards. This is to account for the sudden stress in equilibrium due to the fast unloading.
Results
Our results allow detailed insight into eruptive activity and dome building processes at Volcán de Colima. A comprehensive timeline of SAR and photogrammetric results presented in this study is shown complementary to the seismic data (Figure 2).
Overview of Temporal Data From TSX and Seismic Station
The TSX data allow the identification of changes at the volcano summit in a constant spatial and temporal resolution, whereas the seismic data provide an insight into the type of activity. The 11-day temporal acquisition of the TSX data permits the distinction of four phases of dome growth during the 3-year period between January 2013 and February 2016 (Figure 4). These are also expressed in seismic data, where three phases of extrusion are associated with strong high-frequency seismic signals (Figure 2) indicative of rockfalls (Arámbula-Mendoza et al., 2018), with the last being too minor to be recorded clearly. The pauses between the dome growth phases all lasted roughly 4–5 months, but interestingly, the phase durations seemed to decrease progressively (Figure 2). The complete TSX dataset with the seismic timeline is shown in Supplementary Material A, with the relevant data being presented here.
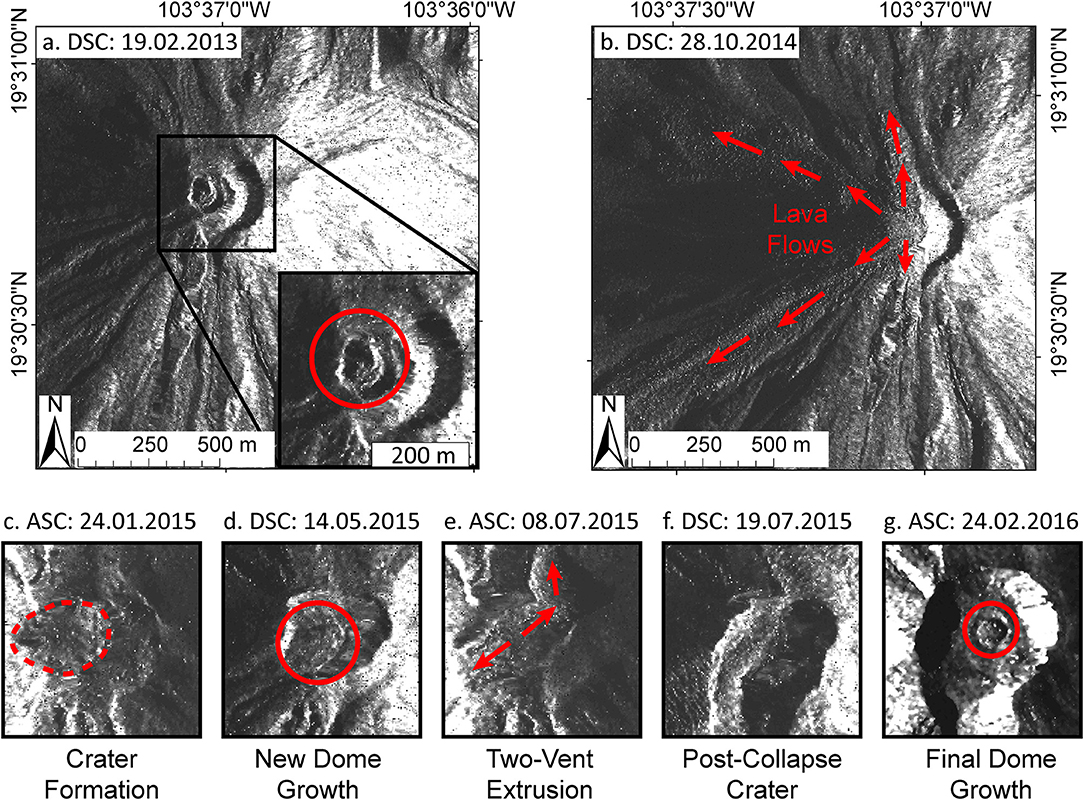
Figure 4. SAR amplitude images highlighting important developments at the summit crater at various stages of the observation period, red circles mark lava dome positions. (A) first dome growth phase, (B) the second dome growth phase with the production of lava flows (arrows indicate flow directions), (C) outline of the newly formed crater (the dashed line indicated the extent of the crater), (D) third dome growth phase, (E) continued dome extrusion and lava flow production from two vents (arrows indicate flow directions), (F) large collapse crater after the July 2015 eruption, (G) fourth dome growth phase.
TSX and seismic data both indicate the growth of the first lava dome, representing the start of the renewed eruptive activity at Volcán de Colima, occurred in early 2013. The eruptive activity was dominantly constructive with the addition of lava at the summit and the western volcano flanks, and can be observed in the TSX data (Figures 4A,B). According to helicopter observations, the very first extrusion of lava started on 11 January 2013; however this new dome was destroyed by the ongoing explosive activity. We first identify the lava dome in the TSX image from 19 February 2013 (Figure 4A). The dome grew westward and by March 2013 resulted in the formation of a lava flow that descended the western flank. In early 2014, seismic data indicate either a prolonged pause in extrusion or a significant reduction of the extrusion rate, as seismic events changed to low-frequency dominated events. In simple terms, this indicated that fewer rockfalls associated with dome-growth occurred. The pause in extrusion is supported by the TSX data, as it shows the dome staying stagnant at the summit and no major morphological changes occur during this time (March to July 2014).
Between July and August 2014, activity resumed with a strong extrusion as evidenced by four lava flows appearing in the TSX acquisitions (Figure 4B). This second extrusion produced lava flows to the SW and NW (Figure 4B), which by October, respectively extend to 2.3 and 1.3 km from the summit. Smaller flows to the N and S extend less than 500 m from the summit (Figure 4B). A final lava flow developed in November 2014 toward the SW, also not extending more than a few hundred meters down the flank (Figure 5C), meaning that almost all the extruded material during this phase was deposited on the western half of the volcano. In December 2014, extrusions slowed and the activity became more explosive. The TSX images do not show any further extrusion and the seismic data indicate that 17 to 25 January 2015 was a transition period from extrusive to explosive activity. The transition is characterized by a change from high- to low-frequency dominated seismic signals, representing rockfall and explosion signatures, respectively (Figure 2). More detailed seismic data showing this transition are included and explained in Supplementary Material B. Explosive activity resulted in the partial collapse of the summit dome, likely within a few days in late January 2015, as a new crater formed in its place (Figure 4C). Over the following months, the crater deepened through further explosive excavation and elongated along a southwest-northeast axis, developing an elliptical shape (Figure 4D).
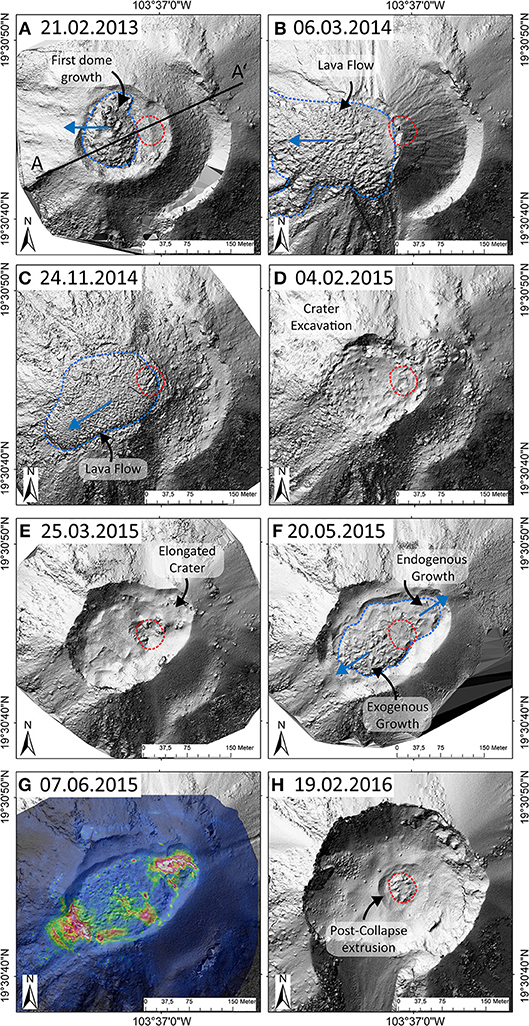
Figure 5. DEMs built from aerial SfM-MVS photogrammetry, showing highly detailed morphological changes within the crater area. (A) The initial dome growth in January 2013; (B) overtopping of lava toward the west; (C) final lava flow emplacement during the constructive activity on the SW side; (D) initial crater after the dome collapse; (E) deepened and elongated crater following ongoing explosive activity; (F) bifurcated dome growth on both the NE and SW side; (G) overlay of thermal data, highlighting the conduit bifurcation reflected by two active dome areas in the NE and SW, respectively; (H) Collapse crater after the July 2015 eruption with the new extrusion at the crater floor. Dashed blue lines mark the extent of the summit lava dome or lava flow and the dashed red line marks the deep vent position inferred from (H). The profile position used in Figure 6 is marked with a black line in (A).
A third lava dome began to grow in May 2015 and involved simultaneous explosive activity. While the crater remained elongated on its southwest-northeast axis, a new lava dome grew inside the crater (Figure 4D); however the growth was initially seen only within the SW half of the crater. On the NE side of the crater, activity was reportedly comprised of small explosions (Reyes-Dávila et al., 2016). By June 2015 the dome filled the entire crater and in July it produced lava flows in both SW and NE directions (Figure 4E). The onset of new rockfalls coinciding with the start of the lava flows is also seen in the seismic data, with a change to high-frequency dominated events (Figure 2). Extrusive activity intensified and culminated in the catastrophic collapse of the summit area from 10 to 11 July. The eruption and collapse produced a large crater which was breached toward the south (Figure 4F). After July 2015, activity at Volcán de Colima declined and displayed only minor to moderate explosive activity.
In February 2016, seismic data indicated that a new dome had started to grow inside the center of the crater. This dome is visible as a small and roughly circular extrusion in the TSX images (Figure 4G) and did not grow much larger.
Overview of Structural Data From SfM and Thermal Images
The SfM reconstructions performed well on the flight data. The summit area of Volcán de Colima was resolved in all 13 datasets that were considered for the 2013–2016 observation period. We obtained a morphologic time-lapse dataset showing the growth and destruction of the summit lava dome(s) and the growth direction. The exceptionally high resolution of 10 cm allows the identification of small features such as individual explosion pits and lava bombs, and also allows us to identify the structures associated with the direction of dome growth. The complete SfM dataset is shown as shaded reliefs in Supplementary Material C.
Our model from the first extrusion in February 2013 shows an elliptical (N-S elongated, aspect ratio AR = 1.37) lava dome with a diameter of ~100 m within a ~160 m wide crater (Figure 5A). With continued dome extrusion until the end of 2014, both the older dome and the surrounding main summit crater were gradually buried (Figures 5A–C). The dome itself is a single extrusion lobe characterized by a flat-topped blocky surface with a surrounding talus. The flat top also shows a slight inclination during the first months of growth (Figure 6A). By March 2014 the dome had filled the crater and overtopped it to the W (Figure 5B). This is consistent with previous observations, showing a clear westwards directionality from the start of the dome growth (Walter et al., 2019). After a pause in extrusion, activity resumed and another new dome lobe was seen at the summit in November 2014, overtopping the previous extrusions toward the SW and its surface shows the same blocky nature as the previous dome (Figure 5C). As the flight data did not capture the initial growth stage, it is not clear whether the extrusion occurred with an elongation.
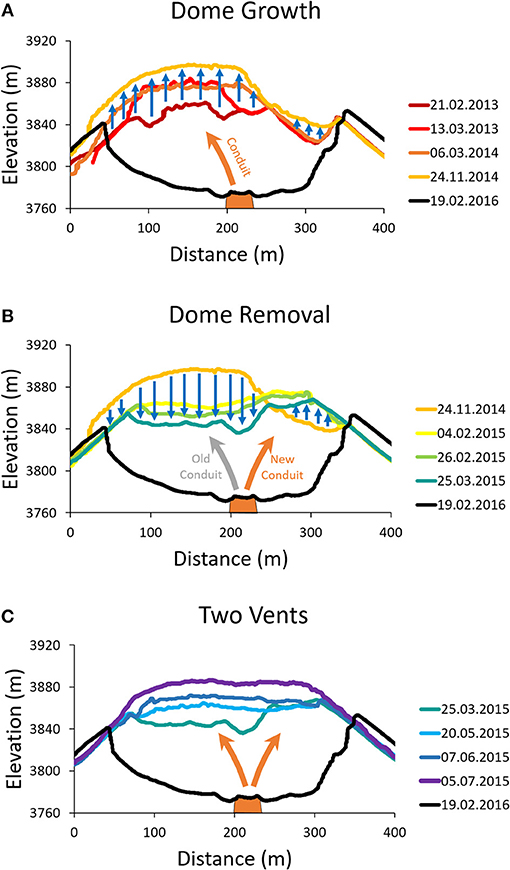
Figure 6. Profile view from A-A' marked in Figure 5A of the DEM data showing the changes resulting from the important eruptive phases, (A) the growth of the lava dome, (B) its removal, and (C) the lava dome regrowth and conduit bifurcation. The inferred deep conduit position (see Figure 5H) is also shown.
By February 2015, after the start of the destructive activity, the top of the summit dome was removed and a ~165 m wide and round crater had formed in its place (Figure 5D). This crater grew larger within a few weeks, as much of the explosive activity was focused on its NE side, thus gradually elongating it along the southwest-northeast axis by March 2015 (Figure 5E). By the time the third dome started to grow in May 2015, the crater had formed a ~240 m long and 180 m wide depression (Figure 5F). A new extrusion then formed within that depression, reaching a size of 195 m by 110 m (NE-SW elongated, AR = 1.77) (Figure 5F). This dome, compared to the first dome from February 2013 (Figure 5A), also had a blocky surface, but had a much lower profile. Initial dome growth was also focused to the SW half of the elongated crater and the direction of growth occurred mainly toward the SW, while the northeast side of the crater first showed steaming and explosive activity, then transitioned to lava extrusion. From additional thermal data during this stage, we identified two main anomalies in the NE and the SW, respectively (Figure 5G). As seen from the TSX data, the dome became increasingly elongated across this NE-SW axis (Figure 4E). During the last stage of dome growth, and shortly before the large eruption in July 2015, the dome filled the entire crater, topping over both the NE and SW sides of the crater and generating advancing lava lobes in both directions (Figure 4E). At this stage the dome had bifurcated into two growth directions, to the SW and to the NE.
After the July 2015 dome collapse, the final flight we processed shows a ~300 m wide and ~80 m deep crater open to the south (Figure 5H). The excavation decapitated the previous conduit system and a new and near circular dome extrusion ~45 m across (AR = 1.16) was visible in the bottom of this crater, which marks the new conduit position below the previous level (Figure 5H).
Topographic Stress Modeling
We use stress-change modeling to better understand why dome growth at Volcán de Colima develops directionality as observed during our study period (W until late 2014 to SW and NE in early 2015). Specifically, we test the effect of changes in the local stress field on the magma ascent directions due to the changing topography in case of dome growth or destruction.
To quantify the changes in the topographic loading due to dome growth, the elevation difference between the 21.02.2013 DEM and the 24.11.2014 DEM was used (Figure 6A). This captures the entire constructive dome growth activity before the dome was removed in early 2015. The models thus reflect the gradual emplacement of the load through the lava dome, which had grown toward the western side of the crater. For the unloading model, the topography difference between the 24.11.2014 and the 25.03.2015 was used (Figure 6B). This captures the removal of the summit dome and excavation of the crater in its place during early 2015. It is also at a stage where the elongation of the crater had not yet started or was not yet visible, meaning it is also before the second vent in the NE appeared.
The stress models show a clear response of the Mohr–Coulomb slip-lines to the changed stresses with the addition and removal of the dome loading, respectively (Figure 7). Generally, slip planes are directed toward additional load, thus favoring conduit wall slip into elevated topography, here the newly grown lava dome. The excavation of material from the dome on the other hand deflects the slip lines away from the removed load and toward the remaining topography on the side of the crater. Here, this promoted fracturing and slip toward the eastern excavation rim after the lava dome was removed.
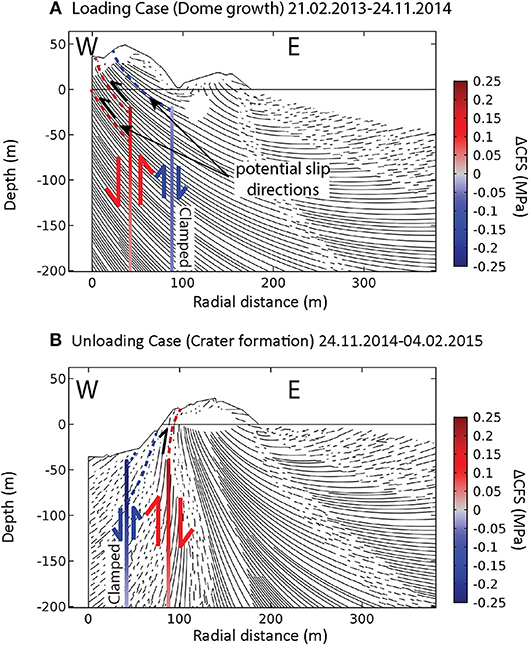
Figure 7. Coulomb Stress Change (ΔCFS) along the walls of a magmatic conduit in the case of (A) loading with dome growth, and (B) unloading with crater formation. The topographic profiles are taken as differences from the SfM-DEMs. The topography change is from 21.02.2013 to 24.11.2014 for (A) and 24.11.2014 to 25. 03. 2015 for (B). The ΔCFS inhibits fault movements when negative (blue color) and favors fault movements when positive (red color). Thin black lines show orientations of the Mohr–Coulomb slip planes (Cohesion = 25 MPa, Φfrict = 25°) that have the same orientation as the favored movement along the conduit. For the dome growth the Mohr–Coulomb slip planes are directed westwards (i.e., toward the additional load). For the crater formation they are eastwards (i.e., away from the unloaded crater). Actual conduit extrusion would follow the imaginary wall faults at ~80 m depth, then deviate from that path following the Mohr–Coulomb slip planes at any point above.
By loading and unloading of the lava dome, the Coulomb failure stress changed along the conduit walls of the ascending magma column. This can be observed on the modeled imaginary conduit (Figure 7). Depending on the depth the stress difference can be up to 0.25 MPa (ΔCFS) (Figure 7), which may contribute to activating or clamping the conduit. The position of the conduit at a depth of ~80 m could be inferred from the 2016 model (Figure 5H). This assumes a constant position of the deeper magma column as well as magma extrusion by shearing of a conduit fault. In the loading model, the western conduit fault located toward the dip of the dome would be activated preferentially, whereas the eastern side of the conduit would tend to clamp due to the reduction in ΔCFS (Figure 7A). This is reversed in the unloading model, where the eastern side conduit fault will activate preferentially and the western side will clamp (Figure 7B).
Discussion
Lava domes growing in the summit regions of active volcanoes are a major source of hazards, as parts of a dome may become unstable, fail and generate PDCs. Lava domes growing in a preferred direction may allow better judgment of the direction of this instability, however the reasons for the preferred growth direction have not been investigated in detail yet. In this work we propose a model in which the local stress field is controlled by the eruptive sequence, which could be coupled with other processes and effects, such as pre-existing morphology and slope, rheology and structural interactions, as further elaborated below.
Magma Ascent Response to Load Changes
Conduit Position
By integrating photogrammetric data, satellite radar images and numerical modeling methods, we are able to gain insight into the physical processes controlling the lava dome growth at Volcán de Colima, Mexico. Based on deformation studies the location of the feeding conduit could already be inferred in a 2013 dataset (Salzer et al., 2014), which matches very well with the conduit position in our study (Figure 5H). The July 2015 eruption produced an 80 m deep crater and carved the conduit on the crater floor with the onset of new extrusion in 2016, indicating that the location has been constant for the period 2013–2016. Therefore, we could infer the conduit location (center at 103°37'0.75“W and 19°30'44.881”N) and identify approximate extrusion paths and growth directions of the lava dome in the 2013–2015 growth phase (Figure 5H). This is done under the assumption that the conduit position at depth was constant between 2013 and 2016. We assume this is valid as the dome that grew in 2016 did not show any directionality and is in a central position of the current crater. This is further supported by the ~70 m westward offset of the initial 2013 dome with respect to the observed deeper conduit (Figure 5A) and a noticeable tilt in the flat dome top (Figure 6A), suggesting an inclined extrusion vent and implying a shallow bend in the conduit, likely between the surface and ~80 m depth. Such a bend has also been suggested to occur as a result of conduit bifurcation at a shallow depth in previous works (Lavallée et al., 2012; Salzer et al., 2014) and is thus in good agreement with our interpretation (Figure 8A).
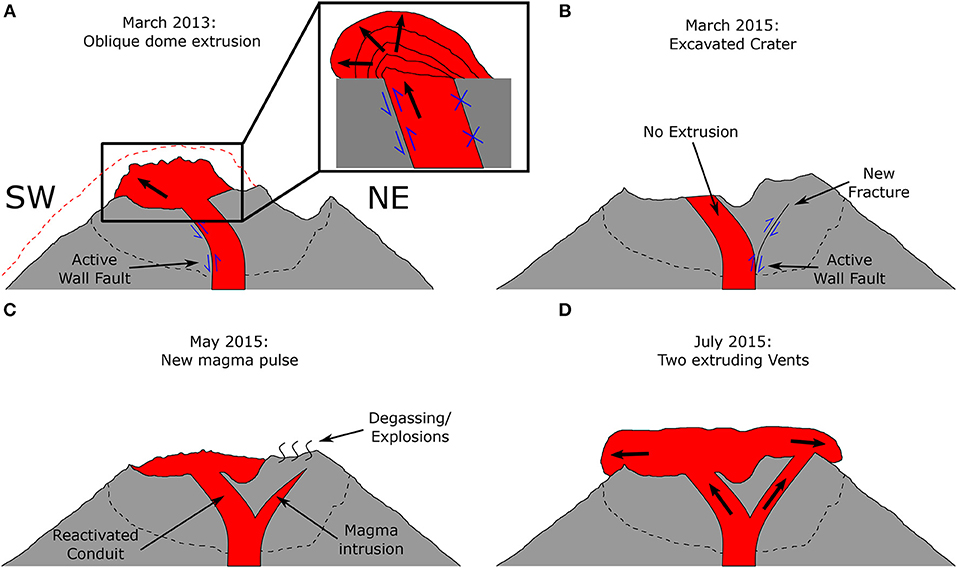
Figure 8. Illustration of the proposed processes during the observation period. The sketches are not to scale and orientated based on the A-A' profile view marked in Figure 5A and used in Figure 6. (A) The initial stages of dome growth, showing the dome extruding westwards by activation of the inner conduit wall fault. (B) The crater after the removal of the summit dome. The load stress field has shifted, causing new fractures to branch of the conduit wall to the NE side. (C) Regrowth of the lava dome and the conduit bifurcation. (D) Final stage of the lava dome before the large collapse in July 2015, the dome is growing in two directions (NE and SW) fed by two separate vents.
Changes in Loading Stress
We are able to provide an explanation for the extrusion direction of the lava dome and the conduit bifurcation following the collapse of the dome and infer the dynamics of the shallow conduit system based on changes in the local load stress field. The additional load due to the growing dome and the lava flows on the western side emplaced between 2013 and late 2014 aligned conduit slip planes toward the western side (Figure 7A). This likely favored the activation of conduit slip in this direction, providing Mohr-Coulomb slip surfaces for the magma ascent in this direction, which resulted in further west-directed extrusion. It also likely favored the formation of cracks and fissures in this direction due to the conduit movement at shallow depth. The change in CFS suggests that extrusion mostly moved by the activation of the western conduit fault/margin (Figure 8A), thus piling additional material to the west and creating a self-sustained directionality. Support for this sustained system can be seen in the timespan of purely west-directed lava extrusion as it lasted almost 2 years and through two phases of extrusion.
The west-directed extrusion only stopped when the load, i.e., most of the summit dome, was removed and the crater deepened during the onset of explosive eruptive activity during late January and early February 2015 (Figure 4C). During the removal of the dome and subsequent crater elongation, activity shifted to the northeast on the other side of the deep conduit position (Figures 5E–G). We interpret this as a newly opened vent, which could have been formed from a new or reactivated fissure originating from the same conduit (Figures 6C, 8B), which has been previously described at Volcán de Colima (Lavallée et al., 2012). Here our model suggests the new vent formation was caused by the removal of the load, rather than a deflection caused by a dense plug. This deflected the slip planes away from the new-formed crater and toward the remaining load on the crater rim (Figure 7B), which was where the new vent developed. Another factor favoring the fracturing and opening of new fissures may have been the transitional period from effusive to explosive activity (Figure 2 and Supplementary Material B) as this will have involved repeated conduit pressurization. Under the new load stresses, it is likely that the new fissure branched off the eastern conduit wall coinciding with the activation of the conduit wall fault, thus causing the conduit bifurcation we observed (Figures 8B–D). Since both the NE and the SW vents started extruding in May 2015, we presume that the previously west-directed extrusion vent was likely reactivated by a new pulse of magma. As this would involve multiple shallow conduits our model cannot resolve this behavior properly, although it is possible that extrusion may still take place on the active conduit wall (here the eastern side) for both vents.
The stress response to loading and unloading can also be used to explain the shift in dome extrusion from an initial E-W axis to the NE-SW axis observed toward the end of the eruption. At the start of the dome extrusion in 2013, the direction of the dome growth and the following lava flow were directed purely to the west (Figures 5B, 6A). However, this shifted in 2014 as the accumulated extrusion products were buried and lava flows developed in other directions, most prominently toward the SW with the final pulse in November 2014 (Figures 4B, 5C). The highest load was therefore placed on the SW side, explaining why the new vent opened on the other NE side after this load was removed in early 2015.
These results are in agreement with previous studies investigating the ascent of magma in response to changing surface loads, which were found to occur due to a shift in principal stresses on a local (Le Corvec et al., 2018) and crustal scale (Maccaferri et al., 2017).
Causes of Magma Deflection and Growth Directionality
Our observations of directional dome growth, vent offset and possible conduit bifurcation are consistent with previous investigations into the dynamics of the shallow crater system at Volcán de Colima. Our study further suggests an evolution in growth directionality as the first dome growth is west-directed, then becomes both west and east-directed, and finally bifurcates into a western and an eastern branch. The mechanism causing the directed extrusion proposed here provides a new explanation that differs from other mechanisms discussed in previous studies.
Firstly, the topography around the extrusion of a lava dome has been proposed to play an important role. Emplacement on a sloped surface or within uneven craters can cause directed growth downslope (Harnett et al., 2018). Here, the dome at Volcán de Colima grew inside an explosion crater, with the western crater wall slightly lower than the eastern wall. Similarly, observational data at other volcanoes showed that the crater shape may significantly affect the direction and speed of dome growth (Walter et al., 2013b). Thus we cannot rule out an impact of topography after the dome started to overflow the crater. However, as the dome was already growing westwards before overtopping the crater, this is unlikely to be the cause of the directionality.
Secondly, changing extrusion directions have been linked to a structural or mechanical control within older emplaced domes, where an inclined growth lobe develops along a curved shear fault originating at the side of the conduit (Watts et al., 2002). This is also reflected by changes from endogenous to exogenous growth styles, when a lava lobe is pushed through the previously emplaced dome (Watts et al., 2002; Hale and Wadge, 2008; Husain et al., 2014). In our study, we see a change from endogenous to exogenous only for the newly opened NE vent in 2015 and only after the direction of dome growth had already changed. The changes of extrusion directions at Volcán de Colima are thus linked to the removal of dome material occurring previously, not the growth style. However, the movement along shear faults originating from the conduit walls is supported by our study, and the importance of the conduit wall for lava dome emplacement through shear faulting has been emphasized in many earlier studies (Chadwick et al., 1988; Tuffen and Dingwell, 2005; Pallister et al., 2013a;Kendrick et al., 2014; Ryan et al., 2018).
Thirdly, changes in growth direction at Volcán de Colima were characterized by the activation of new lobes as rockfalls would cause local unloading on the dome (Hutchison et al., 2013). The growth lobes thus advanced in this direction as the rockfall area became unconfined by the talus surrounding the dome (Walter, 2011). A similar change in growth direction and even extrusion rate in response to local unloading due to slumps was also found at Mount St. Helens (Vallance et al., 2008). This mechanism is similar to our interpretation as it is also based on topographic loading and unloading, however, the unloading and redirection of growth occurs only with the already extruded parts of the dome as it becomes unconfined on one side while remaining confined (or buttressed) on the other. Our interpretation adds to this discussion by suggesting a loading-based deflection of extrusion to occur prior to extrusion (and likely at an inclined angle), which is a separate process from the one proposed by Hutchison et al. (2013), and a combination of both is likely.
Lastly, there can be some external factors impacting the direction of magma extrusion. Several studies have suggested the existence of a dense plug in the shallow levels of the Colima conduit, causing a deflection of magma ascent and pressurization at shallow depth (Lavallée et al., 2012; Salzer et al., 2014). An offset of the dome from the main summit crater center was already noted in 2010 (James and Varley, 2012; Lavallée et al., 2012). The deeper conduit position (Figure 5H) highlights that active vents between 2013 and 2015 shifted due to shallow conduit deflection; however our models suggest a reorientation in slip-lines due to changing load stresses as a mechanism. Considering the existence of the dense plug, our models may contribute to the concept of shallow conduit deflections by providing a preferred direction, with which magma will ascend around such obstacles.
With respect to the changing Coulomb stress along the conduit wall faults, our models suggest a differential conduit wall fault activation, with one side being preferentially activated, the other being clamped (Figures 7, 8). Aside from an inclined conduit, this may be another factor explaining the strong directionality in the observed dome growth. The existence of conduit wall faults is well known and documented, mainly as slip-surfaces (Pallister et al., 2013a; Kendrick et al., 2014; Ryan et al., 2018), but also as ductile shear bands (Tuffen and Dingwell, 2005); however a one-sided trap-door style extrusion as illustrated in Figure 8A has not been described or observed at growing lava domes before, this is only implied by our model. Normally this style of fault movement is seen in large scale caldera collapses (i.e., Lipman, 1997; Cole et al., 2005), whereas here we would assume a one-sided upwards movement as it occurs with resurgent blocks on a larger scale (Acocella et al., 2001). As our data are static, the extrusion movement cannot be clearly resolved, but considering the continuing extrusions eventually formed viscous lava flows, the fault movement was most likely accomplished by a combination of ductile and stick-slip movement.
Considering the factors discussed above, the directed dome growth at Volcán de Colima was most likely an effect of (1) load stress interaction, (2) shear fault movement originating from the conduit walls and (3) an inclined vent and shallow conduit. Impacts due to sloped emplacement are unlikely and the influence of a potential impermeable plug deflecting magma ascent remains unclear.
Method Limitations
The use of satellite radar, photogrammetry and seismic data to observe volcanic activity combined with numerical modeling introduces some inherent limitations. The most important ones will be briefly discussed here.
Remote Sensing Limitations
Our interpretation of the amplitude SAR-images may be biased by the acquisition geometry. The radar data contain shortening and lengthening at slopes due to the inclined sensor (foreshortening), distorting the image and potentially leading to layover and shadowing effects. Accurate geocoding with a suitable DEM, as done in this study, can correct some of these distortions; however, such geocoding may introduce other artifacts at points where the DEM (here Pleiades 2016) does not reflect the same topography as the SAR image (2013–2016), especially if they were generated at different times and the topography has changed among multiple images. The speckle filter applied here, while smoothing the image and enhancing important features, also lowers the resolution slightly. In this study, these effects impact the corrected SAR-images to a small degree as the crater showed many topographic changes and all SAR-images were geocoded with the same DEM. We used the SAR data to identify prominent brightness changes associated with topographic changes, which are very well resolved and discernable. Therefore, our SAR images are most likely only distorted to minor degrees, i.e., only at small topographic features such as cliffs and ledges. The features, outlines and positions of lava flows, domes and craters can still be recognized very clearly in the images (see e.g., the circular lava dome in Figure 4G). The same applies for the directions of dome growth or flows between subsequent images, so our interpretation of the images is not affected by the limitations listed above. The TSX data also agree well with the photogrammetry data and provide a very regular 11-day interval view onto the dome of the active volcano, whereas the photogrammetric data could only be realized when weather and funding allowed for overflights.
While the SAR data capture the entire volcanic edifice and permit the tracking of active lava flows down the volcano flank, all high-resolution SfM-MVS generated DEMs used in this study only cover the summit area within a few hundred meters of the vent. Additionally, contrary to SAR data, overflight data are only available on occasion and not all data can be used for photogrammetric processing as steam and gas often limit the visibility. In some cases this effect can be overcome with thermal images (Thiele et al., 2017), but this will result in lower spatial resolution models due to the limitations of such cameras. Here, our observations made outside of the summit area are affected by these limits, therefore we can only use occasional DEMs, acting as high-resolution snapshots to complement the SAR data.
As the SfM point clouds could not be georeferenced directly in Agisoft PhotoScan Professional, the ground sampling distance (GSD), a common indicator for the resolution of photogrammetric surveys, could not be calculated precisely and the imaging distances had to be estimated. Most surveys resulted in GSDs slightly better than 10 cm per pixel as indicated by the point distances within the cloud, but there may be some variations due to the number of different cameras, focal lengths and viewing distances applied. We omitted these by resolving all DEMs at 10 cm resolution, also providing consistency between the DEMs.
Seismic Data Limitations
The main purpose of the seismic data used (Figure 2) was to provide an overview of the dominant seismic signal during our study period based on frequency content. However, neither this type of analysis nor the location of the seismic station (closest to the crater at 1.7 km) are enough to detect and identify the details of dome extrusion mechanisms and directionality, which take place at a very shallow level in the volcanic system or at the crater's surface. Additional seismometers near to the crater or on the volcanic edifice might allow to pursue such a task, which is beyond the scope of this paper. For example, at Mount St. Helens Moran et al. (2008) used a network of seismic stations inside the crater and suggested that changes in drumbeat-seismicity characteristics (size and spacing) during the dome-building 2005 eruption were a function of the mechanics of extrusion rather than of the extrusion rate.
The seismic data provide a good overview of the current activity and the changing dominant eruptive modes, i.e., dome extrusion and explosions (Figure 2). However, there can be a significant delay in the onset of high-frequencies representing dome extrusion. One such delay occurred around May 2015 with the onset of renewed lava dome growth, when the dominant frequencies only changed to higher frequencies several weeks after the dome growth had started. This is likely due to the time gap between the initial dome growth within the crater and the overtopping the crater to produce rockfalls, which generate the high-frequency seismic signal. The true onset of dome growth can in general still be seen in the characteristics of individual seismic events; however, until rockfalls occur, high frequency signals are not dominant.
Model Limitations
Using a numerical model to explain real observations always includes a number of assumptions and simplifications. Our models are based on the gravitational loading derived from changing topography, which is not the same as the total stress. For example, the effects of internal magma and fluid pressure as well as material heterogeneities are neglected as they are very complex and difficult to include in such a model. This is unlikely to affect the general finding regarding the deflection of slip planes in response to load stresses. However, it is important to note that the real stress field within the volcanic edifice may be quite different compared to a simple gravitational model, and factors such as the dense plug discussed above may play an additional important role when addressing magma ascent directionality.
Another limitation of the model is the use of a 2D axisymmetric half-space to create a 3D model from a profile. This is a common simplification used in several similar studies (Chadwick et al., 1988; Corbi et al., 2016; Le Corvec et al., 2018) and is due to the difficult implementation of the large datasets and computing power that are required to use a full 3D surface model. While we manage to capture and include all important features including the conduit and vent positions, it is important to note that our model is derived from a change in topography of a 2D environment and is thus not a complete representation of the real morphology (e.g., variable crater depth or dome heights cannot be included). Here, we picked the rotated profile location (Figures 5A, 6) to be the best representation of the summit morphology.
The model relies on the concept that the conduit walls of the ascending magma column act as frictional planes (Costa et al., 2012; Kendrick et al., 2014), which is a reasonable assumption when considering highly viscous or solid magmas. However, these conduit faults are normally associated with spine-type lava domes such as Mount St. Helens, USA (Kendrick et al., 2012; Kennedy and Russell, 2012) or Mount Unzen, Japan (Hornby et al., 2015). At Volcán de Colima the viscosity of the magma is clearly lower, producing mostly lava lobes that transition to lava flows. This is also evidenced by the blocky surfaces of the extruded domes (Figures 5A–C, F–H), suggesting a viscous magma core fracturing a solid dome carapace through inflation. The extent to which a classic fault structure can be applied to the conduit of Volcán de Colima is not clear. However, recent insights into similar episodic activity expressed by seismicity and ground deformation highlight the relevance of conduit shear stresses even for viscous magmas (Neuberg et al., 2018). Previous models successfully predicted extrusion patterns (e.g., ground tilt) using only shear stress (Chadwick et al., 1988). Additionally, movements along the conduit occur by stick-slip motion (Kendrick et al., 2014), indicated by observed episodic extrusion patterns at Volcán de Colima (Walter et al., 2013a), which suggest that partial slip movements occur along discrete fault zones.
The use of Coulomb stress changes (ΔCFS) is restricted to the summit region only, yet the resulting values are high enough to compare to values seen on larger scales. Depending on depth in the conduit, the maximum Coulomb stress change is as large as 0.25 MPa. For context, stress changes of <0.01 MPa can be sufficient to induce failure and earthquakes (Stein, 1999). These values are high, given we only consider very local loads within a few hundred meters of the free surface. As the model used here assumes a purely elastic environment and is very close to the surface, this may induce an artificial stress-build up. However, the relative changes of increasing or decreasing Coulomb stress with respect to load stress are likely to have a real effect on the conduit faults.
Hazard Implications
The potential impact of both local and regional stresses carry some major implications for the hazard potential, especially for dome-building stratovolcanoes. PDCs originating from the collapse of lava domes are among the most deadly and destructive volcanic hazards. In the case of Volcán de Colima, they exceeded 10 km distance during the July 2015 eruption (Reyes-Dávila et al., 2016; Capra et al., 2018). This highlights that accurate assessment of potential scale and flow direction of these hazards is one of the most important tasks in volcanology.
Directed effusion and the development of new vents or their migration in response to load stress changes, as we propose for the 2013–2015 eruption at Volcán de Colima, will affect the direction of dome-related flows, explosions and collapses, and hence the distribution of hazards around the volcano, mainly PDCs, lava flows and possibly ballistic ejecta. The distribution of ashfall is likely only affected to a minor degree as the wind is the primary control on the ashfall direction. The second growth direction that developed at Volcán de Colima caused lava flows and PDCs to flow down the NE side of the volcano, whereas previous flows were directed mostly to the W and SW. Similarly, changes in the inclination of a growing dome will affect the stability of the dome, with collapses and resulting block-and-ash flows occurring more likely with a larger inclination.
The effects of unloading and the removal of large parts of a lava dome or crater wall will not only affect the local stress field and magma ascent direction, but will also remove pressure from magma stored in the shallow subsurface. A sudden drop in pressure can release volatiles entrained within an incompletely degassed magma and induce vesiculation and vesicle expansion (Alidibirov and Dingwell, 1996; Watts et al., 2002), leading to a strong increase in extrusion and ascent rate or explosive activity. A similar effect due to unloading at the summit is hypothesized to have been a driver of the 1913 eruption of Volcán de Colima (Massaro et al., 2018). Due to the increased ascent rate this can, in turn, affect the stability and shape of subsequent lava domes, with faster extrusion rates resulting in weaker lava dome rocks (Heap et al., 2016; Zorn et al., 2018) and so increase the risk of collapse.
Finally, regional tectonic stresses may control the orientation of fracturing in summit lava domes, leading to destabilization and partial collapse to form block-and-ash flows, e.g., at the Merapi lava dome (Walter et al., 2015; Darmawan et al., 2018). While no such observations have been made at a lava dome from Volcán de Colima, changes in eruption style due to regional stress changes have been observed (e.g., through tectonic earthquakes lowering lithostatic stress) (Sulpizio and Massaro, 2017), although their importance for Volcán de Colima remains unclear as there are many other potential explanations for this effect (Massaro et al., 2018).
The effects of directional dome growth on volcanic hazards presented here are described in the context of a simple shift in the direction of the erupting vent and dome growth. In reality, there are several other factors that influence the direction of hazards from a volcano, e.g., local ground morphology such as river valleys or breached calderas, redirecting or channeling PDCs (Major et al., 2013). Similarly, the dome volume, temperature, volatile charge and slope steepness will affect the mobility of such PDCs and thus their travel distance (Bourdier and Abdurachman, 2001; Cronin et al., 2013). The redirection of hazards due to shifting lava dome growth directionality is only one aspect and for a detailed hazard assessment, all the complexities of the potential hazards have to be considered.
Conclusions
Between January 2013 and February 2016 we observe four distinct phases of dome extrusion at Volcán de Colima including a prolonged west-directed dome growth followed by a removal of the dome with explosive crater excavation and finally renewed dome growth in two directions to the SW and NE. Modeling suggests that the emplacement and removal of the lava dome affected the local stress field and varied the direction of magma ascent and extrusion as well as the opening of new a vent, likely causing a conduit bifurcation. A growing lava dome will increasingly deflect conduit slip toward the added load, whereas an excavated crater will cause a diversion of slip direction toward the crater rim. The models provide a potential explanation to the observations made at Volcán de Colima and suggest that the dome growth stage in July 2015 reflects combined activity from a pre-established oblique conduit and a new vent formed in response to the earlier dome removal.
These results imply that small scale changes in crater morphology can sufficiently affect the local stress field to influence shallow magma ascent directions. This has implications for volcanic hazards posed by dome building volcanoes, as the position and growth directionality of the lava domes govern the direction of resulting PDCs or lava flows.
Author Contributions
EZ processed the photogrammetric data, analyzed the results and compared them to the numerical models. EZ also prepared the figures and wrote the manuscript. NLC contributed to the conception and execution of the numerical modeling with the data input based on the photogrammetric data by EZ. JS processed the radar data and provided some overflight photos. NV provided additional thermal and photogrammetric data and added valuable insight into eruptive processed from local observations. TW initiated and supervised the study, and added relevant scientific input. CN-O and RA provided nearly all photos from the overflight surveys and added valuable local information and logistics. DV-B provided and processed all seismic data and contributed to the construction of the eruptive timeline. ST contributed with observations from optical and thermal data, providing highly valuable insight into the eruptive processes and morphological and structural features. All authors contributed to the writing and editing of the manuscript.
Conflict of Interest Statement
The authors declare that the research was conducted in the absence of any commercial or financial relationships that could be construed as a potential conflict of interest.
Acknowledgments
This is a contribution to VOLCAPSE, a research project funded by the European Research Council under the European Union's H2020 Programme/ERC consolidator grant ERC-CoG 646858. We thank the DLR for support; the acquisition of the spotmode TerraSAR-X data was realized through proposal GEO1505. DV-B is grateful to CONACYT-PDCAPN project 2579.
We would like to thank Jose Manuel Álvarez Nieves for technical assistance during field work. We would also like to acknowledge Rogelio García Flores for providing helpful insight and data on Volcán de Colima photogrammetric surveys. Finally we thank Sébastien Valade for providing useful scripts for visualization of the results.
Supplementary Material
The Supplementary Material for this article can be found online at: https://www.frontiersin.org/articles/10.3389/feart.2019.00084/full#supplementary-material
Supplementary Material A. Video summary of the TerraSAR-X radar data during the study period in ascending geometry (ASC) and descending geometry (DSC). The videos also contain the seismic data from Figure 2 with the gray bars highlighting active extrusion.
Supplementary Material B. (a) RSAM (Real-time Seismic-Amplitude Measurement) per hour. (b) SSAM (Seismic Spectral-Amplitude Measurement). (c) Daily mean and mode of the dominant frequency calculated every 10 min in the range between 1 and 15 Hz, warm colors inside the circles of the estimated means indicate higher amplitude values of the power spectral density. (d) Ten minutes ratio of high (mean 5–12 Hz)-to-low (mean 1–5 Hz) spectral energy in log base 2 scale (Rodgers et al., 2015), red curve represents the daily moving average of the frequency ratio. (e) Rate of normalized seismic energy per hour (see Figure 2 for a broader description) at scales with 2j samples, where j corresponds to the numbers next to the colors in the figures inset.
Supplementary Material C. The following pages contain images of all DEMs generated from the aerial overflights over Volcán de Colima. They were all processed using the SfM-MVS workflow and resolved at 10 cm.
References
Acocella, V., Cifelli, F., and Funiciello, R. (2001). The control of overburden thickness on resurgent domes: insights from analogue models. J. Volcanol. Geother. Res. 111, 137–153. doi: 10.1016/S0377-0273(01)00224-4
Alidibirov, M., and Dingwell, D. B. (1996). Magma fragmentation by rapid decompression. Nature 380, 146–148. doi: 10.1038/380146a0
Arámbula-Mendoza, R., Reyes-Dávila, G., Vargas-Bracamontes Dulce, M., González-Amezcua, M., Navarro-Ochoa, C., Martínez-Fierros, A., et al. (2018). Seismic monitoring of effusive-explosive activity and large lava dome collapses during 2013–2015 at Volcán de Colima, Mexico. J. Volcanol. Geother. Res. 351, 75–88. doi: 10.1016/j.jvolgeores.2017.12.017
Arnold, D. W. D., Biggs, J., Anderson, K., Vallejo Vargas, S., Wadge, G., Ebmeier, S. K., et al. (2017). Decaying lava extrusion rate at El Reventador Volcano, Ecuador, measured using high-resolution satellite radar. J. Geophys. Res. Solid Earth 122, 9966–9988. doi: 10.1002/2017JB014580
Bagnardi, M., González, P. J., and Hooper, A. (2016). High-resolution digital elevation model from tri-stereo Pleiades-1 satellite imagery for lava flow volume estimates at Fogo Volcano. Geophys. Res. Lett. 43, 6267–6275. doi: 10.1002/2016GL069457
Bemis, S. P., Micklethwaite, S., Turner, D., James, M. R., Akciz, S. T., and Bangash, H. A. (2014). Ground-based and UAV-Based photogrammetry: a multi-scale, high-resolution mapping tool for structural geology and paleoseismology. J. Struct. Geol. 69, 163–178. doi: 10.1016/j.jsg.2014.10.007
Bourdier, J. L., and Abdurachman, E. (2001). Decoupling of small-volume pyroclastic flows and related hazards at Merapi volcano, Indonesia. Bull. Volcanol. 63, 309–325. doi: 10.1007/s004450100133
Byerlee, J. (1978). “Friction of rocks,” in Rock Friction and Earthquake Prediction, eds J. D. Byerlee and M. Wyss (Birkhäuser Basel: Basel), 615–626. doi: 10.1007/978-3-0348-7182-2_4
Capra, L., Sulpizio, R., Márquez-Ramirez, V. H., Coviello, V., Doronzo, D. M., Arambula-Mendoza, R., et al. (2018). The anatomy of a pyroclastic density current: the 10 July 2015 event at Volcán de Colima (Mexico). Bull. Volcanol. 80:34. doi: 10.1007/s00445-018-1206-4
Chadwick, W. W., Archuleta, R. J., and Swanson, D. A. (1988). The mechanics of ground deformation precursory to dome-building extrusions at Mount St. Helens 1981-1982. J. Geophys. Res. 93, 4351–4366. doi: 10.1029/JB093iB05p04351
Chaussard, E. (2017). A low-cost method applicable worldwide for remotely mapping lava dome growth. J. Volcanol. Geother. Res. 341, 33–41. doi: 10.1016/j.jvolgeores.2017.05.017
Cole, J. W., Milner, D. M., and Spinks, K. D. (2005). Calderas and caldera structures: a review. Earth Sci. Rev. 69, 1–26. doi: 10.1016/j.earscirev.2004.06.004
Corbi, F., Rivalta, E., Pinel, V., Maccaferri, F., and Acocella, V. (2016). Understanding the link between circumferential dikes and eruptive fissures around calderas based on numerical and analog models. Geophys. Res. Lett. 43, 6212–6219. doi: 10.1002/2016GL068721
Costa, A., Wadge, G., and Melnik, O. (2012). Cyclic extrusion of a lava dome based on a stick-slip mechanism. Earth Planet. Sci. Lett. 337–338, 39–46. doi: 10.1016/j.epsl.2012.05.011
Cronin, S. J., Lube, G., Dayudi, D. S., Sumarti, S., Subrandiyo, S., and Surono (2013). Insights into the October–November 2010 Gunung Merapi eruption (Central Java, Indonesia) from the stratigraphy, volume and characteristics of its pyroclastic deposits. J. Volcanol. Geother. Res. 261, 244–259. doi: 10.1016/j.jvolgeores.2013.01.005
Dai, C., and Howat, I. M. (2017). Measuring lava flows with ArcticDEM: application to the 2012–2013 eruption of Tolbachik, Kamchatka. Geophys. Res. Lett. 44, 12133–12140. doi: 10.1002/2017GL075920
Darmawan, H., Walter, T. R., Brotopuspito, K. S., and Subandriyo Nandaka, I. G. M. A. (2018). Morphological and structural changes at the Merapi lava dome monitored in 2012–15 using unmanned aerial vehicles (UAVs). J. Volcanol. Geother. Res. 349, 256–267. doi: 10.1016/j.jvolgeores.2017.11.006
Davila, N., Capra, L., Gavilanes-Ruiz, J. C., Varley, N., Norini, G., and Vazquez, A. G. (2007). Recent lahars at Volcán de Colima (Mexico): drainage variation and spectral classification. J. Volcanol. Geother. Res. 165, 127–141. doi: 10.1016/j.jvolgeores.2007.05.016
Diefenbach, A. K., Bull, K. F., Wessels, R. L., and McGimsey, R. G. (2013). Photogrammetric monitoring of lava dome growth during the 2009 eruption of Redoubt Volcano. J. Volcanol. Geother. Res. 259, 308–316. doi: 10.1016/j.jvolgeores.2011.12.009
Diefenbach, A. K., Crider, J. G., Schilling, S. P., and Dzurisin, D. (2012). Rapid, low-cost photogrammetry to monitor volcanic eruptions: an example from Mount St. Helens, Washington, USA. Bull. Volcanol. 74, 579–587. doi: 10.1007/s00445-011-0548-y
Freed, A. M. (2005). Earthquake triggering by static, dynamic, and postseismic stress transfer. Ann. Rev. Earth Planet. Sci. 33, 335–367. doi: 10.1146/annurev.earth.33.092203.122505
Gomez, C., Lavigne, F., Sri Hadmoko, D., and Wassmer, P. (2018). Insights into lahar deposition processes in the Curah Lengkong (Semeru Volcano, Indonesia) using photogrammetry-based geospatial analysis, near-surface geophysics and CFD modelling. J. Volcanol. Geother. Res. 353, 102–113. doi: 10.1016/j.jvolgeores.2018.01.021
González, M. B. J., Ramirez, J., and Navarro, C. (2002). Summary of the historical eruptive activity of Volcán De Colima, Mexico 1519–2000. J. Volcanol. Geother. Res. 117, 21–46. doi: 10.1016/S0377-0273(02)00233-0
Grosfils, E. B. (2007). Magma reservoir failure on the terrestrial planets: assessing the importance of gravitational loading in simple elastic models. J. Volcanol. Geother. Res. 166, 47–75. doi: 10.1016/j.jvolgeores.2007.06.007
Grosfils, E. B., McGovern, P. J., Gregg, P. M., Galgana, G. A., Hurwitz, D. M., Long, S. M., et al. (2015). Elastic models of magma reservoir mechanics: a key tool for investigating planetary volcanism. Geol. Soc. 401, 239–267. doi: 10.1144/SP401.2
Hale, A. J., and Wadge, G. (2008). The transition from endogenous to exogenous growth of lava domes with the development of shear bands. J. Volcanol. Geother. Res. 171, 237–257. doi: 10.1016/j.jvolgeores.2007.12.016
Harnett, C. E., Thomas, M. E., Purvance, M. D., and Neuberg, J. (2018). Using a discrete element approach to model lava dome emplacement and collapse. J. Volcanol. Geother. Res. 359, 68–77. doi: 10.1016/j.jvolgeores.2018.06.017
Heap, M. J., Lavallée, Y., Petrakova, L., Baud, P., Reuschlé, T., Varley, N. R., et al. (2014). Microstructural controls on the physical and mechanical properties of edifice-forming andesites at Volcán de Colima, Mexico. J. Geophys. Res. 119, 2925–2963. doi: 10.1002/2013JB010521
Heap, M. J., Russell, J. K., and Kennedy, L. A. (2016). Mechanical behaviour of dacite from Mount St. Helens (USA): a link between porosity and lava dome extrusion mechanism (dome or spine)? J. Volcanol. Geother. Res. 328, 159–177. doi: 10.1016/j.jvolgeores.2016.10.015
Herd, R. A., Edmonds, M., and Bass, V. A. (2005). Catastrophic lava dome failure at Soufrière Hills Volcano, Montserrat, 12–13 July 2003. J. Volcanol. Geother. Res. 148, 234–252. doi: 10.1016/j.jvolgeores.2005.05.003
Hoek, E., and Brown, E. T. (1997). Practical estimates of rock mass strength. Int. J. Rock Mech. Mining Sci. 34, 1165–1186. doi: 10.1016/S1365-1609(97)80069-X
Hornby, A. J., Kendrick, J. E., Lamb, O. D., Hirose, T., De Angelis, S., Aulock, F. W., et al. (2015). Spine growth and seismogenic faulting at Mt. Unzen, Japan. J. Geophys. Res. 120, 4034–4054. doi: 10.1002/2014JB011660
Husain, T., Elsworth, D., Voight, B., Mattioli, G., and Jansma, P. (2014). Influence of extrusion rate and magma rheology on the growth of lava domes: insights from particle-dynamics modeling. J. Volcanol. Geother. Res. 285, 100–117. doi: 10.1016/j.jvolgeores.2014.08.013
Hutchison, W., Varley, N., Pyle, D. M., Mather, T. A., and Stevenson, J. A. (2013). Airborne thermal remote sensing of the Volcán de Colima (Mexico) lava dome from 2007 to 2010. Geol. Soc. 380, 203–228. doi: 10.1144/SP380.8
Iverson, R. M., Dzurisin, D., Gardner, C. A., Gerlach, T. M., LaHusen, R. G., Lisowski, M., et al. (2006). Dynamics of seismogenic volcanic extrusion at Mount St Helens in 2004–05. Nature 444, 439–443. doi: 10.1038/nature05322
James, M. R., and Varley, N. (2012). Identification of structural controls in an active lava dome with high resolution DEMs: Volcán de Colima, Mexico. Geophys. Res. Lett. 39, 1–5. doi: 10.1029/2012GL054245
Kendrick, J. E., Lavallée, Y., Ferk, A., Perugini, D., Leonhardt, R., and Dingwell, D. B. (2012). Extreme frictional processes in the volcanic conduit of Mount St. Helens (USA) during the 2004–2008 eruption. J. Struct. Geol. 38, 61–76. doi: 10.1016/j.jsg.2011.10.003
Kendrick, J. E., Lavallée, Y., Hirose, T., Di Toro, G., Hornby, A. J., De Angelis, S., et al. (2014). Volcanic drumbeat seismicity caused by stick-slip motion and magmatic frictional melting. Nat. Geosci. 7, 438–442. doi: 10.1038/ngeo2146
Kennedy, L. A., and Russell, J. K. (2012). Cataclastic production of volcanic ash at Mount Saint Helens. Phys. Chem. Earth 45–46, 40–49. doi: 10.1016/j.pce.2011.07.052
Kubanek, J., Westerhaus, M., Schenk, A., Aisyah, N., Brotopuspito, K. S., and Heck, B. (2015). Volumetric change quantification of the 2010 Merapi eruption using TanDEM-X InSAR. Remote Sens. Environ. 164, 16–25. doi: 10.1016/j.rse.2015.02.027
Kubanek, J., Westerhaus, M., Varley, N., James, M. R., and Heck, B. (2014). “On using bistatic TanDEM-X data for volcano monitoring, EUSAR 2014,” in 10th European Conference on Synthetic Aperture Radar (Berlin), 862–865.
Lamb, O. D., Varley, N. R., Mather, T. A., Pyle, D. M., Smith, P. J., and Liu, E. J. (2014). Multiple timescales of cyclical behaviour observed at two dome-forming eruptions. J. Volcanol. Geother. Res. 284, 106–121. doi: 10.1016/j.jvolgeores.2014.07.013
Lavallée, Y., Varley, N. R., Alatorre-Ibargüengoitia, M. A., Hess, K. U., Kueppers, U., Mueller, S., et al. (2012). Magmatic architecture of dome-building eruptions at Volcán de Colima, Mexico. Bull. Volcanol. 74, 249–260. doi: 10.1007/s00445-011-0518-4
Le Corvec, N., Muirhead, J. D., and White, J. D. L. (2018). Shallow magma diversions during explosive diatreme-forming eruptions. Nat. Commun. 9:1459. doi: 10.1038/s41467-018-03865-x
Lipman, P. W. (1997). Subsidence of ash-flow calderas: relation to caldera size and magma-chamber geometry. Bull. Volcanol. 59, 198–218. doi: 10.1007/s004450050186
Luhr, J. F. (2002). Petrology and geochemistry of the 1991 and 1998-1999 lava flows from Volcán de Colima, México: implications for the end of the current eruptive cycle. J. Volcanol. Geother. Res. 117, 169–194. doi: 10.1016/S0377-0273(02)00243-3
Luhr, J. F., and Carmichael, I. S. E. (1980). The Colima Volcanic complex, Mexico - I. Post-caldera andesites from Volcán Colima. Contribut. Mineral. Petrol. 71, 343–372. doi: 10.1007/BF00374707
Maccaferri, F., Richter, N., and Walter, T. R. (2017). The effect of giant lateral collapses on magma pathways and the location of volcanism. Nat. Commun. 8, 1–11. doi: 10.1038/s41467-017-01256-2
Macías, J. L., Sosa-Ceballos, G., Arce, J. L., Gardner, J. E., Saucedo, R., and Valdez-Moreno, G. (2017). Storage conditions and magma processes triggering the 1818CE Plinian eruption of Volcán de Colima. J. Volcanol. Geother. Res. 340, 117–129. doi: 10.1016/j.jvolgeores.2017.02.025
Major, J. J., Pierson, T. C., Hoblitt, R. P., and Moreno, H. (2013). Pyroclastic density currents associated with the 2008-2009 eruption of Chaitén Volcano (Chile): forest disturbances, deposits, and dynamics. Andean Geol. 40, 324–358. doi: 10.5027/andgeoV40n2-a09
Massaro, S., Sulpizio, R., Costa, A., Capra, L., and Lucchi, F. (2018). Understanding eruptive style variations at calc-alkaline volcanoes: the 1913 eruption of Fuego de Colima volcano (Mexico). Bull. Volcanol. 80:62. doi: 10.1007/s00445-018-1235-z
Moran, S. C., Malone, S. D., Qamar, A. I., Thelen, W. A., Wright, A. K., and Caplan-Auerbach, J. (2008). “Seismicity associated with renewed dome building at Mount St. Helens, 2004-2005,” in Chapter 2 in A Volcano Rekindled: The Renewed Eruption of Mount St. Helens, 2004-2006,” eds D. R. Sherrod, W. E. Scott and P. H. Stauffer (Reston, VA: U. S. Geological Survey Professional Paper), 27–60.
Nakamura, K. (1977). Volcanoes as possible indicators of tectonic stress orientation — principle and proposal. J. Volcanol. Geother. Res. 2, 1–16. doi: 10.1016/0377-0273(77)90012-9
Neuberg, J. W., Collinson, A. S. D., Mothes, P. A. C., Ruiz, M., and Aguaiza, S. (2018). Understanding cyclic seismicity and ground deformation patterns at volcanoes: intriguing lessons from Tungurahua volcano, Ecuador. Earth Planet. Sci. Lett. 482, 193–200. doi: 10.1016/j.epsl.2017.10.050
Ogburn, S. E., Loughlin, S. C., and Calder, E. S. (2015). The association of lava dome growth with major explosive activity (VEI ≥ 4): DomeHaz, a global dataset. Bull. Volcanol. 77, 1–17. doi: 10.1007/s00445-015-0919-x
Pallister, J., Wessels, R., Griswold, J., McCausland, W., Kartadinata, N., Gunawan, H., et al. (2018). Monitoring, forecasting collapse events, and mapping pyroclastic deposits at Sinabung volcano with satellite imagery. J. Volcanol. Geother. Res. doi: 10.1016/j.jvolgeores.2018.05.012
Pallister, J. S., Cashman, K. V., Hagstrum, J. T., Beeler, N. M., Moran, S. C., and Denlinger, R. P. (2013a). Faulting within the Mount St. Helens conduit and implications for volcanic earthquakes. Bull. Geol. Soc. Am. 125, 359–376. doi: 10.1130/B30716.1
Pallister, J. S., Diefenbach, A. K., Burton, W. C., Muñoz, J., Griswold, J. P., Lara, L. E., et al. (2013b). The chaitén Rhyolite lava dome: eruption sequence, lava dome volumes, rapid effusion rates and source of the Rhyolite magma. Andean Geol. 40, 277–294. doi: 10.5027/andgeoV40n2-a06
Pallister, J. S., Schneider, D. J., Griswold, J. P., Keeler, R. H., Burton, W. C., Noyles, C., et al. (2013c). Merapi 2010 eruption—Chronology and extrusion rates monitored with satellite radar and used in eruption forecasting. J. Volcanol. Geother. Res. 261, 144–152. doi: 10.1016/j.jvolgeores.2012.07.012
Pedersen, G. B. M., Belart, J. M. C., Magnússon, E., Vilmundardóttir, O. K., Kizel, F., Sigurmundsson, F. S., et al. (2018). Hekla Volcano, Iceland, in the 20th Century: lava volumes, production rates, and effusion rates. Geophys. Res. Lett. 45, 1805–1813. doi: 10.1002/2017GL076887
Reyes-Dávila, G. A., Arámbula-Mendoza, R., Espinasa-Pereña, R., Pankhurst, M. J., Navarro-Ochoa, C., Savov, I., et al. (2016). Volcán de Colima dome collapse of July, 2015 and associated pyroclastic density currents. J. Volcanol. Geother. Res. 320, 100–106. doi: 10.1016/j.jvolgeores.2016.04.015
Rivalta, E., Taisne, B., Bunger, A. P., and Katz, R. F. (2015). A review of mechanical models of dike propagation: schools of thought, results and future directions. Tectonophysics 638, 1–42. doi: 10.1016/j.tecto.2014.10.003
Rodgers, M., Roman, D. C., Geirsson, H., LaFemina, P., McNutt, S. R., Muñoz, A., et al. (2015). Stable and unstable phases of elevated seismic activity at the persistently restless Telica Volcano, Nicaragua. J. Volcanol. Geotherm. Res. 290, 63–74. doi: 10.1016/j.jvolgeores.2014.11.012
Roth, A., Eineder, M., and Schättler, B. (2003). “TerraSAR-X: a new perspective for applications requiring high resolution spaceborne SAR data,” in Proceedings of the Joint ISPRS, EarSel Workshop on High Resolution Mapping from Space (Hannover), 2003, 1–4.
Roverato, M., Capra, L., Sulpizio, R., and Norini, G. (2011). Stratigraphic reconstruction of two debris avalanche deposits at Colima Volcano (Mexico): insights into pre-failure conditions and climate influence. J. Volcanol. Geother. Res. 207, 33–46. doi: 10.1016/j.jvolgeores.2011.07.003
Rubin, A. M. (1995). Propagation of magma-filled cracks. Ann. Rev. Earth Planet. Sci. 23, 287–336. doi: 10.1146/annurev.ea.23.050195.001443
Ryan, A. G., Friedlander, E. A., Russell, J. K., Heap, M. J., and Kennedy, L. A. (2018). Hot pressing in conduit faults during lava dome extrusion: Insights from Mount St. Helens 2004–2008. Earth Planet. Sci. Lett. 482, 171–180. doi: 10.1016/j.epsl.2017.11.010
Salzer, J. T., Milillo, P., Varley, N., Perissin, D., Pantaleo, M., and Walter, T. R. (2017). Evaluating links between deformation, topography and surface temperature at volcanic domes: results from a multi-sensor study at Volcán de Colima, Mexico. Earth Planet. Sci. Lett. 479, 354–365. doi: 10.1016/j.epsl.2017.09.027
Salzer, J. T., Nikkhoo, M., Walter, T. R., Sudhaus, H., Reyes-Dávila, G., Bretón, M., et al. (2014). Satellite radar data reveal short-term pre-explosive displacements and a complex conduit system at Volcán de Colima, Mexico. Front. Earth Sci. 2, 1–11. doi: 10.3389/feart.2014.00012
Salzer, J. T., Thelen, W. A., James, M. R., Walter, T. R., Moran, S., and Denlinger, R. (2016). Volcano dome dynamics at Mount St. Helens: Deformation and intermittent subsidence monitored by seismicity and camera imagery pixel offsets. J. Geophys. Res. 121, 7882–7902. doi: 10.1002/2016JB013045
Saucedo, R., Macías, J. L., Gavilanes, J. C., Arce, J. L., Komorowski, J. C., Gardner, J. E., et al. (2010). Eyewitness, stratigraphy, chemistry, and eruptive dynamics of the 1913 Plinian eruption of Volcán de Colima, México. J. Volcanol. Geother. Res. 191, 149–166. doi: 10.1016/j.jvolgeores.2010.01.011
Stein, R. S. (1999). The role of stress transfer in earthquake occurrence. Nature 402, 605–609. doi: 10.1038/45144
Stein, R. S., Barka, A. A., and Dieterich, J. H. (1997). Progressive failure on the North Anatolian fault since 1939 by earthquake stress triggering. Geophys. J. Int. 128, 594–604. doi: 10.1111/j.1365-246X.1997.tb05321.x
Sulpizio, R., and Massaro, S. (2017). Influence of stress field changes on eruption initiation and dynamics: a review. Front. Earth Sci. 5:18. doi: 10.3389/feart.2017.00018
Surono, J. P., Pallister, J., Boichu, M., Buongiorno, M. F., Budisantoso, A., Lavigne, F., et al. (2012). The 2010 explosive eruption of Java's Merapi volcano—A ‘100-year' event. J. Volcanol. Geother. Res. 241–242, 121–135. doi: 10.1016/j.jvolgeores.2012.06.018
Tanguy, J.-C. (1994). The 1902–1905 eruptions of Montagne Pelée, Martinique: anatomy and retrospection. J. Volcanol. Geother. Res. 60, 87–107. doi: 10.1016/0377-0273(94)90064-7
Thiele, S. T., Varley, N., and James, M. R. (2017). Thermal photogrammetric imaging: a new technique for monitoring dome eruptions. J. Volcanol. Geother. Res. 337, 140–145. doi: 10.1016/j.jvolgeores.2017.03.022
Tuffen, H., and Dingwell, D. (2005). Fault textures in volcanic conduits: evidence for seismic trigger mechanisms during silicic eruptions. Bull. Volcanol. 67, 370–387. doi: 10.1007/s00445-004-0383-5
Vallance, J. W., Schneider, D. J., and Schilling, S. P. (2008). “Growth of the 2004-2006 lava-dome complex at Mount St. Helens, Washington,” in A Volcano Rekindled: The Renewed Eruption of Mount St. Helens, 2004-2006, eds D. R. Sherrod, W. E. Scott and P. H. Stauffer (Reston, VA: U.S. Geological Survey Professional Paper), 169–208.
Vargas-Bracamontes, D. M., Nava, F. A., and Reyes-Dávila, G. A. (2009). Time-scale wavelet patterns related to the 1998-1999 eruptions of the Colima volcano, and their possible implications for eruption forecasting. J. Volcanol. Geother. Res. 184, 271–284. doi: 10.1016/j.jvolgeores.2009.01.025
Varley, N. R., Arámbula-Mendoza, R., Reyes-Dávila, G., Stevenson, J., and Harwood, R. (2010). Long-period seismicity during magma movement at Volcán de Colima. Bull. Volcanol. 72, 1093–1107. doi: 10.1007/s00445-010-0390-7
Voight, B. (2000). Structural stability of andesite volcanoes and lava domes. Philos. Trans. R. Soc. London 358, 1663–1703. doi: 10.1098/rsta.2000.0609
Walder, J. S., LaHusen, R. G., Vallance, J. W., and Schilling, S. P. (2007). Emplacement of a silicic lava dome through a crater glacier: Mount St. Helens, 2004–06. Ann. Glaciol. 45, 14–20. doi: 10.3189/172756407782282426
Walter, T. R. (2011). Low cost volcano deformation monitoring: optical strain measurement and application to Mount St. Helens data. Geophys. J. Int. 186, 699–705. doi: 10.1111/j.1365-246X.2011.05051.x
Walter, T. R., Harnett, C. E., Varley, N., Bracamontes, D. V., Salzer, J., Zorn, E. U., et al. (2019). Imaging the 2013 explosive crater excavation and new dome formation at Volcán de Colima with TerraSAR-X, time-lapse cameras and modelling. J. Volcanol. Geother. Res. 369, 224–237. doi: 10.1016/j.jvolgeores.2018.11.016
Walter, T. R., Legrand, D., Granados, H. D., Reyes, G., and Arámbula, R. (2013a). Volcanic eruption monitoring by thermal image correlation: pixel offsets show episodic dome growth of the Colima volcano. J. Geophys. Res. Solid Earth 118, 1408–1419. doi: 10.1002/jgrb.50066
Walter, T. R., Ratdomopurbo, A., Subandriyo, A. N., Brotopuspito, K. S., Salzer, J., and Lühr, B. (2013b). Dome growth and coulée spreading controlled by surface morphology, as determined by pixel offsets in photographs of the 2006 Merapi eruption. J. Volcanol. Geother. Res. 261, 121–129. doi: 10.1016/j.jvolgeores.2013.02.004
Walter, T. R., Salzer, J., Varley, N., Navarro, C., Arámbula-Mendoza, R., and Vargas-Bracamontes, D. (2018). Localized and distributed erosion triggered by the 2015 Hurricane Patricia investigated by repeated drone surveys and time lapse cameras at Volcán de Colima, Mexico. Geomorphology 319, 186–198. doi: 10.1016/j.geomorph.2018.07.020
Walter, T. R., Subandriyo, J., Kirbani, S., Bathke, H., Suryanto, W., Aisyah, N., et al. (2015). Volcano-tectonic control of Merapi's lava dome splitting: the November 2013 fracture observed from high resolution TerraSAR-X data. Tectonophysics 639, 23–33. doi: 10.1016/j.tecto.2014.11.007
Wang, T., Poland, M. P., and Lu, Z. (2015). Dome growth at Mount Cleveland, Aleutian Arc, quantified by time series TerraSAR-X imagery. Geophys. Res. Lett. 42, 10614–10621. doi: 10.1002/2015GL066784
Watts, R. B., Herd, R. A., Sparks, R. S. J., and Young, S. R. (2002). Growth patterns and emplacement of the andesitic lava dome at Soufrière Hills Volcano, Montserrat. Geol. Soc. 21, 115–152. doi: 10.1144/GSL.MEM.2002.021.01.06
Welch, M. D., and Schmidt, D. A. (2017). Separating volcanic deformation and atmospheric signals at Mount St. Helens using persistent scatterer InSAR. J. Volcanol. Geother. Res. 344, 52–64. doi: 10.1016/j.jvolgeores.2017.05.015
Werner, C., Wegmüller, U., Strozzi, T., and Wiesmann, A. (2000). “Gamma SAR and interferometric processing software,” in Proceedings of the Ers-envisat Symposium, (Gothenburg), 1–9.
Westoby, M. J., Brasington, J., Glasser, N. F., Hambrey, M. J., and Reynolds, J. M. (2012). ‘Structure-from-motion' photogrammetry: a low-cost, effective tool for geoscience applications. Geomorphology 179, 300–314. doi: 10.1016/j.geomorph.2012.08.021
Witham, C. S. (2005). Volcanic disasters and incidents: a new database. J. Volcanol. Geother. Res. 148, 191–233. doi: 10.1016/j.jvolgeores.2005.04.017
Keywords: lava dome, load stress, Volcán de Colima, TerraSAR-X, photogrammetry, finite element modeling
Citation: Zorn EU, Le Corvec N, Varley NR, Salzer JT, Walter TR, Navarro-Ochoa C, Vargas-Bracamontes DM, Thiele ST and Arámbula Mendoza R (2019) Load Stress Controls on Directional Lava Dome Growth at Volcán de Colima, Mexico. Front. Earth Sci. 7:84. doi: 10.3389/feart.2019.00084
Received: 14 December 2018; Accepted: 08 April 2019;
Published: 07 May 2019.
Edited by:
Roberto Sulpizio, University of Bari Aldo Moro, ItalyReviewed by:
Jon J. Major, United States Geological Survey, United StatesSilvia Massaro, Italian National Research Council (CNR), Italy
Copyright © 2019 Zorn, Le Corvec, Varley, Salzer, Walter, Navarro-Ochoa, Vargas-Bracamontes, Thiele and Arámbula Mendoza. This is an open-access article distributed under the terms of the Creative Commons Attribution License (CC BY). The use, distribution or reproduction in other forums is permitted, provided the original author(s) and the copyright owner(s) are credited and that the original publication in this journal is cited, in accordance with accepted academic practice. No use, distribution or reproduction is permitted which does not comply with these terms.
*Correspondence: Edgar U. Zorn, em9ybkBnZnotcG90c2RhbS5kZQ==