 Xuefeng Yu
 Jiquan Chen
 Yanhong Zheng4
 Zutao Ouyang
- 1State Key Laboratory of Loess and Quaternary Geology, Institute of Earth Environment, Chinese Academy of Sciences, Xi’an, China
- 2Shaanxi Key Laboratory of Accelerator Mass Spectrometry (AMS) Technology and Application, Xi’an AMS Center, Xi’an, China
- 3Department of Geography, Michigan State University, East Lansing, MI, United States
- 4State Key Laboratory of Continental Dynamics, Department of Geology, Northwest University, Xi’an, China
- 5School of Geography Science, South China Normal University, Guangzhou, China
- 6Department of Earth System Science, Stanford University, Stanford, CA, United States
To examine the spatial patterns of hydrological variations in the southern and northern East Asia Monsoonal (EAM) region on millennial time scales, as well as to investigate the relationship between hydrological changes and carbon accumulation in these regions with contrasting environmental backgrounds, we performed facies-based hydrological reconstructions in two wetlands, Midiwan wetland (37°39′N, 108°37′E) and Dahu wetland (24°45′N, 115°2′E), located in a semi-arid loess-desert transitional zone and humid southern China, respectively. Our reconstructions revealed an anti-phase pattern of the precipitation in these two wetlands on a millennial time scale. However, with the different responses to the contrasting hydrological conditions, the carbon accumulations at these two sites showed an in-phase patterns on a millennial time scale. Our results imply that the carbon accumulations at these two sites are mainly controlled by local hydrologic conditions. The wetlands in both southern and northern China were found to be expanding during the interval from 6 to 4 cal. ka BP (ka = kilo annum), as inferred by a higher total organic carbon (TOC) content. For the Mystery Interval (MI, from 17.5 to 14.5 cal. ka BP), however, both hydrological conditions and carbon accumulations at these two sites showed an in-phase pattern.
Introduction
Wetland represents one of the most important terrestrial ecosystems with its natural accumulation of organic matter closely related to hydrological processes (Billett et al., 2004; Holden, 2005). Although it only accounts for 3% of the global terrestrial land area, wetlants are regarded as one of the most important carbon reservoirs due to its high carbon density (Frolking and Crill, 1994; Blodau, 2002; Strack et al., 2006; Limpens et al., 2008; Yu et al., 2010; Leifeld et al., 2019). It is both a natural and an anthropogenic source of greenhouse gases (e.g., CH4) emission to the atmosphere because of its significant changes in decomposition processes under different climates, harvests, and disturbances such as fires (Zoltai et al., 1998; Page et al., 2002; Olson et al., 2013; Chimner et al., 2017; Rigney et al., 2018).
Carbon accumulation in a wetland is determined by the balance of the photosynthetic uptake and decomposition loss mainly controlled by regional climatic conditions, especially the hydrological process (Frolking et al., 2010; Rennermalm et al., 2010). Generally, carbon accumulation increases with an increase in soil moisture that is influenced by groundwater level or precipitation (Nijp et al., 2019; Lazcano et al., 2020). However, at some waterlogged sites, carbon accumulation decreases with the increase in soil water because of the inhibition of a seeper to the growth of plants (Figure 1). Here, we put forward a conceptual framework by hypothesizing that there will be two cases for the relationship between total organic carbon (TOC) accumulation and soil moisture conditions in wetlands with typical hydrological conditions of A and B types (Figure 1): (1) the variations in TOC at two wetlands would be anti-phased if the variations in precipitation at the two sites are in-phase, or (2) the variations in TOC would be in-phased if precipitation at the two sites is anti-phase. For the latter case, there may exist several periods during which the proportions of both wetlands increase. Therefore, the total carbon accumulation is ultimately determined by the spatial pattern of hydrology.
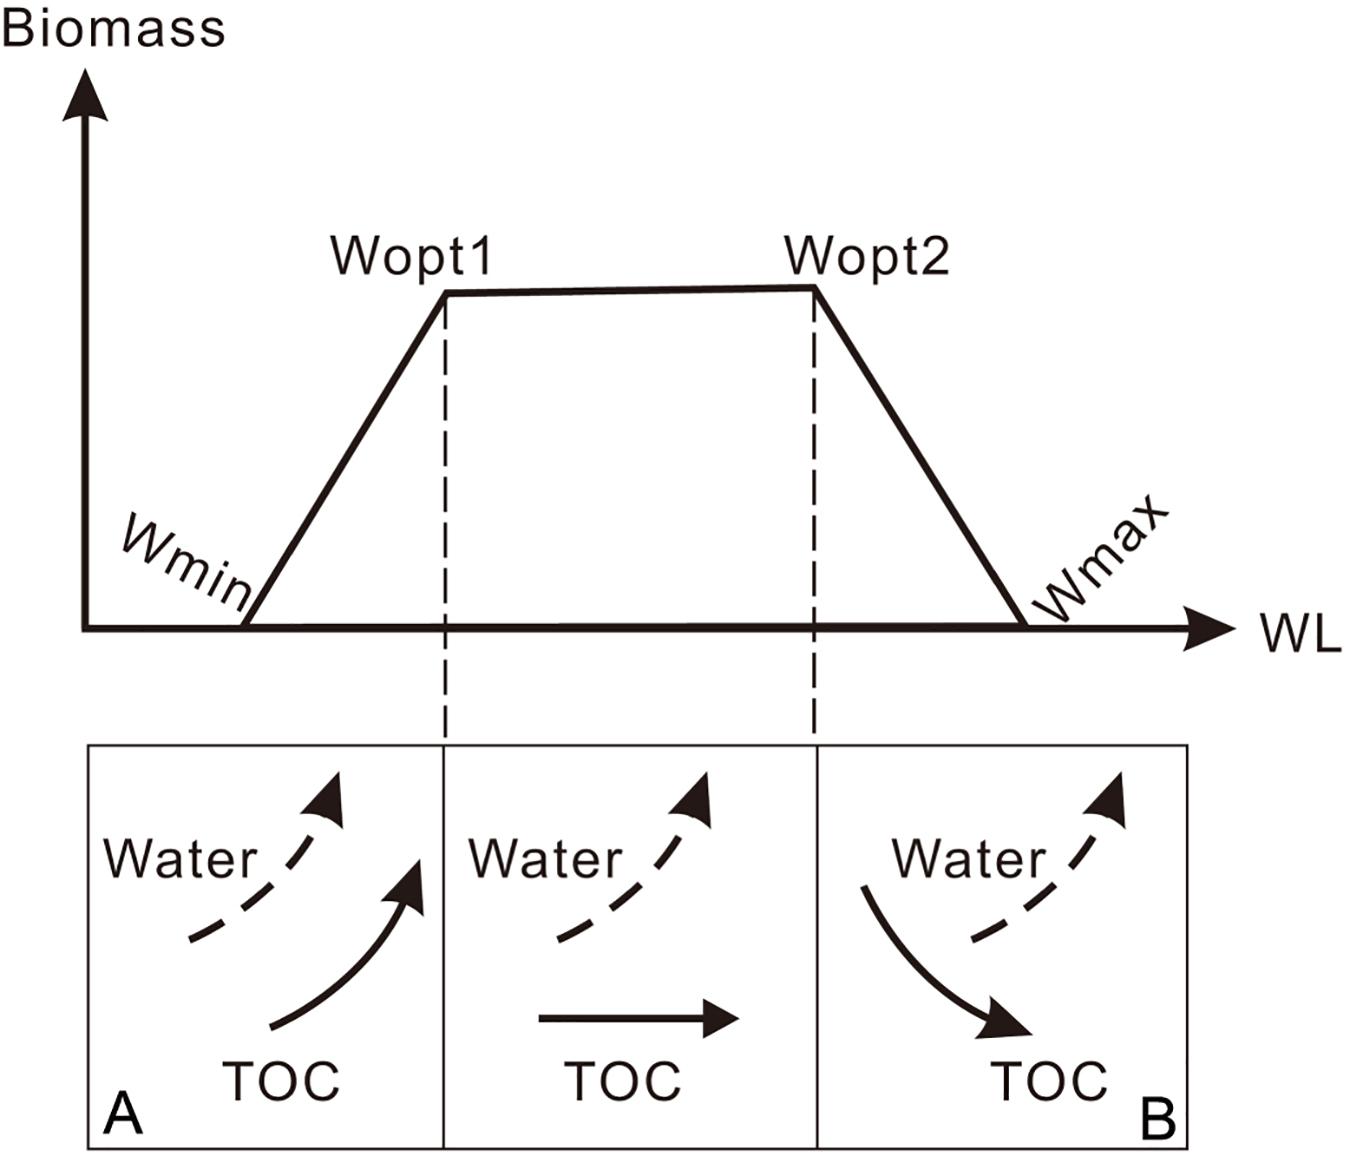
Figure 1. Conceptual model showing the relationship between the water content of soil (WL) and soil carbon accumulation (CA). The upper plot is for the WL (horizontal axis) and plant production (ordinates) and the lower for the WL and carbon accumulation. A and B show the typical relationship between the WL and CA in two contrasting hydrological conditions.
From a global perspective, there are spatial differences in precipitation as well as in trends in different regions (Wang et al., 2012). Numerical modeling studies revealed that the variation in summer precipitation in northern and southern East Asia exhibits an anti-phase pattern on the orbital time scale due to the ENSO-like response to orbital forcing (Shi et al., 2012). Stable carbon isotope records of peat sequences from the eastern Tibetan Plateau and northeastern China also show an anti-phase pattern of monsoon precipitation on the millennial-centennial time scale (Hong et al., 2005, 2010, 2014). A recent reconstruction of lake levels at Lake Chenghai in southwest China also showed an out-phase variation of precipitation on orbital time scale in southwest China with boreal summer insolation that was regarded as the driver of Asian summer monsoon precipitation (Xu et al., 2020). For northern and southern East Asia, however, it is unclear whether the anti-phased spatial pattern of monsoonal precipitation exists on the millennial time scale. More importantly, the relationship between carbon accumulation and regional hydrological conditions in southern and northern East Asia remains unknown. More studies on archives containing information about hydrological processes and carbon cycling are needed for understanding the history, variability, and dynamics of environmental change in these two regions.
Here, we chose two well-dated peat sequences that represent contrasting hydrological and temperature regimes to test our hypotheses. The objectives of this study were: (1) to examine the spatial variation of changes in precipitation (i.e., hydrological cycle) in southern and northern East Asia on a millennial time scale and (2) to investigate the relationship between hydrological changes and carbon accumulation in wetlands located in a semi-arid loess-desert transitional zone and in humid southern China.
Study Sites
The two wetlands used in this study are Midiwan (MDW, 37°39′N, 108°37′E) located in the loess-desert transitional zone in northern China and Dahu (DH, 24°45′N, 115°2′E) located in the Nanling Mountain area in southern China (Figure 2). These wetlands are located in a semi-arid area and humid area, respectively, where the contrasting changes in precipitation yield different hydrological conditions and, consequently, determine the TOC accumulation. Like scenario A in Figure 1, in the semi-arid region (i.e., MDW), the higher soil moisture would favor the growth of plants and carbon accumulation, whereas in the humid region (i.e., DH), like scenario B in Figure 1, more water would hinder the growth of plants and carbon accumulation when the water content of soil (WL) exceeds the optimum values (Figure 1).
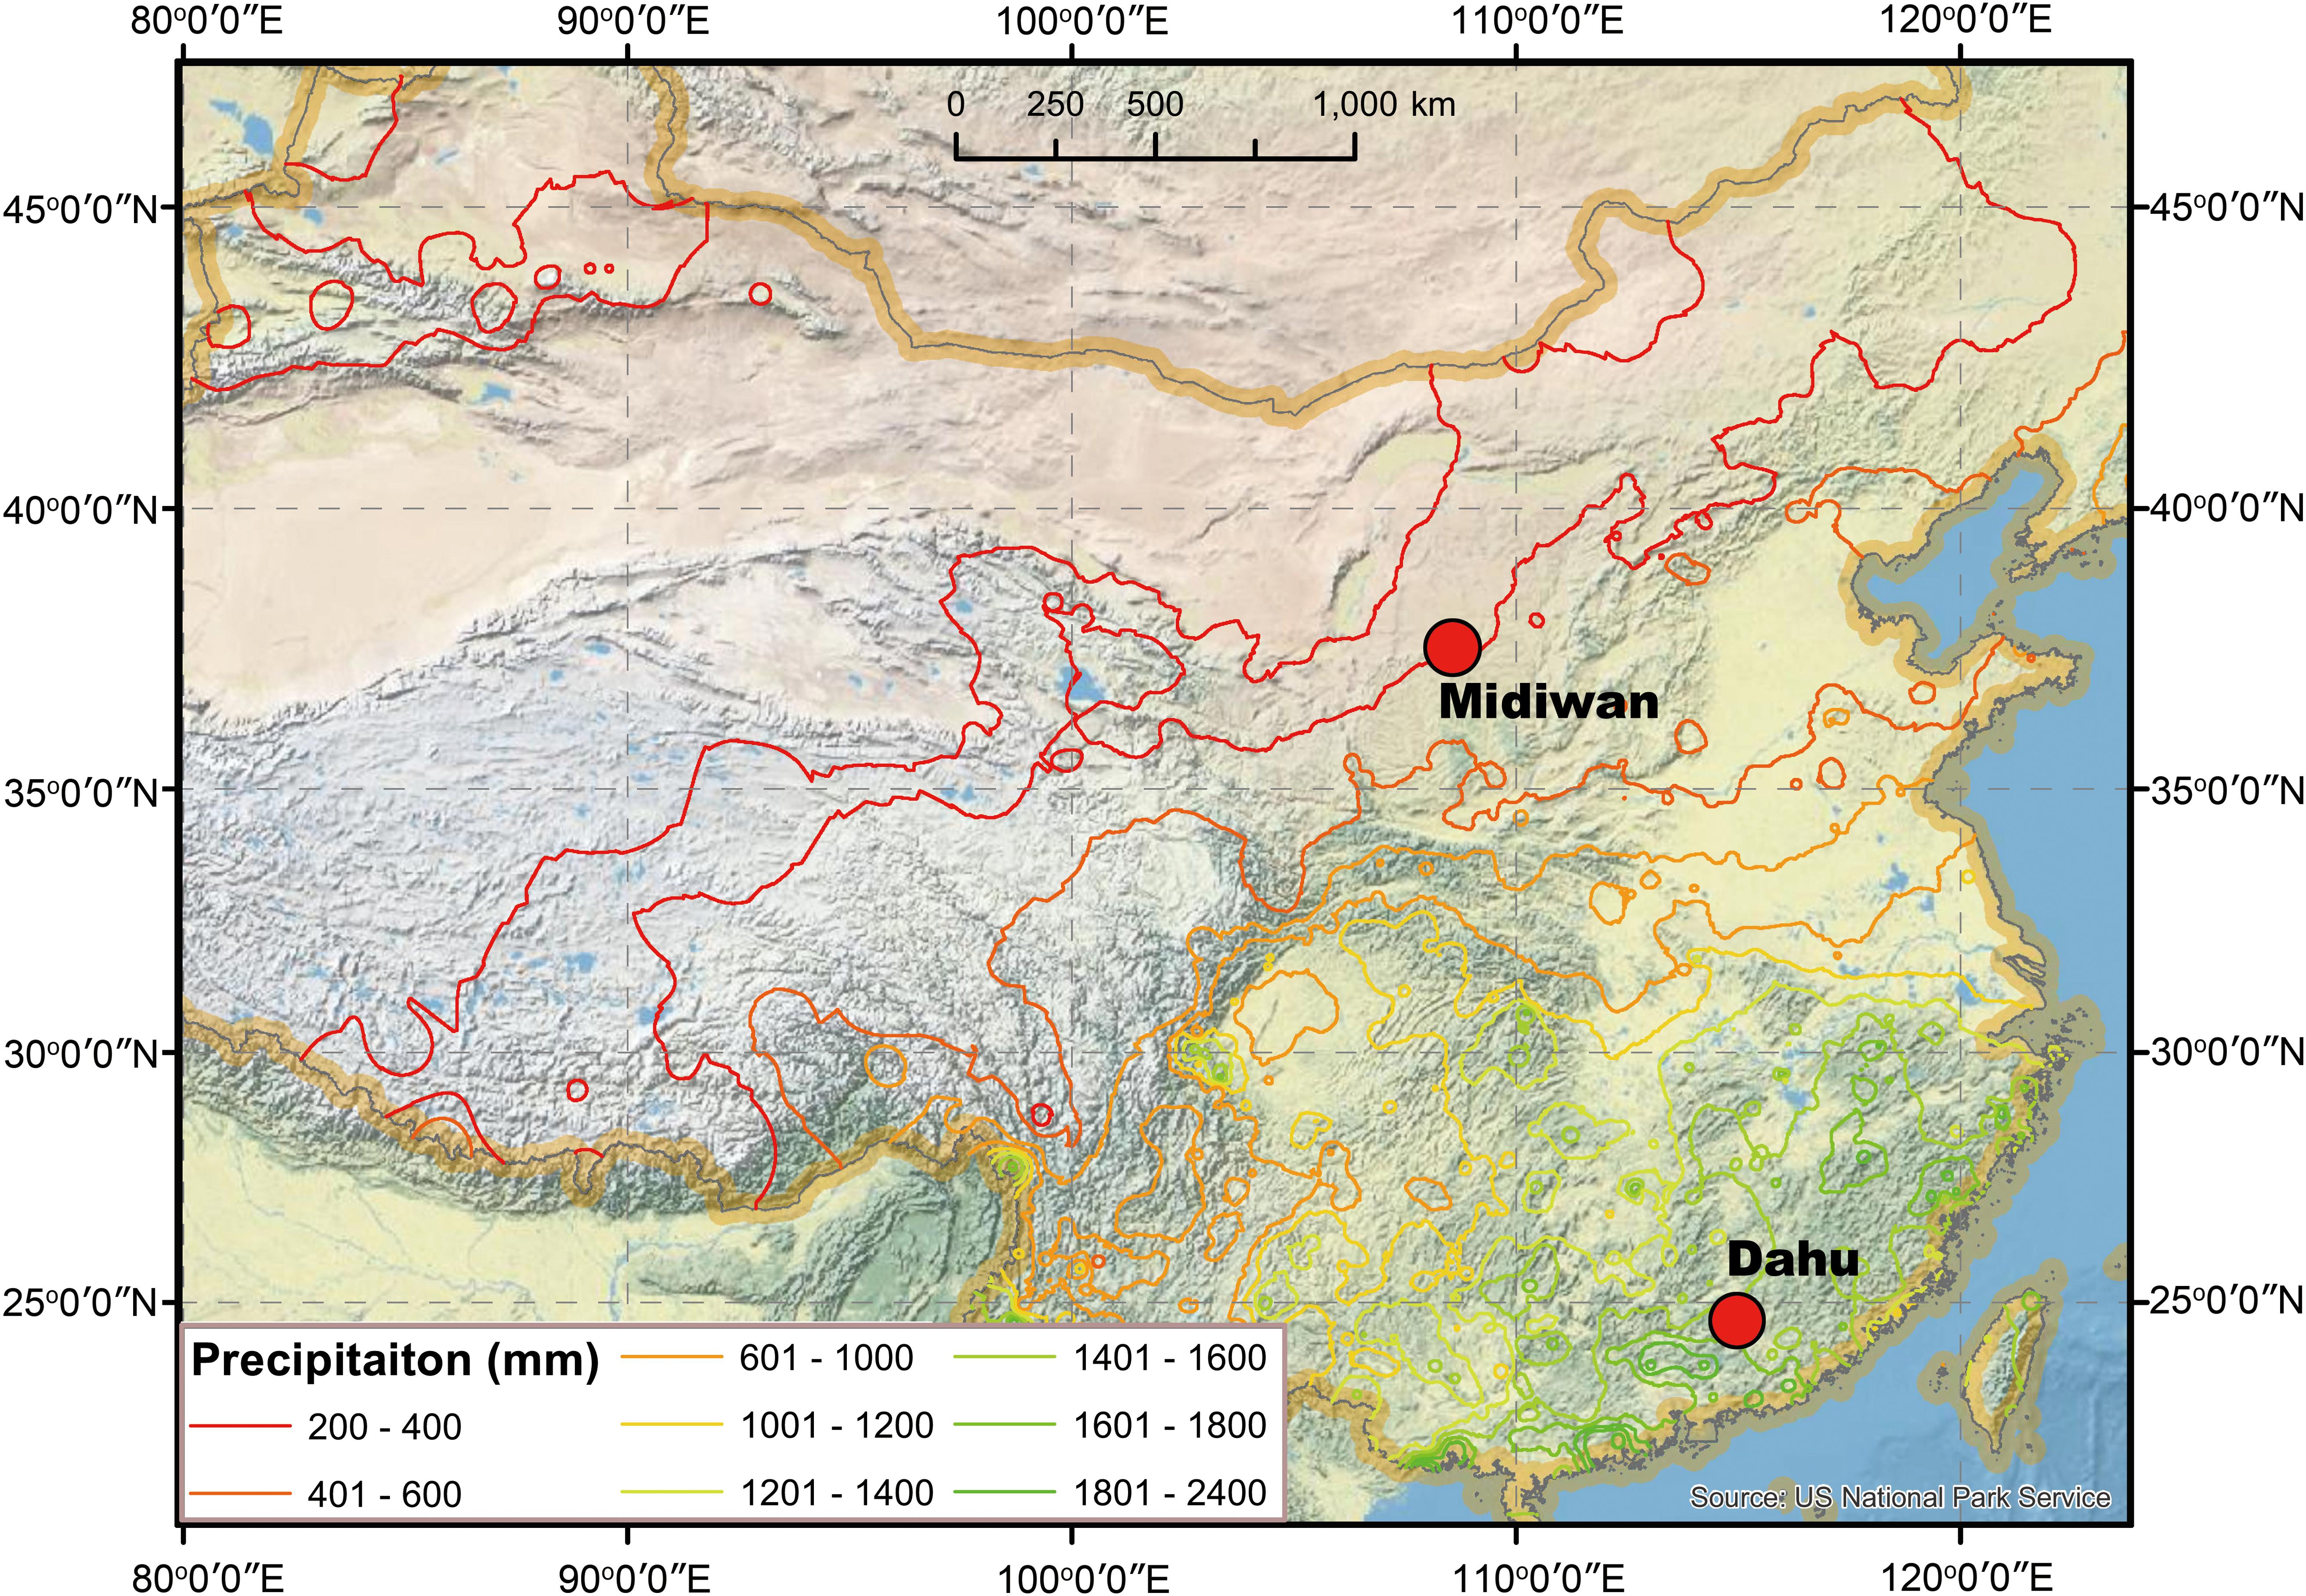
Figure 2. Locations of the two peatlands used in this study. Lines in different colors show the isolines of annual precipitations.
Midiwan (MDW) Wetland
The MDW wetland, with an altitude of 1400 m a.s.l., is located in southwest of Yulin City in northern Shaanxi Province, in the southern margin of the Mu Us Desert region. As showed in Table 1, a quadrat survey of Lake Hongjiannao near the MDW site shows that the modern plants in this site are mainly grasses from 9 families. The climate is characterized by semi-arid continental monsoon activity with an annual precipitation of 395 mm and annual mean temperature of 7.8°C (Figures 3A,B). Water is the most important limiting factor for the growth of plants at this site; the amount and timing of precipitation are critical. During the humid periods, with the retreat of the desert, the palaeosol or peat was deposited. During the drier periods, with the advance of the desert, loess or eolian dust was deposited on the land surface (Porter and Zhou, 2006). Therefore, regarding the depositional sequences in this loess-desert transitional zone, the alternative deposition of wetland and wind-blown dust reflects the history and variability of summer monsoon activities (Porter and Zhou, 2006). Specifically, wetland deposits reflect the stronger monsoon activity that brings more precipitation to this region, while eolian dust deposits reflect the retreat of the monsoon front, which causes drier conditions and desertification in this region. Following the stratigraphic description of Zhou et al. (1996), the MDW peat sequence with a length of 13.8 m was divided into 13 depositional units (Table 2), reflecting millennial-scale changes in hydrological conditions in northern China.
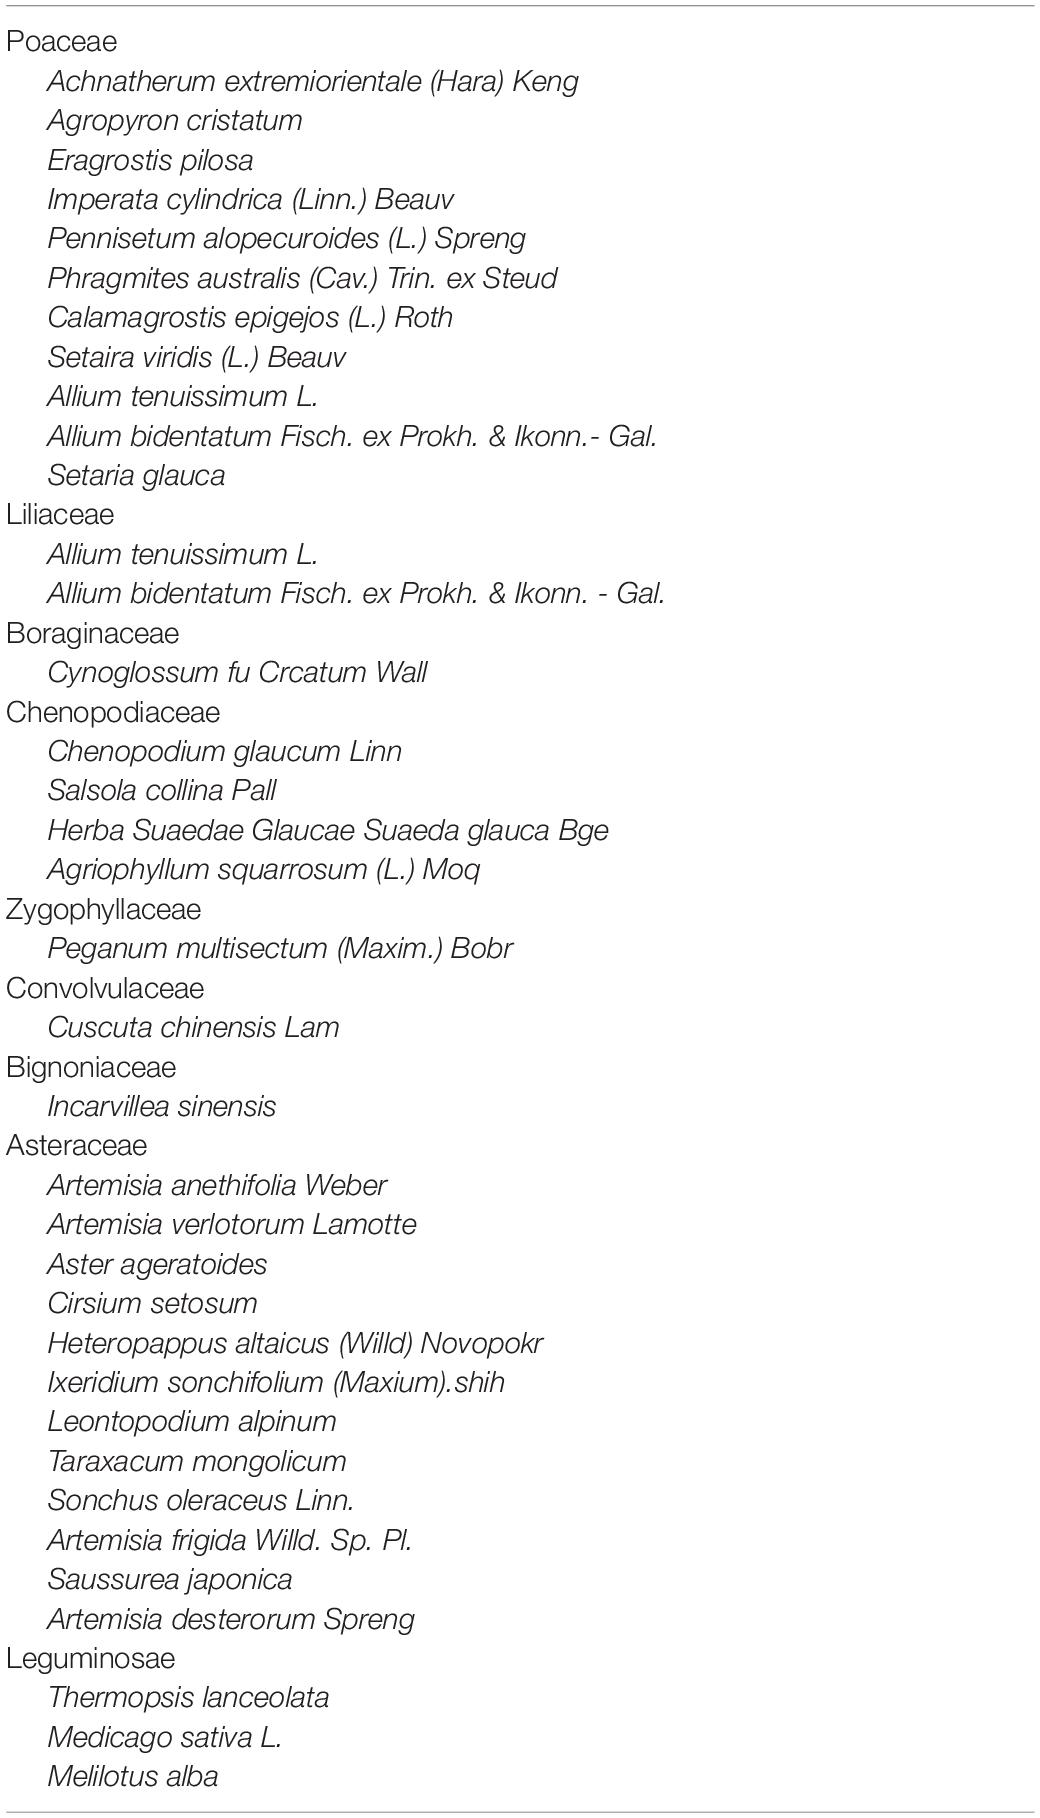
Table 1. Modern plant species around Lake Hongjiannao.
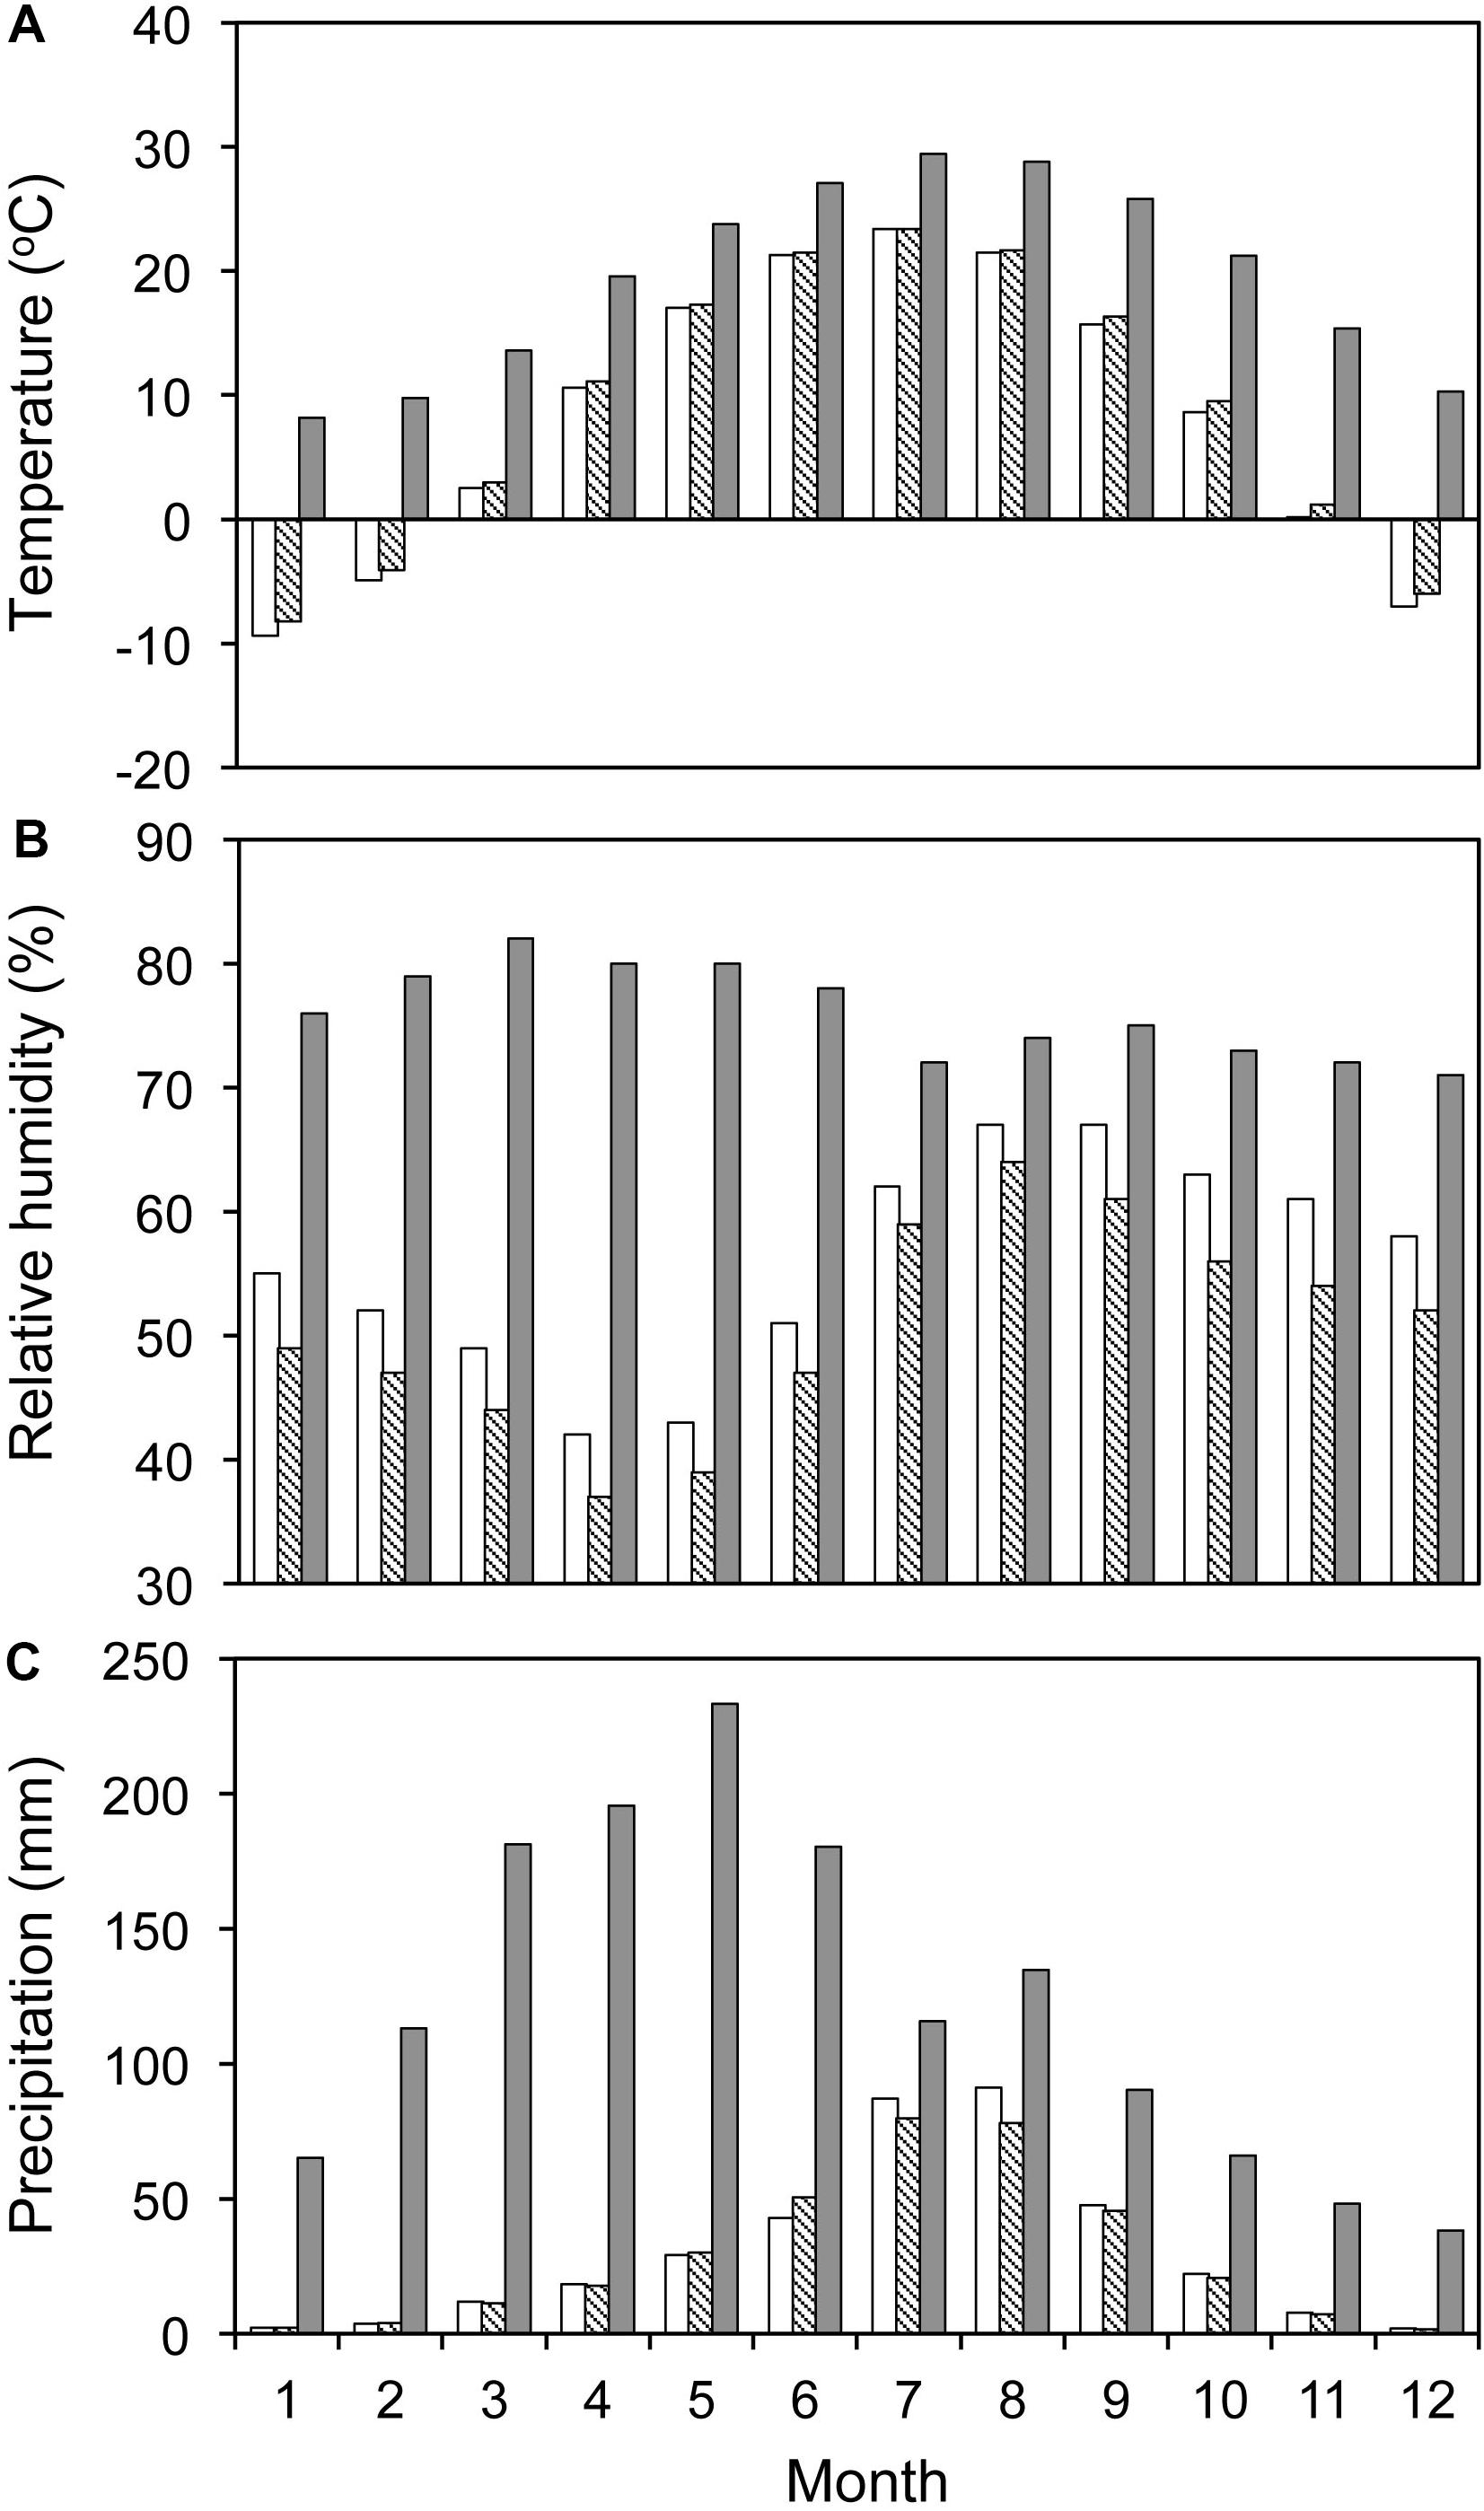
Figure 3. Meteorological data near the study sites. (A) Temperature (°C), (B) relative humidity (%), and (C) annual precipitation (mm). Gray-filled bars show the data from the Ganzhou Meteorological Observatory near the DH site, white-filled bars and black diagonal-filled bars show the data from the Meteorological Observatories of Yulin and Hengshan near the MDW site, respectively.
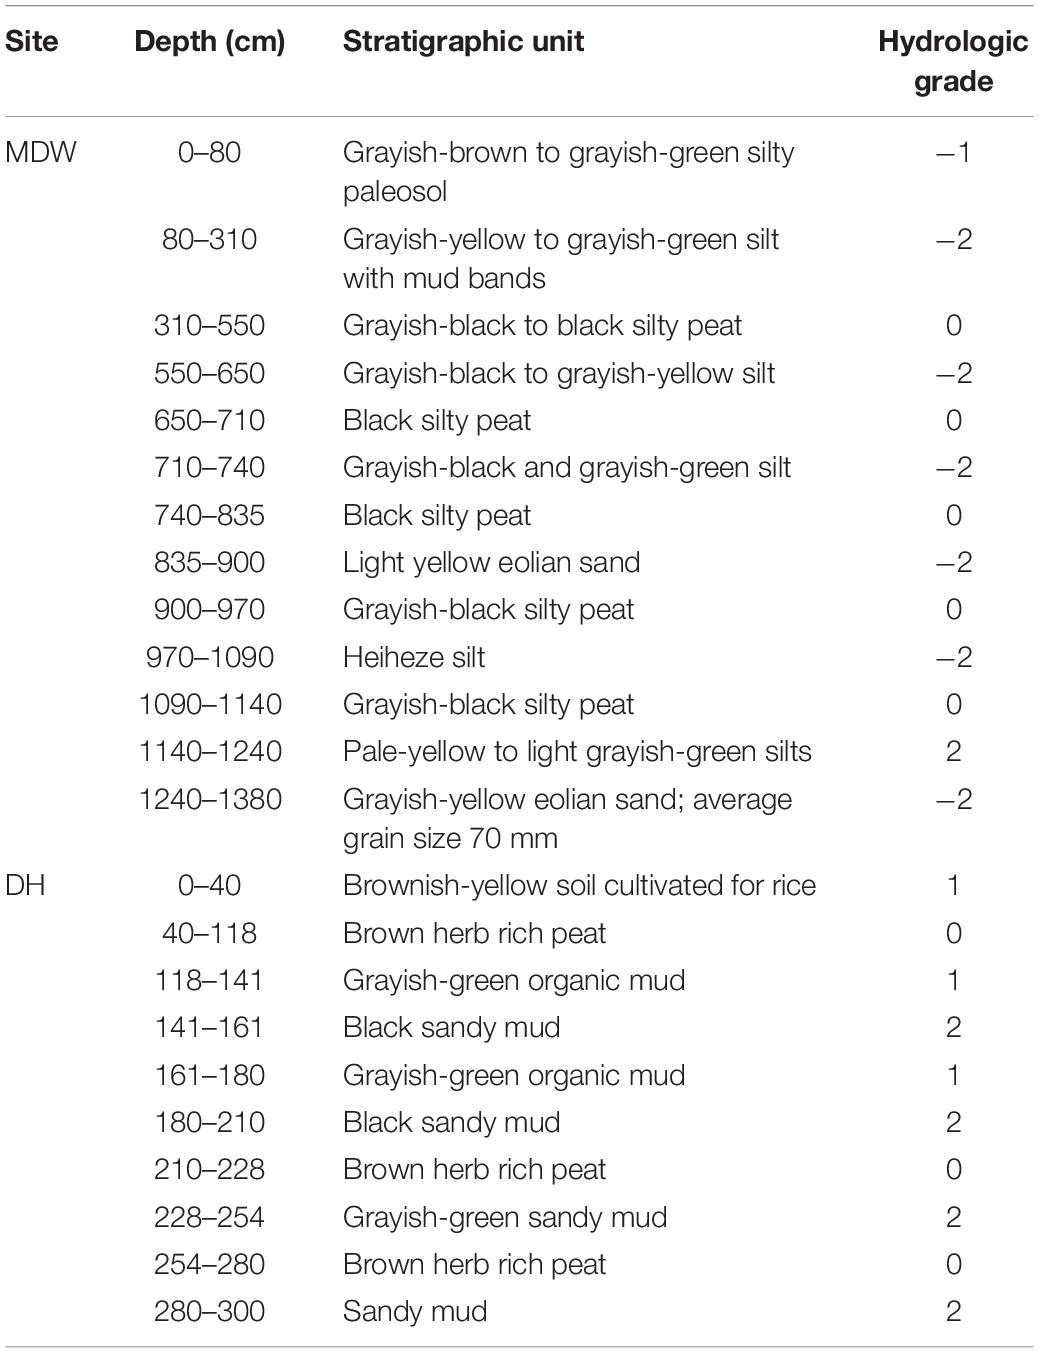
Table 2. Stratigraphic description and hydrologic reconstruction at the Midiwan site (MDW) (see Zhou et al., 1996 for more details) and the Dahu site (DH) (see Zhou et al., 2004 for more details).
Dahu (DH) Wetland
The DH swamp, covering an area of 0.8 km2 and located at about 260 m a.s.l., has developed in a small, closed intermontane basin in the eastern Nanling Mountain region in southern China (Zhou et al., 2004; Zhong et al., 2010, 2011). The hydrological conditions of the swamp depend largely on precipitation because there is no river discharging into the swamp (Xue et al., 2009). In this area, the present-day annual average temperature is 17.8°C and the annual precipitation is ∼1600 mm, mainly occurring from March to September (Figure 3C). The modern vegetation around this site is the shrubbery with ferns and grasses (Table 3) (Zhong et al., 2010). Ferns and grasses are the main plants in the peat accumulations. Zheng et al. (2008) conducted systematic drilling along a track line from the northeast to the southwest. The cross section along the drilling sites was reconstructed based on stratigraphic correlation (Figure 4). In the region, where the WL is usually higher than Wopt2, an increase in WL would inhibit plant growth and carbon accumulation. During humid times, lacustrine mud or sand deposits on the surface because the valley is covered with water. It is only during relatively drier periods, accompanied by the shrinking of the lake, that plants that contribute to the peat accumulations flourish. The stratigraphical sequence at this site is composed of peat inter-bedded with lacustrine sediments (Zhou et al., 2004; Zheng et al., 2008; Xue et al., 2009). The lacustrine sand represents a waterlogged condition caused by excessive precipitation, while the peat layer represents a relatively drier environment caused by moderate precipitation. The thickest deposits occurred at the center of the swamp, covering a time back to 42 cal. ka BP (Zheng et al., 2008). In this study, a 3.5 m long core was taken at the center of the swamp and divided into 10 depositional units (Table 2; Zhou et al., 2004).
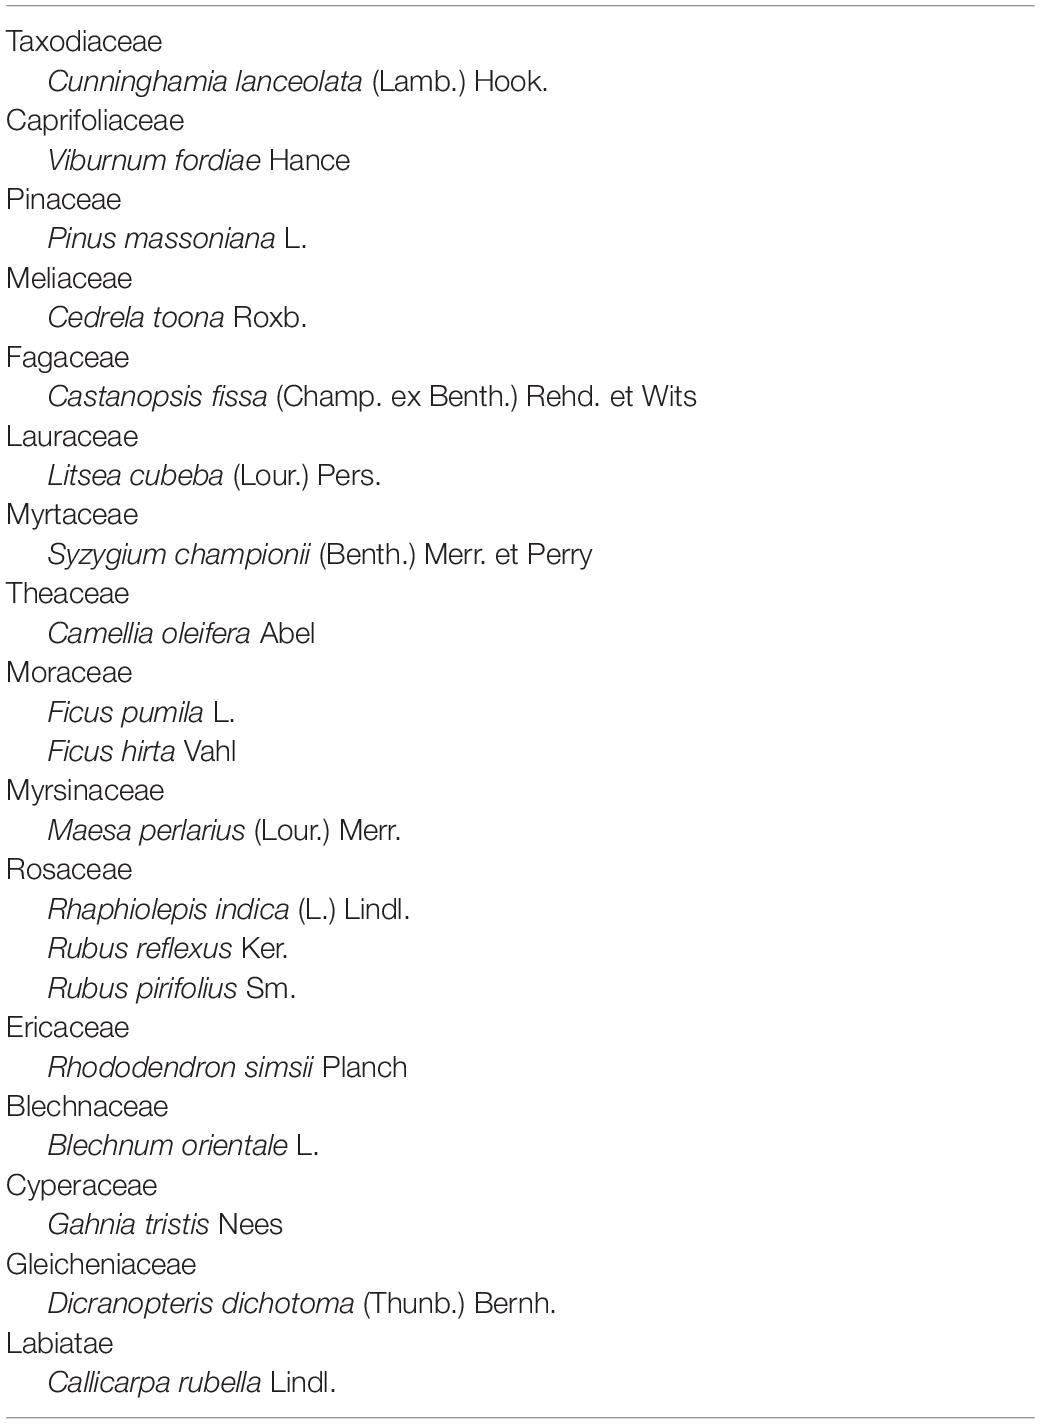
Table 3. Modern plant species around Dahu swamp (Zhong et al., 2010).
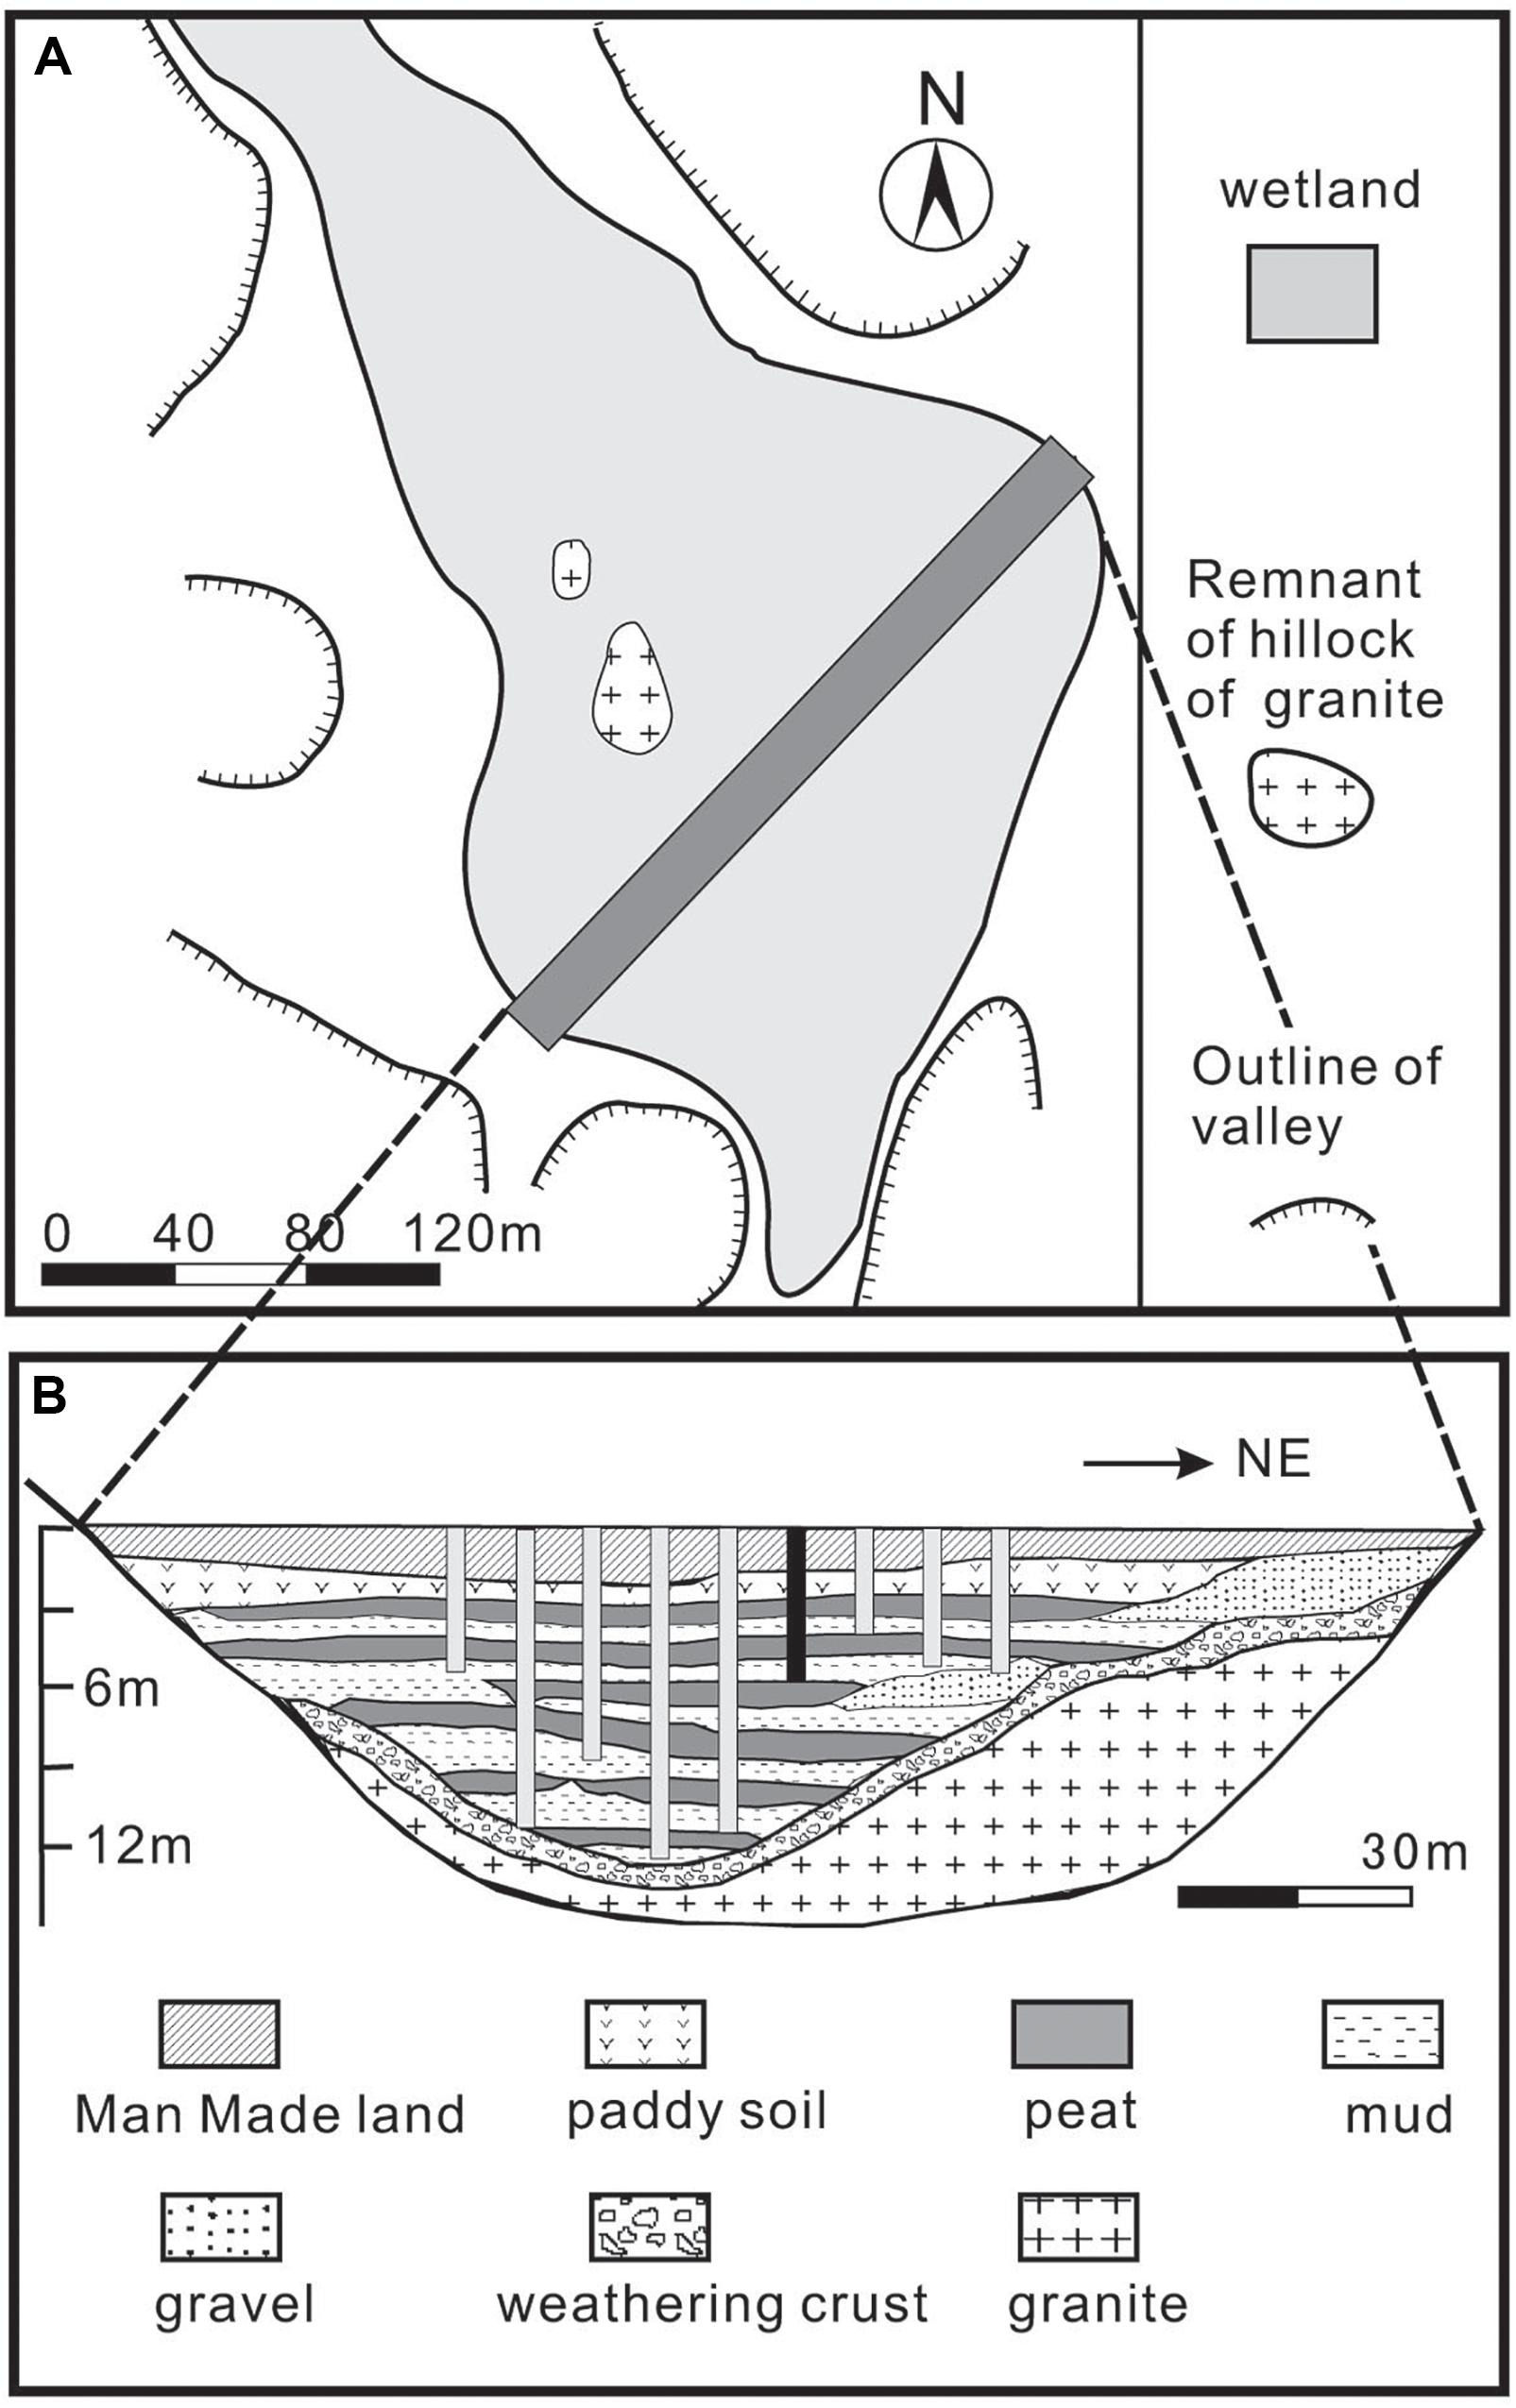
Figure 4. Distribution (A) and cross section (B) of Dahu swamp (redrawn after Zhou et al., 2004; Zheng et al., 2008).
Materials and Methods
Hydrologic Grades of Different Facies
Based on our conceptual model, the production of plants that affects the accumulation of organic carbon in the soil is controlled by the WL. As shown in Figure 1, when the WL is lower than the minimum value (Wmin), plants cannot survive; accordingly, there will be no organic carbon deposits in the stratigraphic section. When the WL increases from Wmin to Wopt1 (the lower optimum threshold WL for plant growth), plant production increases. For a WL between Wopt1 and Wopt2 (the highest optimum threshold WL for plant growth), the production will be consistent. With a WL > Wopt2, the production will decrease due to the inhibition of the waterlogged condition to the growth of plants.
For the MDW site, we assigned the value of 0 to peat layers to represent the hydrologic grade, 2 to lacustrine deposits, and -1 to -3 to eolian deposits to mark the dry conditions (Figure 5). Based on the description of the MDW profile (Zhou et al., 1996), by using the aforementioned protocol and also consulting the results of pollen analyses and stable carbon isotope measurements, the hydrological condition of the MDW area since 16 cal. ka BP was reconstructed (Table 2).
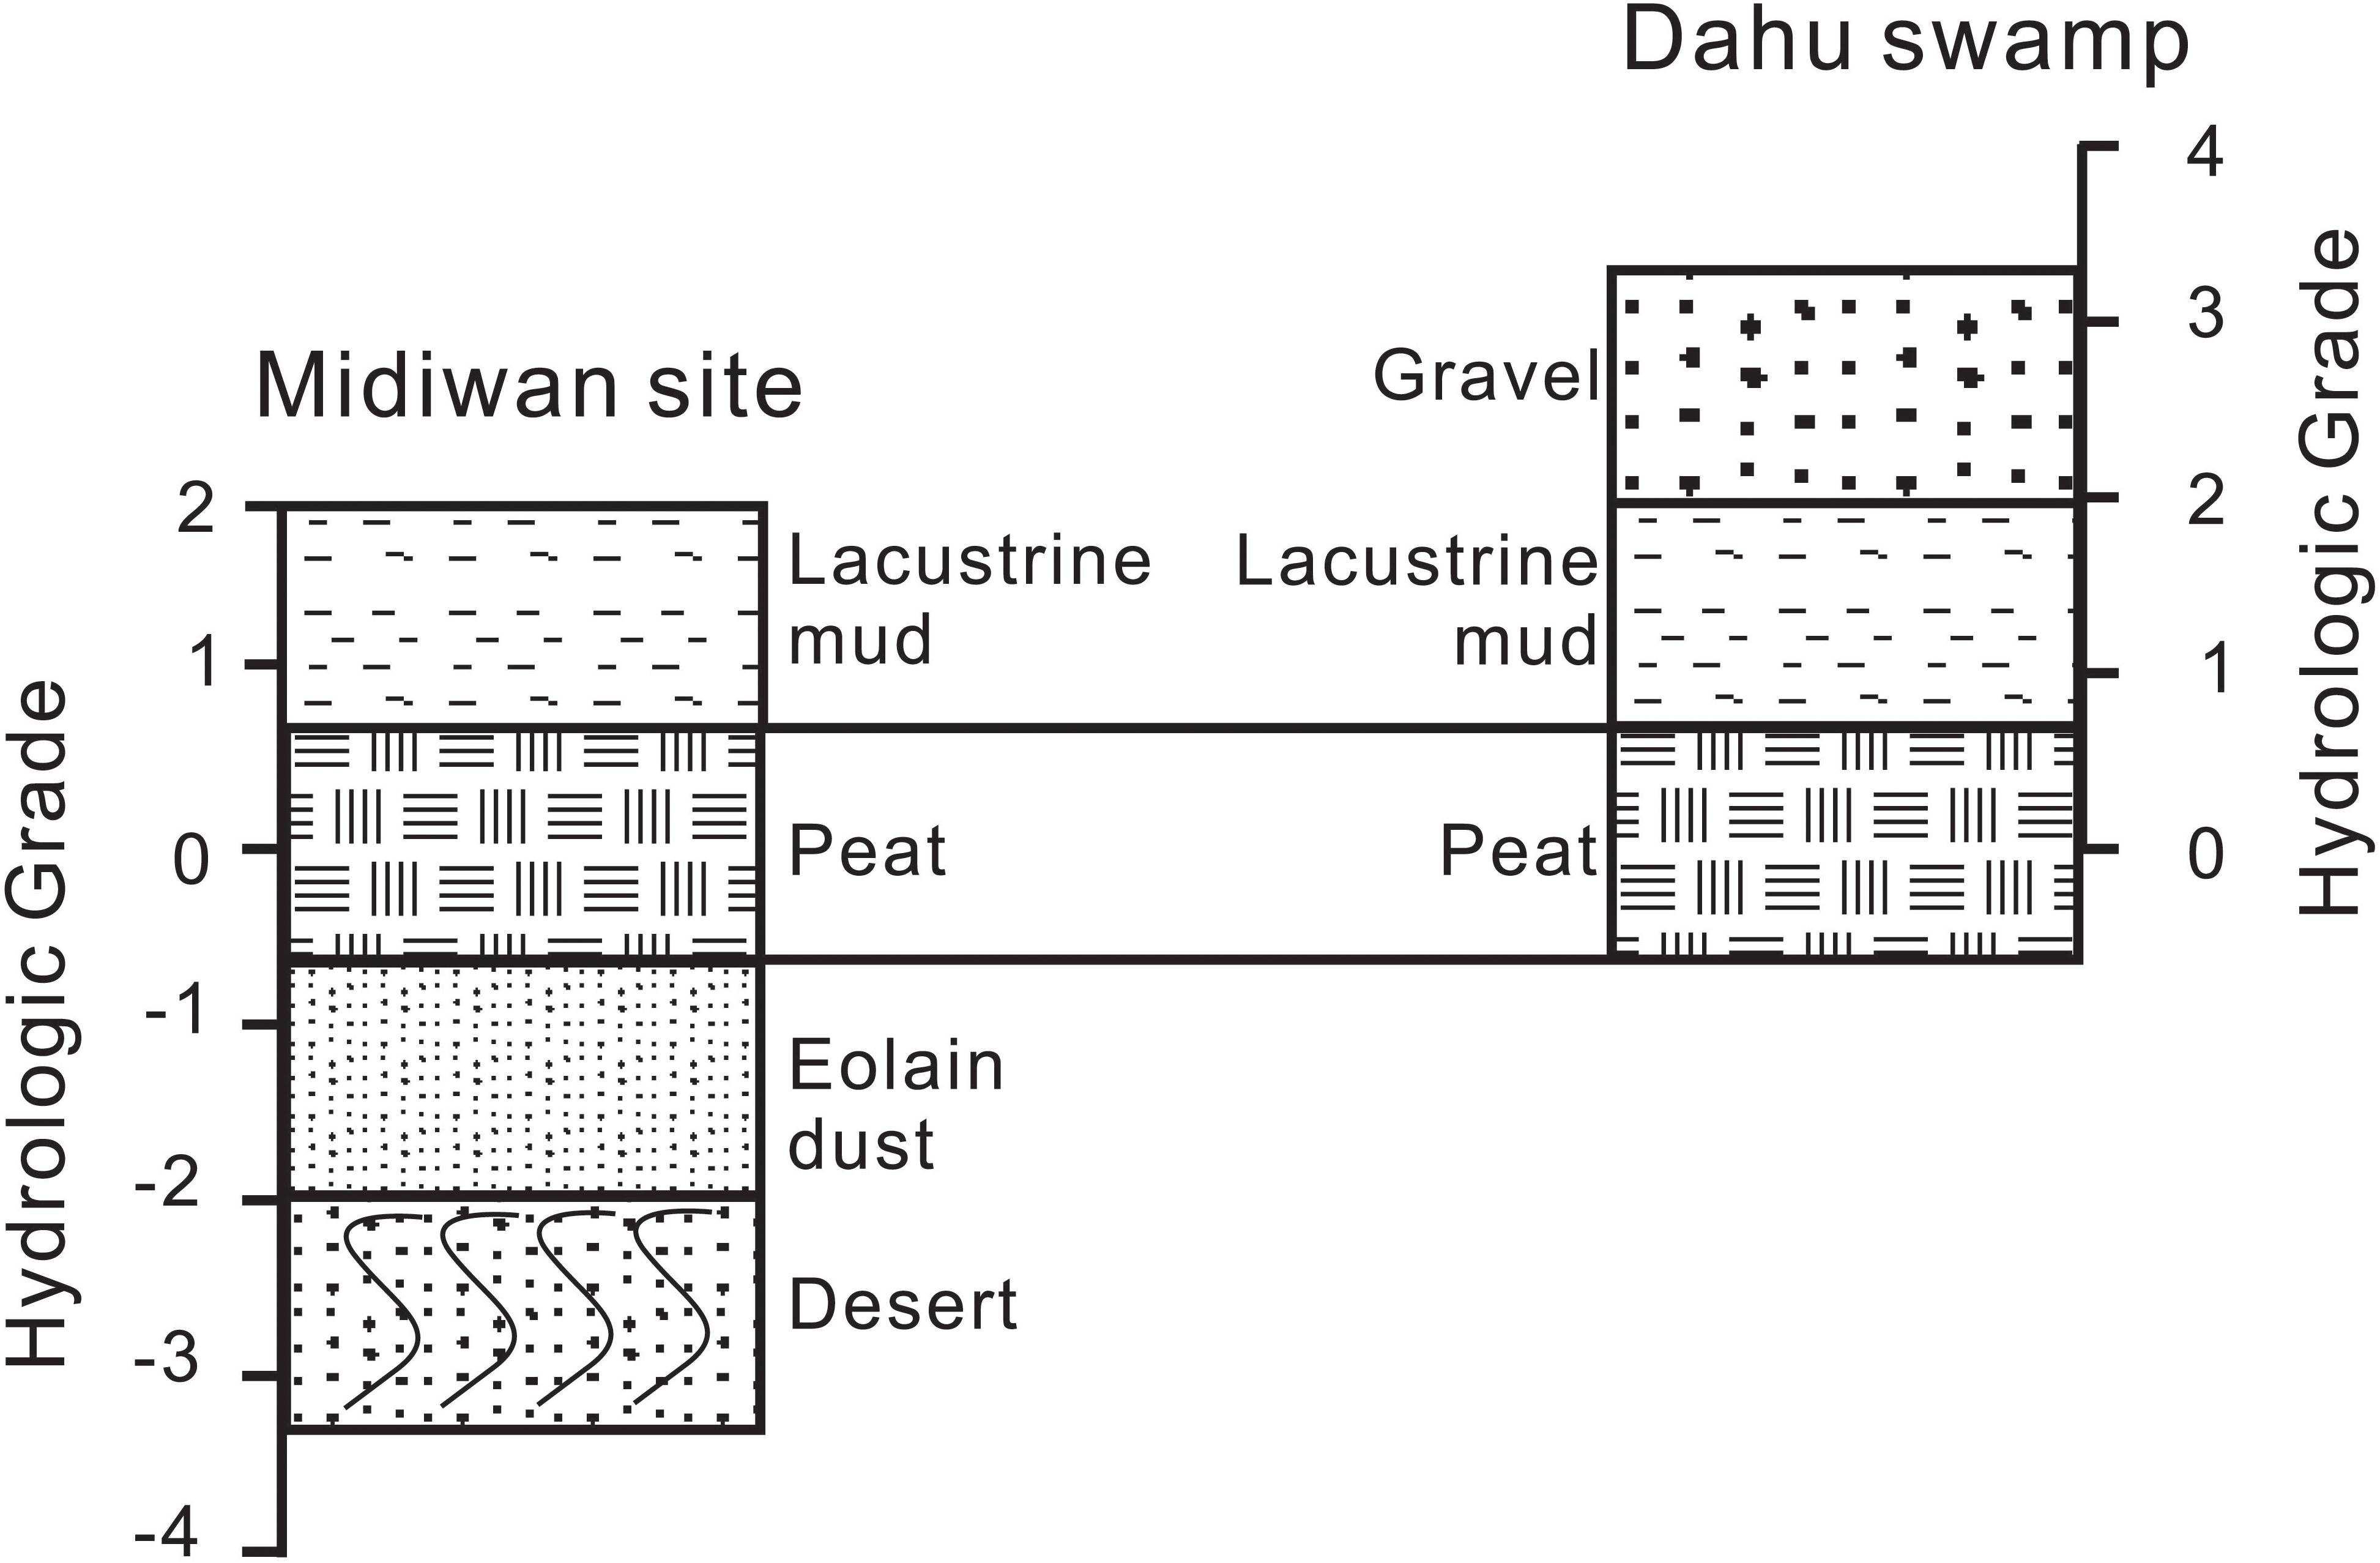
Figure 5. Relationship between the hydrologic grade and the depositional facies in Midiwan and Dahu. Axes beside the facies show the hydrologic grades of the corresponding facies. The order of each facies in this map does not represent the sequences in these sections.
Similarly, for the DH site, we assigned the value of 0 to peat layers and 1–3 to lacustrine deposits (Figure 5). Based on the description of each stratigraphic unit (Zhou et al., 2004), the hydrological grade in the DH core since 18 cal. ka BP was reconstructed (Table 2).
Chronological Framework
The chronological frameworks for these two peat sites were established by radiocarbon dating (Zhou et al., 1996, 2004). A total of 23 and 17 samples from the MDW and DH profiles, respectively, including fossil wood, charcoal, and peat, were collected for dating. Radiocarbon dating results were calibrated using the CALIB software (Stuiver et al., 1998) to obtain calendar ages. The chronological framework for each profile was established by the linear regression between the calibrated age and depths. The details of the dating materials, methods, and chronological framework can be found in Zhou et al. (1996) for the MDW site and in Zhou et al. (2004) for the DH site.
Total Organic Carbon (TOC)
The TOC was determined for the two studied sections (Zhou et al., 1996, 2004). At both the MDW and DH sites, the stratigraphic sequence is composed of inter-bedded peat and sand layers, indicating a great difference in carbon accumulation at different times. Organic carbon was only deposited during the periods when peat layers were formed. For those sites with drastic facies changes, carbon accumulations are mainly determined by the organic carbon input into the layers. Compared to organic carbon input, other factors, such as microbial activities and depositional factors, are negligible. Therefore, combining the reconstructed hydrological conditions, we used the TOC data to explore the relationships between hydrology and carbon accumulation at these two sites with contrasting climate condition.
Results
Hydrological Variations in MDW and DH
There were five periods with wetter conditions and six periods with drier conditions at MDW since the last 16 cal. ka BP (Figure 6A). The highest WL at this site was found from 14.5 to 13.5 cal. ka BP, as indicated by the layer of light grayish-green lacustrine silt and silty peat. During the Younger Dryas event, the deposition at the MDW site varied from silt to silty peat, then to eolian sand (1090–815 cm), indicating an unstable, variable hydrological condition between dry and humid (Zhou et al., 1996). The hydrological condition at the MDW site was generally humid during the early Holocene (11.5–8.5 cal. ka BP), except for an aberrant dry event occurring at ∼10 cal. ka BP. A prolonged dry period occurred from 8.5 to 6.5 cal. ka BP, as indicated by a set of grayish-yellow eolian deposits. The WL resumed to high level in the period from 6.5 to 3.5 cal. ka BP, as indicated by a set of silty peat deposits (550–310 cm). We note that the deposits during this humid period contained more minerals than those in the early Holocene, suggesting that this humid period occurred along with a drying trend. A set of silt-with-mud bands developed, and this is mantled by a modern active dune on the top, suggesting a strengthened drying trend after 3.5 cal. ka BP.
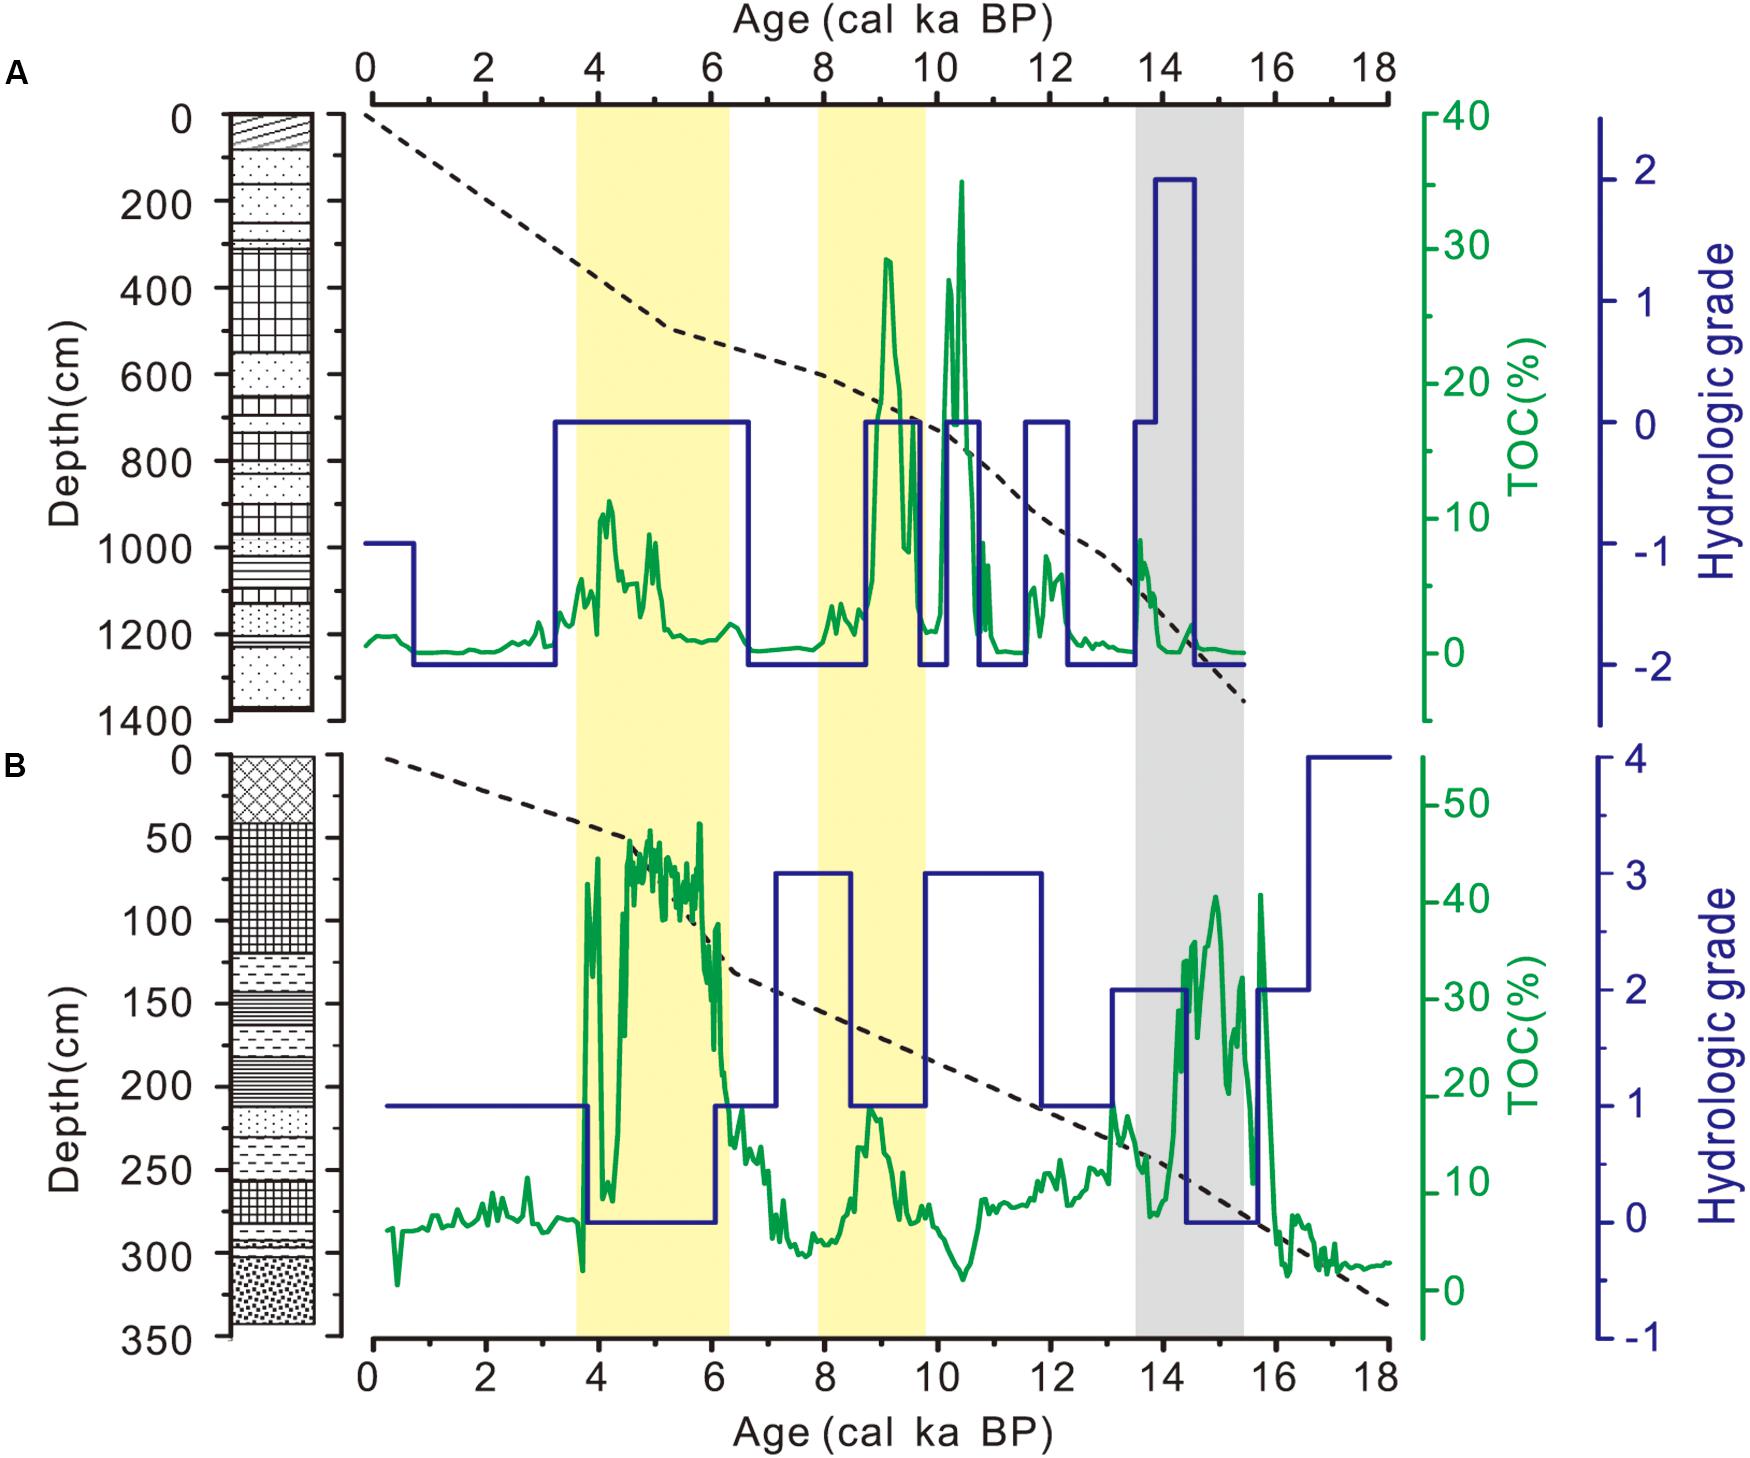
Figure 6. Variations in hydrological conditions and carbon accumulation in two peatlands since the Last Deglaciation (A for MDW and B for DH). Blue lines are the reconstructed hydrological conditions of two sites, green lines are for the carbon accumulation, dashed lines are for the depth-age relationships of two sections, light yellow bars are the in-phase pattern for carbon accumulation and the anti-phase pattern for hydrology in the two sites, and the light gray bar indicates the in-phase pattern for hydrology in the two sites in the interval from 15 to 13.5 cal. ka BP.
The general trend of the hydrological variation in the DH area since 18 cal. ka BP represents a cyclic pattern: the WL decreasing in the period from 18 to 15 cal. ka BP, increasing from 15 to 11 cal. ka BP, and then decreasing from 11 to 3.5 cal. ka BP (Figure 6B). The WL changed from a peak at 18 cal. ka BP to a low at ∼15 cal. ka BP. There was a dry period from 15.5 to 14.5 cal. ka BP, as inferred by a brown herbaceous-rich peat layer from 280 to 254 cm in the section. This dry period was followed by a humid period from 14.5 cal. ka BP to the beginning of the Holocene, with a hiatus corresponding to the Younger Dryas event. The hydrological condition in this area during the early Holocene was relatively high. A dry event occurred at ∼9 cal. ka BP and lasted for ∼1000 years (9.5–8.5 cal. ka BP). The WL began to decrease after 7 cal. ka BP and reached its lowest level again in the period from 6 to 3.5 cal. ka BP. The WL showed a slight increase after 3.5 cal. ka BP.
Hydrology and Carbon Accumulation
The variations in carbon accumulation, indicated by TOC proxy and hydrological conditions in the MDW area during the last 16 cal. ka BP, are generally synchronous (Figure 6A): a higher WL was accompanied by a higher carbon accumulation, except during a wetter period with lower carbon accumulation from 14.5 to 14 cal. ka BP, as recorded by a layer of lacustrine silt. The hydrology and carbon accumulation in the DH area during the last 18 cal. ka BP, in contrast, represents an asynchronous pattern (Figure 6B): a higher WL was concurrent with a lower carbon accumulation.
The carbon accumulations at these two wetlands on the millennial time scale show a general in-phase relationship (Figure 6). For example, during 10–8 cal. ka BP and 6–4 cal. ka BP, there were high carbon accumulations at both sites. However, during 8–6 cal. ka BP, both sites had low carbon accumulation. The highest rate of carbon accumulation at these two sites occurred at different times, although their trends on the millennial time scale are generally synchronous. The highest rate occurred during the early Holocene in northern China, but during the middle Holocene in southern China.
Discussion
Comparison of Hydrological Reconstruction With Other Proxies
To validate our conceptual model, we compared the facies-based reconstruction of the hydrological condition with other proxy-based reconstructions. The results show that our reconstructions of hydrology at these two peatlands through facies analysis are comparable with other proxy-based reconstructions, implying that the facies analysis is a sound approach for hydrological reconstruction for these sections with drastic facies variation. Our result at the MDW site is generally consistent with the results of pollen and stable carbon isotope analyses performed in the same section (Zhou et al., 1996). The dry episodes are usually correlated to those with low levels of pollen concentrations and the positive bias of stable carbon isotope. The proxy-based reconstruction of lake level from Lake Daihai (Sun et al., 2009) northeast of the MDW site also showed a similar trend in hydrological fluctuation to that in the MDW area. The rhythm from the dry (9–7 cal. ka BP) to the humid period (7–3.5 cal. ka BP) in the MDW area can be correlated to the lake-level change in Lake Daihai, implying that the MDW site might have the potential to record hydrology at a regional scale. The archaeo-biological evidence showed that rice agriculture in northwest China first emerged > 5000 years ago and lasted for > 1000 years (Li et al., 2007). This evidence, showing a relatively humid period from 5 to 4 cal. ka BP in northern China, further explains the expansion of wetlands in the mid-Holocene. For the DH site, other proxies such as pollen concentration (Zhou et al., 2004), humification (Zhong et al., 2011), and biomarker records (Zhou et al., 2005; Zheng et al., 2009) agreed well with our findings.
Hydrology and Carbon Accumulation During the Holocene
The reconstructed hydrological conditions with carbon accumulation at these two sites show that carbon accumulations are generally controlled by regional hydrological conditions. The result rejects the first case in the aforementioned hypothesis, that carbon accumulation is anti-phased. However, it supports the second case in our hypothesis. We noticed that, in several periods, such as 9.5–8.5 cal. ka BP and 6–4 cal. ka BP, the carbon accumulation increased in both northern and southern East Asia (Figure 7), which matches well with the change of global peatlands coverage (Yu et al., 2010).
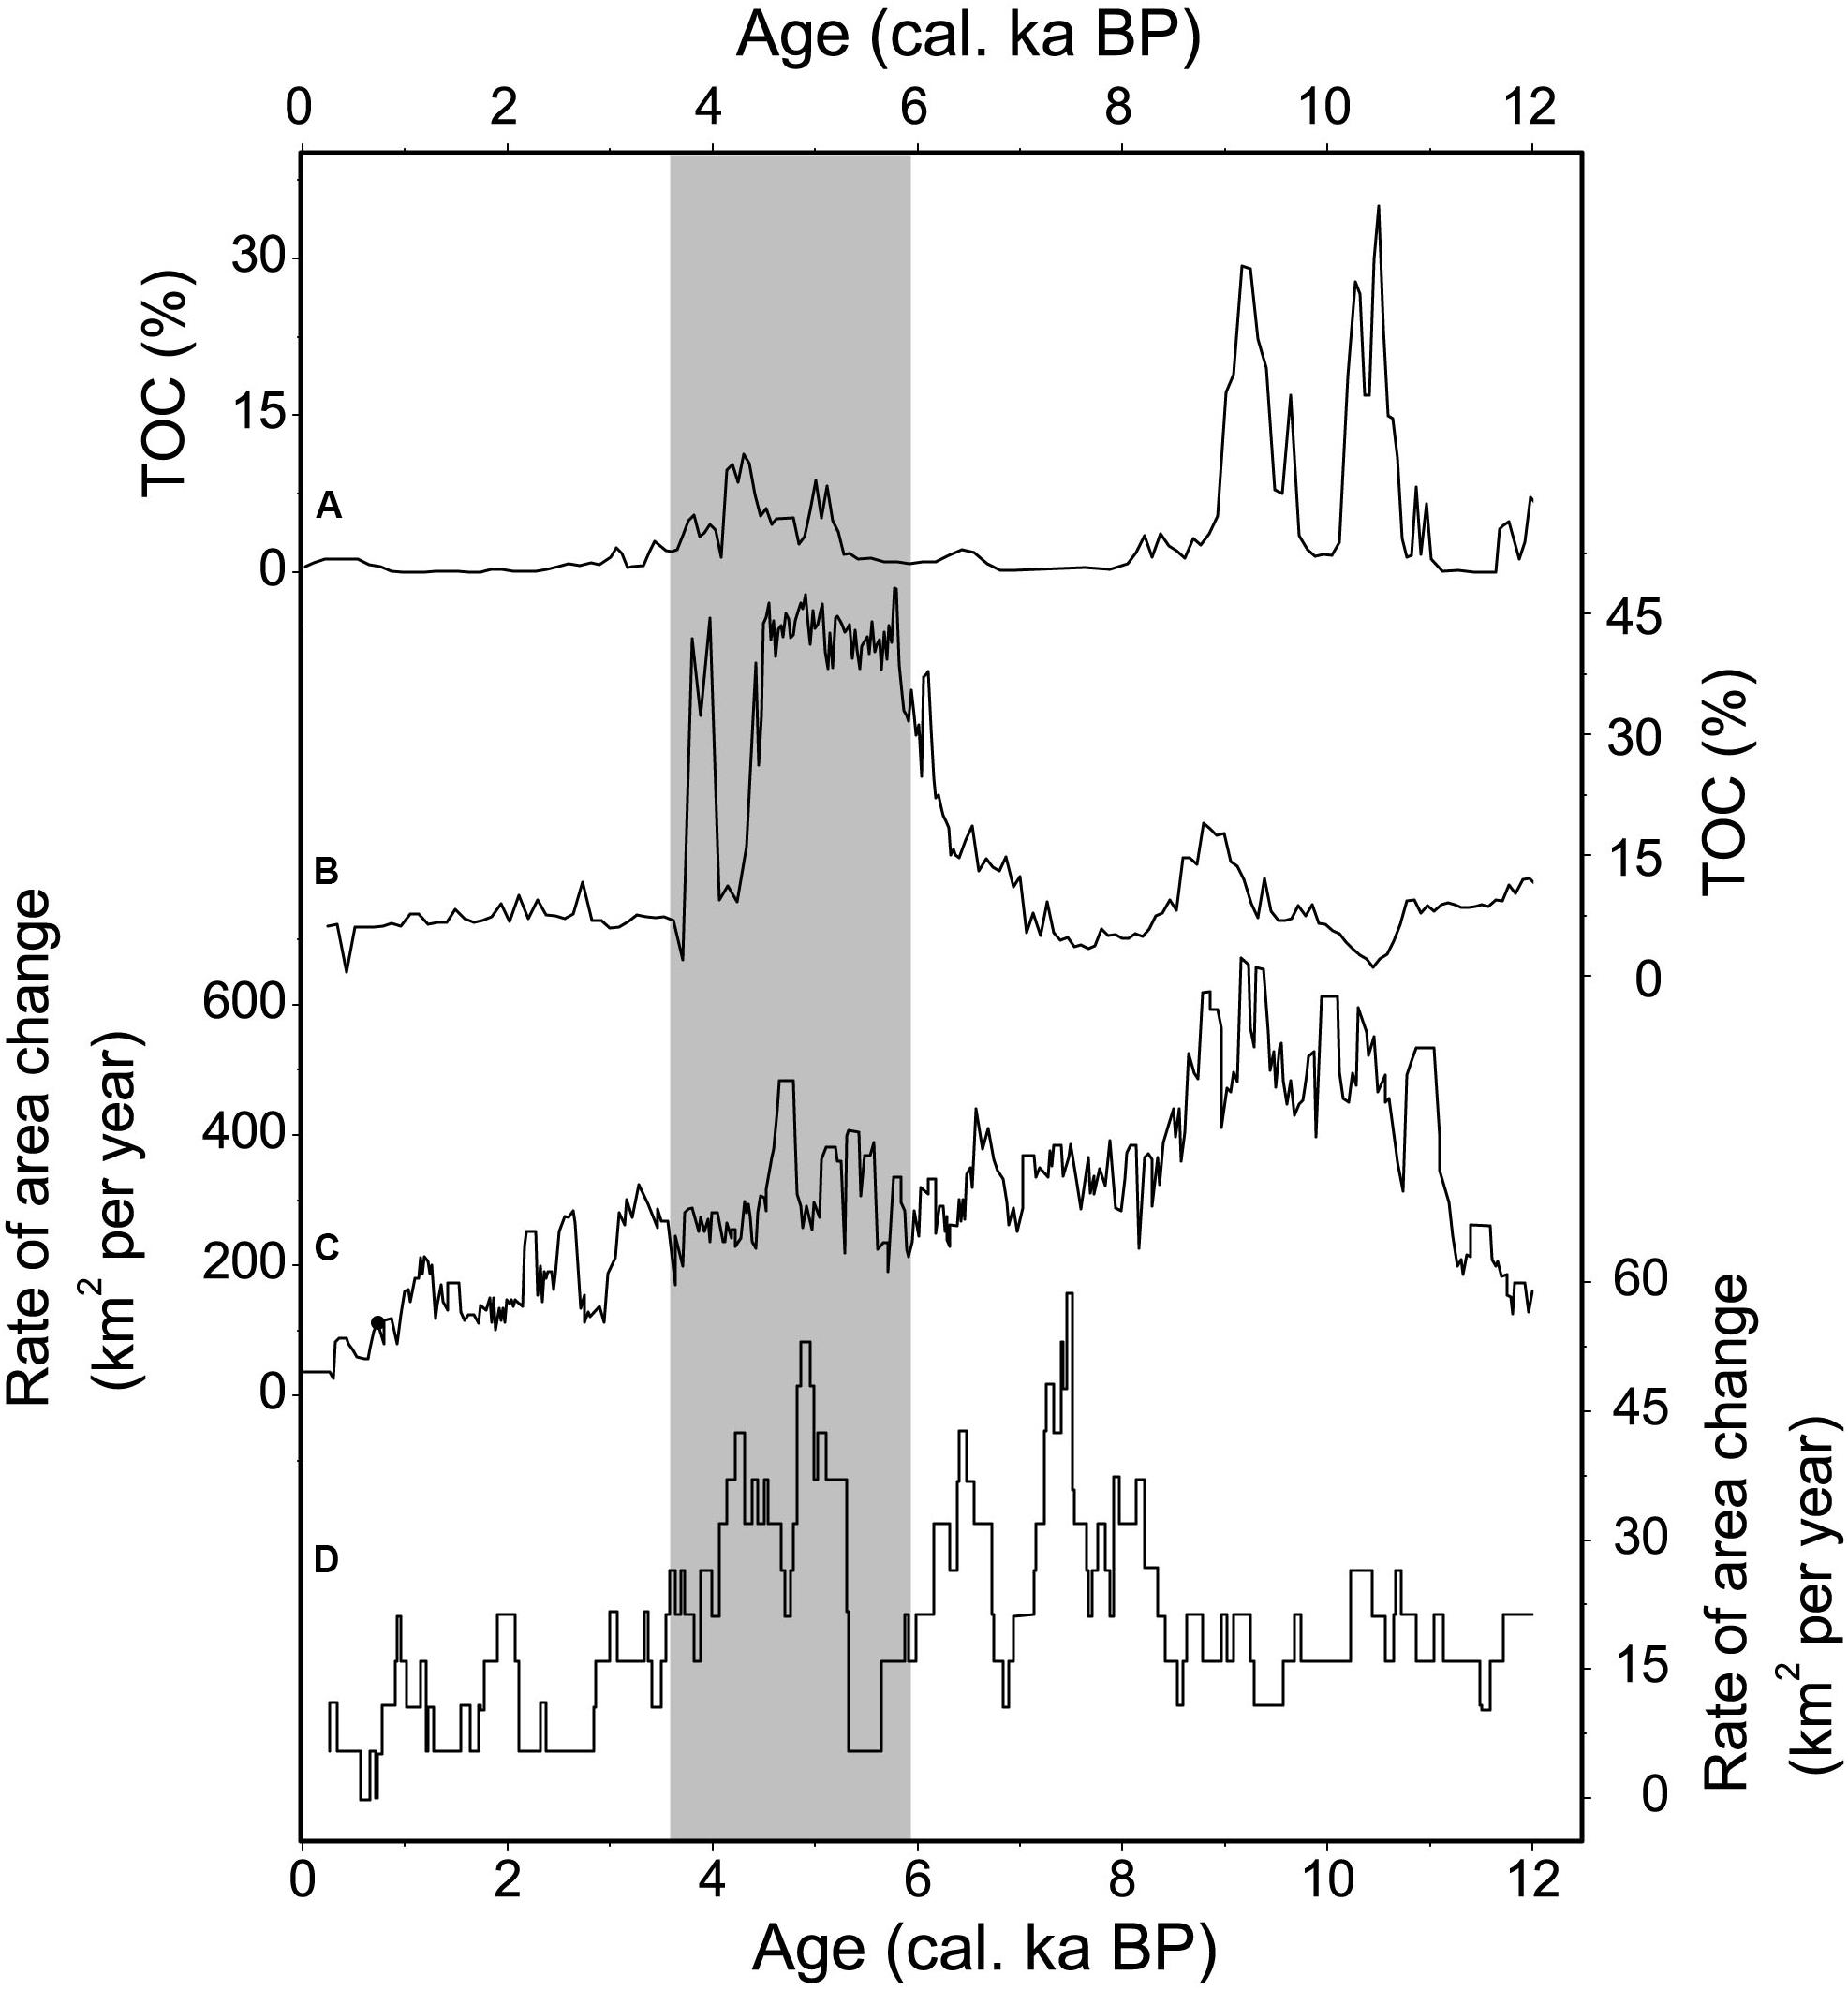
Figure 7. Carbon accumulations in MDW and DH with the area of change in global peatlands during the Holocene. Panel (A,B) are the carbon accumulations in MDW and DH, respectively. Panel (C,D) are the rates of area change, respectively, for the northern peatlands and the tropical peatlands (Yu et al., 2010).
The period from 6 to 4 cal. ka BP was a unique period, during which precipitation in northern and southern East Asia showed an anti-phased spatial pattern. The environment in northern East Asia in this period was relatively humid, as indicated by our results in MDW and the proxy-based reconstruction from Lake Daihai (Sun et al., 2009), while in southern East Asia, the environment during the same period was relatively dry, as indicated by the hydrological reconstruction and other reports (Zhou et al., 2004, 2005; Xiao et al., 2007; Zheng et al., 2009; Zhong et al., 2010, 2011). This type of spatial pattern in precipitation in East Asia favored the development of wetlands during the mid-Holocene. The total area of global peatlands expanded in this period (Yu et al., 2010), which matches well with the peatland expansion in both the MDW and DH areas (Figure 7).
The results from this study filled a major knowledge gap regarding the seesaw pattern of hydrological changes in the northern and southern East Asia monsoonal (EAM) regions on the millennial time scale. As showed in Figure 8, the gridded linear trends in precipitation in China can be divided into three regions. The MDW and DH sites are located in regions with contrasting trends of precipitation. Intergrading the seesaw pattern of the East Asia monsoon on an orbital timescale (Shi et al., 2012), millennial time scale, and inter-decadal scale, we propose that the monsoon dynamics on different timescales might be similar. Thus, modern instrumental records can provide an analog for understanding the environmental processes in the past.
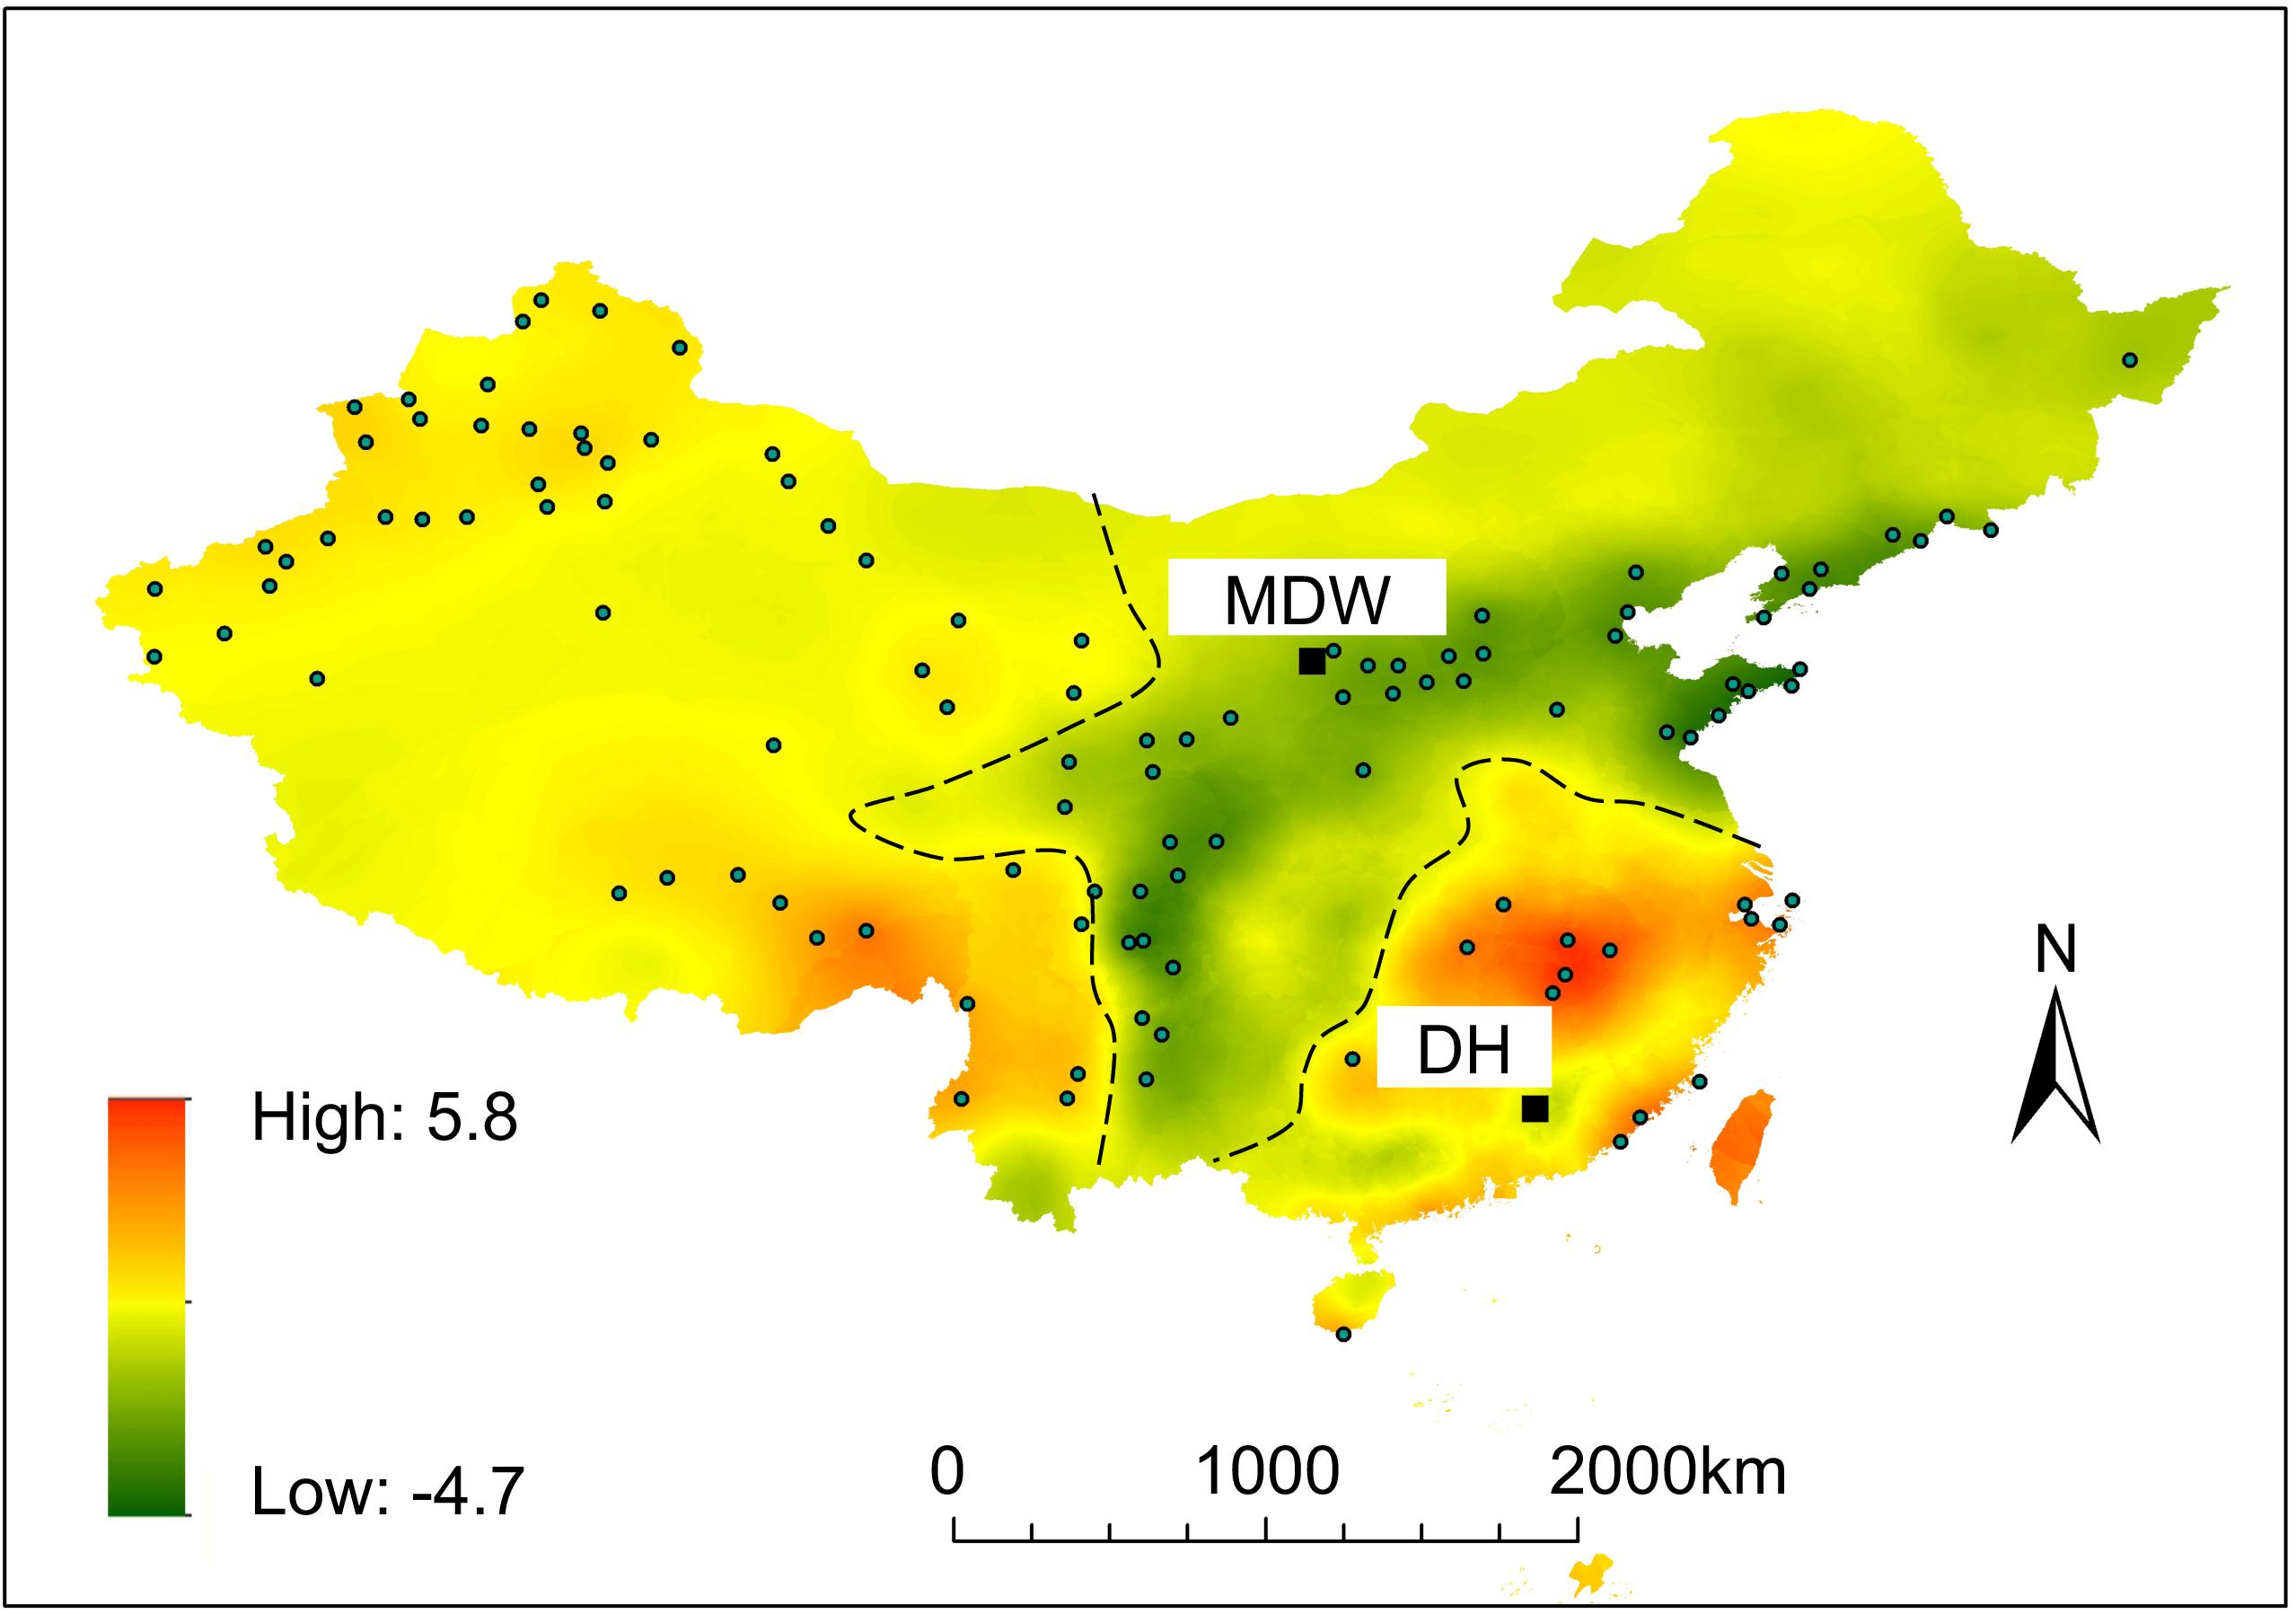
Figure 8. Gridded trends of annual precipitation in China. Annual precipitation data of 591 meteorological observatories from 1960 to 2005 were obtained from the China Meteorological Data Service Center (CMDC). A linear trend of precipitation was calculated at each site, and only the 110 sites with a significant level of p < 0.05 were reserved. The Kriging interpolation method was applied to obtain the gridded precipitation trends.
Spatial Pattern of Hydrology and Carbon Accumulation During the Mystery Interval (MI)
It is worthwhile to note that the variations in precipitation in northern and southern East Asia are synchronous during 16–14 cal. ka BP (Figure 6), which is different from the anti-phase pattern during the Holocene. This episode is known as the Mystery Interval (MI), a period with a series of enigmatic climate features from 17.5 to 14.5 cal. ka BP: temperatures in Greenland were lower than that during the Last Glacial Maximum as inferred by low δ18O values, but the mountain glaciers in eastern Greenland, northern Europe, and North America retreated during this period (Williams et al., 2012; Zhang et al., 2014). Our results in the DH area show that the hydrological conditions during the MI varied from a high during 18 cal. ka BP to a low in 15 cal. ka BP, then returned to a higher level in 14 cal. ka BP, which is consistent with the two-phase pattern of northern hemisphere records (Broecker and Putnam, 2012). For the MDW site, the WL reached its peak at 14.5 cal. ka BP. The spatial pattern of hydrology, as inferred from these two sites during the MI, is itself a mystery. It shows an in-phase pattern, while during the Holocene there experienced an anti-phase pattern. The cause of this variation in spatial pattern during the MI remains unclear.
Data Availability Statement
The raw data supporting the conclusions of this article will be made available by the authors, without undue reservation, to any qualified researcher.
Author Contributions
XY conceived this study and performed the hydrological reconstruction. WJZ provided radiocarbon dating and TOC data. ZO calculated the modern precipitation trend. XY and JC prepared the manuscript. All authors participated in the discussion and edited the manuscript.
Funding
This work was supported by the National Key Research and Development Program of China (2016YFA0601902) and the MOST special fund for SKLLQG (LQ0703).
Conflict of Interest
The authors declare that the research was conducted in the absence of any commercial or financial relationships that could be construed as a potential conflict of interest.
References
Billett, M. F., Palmer, S. M., Hope, D., Deacon, C., Storeton-West, R., Hargreaves, K. J., et al. (2004). Linking land-atmosphere-stream carbon fluxes in a lowland peatland system. Glob. Biogeochem. Cycles 18:GB1024. doi: 10.1029/2003gb002058
Blodau, C. (2002). Carbon cycling in peatlands: a review of processes and controls. Environ. Rev. 10, 111–134. doi: 10.1139/a02-004
Broecker, W., and Putnam, A. E. (2012). How did the hydrologic cycle respond to the two-phase mystery interval? Q. Sci. Rev. 57, 17–25. doi: 10.1016/j.quascirev.2012.09.024
Chimner, R. A., Pypker, T. G., Hribljan, J. A., Moore, P. A., and Waddington, J. M. (2017). Multi-decadal changes in water table levels alter peatland carbon cycling. Ecosystems 20, 1042–1057. doi: 10.1007/s10021-016-0092-x
Frolking, S., and Crill, P. (1994). Climate controls on temporal variability of methane flux from a poor fen in southeastern New-Hampshire - measurement and modeling. Glob. Biogeochem. Cycles 8, 385–397. doi: 10.1029/94gb01839
Frolking, S., Roulet, N. T., Tuittila, E., Bubier, J. L., Quillet, A., Talbot, J., et al. (2010). A new model of Holocene peatland net primary production, decomposition, water balance, and peat accumulation. Earth Syst. Dyn. 1, 1–21. doi: 10.1111/gcb.12672
Holden, J. (2005). Peatland hydrology and carbon release: why small-scale process matters. Philos. Trans. R. Soc. a Math. Phys. Eng. Sci. 363, 2891–2913. doi: 10.1098/rsta.2005.1671
Hong, B., Hong, Y., Uchida, M., Shibata, Y., Cai, C., Peng, H., et al. (2014). Abrupt variations of Indian and East Asian summer monsoons during the last deglacial stadial and interstadial. Q. Sci. Rev. 97, 58–70. doi: 10.1016/j.quascirev.2014.05.006
Hong, B., Hong, Y. T., Lin, Q. H., Shibata, Y., Uchida, M., Zhu, Y. X., et al. (2010). Anti-phase oscillation of Asian monsoons during the Younger Dryas period: evidence from peat cellulose delta C-13 of Hani. Northeast China. Palaeogeogr. Palaeoclimatol. Palaeoecol. 297, 214–222. doi: 10.1016/j.palaeo.2010.08.004
Hong, Y. T., Hong, B., Lin, Q. H., Shibata, Y., Hirota, M., Zhu, Y. X., et al. (2005). Inverse phase oscillations between the East Asian and Indian Ocean summer monsoons during the last 12 000 years and paleo-El Nino. Earth Planet. Sci. Lett. 231, 337–346. doi: 10.1016/j.epsl.2004.12.025
Lazcano, C., Deol, A. S., Brummell, M. E., and Strack, M. (2020). Interactive effects of vegetation and water table depth on belowground C and N mobilization and greenhouse gas emissions in a restored peatland. Plant Soil 448, 299–313. doi: 10.1007/s11104-020-04434-4432
Leifeld, J., Wust-Galley, C., and Page, S. (2019). Intact and managed peatland soils as a source and sink of GHGs from 1850 to 2100. Nat. Clim. Change 9, 945–947. doi: 10.1038/s41558-019-0615-615
Li, X., Zhou, X., Zhang, H., Zhou, J., Shang, X., and Dodson, J. (2007). The record of cultivated rice from archaeobiotogical evidence in northwestern China 5000 years ago. Chin. Sci. Bull. 52, 1372–1378. doi: 10.1007/s11434-007-0186-180
Limpens, J., Berendse, F., Blodau, C., Canadell, J. G., Freeman, C., Holden, J., et al. (2008). Peatlands and the carbon cycle: from local processes to global implications - a synthesis. Biogeosciences 5, 1475–1491. doi: 10.5194/bg-5-1475-2008
Nijp, J. J., Metselaar, K., Limpens, J., Bartholomeus, H. M., Nilsson, M. B., Berendse, F., et al. (2019). High-resolution peat volume change in a northern peatland: spatial variability, main drivers, and impact on ecohydrology. Ecohydrology 12:e2114. doi: 10.1002/eco.2114
Olson, D. M., Griffis, T. J., Noormets, A., Kolka, R., and Chen, J. (2013). Interannual, seasonal, and retrospective analysis of the methane and carbon dioxide budgets of a temperate peatland. J. Geophys. Res. Biogeosci. 118, 226–238. doi: 10.1002/jgrg.20031
Page, S. E., Siegert, F., Rieley, J. O., Boehm, H. D. V., Jaya, A., and Limin, S. (2002). The amount of carbon released from peat and forest fires in Indonesia during 1997. Nature 420, 61–65. doi: 10.1038/nature01131
Porter, S. C., and Zhou, W. (2006). Synchronism of Holocene East Asian monsoon variations and North Atlantic drift-ice tracers. Quternary Res. 65, 443–449. doi: 10.1016/j.yqres.2006.01.007
Rennermalm, A. K., Nordbotten, J. M., and Wood, E. F. (2010). Hydrologic variability and its influence on long-term peat dynamics. Water Resour. Res. 46:W12546.
Rigney, C., Wilson, D., Renou-Wilson, F., Mueller, C., Moser, G., and Byrne, K. A. (2018). Greenhouse gas emissions from two rewetted peatlands previously managed for forestry. Mires Peat 21, 1–23. doi: 10.19189/MaP.2017.OMB.314
Shi, Z., Liu, X., and Cheng, X. (2012). Anti-phased response of northern and southern East Asian summer precipitation to ENSO modulation of orbital forcing. Q. Sci. Rev. 40, 30–38. doi: 10.1016/j.quascirev.2012.02.019
Strack, M., Waddington, J. M., Rochefort, L., and Tuittila, E. S. (2006). Response of vegetation and net ecosystem carbon dioxide exchange at different peatland microforms following water table drawdown. J. Geophys. Res. Biogeosci. 111:G02006. doi: 10.1029/2005jg000145
Stuiver, M., Reimer, P. J., and Braziunas, T. F. (1998). High-precision radiocarbon age calibration for terrestrial and marine samples. Radiocarbon 40, 1127–1151. doi: 10.1017/s0033822200019172
Sun, Q., Wang, S., Zhou, J., Shen, J., Cheng, P., Xie, X., et al. (2009). Lake surface fluctuations since the late glaciation at Lake Daihai, North central China: a direct indicator of hydrological process response to East Asian monsoon climate. Q. Int. 194, 45–54. doi: 10.1016/j.quaint.2008.01.006
Wang, B., Liu, J., Kim, H.-J., Webster, P. J., and Yim, S.-Y. (2012). Recent change of the global monsoon precipitation (1979-2008). Clim. Dyn. 39, 1123–1135. doi: 10.1007/s00382-011-1266-z
Williams, C., Flower, B. P., and Hastings, D. W. (2012). Seasonal Laurentide Ice Sheet melting during the “Mystery Interval” (17.5-14.5 ka). Geology 40, 955–958. doi: 10.1130/g33279.1
Xiao, J., Lue, H., Zhou, W., Zhao, Z., and Hao, R. (2007). Evolution of vegetation and climate since the last glacial maximum recorded at Dahu peat site, South China. Sci. China Ser. D Earth Sci. 50, 1209–1217. doi: 10.1007/s11430-007-0068-y
Xu, H., Goldsmith, Y., Lan, J., Tan, L., Wang, X., Zhou, X., et al. (2020). Juxtaposition of western Pacific subtropical high on Asian Summer Monsoon shapes subtropical East Asian precipitation. Geophys. Res. Lett. 47:e2019GL084705. doi: 10.1029/2019GL084705
Xue, J., Zhong, W., Zheng, Y., Ma, Q., Cai, Y., and Ouyang, J. (2009). A new high-resolution Late Glacial-Holocene climatic record from eastern Nanling Mountains in South China. Chin. Geograph. Sci. 19, 274–282. doi: 10.1007/s11769-009-0274-y
Yu, Z., Loisel, J., Brosseau, D. P., Beilman, D. W., and Hunt, S. J. (2010). Global peatland dynamics since the Last Glacial Maximum. Geophys. Res. Lett. 37:L13402. doi: 10.1029/2010gl043584
Zhang, W., Wu, J., Wang, Y., Wang, Y., Cheng, H., Kong, X., et al. (2014). A detailed East Asian monsoon history surrounding the ‘Mystery Interval’ derived from three Chinese speleothem records. Q. Res. 82, 154–163. doi: 10.1016/j.yqres.2014.01.010
Zheng, Y., Zhong, W., Xue, J., Fan, X., Zhen, Z., Liu, W., et al. (2008). Sedimentary characteristics of Dahu lacustrine swamp at Dingnan, Jiangxi Province, eastern Nanling Mountains. J. South China Normal Univ. 2008, 129–135.
Zheng, Y., Zhou, W., Xie, S., and Yu, X. (2009). A comparative study of n-alkane biomarker and pollen records: an example from southern China. Chin. Sci. Bull. 54, 1065–1072. doi: 10.1007/s11434-008-0563-3
Zhong, W., Ma, Q., Xue, J., Zheng, Y., Cai, Y., Ouyang, Y., et al. (2011). Humification degree as a proxy climatic record since the last deglaciation derived from a limnological sequence in South China. Geochem. Int. 49, 407–414. doi: 10.1134/s0016702911040094
Zhong, W., Xue, J., Zheng, Y., Ouyang, J., Ma, Q., Cai, Y., et al. (2010). Climatic changes since the last deglaciation inferred from a lacustrine sedimentary sequence in the eastern Nanling Mountains, south China. J. Q. Sci. 25, 975–984. doi: 10.1002/jqs.1384
Zhou, W. J., Donahue, D. J., Porter, S. C., Jull, T. A., Li, X. Q., Stuiver, M., et al. (1996). Variability of monsoon climate in East Asia at the end of the last glaciation. Q. Res. 46, 219–229. doi: 10.1006/qres.1996.0062
Zhou, W. J., Xie, S. C., Meyers, P. A., and Zheng, Y. H. (2005). Reconstruction of late glacial and Holocene climate evolution in southern China from geolipids and pollen in the Dingnan peat sequence. Organ. Geochem. 36, 1272–1284. doi: 10.1016/j.orggeochem.2005.04.005
Zhou, W. J., Yu, X. F., Jull, A. J. T., Burr, G., Xiao, J. Y., Lu, X. F., et al. (2004). High-resolution evidence from southern China of an early Holocene optimum and a mid-Holocene dry event during the past 18,000 years. Q. Res. 62, 39–48. doi: 10.1016/j.yqres.2004.05.004
Keywords: hydrological reconstruction, carbon accumulation, wetland, spatial pattern, monsoon precipitation
Citation: Yu X, Chen J, Zheng Y, Zhong W, Ouyang Z and Zhou W (2020) Anti-phase Variation of Hydrology and In-Phase Carbon Accumulations in Two Wetlands in Southern and Northern China Since the Last Deglaciation. Front. Earth Sci. 8:192. doi: 10.3389/feart.2020.00192
Received: 11 March 2020; Accepted: 14 May 2020;
Published: 05 June 2020.
Edited by:
Hai Xu, Tianjin University, ChinaCopyright © 2020 Yu, Chen, Zheng, Zhong, Ouyang and Zhou. This is an open-access article distributed under the terms of the Creative Commons Attribution License (CC BY). The use, distribution or reproduction in other forums is permitted, provided the original author(s) and the copyright owner(s) are credited and that the original publication in this journal is cited, in accordance with accepted academic practice. No use, distribution or reproduction is permitted which does not comply with these terms.
*Correspondence: Xuefeng Yu, eGZ5dUBsb2Vzcy5sbHFnLmFjLmNu