 María Teresa Ramírez-Herrera
 Krzysztof Gaidzik
 Steven L. Forman
- 1Tsunami and Paleoseismology Lab, Instituto de Geografía, Universidad Nacional Autónoma de México, Ciudad Universitaria, México City, México
- 2Institute of Earth Sciences, University of Silesia, Sosnowiec, Poland
- 3Department of Geosciences, Baylor University, Waco, TX, United States
Uplift is the predominant factor controlling fluvial systems in tectonically deforming regions. Mountains along subduction zones force incision, aggradation, or sinuosity modifications, showing differential uplift and variations in erosion rates, in river incision, and in channel gradient produced by ongoing tectonic deformation. Thus, landscape can provide information on the tectonic activity of a defined region. Here, field studies, analysis of geomorphic indices using a digital elevation model, and dating of river terraces were undertaken to extract the following: (1) determine rates of ongoing tectonic deformation, (2) identify evidence of active faulting, and (3) explain the possible relation of ongoing differential uplift in the topography of the overriding plate with the geometry and roughness effects of subducting slab along the Mexican subduction within the Guerrero sector. Landscape analysis using geomorphic indices suggests segmentation along stream of the studied Tecpan River basin. Rates of tectonic uplift were derived from river incision rates computed with the combination of strath terrace heights and associated dating. Tectonic uplift rates vary from ∼1 ± 0.3 mm/yr up to ∼5 ± 0.6 mm/yr during the Holocene, consistent with inferred high tectonic activity in this zone. These results vary significantly spatially, i.e., increasing upstream. Possible explanations for spatial variations of tectonic uplift rates are most likely related to an effect of the geometry and the rugged seafloor of the oceanic Cocos plate subduction beneath a faulted continental lithosphere.
Introduction
Uplift is the predominant factor controlling fluvial systems in actively deforming regions, such as forearcs on overriding plates along subduction zones, forcing incision, aggradation, or sinuosity modifications. Quaternary fluvial terraces can be used as an indicator of long-term, on timescales of 102–106 yr, vertical tectonic deformation and also can serve to assess the interactions between tectonics, climate, and sea-level changes (e.g., Merritts et al., 1994; Personius, 1995; Repka et al., 1997; Lavé and Avouac, 2000; Pazzaglia and Brandon, 2001; Wegmann and Pazzaglia, 2002; Matsu'ura et al., 2008; Matsu'ura et al., 2009; Wegmann and Pazzaglia, 2009; Pazzaglia, 2013; Gallen et al., 2015; Schaller et al., 2016; Ramírez-Herrera et al., 2018; de Quay et al., 2019; Evenstar et al., 2020; Su et al., 2020; and Wu et al., 2020). Incision rates derived from strath terraces are commonly used to determine spatiotemporal variations in long-term uplift rates across subduction zone forearcs (e.g., Personius, 1995; Berryman et al., 2000; Pazzaglia and Brandon, 2001; Wegmann and Pazzaglia, 2002; Matsu'ura et al., 2008, 2009; and Ramírez-Herrera et al., 2018). Moreover, derived rates of tectonic deformation can be also used to resolve crustal faults activity, explaining variations in tectonic uplift because of potential relation of the effects of the subducting slab and the topography of the overriding plate (Ramírez-Herrera et al., 2018) and also crustal thickening (Matsu'ura et al., 2008; Matsu'ura et al., 2009).
The Mexican Pacific Coastal region extends along the Mexican subduction zone (MSZ) and between the forearc and magmatic arc region of this active convergent margin. The MSZ is characterized by particular flat slab geometry (e.g., Suárez et al., 1990; Pardo and Suárez 1995; Kostoglodov et al., 1996; Kostoglodov et al., 2003; Manea et al., 2004; and Pérez-Campos et al., 2008), which is subject to the largest amplitude slow slip events (SSEs) ever recorded so far (e.g., Kostoglodov et al., 2010; Radiguet et al., 2012; and Graham et al., 2015) and has an inland volcanic arc running oblique to the trench at ∼15° (García-Palomo et al., 2004). The central morphotectonic segment of the MSZ (Ramírez-Herrera and Urrutia-Fucugauchi, 1999) coincides with the Guerrero Seismic Gap (GSG), characterized by the absence of significant megathrust earthquakes since 1911 (Anderson et al., 1989; Kostoglodov and Ponce, 1994). This region provides a unique opportunity to study how the tectonic framework has affected the styles, rates, and spatial and temporal variations for long-term crustal deformation and uplift in the onshore forearc region of an overriding plate (e.g., Ramírez-Herrera and Urrutia-Fucugauchi, 1999; Ramírez-Herrera et al., 2007; Ramírez-Herrera et al., 2009; Ramírez-Herrera et al., 2011; and Ramírez-Herrera et al., 2018).
The primary aim of this study is to assess Holocene vertical deformation rates of the overriding plate across the Guerrero onshore forearc in the Mexican subduction zone. A clear focus is to determine the long-term response of topography and investigate the potential correlation with the geometry and roughness of the subducting slab and active surface faulting. Secondly, the study aims to quantify long-term (Holocene) tectonic uplift rates in this region. With this purpose, we applied morphometric analysis of a river basin, mapped and dated Holocene river terraces along the Tecpan River in the forearc of the Mexican subduction zone along the GSG. We combined field mapping and high-resolution digital elevation models derived from eBee unmanned aerial vehicle (UAV) imagery and optical stimulated luminescence dating to constrain the Holocene uplift history in the Guerrero forearc. Incision rates are computed with the combination of strath heights and associated OSL ages as a proxy for uplift rates.
Study Area
Tectonic Setting
The forearc of the Mexican subduction zone, where the Cocos plate subducts beneath the North American plate at convergence rate of 6.4–6.7 cm/yr (Figure 1; DeMets et al., 2010), has an unusual “flat-slab” geometry at the plate interface in GSG (e.g., Suárez et al., 1990; Pardo and Suárez 1995; Kostoglodov et al., 1996; Kostoglodov et al., 2003; Manea et al., 2004; Pérez-Campos et al., 2008; and Kim et al., 2010). Here the plate interface shows a gentle slope of ∼5°–10° from the trench to ∼70 km and steepens up to ∼35° at ∼ 120 km distance from the trench (∼50 km inland) and appears listric further inland. The studied catchment of the Tecpan River coincides with the western part of the Guerrero seismic gap (Figure 1A). This segment of the MSZ has had no thrust earthquakes since the Ms 7.8 earthquake in 1911 (Anderson et al., 1989 and Kostoglodov and Ponce, 1994). Since then, the region has experienced >5 m of relative plate motion (Lowry et al., 2006). Several authors suggested the potential for a large subduction earthquake between 7.9 and 8.4 magnitude to occur here (Singh and Mortera 1991; Lowry et al., 2006; and Bekaert et al., 2015). Furthermore, this area experienced the largest amplitude slow slip events (SSEs) ever recorded with Mw ∼ 7.5 (e.g., Kostoglodov et al., 2010; Radiguet et al., 2012; and Graham et al., 2015). Recent studies of the geomorphic and tectonic features of the Guerrero sector of the Mexican subduction offshore forearc report the presence of seamounts on the subducting Cocos plate and the seismic potential (Cerny et al., 2020).
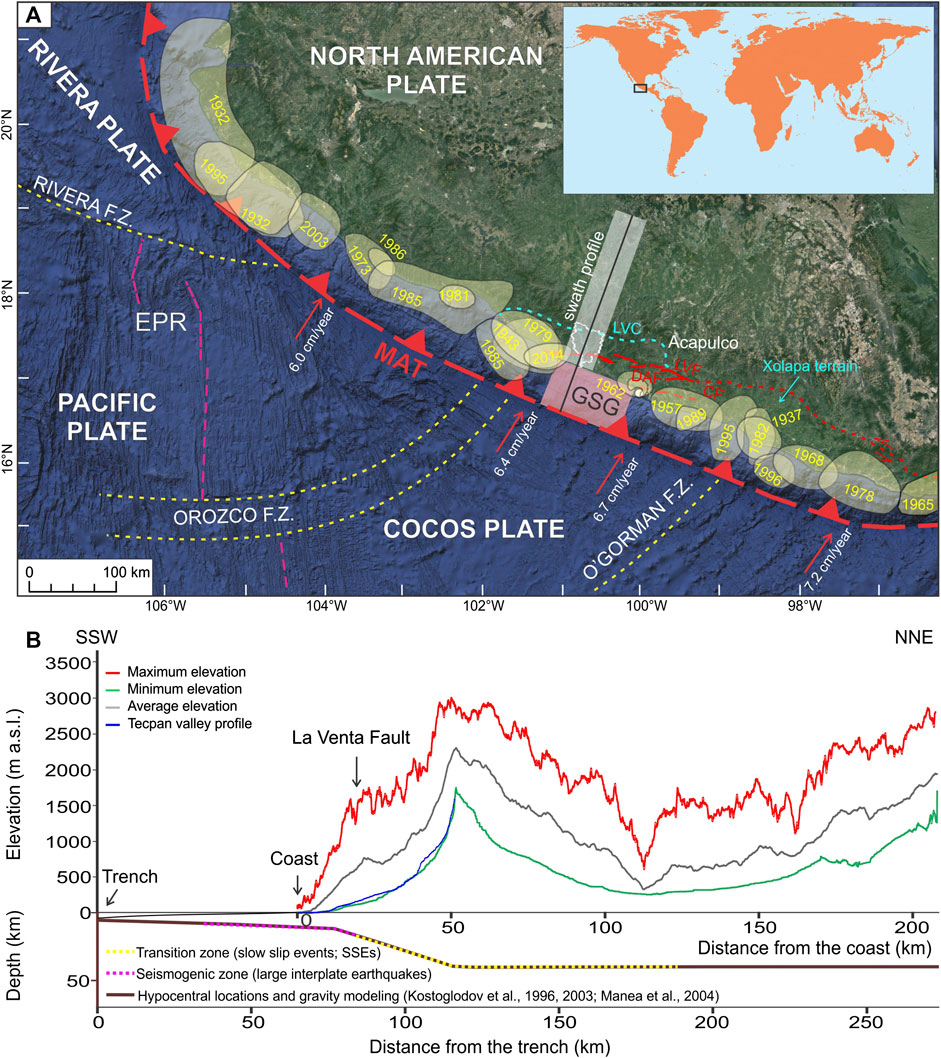
FIGURE 1. (A) Tectonic setting of the Mexican subduction zone: MAT—Middle America Trench (red dashed line with barbs); F.Z.—fracture zone (yellow dashed lines); EPR—East Pacific Rise (pink dashed line); red arrows show convergence rate (DeMets et al., 2010); colored circles show rupture zones of the most important thrust events of 20th century; pink rectangle shows the Guerrero seismic gap (GSG); LVC—La Venta-Chacalapa Fault; CF—Cacahuatepec Fault; and DAF—Dos Arroyos Fault. The Xolapa terrain is the area between the MAT and the LVC. Red half-arrows show the sinistral motion of the Sliver fault. (B) Swath profile and geometry of the subducting slab across a transect in the Guerrero forearc.
The relative motion of plate convergence is slightly (∼12°) oblique to the trench normal. Recent GPS observations suggest that if oblique Cocos-North America motion is partitioned into upper plate sinistral faulting by the ∼650 km, long active shear zone is probably accommodated by the left-lateral, La Venta-Chacalapa (LVC) fault system and other smaller crustal W to E aligned structures, such as Cacahuatepec Fault and Dos Arroyos Fault (Gaidzik et al., 2016 and Ramírez-Herrera et al., 2018). LVC fault system has been associated with a motion of the Xolapa terrain and at the present time is the northern boundary of a ∼110–160-km wide forearc sliver with a sinistral motion of 3–6 mm/year with respect to the North American plate. This sliver accommodates most of the oblique component of the convergence between the Cocos and North American plates (Kazachkina et al., 2020).
The activity of the La Venta Fault (LVF; Figure 1A) in the eastern sector has been confirmed by GPS measurements showing 4–5 mm/yr left-lateral slip of the fault (Kostoglodov et al., 2015). Smaller SSEs occur along LVF simultaneously with the thrust-subduction counterparts. No focal mechanisms have been recorded to sustain the fault’s strike-slip mode. This data absence may be related to a short period of observations (e.g., Pacheco and Singh, 2010) and long, noninstrumental recurrence period (Ramírez-Herrera et al., 2018). Nonetheless, earthquake swarms and SSEs with trench-parallel motion have been reported for Sliver Fault in the Oaxaca region that appears to be the eastward continuation of the La Venta Fault (Fasola et al., 2019). Similarly, LVF also coincides with the downdip of the seismogenic zone (Ramírez-Herrera et al., 2018 and Fasola et al., 2019).
Geomorphic Setting
The Tecpan River basin (Figure 1) is located within the coastal ranges Sierra Madre del Sur and the Guerrero morphotectonic zone in south-west Mexico (Ramírez-Herrera and Urrutia-Fucugauchi, 1999). These ranges typically reach elevations >1,500 m, with some peaks exceeding >3,000 m. The Tecpan River catchment originates in the coastal ranges and drains perpendicular to the coastal piedmont and plain. This coastline appears to be dominated by net deposition, with the presence of low deltaic and alluvial landforms, coastal lagoons separated from the ocean by barrier beaches and rocky promontories, and the absence of marine terraces (Supplementary Figure S1). Sedimentary records corroborate the landscape analysis indicating coastal subsidence during the Holocene at rates of ∼1 mm/yr (Ramírez-Herrera et al., 2007; Ramírez-Herrera et al., 2009; and Ramírez-Herrera et al., 2011). The coastal piedmont and ranges show a deeply incising Tecpan River with numerous flights of fluvial terraces that rise up to 40 m above modern base level.
The 88-km-long Tecpan River drains >1,300 km2 area (Supplementary Figures S1A,B) composed of Precambrian to Cretaceous metamorphic rocks (mainly gneisses) with frequent dolerite dikes, Mesozoic and Cenozoic granitoid bodies, and Cenozoic volcanic rocks (mainly andesite and tuff) in the upstream segments (Supplementary Figure S1). Starting at the elevation of ∼1,600 m a.s.l., the river flows initially toward the south, then after ∼30 km shifts course to the southeast, and, finally, for the last 30 km flows toward SSW, generally perpendicular to the Middle American Trench (Figure 1 and Supplementary Figure S1A). Deep mountain valleys with high channel gradient values (>15 m/km) and steep slopes (mean slope >5°; Supplementary Figure S1A) indicate that the Tecpan River is a type A stream, characterized by steep, cascading, step/pool streams and high energy/debris transport (Rosgen, 1994). Basin elevation ranges from 0 to >3,000 m for the river course along its northern divide (Supplementary Figure S1A). This catchment exhibits steep average slopes of >20° (Supplementary Figure S1A) and flights of fluvial terraces most noticeable along the main course, together with knickpoints and bedrock sectors.
Methods and Materials
Landscape Analysis
A set of geomorphic indices were used (see Supplementary Figure S1) to determine the relative tectonic activity and to differentiate between areas of varying relative uplift rates in the Tecpan River basin (e.g., Hack, 1973; Bull and McFadden, 1977; Bull, 1978; Keller, 1986; Hovius, 2000; Burbank and Anderson, 2001; Kirby and Whipple, 2001; Brocklehurst and Whipple, 2002; Keller and Pinter, 2002; Zámolyi et al., 2010; Giaconia et al., 2012; Kirby and Whipple, 2012; and Gaidzik and Ramírez-Herrera, 2017). Along the river trunk, the following indices were computed: (1) river longitudinal profile (RLP), (2) transverse profiles (TP), (3) gradient of the river, (4) valley width/height ratio (Vf), (5) sinuosity index (SI), (6) stream-length gradient index or Hack’s index (SL), and (7) normalized channel steepness index (ksn). Also, the minimum bulk erosion (MBE) was calculated for the basin area and slope, which are presented spatially. Details on the procedures used for calculations of specific indices and their significance are summarized in Supplementary Table S1. A digital elevation model TanDEM-X DEM (0.4 arcsec, with <10 m absolute horizontal and vertical accuracy; https://tandemx-science.dlr.de/) with 12 m horizontal resolution was the base map for selected geomorphic indices.
River Terraces
River terraces are commonly used to calculate vertical stream incision, together with derived rock uplift and associated crustal deformation (e.g., Merritts et al., 1994; Wegmann and Pazzaglia, 2002; Wegmann and Pazzaglia, 2009; and Ramírez-Herrera et al., 2018). This study identified, classified, and mapped multiple levels of fluvial terraces in the Tecpan River basin. Mapping used satellite images (Image©DigitalGlobe) with 12 m resolution TanDEM-X and associated field surveys. Terraces were mapped initially on satellite images; then, the position and limits were corrected subsequently with TanDEM-X and verified in the field with a handheld GPS. The elevation of each terrace in the field above the river channel was determined using a laser rangefinder (accuracy ± 1 m). The height of fill terraces was measured from the tread surface. Whereas for strath terraces measurements were taken at the height of the terrace tread and underlying bedrock, tectonic interpretations derived from terrace tread height may be misleading (e.g., Wegmann and Pazzaglia, 2009). Also, for many of the measured terraces the internal stratigraphy was deciphered and OSL ages were determined on the enclosing sediments for correlation purposes.
Lastly, an unmanned aerial vehicle (UAV) photogrammetry (eBee autonomous flying drone by senseFly; https://www.sensefly.com/drone/ebee-mapping-drone) was used to document multiple terraces in selected areas. Orthomosaics and digital elevation models (DEM) were computed using the Post Flight Terra 3d Software with manual filtering of vegetation and buildings. Based on the photographs taken during aerial surveys in February 2017 (dry season), the final product was the digital elevation model (DEM), with a 10 cm horizontal resolution (Video 1).
Optically Stimulated Luminescence (OSL) Dating
Optically stimulating luminescence is a technique that dates the burial time of quartz grains. The time-zeroing mechanism is the exposure of grains to >1 min of sunlight. There is subsequent time-signal acquisition with burial, shielding from sunlight, and exposure to ionizing radiation, mostly from radioactive decay during the burial period (Forman, 2015). OSL dating has been used previously in numerous paleoseismic settings to provide chronologic control, in the absence of organic material for radiocarbon dating (e.g., Cox et al., 2007; Forman, 2015; Le Beon, et al., 2018; and Tuttle et al., 2019). Six locations were selected to collect samples for the OSL dating from various fluvial terraces from Q1 to Q4 (see Supplementary Table S2). For that purpose, in the field we cleaned a vertical profile of a terrace, digging in several centimeters into the fluvial deposits. Consequently, we hammered horizontally a 15-cm-long stainless steel tube into the sediments in freshly cleaned vertical sections. Before taking out the tube, we sealed the outer end with tinfoil and duct tape. Then, immediately after removal, we sealed also the inner end in the same way.
Single aliquot regeneration (SAR) protocols (see Supplementary Table S3) (Murray and Wintle, 2003 and Wintle and Murray, 2006) were used in this study to estimate the apparent equivalent dose of the 425–500, 355–425, 250–355, or 150–100 μm quartz fraction dependent on which size fraction yielded at least 0.50 g for 55 to 35 separate aliquots (Table 1). Each aliquot contained approximately 20 to 100 quartz grains corresponding to a 1-mm or less circular diameter of grains adhered (with silicon) to a 1 cm diameter circular aluminum disc. The quartz fraction for a specific grains-size range (e.g., 250–355 µm) with sieving was isolated by density separations using the heavy liquid Na–polytungstate (2.4 and 2.6 g/cc) and at least one 40-min immersion in hydrofluorosilicic acid (HF 40%), to etch the outer ∼10 µm of grains, which is affected by alpha radiation (Mejdahl and Christiansen, 1994). The isolated quartz fraction was rinsed finally in HCl (10%) to remove any insoluble fluorides (cf. Forman et al., 2014).
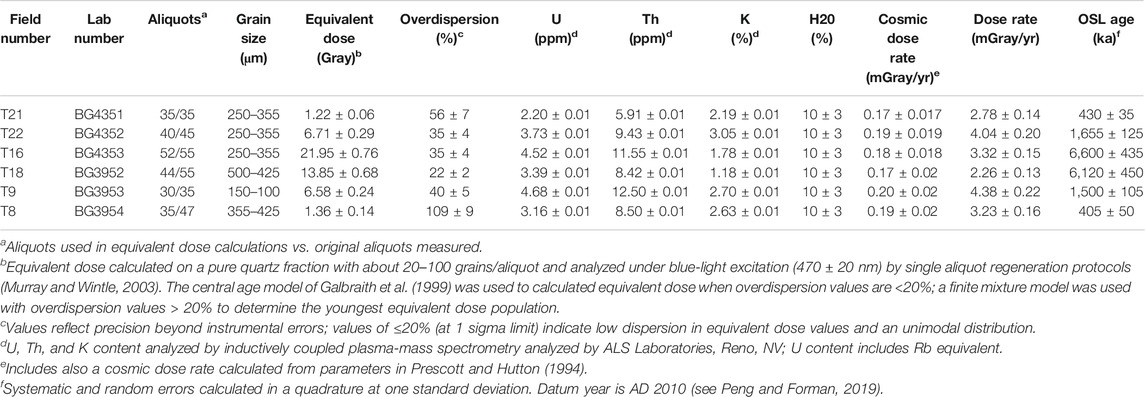
TABLE 1. Optically stimulated luminescence (OSL) ages on quartz grains from fluvial deposits, Tecpan River, western Mexico.
The optical purity of quartz separates was tested by exposing aliquots to infrared excitation (1.08 W from a laser diode at 845 ± 4 nm), which often preferentially excites feldspar minerals. If this test indicated feldspar contamination, the HF 40-min immersion was repeated. Another safeguard of quartz grain purity was examination of a small subsample with a visualized petrographic microscope and by Raman spectroscopy. If a subsample exhibited >1% nonquartz minerals, particularly feldspar minerals, the sample was retreated with density separations, HF soaking for an additional 20 or 40 min, and sieved again and rechecked for grain purity. The six quartz aliquots dated have a quartz purity of >99% and showed weak emissions (<300 counts/second) with infrared excitation at or close to background counts.
An automated Risø TL/OSL–DA–15 system was used for SAR analyses. Blue light excitation (470 ± 20 nm) was from an array of 30 light-emitting diodes that deliver ∼15 mW/cm2 to the sample position at 90% power. Optical stimulation for all samples was completed at an elevated temperature (125°C) using a heating rate of 5°C/s. All SAR emissions were integrated for the first 0.8 s of stimulation out of 40 s of measurement, with background emissions integrated for the last 10 s of data collection, for the 30–40 s interval. The luminescence emission for all quartz fractions showed a dominance of a fast component with >90% diminution of luminescence after 4 s of excitation with blue light. The fast ratio was calculated for natural emission and the equivalent emissions for a regenerative dose for each aliquot (Durcan and Duller 2011). Aliquots with a fast ratio of <15 and infrared depletion ratio of >5% were removed from the final equivalent dose analysis.
A series of experiments was performed to evaluate the effect of preheating at 160, 180, 200, 220, and 240 °C on isolating the most robust time-sensitive and thermal transfer emissions of the regenerative signal prior to the application of SAR dating protocols. These experiments entailed giving a known dose (10 Gy) and evaluating which preheat resulted in recovery of this dose. There was concordance with the known dose (40 Gy) for preheat temperatures above 180°C with an initial preheat temperature used of 200°C for 10 s in the SAR protocols. A second “cut heat” at 180°C for 10 s was applied prior to the measurement of the test dose. A final heating at 260°C for 40 s was applied to minimize carryover of luminescence to the succession of regenerative doses. A test for the reproducibility of the radiation-induced SAR ratio (Lx/Tx) was also performed by giving the same beta (90Sr/90Yt) source radiation exposure for the initial and the final regenerative dose and evaluating the concordance of the SAR ratios, which should be within 10% (Murray and Wintle, 2003 and Wintle and Murray, 2006).
The SAR protocols were used to resolve equivalent doses for six sediment samples (Table 1). The statistical significance of an equivalent dose population for these samples was evaluated for thirty- to fifty-two quartz aliquots (Table 1). Aliquots used for equivalent dose calculations were required to have a fast ratio <15 (Durcan and Duller), a recycling ratio between 0.9 and 1.10, a zero dose test of >5% of the natural signal and errors in equivalent dose of <10% (Murray and Wintle, 2003 and Wintle and Murray, 2006). The regenerative growth curves are modeled by using the exponential plus linear or quadratic form. Error analysis of equivalent dose calculations for individual quartz aliquots assumed a measurement error of 1% with 2000 Monte Carlo simulation repeats to better characterized errors.
The equivalent dose (De) distributions were log normal and exhibited range of overdispersion values (Table 1). Only one quartz separates out six yield overdispersion values ∼20, with the remaining five samples having overdispersion value >35%. An overdispersion percentage of a De distribution is an estimate of the relative standard deviation from a central De value in context of a statistical estimate of errors (Galbraith et al., 1999 and Galbraith and Roberts, 2012). A zero overdispersion percentage indicates high internal consistency in De values with 95% of the De values within 2σ errors. Overdispersion values <25% are routinely assessed for quartz grains that are well solar reset, like eolian sands (e.g., Wright et al., 2011 and Forman et al., 2014), and this value is considered a threshold metric for calculation of a De value using the central age model of Galbraith et al. (1999). Overdispersion values > 25% indicate often mixing or grains of various ages or partial solar resetting of grains; the minimum age model (MAM; four parameters) may be an appropriate statistical treatment for such data. The MAM can effectively model the De components that are time dependent and inherited (Galbraith and Roberts, 2012 and Peng and Forman, 2019). However, some studies have concluded that overdispersion values between 20 and 32% may reflect a signal De population, particularly if the De distribution is symmetrical, with the dispersion related to variability associated with microdosimetry and/or sedimentary processes (e.g., Arnold and Roberts, 2009). We consider overdispersion values > 20% to indicate non-age-related processes such as postdepositional mixing of grains of various ages, partial solar resetting of grains, or complex microdosimetry.
The environmental dose rate (Dr) is a critical measurement for calculating a luminescence age. The Dr is an estimate of the exposure of quartz grains to ionizing radiation from the decay of the U and Th series, 40K, Rb, and cosmic sources during the burial period. The U, Th, Rb, and K concentrations are determined on the bulk sediment by inductively coupled plasma mass spectrometry by ALS Laboratories, Reno, Nevada. The beta and gamma doses were adjusted according to grain diameter to compensate for mass attenuation for the dose rate (Fain et al., 1999; Guerin et al., 2011). A cosmic ray component, considering location, elevation, and depth of strata sampled was calculated to be between 0.17 and 0.20 mGy/yr, which includes the soft component (Prescott and Hutton, 1994 and Peng and Forman, 2019). There is uncertainty in assessing the moisture content of a sample during the burial period. We estimated moisture content of 10 ± 3% (by weight) from present values and particle size characteristics and in reference to field indicators on the height of the water table or possible perched water tables. Systematic and random errors for final ages are calculated in a quadrature at one standard deviation by the Luminescence Dating and Age Calculator (LDAC) at https://www.baylor.edu/geosciences/index.php?id=962356 (Peng and Forman, 2019). The datum year for all OSL ages is AD 2010.
Strath Terraces as Indicators of River Incision, and Derived Uplift Rates
The mapped distribution of terraces was correlated by the relative elevation, terrace surface soil development, internal stratigraphy, and associated OSL ages (cf, Wegmann and Pazzaglia, 2002). The vertical incision rates were computed from the separation between the dated Holocene straths and the modern stream level measured in the field. For that we used the formula (Lambeck et al., 2004; Wegmann and Pazzaglia, 2009):
Consequently, the calculated vertical incision rates are considered a proxy for rock uplift rates (e.g., Merritts et al., 1994; Wegmann and Pazzaglia, 2002; Wegmann and Pazzaglia, 2009; and Ramírez-Herrera et al., 2018).
Results
Landscape Analysis
Tecpan River Segments
Based on the river RLP, TP, and calculated geomorphic indices (G, Vf, SI, SL, MBE, and ksn) (see Supplementary Table S1), Tecpan River shows five distinct segments with variable characteristics (Table 2, Figures 2–4, and Video 2). These river segments are discussed below.
1. The most downstream segment of the Tecpan River on the coastal lowland (0–22 km (0–90 m a.s.l.) is dominated by wide to very wide valley floor up to 18 km distance from the river mouth (Vf > 1.5; Table 2 and Figure 3), changing to a bedrock channel at 18–22 km distance from the coast, outcropping fine-grained granite with well-developed Cloos joints forming orthogonal systems. Sublatitudinal left-lateral and almost vertical mesofaults together with accompanying structures are commonly observed here. The longitudinal profile of the river is approximately flat and is concave in the upper part (Figure 2). The Tecpan River shows SI values that reflect a semisinuous river path (Figure 4) with abandoned meanders, especially after extreme precipitation events, such as hurricane Manuel on September 2013 (Ramírez-Herrera and Gaidzik, 2017). The lower course of this river segment is dominated by low to very low channel gradient and low SL values suggesting the predominance of accumulation processes over erosion (Figure 4). Whereas the upper part of this segment (18–22 km) is generally straight, i.e., shows low SI values (Table 2; Figure 4), the segment upper part also shows steep V-shaped valley, narrow valley bottom (Figure 3), high channel gradient, high SL values (Figure 4), and a concave longitudinal river profile (Table 2 and Figure 2).
2. We have observed W-E strike-slip faults with a small dip-slip component in granite bedrock potentially associated with the La Venta Fault system (upstream part of segment 1, at 18–22 km and 35–90 m a.s.l.) (also see Gaidzik et al., 2016). Here, the alluvium cover was washed away by flooding produced by extreme rainfall during hurricane Manuel in 2013. Sublatitudinal left-lateral and almost vertical mesofaults together are commonly observed with accompanying structures. The course of the river is generally straight, as indicated by very low SI values (1.0–1.1; Table 1; Figure 4). High vertical erosion potential of the river is corroborated by deep and steep V-shaped valley slopes, narrow valley bottom (Figure 3), high channel gradient (10–20 m/km), high SL values (up to 1,000; Figure 4), and concave longitudinal river profile (Table 2 and Figure 2).
3. A wide flat-floored valley dominates from the 22–28 km and 90–115 m a.s.l. (1.0 < Vf < 1.5; Table 1 and Figure 3) with relatively low and gentle slopes of the Tecpan River, located between two bedrock zones. A very low channel gradient (<10 m/km; Table 1 and Figure 4) and normalized channel steepness index (<100; Table 2 and Figure 4) suggest a predominance of accumulation processes. Only a small part of this segment, 28–29 km (115–125 m a.s.l.), shows a bedrock channel with V-shaped valley (Figures 2, 3). Vertical incision of the river is corroborated by a relatively high channel gradient (∼10 m/km; Table 1 and Figure 4), SL (600–1,000; Table 2 and Figure 4), and ksn (100–700; Table 1 and Figure 4) and low values of Vf (∼0.75; Table 2 and Figure 4) and SI (∼1.05; Table 2 and Figure 4).
4. The longest, central segment of the Tecpan River is characterized predominantly by an alluvial channel alternately with a subordinate bedrock channel. The river long-profile shows a convex geometry (Figure 2), with the transverse profiles showing the predominance of local low-relief and wide flat-floored valley (Figure 3) local relief. Calculated geomorphic indices yield a wide range of values depending on whether referring to alluvial of bedrock channel or fill sectors. In general, this segment is characterized by the highest sinuosity (SI values up to 1.9; Table 2 and Figure 4) and variable valley width.
5. This river segment is composed mainly of bedrock and subordinate alluvial channel between 56 and 66 km (350–530 m a.s.l.) (Table 2). It shows concave geometry on the longitudinal profile (Figure 2) and narrow V-shaped valley observed in the transverse directions (Figure 3), low Vf values, together with relatively high values of channel gradient, SL, and ksn (Table 2 and Figure 4). Computed SI values suggest moderate sinuosity (Table 2 and Figure 4).
6. The most upstream segment of the Tecpan River (66–88 km at 530–1,560 m a.s.l.) is dominated by vertical incision (highest values of channel gradient and SL index together with a significant drop in elevation, i.e., >1,000 m; Table 2; Figure 4) and mass movement processes. The valley bottom is narrow to very narrow with steep V-shaped valley slopes (Figure 3). The course of the river is generally straight, following the gravitational slope, as indicated by low values of the sinuosity index (Table 2 and Figure 4).
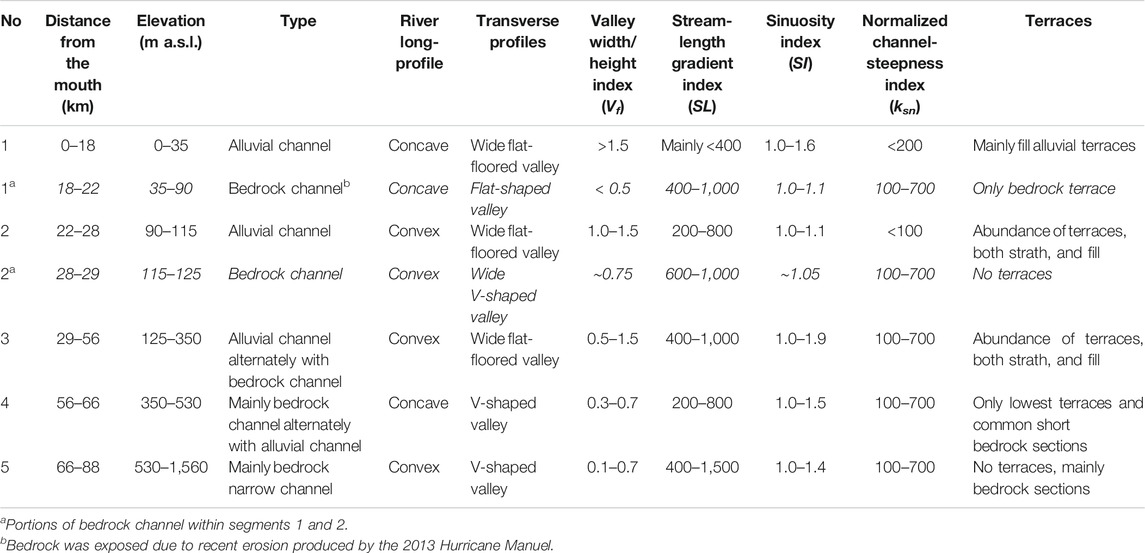
TABLE 2. Segments along the Tecpan River and geomorphic indices (see Figure 2).
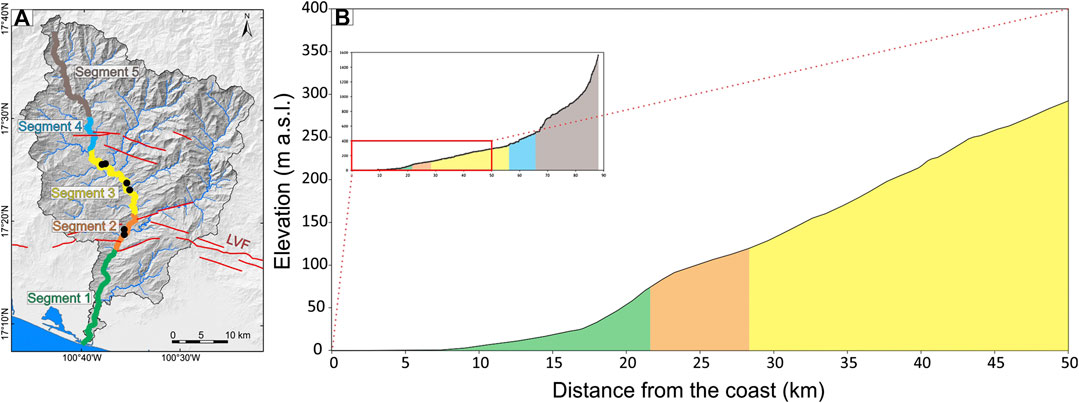
FIGURE 2. Segmentation of the Tecpan River (A) and river longitudinal profile (B); colors on the profile correspond to colors of segments defined along the river (for details on geomorphometric indices in each segment, see Table 2). Black dots show the location of the OSL sampling sites. LVF—La Venta Fault.
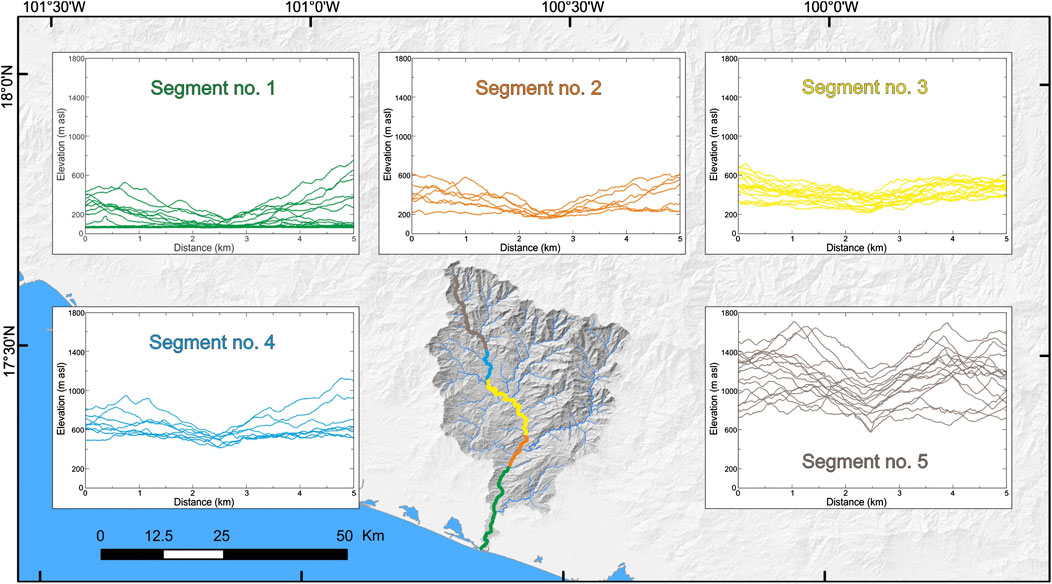
FIGURE 3. Segments along the Tecpan River and cross-sections of the Tecpan valley (5 km long) within defined segments.
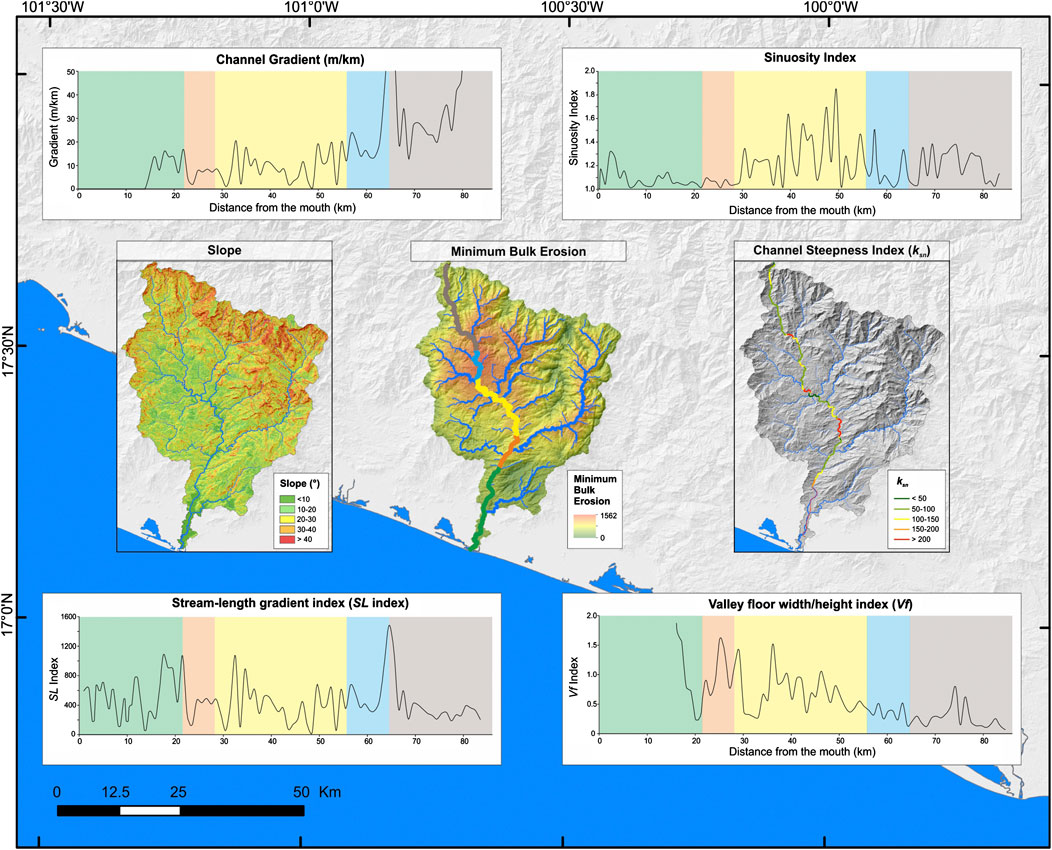
FIGURE 4. Morphometry and geomorphometric indices calculated for the Tecpan drainage basin and within defined segments along the Tecpan River.
Minimum Bulk Erosion (MBE)
The highest values of the minimum bulk erosion (up to >1,500 m of eroded-rock column) cluster in the upper central part of the Tecpan drainage basin, mainly in the sixth and the upper part of the fifth segment (Figure 4). It coincides with a wide river valley, together with low slope and local relief. A substantial increment in minimum bulk erosion was observed upstream from the La Venta Fault (i.e., upstream from segment no. 1; Figure 4). This detected increase does not correlate with changes in lithology (compare Supplementary Figure S1B and Figure 4). The lowest values of MBE (<500 m of eroded-rock column) are recorded in the southernmost segments (mainly segments nos. 1 and 2), downstream from the La Venta Fault (Figures 1, 4).
River Terraces
Spatial Distribution
We observed fill and strath terraces, both paired and unpaired types, along the Tecpan River. The first segment wide valley floor is dominated by broad, wide and low alluvial fill terraces (<10 m above the river channel) from the mouth of the Tecpan River to the exposed bedrock channel. Commonly, these landforms are associated with the abandoned meanders, common in this first segment (Figure 5). The second segment is dominated by intercalated strath and fill terraces up to almost 50 m above the river. It is characterized by continuous occurrence of strath terraces on the left riverbank, with heights ranging from 7 to 18 m (bedrock heights from 4 to ∼12 m). Further upstream (28 km), all Holocene terraces are unpaired reflecting continuous lateral erosion and vertical incision (Merritts et al., 1994). We observed an abundance of strath terraces of different heights and internal stratigraphy, with treads up to 46 m and bedrock up to 23 m above the river (from here on we will use an acronym for above river: ar) along segment 3, whereas fill terraces are only locally formed mainly as the lowest terrace.
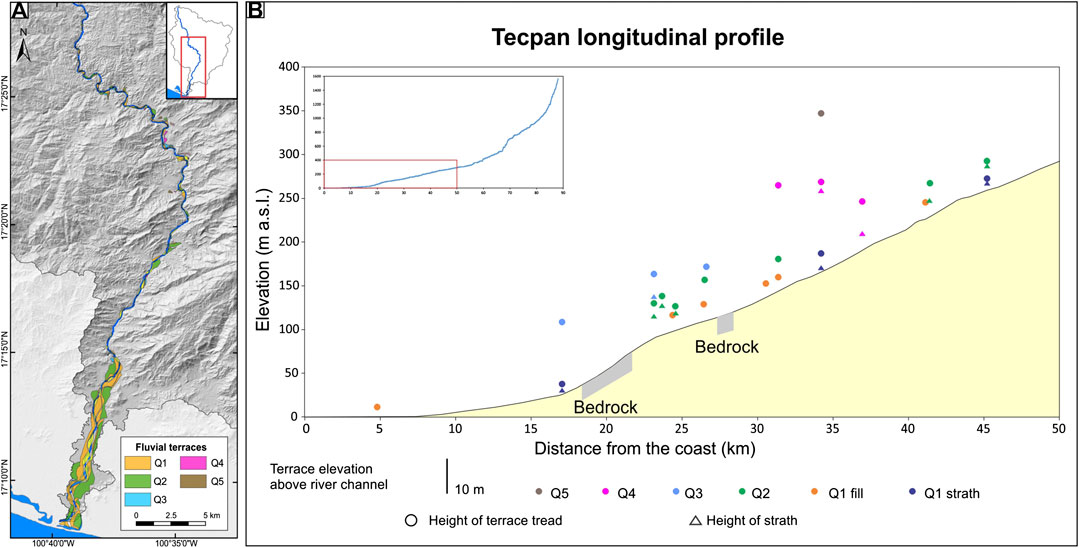
FIGURE 5. River terraces along the Tecpan River. (A) Distribution of mapped terraces. (B) Longitudinal profile of the Tecpan River with location and heights above the valley floor of fluvial terraces.
The lowest terraces in the Tecpan valley are presently alternating with small bedrock segments upstream of segment 5. Bedrock segments (1- upstream part, 2-upstream part, 4 and 5) have a V-shaped valley with narrow valley floor and steep slopes, with rare or none fluvial terraces. The uppermost river segment lacks terraces with the dominance of vertical incision and mass wasting.
Terrace Stratigraphy and Age
Five groups of river terraces were observed in the Tecpan River basin based on internal stratigraphy and associated OSL ages from youngest to oldest: the youngest terrace Q1a is mostly composed of fill with a tread height of 2.8–5.1 m ar. Locally in the upstream segments, there is a correlative strath terrace Q1b with heights of 0.5–1.7 m ar, Q2 is a strath terrace with treads height up to 12 m, strath height ranging from 4.6 to 7.5 m, and Q3 is a strath terrace with tread heights of 15–18 m and corresponding strath heights of 11–12 m. The next highest terrace, Q4, is a strath terrace treading up to 25–30 m with eroded bedrock up to 23 m. The highest strath terrace recognized is Q5 with treads height up to 46 m (Figure 5 and Supplementary Table S2).
The distribution and morphology of Q1 terrace is spatially discontinuous and complex. Downstream, it is a cut-and-fill terrace Q1a, whereas mid- and upstream its vertical profile reveals the existence of strath equivalent in some places to nearly 2 m height, Q1b. The treads height varies from <3 m in the river segments close to the mouth to about 5 m upstream (Figure 5 and Supplementary Table S2). The alluvial deposits of this terrace are composed of fine to coarse sand and gravel, occasionally with higher content of finer material, usually fining-upward, massive, locally with visible horizontal layering or cross-lamination (Supplementary Figure S2). In some locations (e.g., downstream and in the mid-basin segments), these terraces were partially destroyed by erosion triggered by the hurricane Manuel in September 2013 and subsequently overlain by flood deposits produced by this extreme event. Downstream, these >1 m thick flood deposits are composed of fine to coarse sand, locally with gravel. OSL dating of quartz grains from the horizontally bedded, finer sand beds from disparate sites (T8 and T21) and avoiding flood deposits from 2013 hurricane Manual yielded concordant ages of 405 ± 50 years (BG3954) and 430 ± 35 years (BG4351) (Table 1).
Terraces Q2 show significant variations in tread and strath heights, e.g., 6.8–11.8 m and 4–7.7 m, respectively (Supplementary Table S2 and Figure 5). Even though being common along the Tecpan River, these are usually unpaired, occurring mainly on the left riverbank. The bedrock is either granite or gneiss of the Xolapa Complex. The overlying alluvium is of variable thickness (>0.5 m) and is composed of massive, well-rounded cobbles, pebbles, and boulders (granitoid, andesite, quartz, etc.) in a reddish clay or sandy matrix. Locally alluvial deposits show evidence of cementation (Supplementary Figure S3). Soil development on the surface of Q2 is modest with solum thickness of 5–10 cm.
The Q3 strath terrace occurs locally, often accompanied by lower terrace Q2 with elevations of strath and treads of up to 18 and 12 m, respectively (Supplementary Table S2 and Figure 5). Q2 strath terraces are eroded into granite and gneiss bedrock with the overlying alluvium characterized by the predominance of a cemented clayish matrix over weathered cobbles, pebbles, and even boulders. Big boulders (>1 m diameter) are commonly observed on the upper surface of treads, with a solum that is ∼15 cm thick (Supplementary Figure S4). The highly cemented sediment and dominance of grussified material precluded OSL dating.
The Q2 terraces show similar stratigraphic characteristics at sites T9 and T22. Exposures reveal that the terrace is cored by up to few meters of bedrock regolith and at site T9 up to 2-m-thick deposit of gravel, pebbles, and cobbles with fine sand matrix. Similarly, site T22 shows fine sand with clay that covers the bedrock surface (Figure 6). Quartz grains for OSL dating were retrieved from finer-grained alluvial beds at depths of >0.3 m from surface from two disjunct sites and samples yielded concordant OSL ages of 1,500 ± 105 years (BG3953) and 1,655 ± 125 years (BG4352), respectively (Table 1).
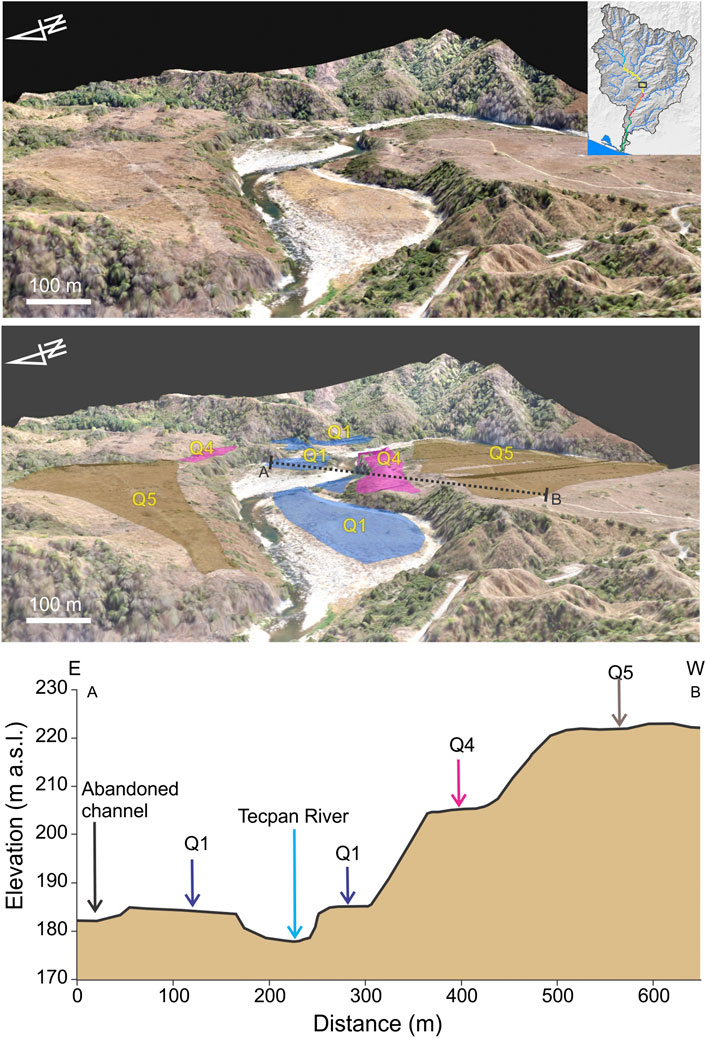
FIGURE 6. Photographs and stratigraphy profiles of sampled terraces along the Tecpan River.
Q4 terraces (treads >25 m height) occur locally upstream, along segment 3 (Figures 5–7 and Supplementary Figure S5, Supplementary Table S2, Video 2). This Q4, terrace is composed mainly of granite bedrock and rather thin (<1 m) alluvium overlain by a cemented reddish clayish matrix with occasional grussified cobbles, pebbles, and boulders with granite and other volcanic lithologies (Supplementary Figure S5). The surface solum is up to 25 cm, evident in the upper part of Q4 terrace profile (Supplementary Figure S5). The surface of this terrace is uneven because of the abundance of granite and andesite boulders up to >1 m in diameter. Quartz grains from sand-rich beds for two disjunct sites, T18 and T16, above strath heights of 4 and 23 m, respectively, yielded OSL ages of 6,120 ± 450 years (BG3952), site T18, and 6,600 ± 435 years (BG3952).
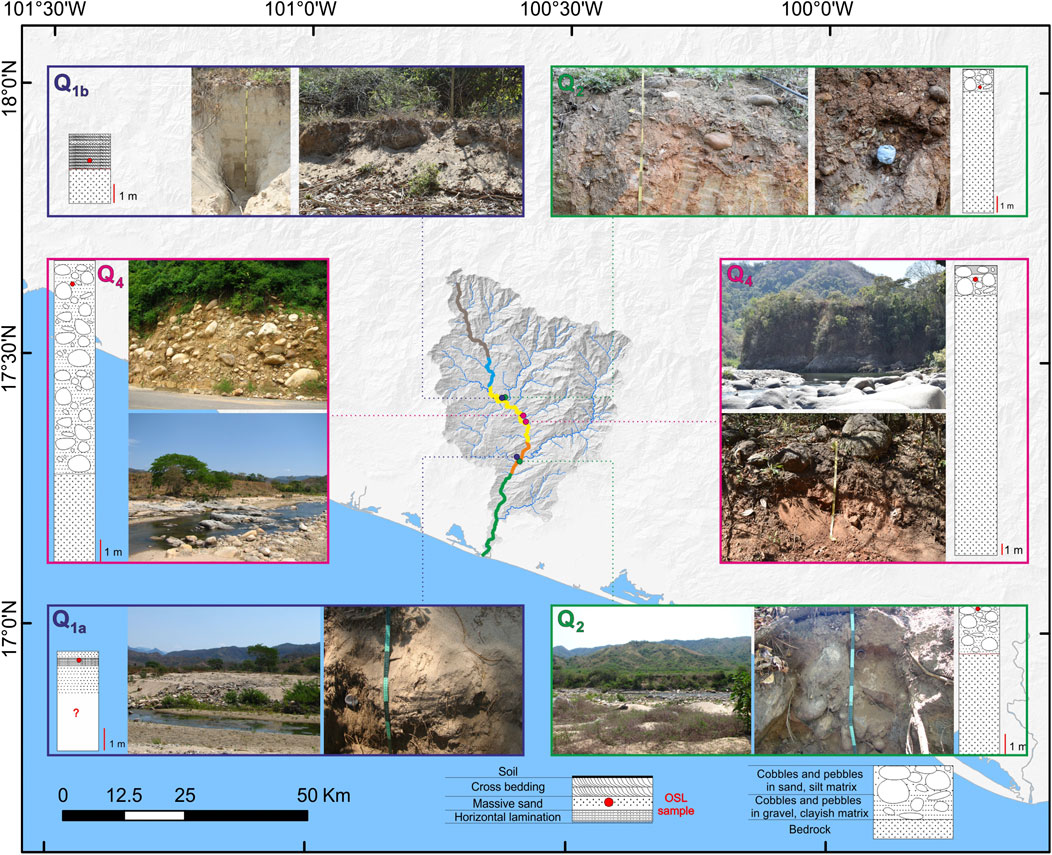
FIGURE 7. High-resolution digital elevation model (10 cm horizontal resolution) obtained from eBee unmanned aerial vehicle (UAV) photographs showing terraces distribution in the Tecpan valley in segment no. 3; the dashed line shows the location of the profile AB presented in the lower part of the figure. The inset shows the location of the presented DEM (black rectangle).
The Q5 surface was the highest terrace identified but at only one location, above the Q4 terrace, in segment 3 on the east riverbank (Figures 5–7 and Supplementary Figure S6, Supplementary Table S2, Video 2). The Q5 surface is a strath terrace with a thick alluvial cover of cobbles, pebbles, and boulders in a cemented clayish matrix and tread height up to 46 m above the modern river channel.
Incision Rates and Their Distribution
The abandonment of river terraces reflects river downcutting into former active channels, floodplains, and bedrock reaches (e.g., Merritts et al., 1994). Terraces can serve as a topographic marker for former riverbed surfaces and provide data for calculation of net vertical erosion of rivers. The calculated rates of river incision are between 0.7 ± 0.3 and 4.5 ± 0.4 mm/yr based on strath heights and associated OSL ages (Table 3). The age for undated, disparate terraces was inferred through correlations to sites with OSL ages (Q1, Q2, and Q4) based on proximity, relative position, elevation, surface and soil morphology, internal stratigraphy, and bedrock elevation (Table 3).
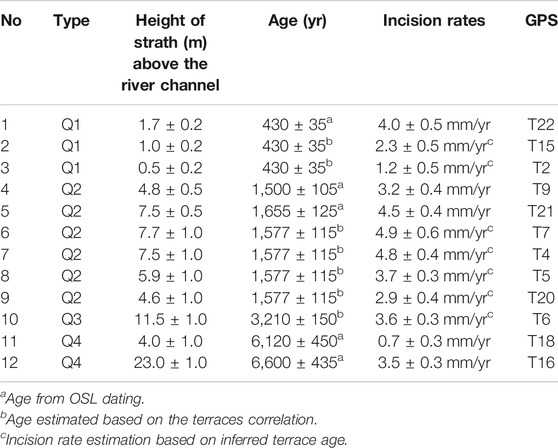
TABLE 3. Height of strath terraces measured in the field, OSL ages, and derived incision rates.
A height-OSL ages plot of strath terraces appears spatially consistent, with one exception: Terrace Q4 (Table 3 and Figure 8). Surprisingly, the Q4 terrace surfaces showed significantly different strath and tread height at 4 and 23 m and 13.8 and 25 m, respectively, with comparable sedimentology and stratigraphy of alluvial sediments. The OSL dating yielded similar ages of, i.e., 6,120 ± 450 yr at site T18 and 6,600 ± 435 yr at site T16 (Table 1). Despite differences in height, both terraces, based on their stratigraphy and OSL ages, appear to be contemporaneous, i.e., Q4 terraces (see also Wegmann and Pazzaglia, 2002 and Wegmann and Pazzaglia, 2009). However, the 6.1 ka age at just 3 m above the current river level indicates an anomalous but plausible fluvial process. This 6.1 ka age on fluvial sediment at 3 m may indicate an aggradational phase, in filling a bedrock depression, or pothole and is a minimum limiting age on the subjacent strath surface. Alternatively, the separate terraces at ca. 6.1 and 6.6 ka do not have the same origin and the varying elevations indicate a highly dynamic fluvial system. Based on terrace ages and on the strath terrace height, 11.5 ± 1.0 m at site T10, the most significant function yields the age of the Q3 terrace of 3,210 ± 150 years, suggesting a relatively constant incision rate. The derived incision rate is 3.6 ± 0.3 mm/yr (Table 3).
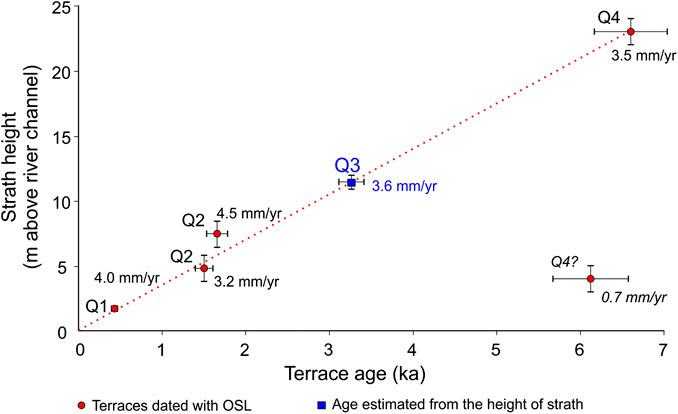
FIGURE 8. The height of the strath in Holocene terraces along the Tecpan River plotted against terraces age.
Discussion
Tecpan basin fill and strath terrace spatial distribution shows a general correlation with segments along the trunk river, i.e., with the distance upstream, the geometry of the river long profile, valley transverse profiles, valley floor width to height index, and sinuosity index (Supplementary Table S1 and Figure 5). Fluvial terraces are best preserved usually in segments characterized by convex longitudinal profile, wide flat-floored valley (high values of Vf), and high sinuosity together with low values of indices related to vertical incision potential of the river (i.e., gradient, SL, ksn). Alternatively, in bedrock with steep V-shaped valley and predominantly vertical river incision, fluvial terraces are absent.
Spatiotemporal Variations of Derived Rock Uplift Rates and Geomophometric Indices
The Holocene incision rates calculated with OSL ages of fluvial terraces along the Tecpan River are an approximation for rock uplift rates in the forearc within the Guerrero Seismic Gap. However, river incision rates may lag uplift and cause complex fluvial system response and thus may yield a minimum constraint (Lavé and Avouac, 2000; Evenstar et al., 2020). These results indicate that incision rates are relatively constant in time, but not in all spatial scales with inferred rates of uplift of 3.2 to 4.5 mm/yr since the mid-Holocene (Table 3).
However, apparent incision rates show spatial variations along segments of the Tecpan River. For example, the incision rate for Q1 terraces varies between 1.2 mm/yr downstream, segment 1, at site T2, and 4.5 mm/yr upstream, in the upper part of segment 3, at site T21. In contrast, Q2 terraces showed the highest vertical deformation rates for river segments eroded in to or adjacent to bedrock channels (Figure 9). High relative uplift rates are also corroborated by morphometric indices and with highest values of MBE (Figures 3, 4, 6, and 9, Table 2 and Supplementary Table S2). The apparent increment of incision rates upstream correlates with the spatial distribution of the minimum bulk erosion (Figure 4; Gaidzik and Ramírez-Herrera, 2017). Similar correlation was observed also for the Papagayo River in the eastern boundary of the Guerrero Seismic Gap (Ramírez-Herrera et al., 2018), indicating temporal and spatial continuity of elevated incision rates.
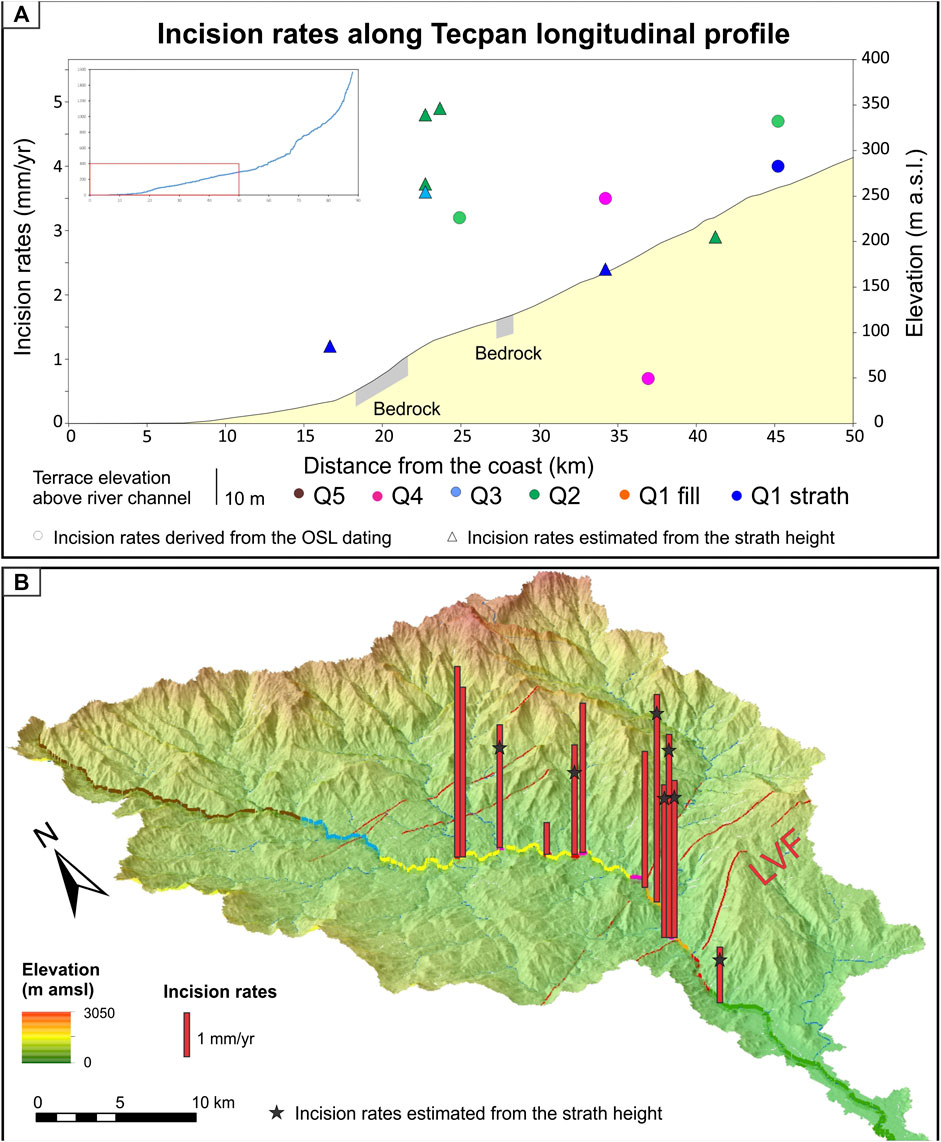
FIGURE 9. (A) Incision rates (left vertical axis) determined from OSL dating of Holocene terraces along the Tecpan River plotted with respect to distance along the valley’s longitudinal profile (right vertical axis). (B) Incision rates (red columns) drawn on a perspective three-dimensional view of the Tecpan River drainage basin; LVF—La Venta Fault.
Terrace spatial distribution shows a general correlation with segments along the trunk river, e.g., particularly with the distance upstream, the geometry of the river long profile and valley transverse profiles, valley floor width to height index, sinuosity index, and other morphometric indices (Table 2 and Figure 5). River terraces are often preserved in segments characterized by convex longitudinal profile, wide flat-floored valley (high values of Vf), and high sinuosity together with low values of indices related to vertical incision potential of the river (i.e., gradient, SL, ksn). In the Tecpan basin, these are mainly segments 1, 2, 3, and subordinate segment 4. Conversely, in bedrock channels with steep V-shaped valley and predominantly vertical river incision, fluvial terraces are mostly absent.
The thickness of the Holocene alluvial deposits atop the straths does not show considerable thickening or thinning downstream or upstream. This infill reflects changes related to the local relief on the terrace strath from anthropogenic impacts, the terrace location with respect to the valley-bottom edges, and the proximity to significant tributary streams. This might indicate that the modern channel and its deposits represent valley-bottom conditions throughout the Holocene (Wegmann and Pazzaglia, 2002).
Segments along the Tecpan River with rare to none river terraces, together with narrow V-shaped valleys (i.e., segment 1 in the upstream part, 2, 4, and 5), correspond with high values of river gradient, stream-length gradient index, and normalized channel steepness index, together with low values of valley width to height index and sinuosity index (Table 2, Figures 2–4). Knickpoints and knickzones for > 1-km-long sections with anomaly higher gradient occur frequently for segments with high vertical incision and valley-bottom narrowing. These sections upstream of segment 1 often coincide with the traces of W-E strike-slip crustal faults with up to 30%, dip-slip component (Gaidzik et al., 2016). The estimated rock uplift rates from field measurements and OSL ages is consistent with inferred differential uplift (Gaidzik and Ramírez-Herrera, 2017).
Forearc Rock Uplift Rates
The relatively high incision rates for the Tecpan River transect are comparable with those computed for the Papagayo River (Ramírez-Herrera et al., 2018), located in the eastern boundary of the Guerrero Seismic Gap. There, the derived Holocene uplift rates vary from 2.4 mm/yr to ∼4.9 mm/yr, with significant increase upstream. Variations in uplift rates in the Papagayo River were explained by the geometry of the subducting slab and/or crustal faults (Ramírez-Herrera et al., 2018). Incision rates calculated along the Tecpan River within the Guerrero forearc are comparable and even higher for Mexican subduction zones (Ramírez-Herrera et al., 2018) and for other subduction zones, such as Cascadia (Wegmann and Pazzaglia, 2002), New Zealand (Berryman et al., 2010; Bonnet et al., 2019), Chile (Farías et al., 2005; González-Alfaro et al., 2018), and Costa Rica (Marshall et al., 2007). High vertical deformation rates up to ∼5 ± 0.6 mm/yr recorded for the Guerrero seismic gap are similar with Holocene incision rates computed for the Nicoya Peninsula seismic gap in Costa Rica (1–6.5 mm/yr; Marshall et al., 2007). However, relatively high long-term incision rates in the Guerrero seismic gap suggest that such gaps may have ephemeral features and possibly artifacts of the limited observational seismic record and independent of deformation on 102 104 years timescales.
Potential Sources of Differential Rock Uplift Rates
Variations in incision rates are controlled mainly by lithology, climate change, and tectonic activity across the Guerrero forearc (e.g., Merritts et al., 1994; Pazzaglia and Brandon, 2001; Wegmann and Pazzaglia, 2002; Wegmann and Pazzaglia, 2009; Ramírez-Herrera et al., 2018; and Su et al., 2020). The height and age of Holocene terraces yield apparent incision rates and, thus, derived uplift rates along the Tecpan River. Variations in climate and changes in sea level may influence river incision rates (e.g., Merritts et al., 1994; Burbank and Anderson, 2001; Gao et al., 2016; Su et al., 2020; and Wu et al., 2020). However, in the study area, the local sea level has remained relatively constant since the mid-Holocene, ca. 6,000 yr B.P. (Curray et al., 1969 and Sirkin, 1985), i.e., the age of the oldest Q4 terraces in this study. The projected global model of sea level variability also coincides with the local eustatic changes (Peltier, 2004; Peltier et al., 2015). Nevertheless, we cannot neglect the possibility of a delayed response of these terraces to the earlier sea level changes. The lithology of the Tecpan River basin is relatively homogenous, composed predominantly of granite and gneiss, with the subordinate occurrence of volcanic rocks in the most upstream segments, outside the study area and the location of dated river terraces. Variation in bedrock lithology is small within the studied reaches of the Tecpan River, which can affect the rate of fluvial erosion (Burbank and Anderson, 2001). Thus, the observed differential rock uplift rates inferred from incision rates appear to be independent of variations in rock erodibility.
We propose three probable hypotheses to explain increments in the tectonic uplift rates in GSG forearc as follows.
1) The geometry of the subduction zone appears to influence the long-term vertical deformation rates in the overriding upper plate across the Guerrero forearc in the Mexican subduction zone. The highest incision rates for upstream segment 2 may coincide with the change in the geometry of the subducting slab, from gently ∼7° to steeply dipping ∼35° (Figure 10). This concave bend results in crustal thickening and normal extension in the upper crust of the overriding plate. Recent seismic events in the Mexican subduction zone indicate a normal-faulting rupture, where the curvature of the subducting plate is high, such as bending of the subducting slab, for example, the Mw 8.2 Tehuantepec earthquake on September 8, 2017 (Melgar et al., 2018b), the Mw 7.1 Puebla-Morelos earthquake on September 19, 2017 (Melgar et al., 2018a), and the Mw 5.9 Coyuca earthquake on October 8, 2001, that occurred in the Guerrero Seismic Gap, ∼ 60 km east of the Tecpan River (Pacheco et al., 2002).
2) La Venta fault regional structure represents sinistral motion with a significant (30%) dip-slip component. There are surprising variations apparent in uplift rates along the Tecpan River. An uplift rate of ∼1 ± 0.3 mm/yr occurs downstream, whereas, 18 km from the coast, the incision rate is ∼5 ± 0.6 mm/yr for segments 2 and 3 and appears to be related to the trace of La Venta Fault and other W-E crustal faults (Figures 1, 9). This regional structure, representing sinistral motion with a dip-slip component results from the obliquity of the Mexican subduction zone, which apparently deflects and offsets rivers across the Guerrero forearc (Gaidzik et al., 2016), controls the spatial variation in long-term vertical deformation along the Papagayo River (Ramírez-Herrera et al., 2018). Current activity of La Venta Fault in Guerero Seismic Gap has been associated with a decrease in seismicity from this fault to the north (Kostoglodov et al., 2015) and earthquake swarms SSEs with trench-parallel motion in Oaxaca (Fasola et al., 2019). Although the La Venta Fault and other W-E structures are predominantly strike-slip lineaments, a small dip-slip component (up to 30%) could locally increase incision rates on the upthrown block (northern block; segment 2) and enhance net deposition on the downthrown block, i.e., segment 1 with the predominance of fill terraces. The above-mentioned observations suggest that crustal faults occur subparallel to the subduction zone and partially control the observed pattern of incision rates in the Guerrero forearc. Tectonically driven rock uplift and high river-incision rates associated with regional crustal thickening resulting from the activity of strike-slip faults have been recognized also in the Tibetan Plateau (Su et al., 2020). The location of the La Venta Fault coincides with observed high values of incision rates upstream from segment 2. In the Tecpan drainage basin, we observed mainly strike-slip faults parallel to the subduction zone that accommodates the oblique convergence with up to 30% normal fault component (Gaidzik et al., 2016). This extensional dip-slip component of W-E faults may be partially controlling the observed pattern of uplift rates. Thus, recorded strike-slip faults with dip-slip component are probably related to the interaction of oblique convergence in the Mexican subduction zone that triggers slip partitioning and sinistral forearc sliver and the normal regime produced by the bend in the geometry of the subducting slab. This mechanism can explain high uplift rates upstream from the LVF and bend in the subducting slab geometry and low values downstream up to subsidence observed on the coast (Ramírez-Herrera et al., 2007; Ramírez-Herrera et al., 2009; and Ramírez-Herrera et al., 2011). Thus, we hypothesize that the observed differential incision/uplift rates pattern is mainly controlled by crustal W-E faults and subduction-related (regional) uplift as proposed for other forearc areas (e.g., Personius, 1995; Ramírez-Herrera et al., 2018; and Robertson et al., 2019).
3) Seamount subduction hypothesis: although GSG seamounts are smaller than the Japanese counterparts (Mochizuki et al., 2008), we hypothesize that another cause for increments in the tectonic uplift rates might be associated to the subduction of seamounts and roughness of the Cocos plate under this portion of the Guerrero forearc, experiencing isostatic and collisional process (Cerny et al., 2020). Subduction of seamounts has been found to be producing a significant effect on both regional seismicity and the deformation of both the subducting and the overriding plates (Scholz and Small, 1997). The Guerrero forearc where there is a belt of subducting seamounts, ∼1,000 m high, shows increase in seismic activity (see Figure 5 in Cerny et al., 2020). This can be compared with the Joban seamount chain subducting offshore the Japan trench (Cerny et al., 2020). Such increase in upper plate deformation due to seamount and ridge subduction has been observed for instance in Costa Rica where seamounts domain over a 100 km from the trench denote rock uplift rates (e.g., Wells et al., 1988; Dominguez et al., 1998; Fisher et al., 1998; and Morell, 2016), Japan (e.g., Wallace et al., 2009), and Peru (Hampel et al., 2004).
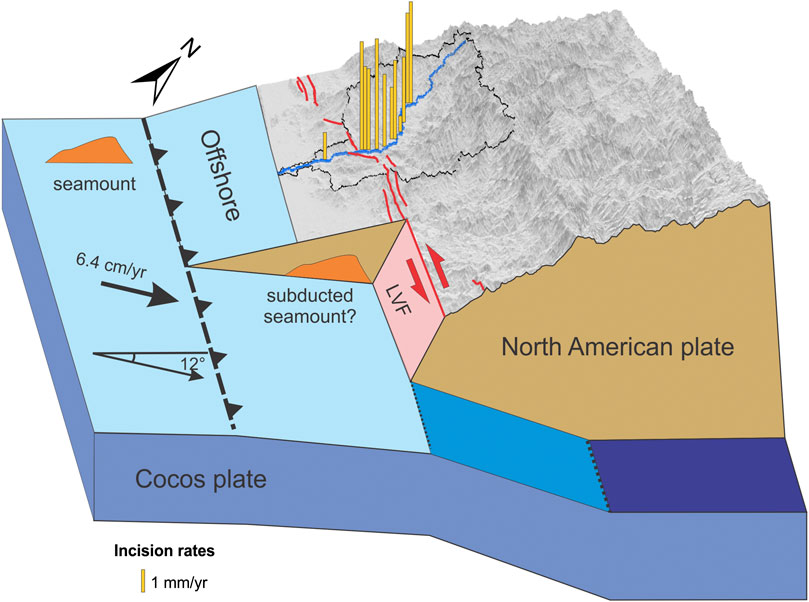
FIGURE 10. Diagram presenting the location of the Tecpan River drainage basin in a forearc of the Mexican subduction zone; LVF–plate-boundary subparallel left-lateral strike-slip La Venta Fault produced by oblique Mexican subduction (the angle of obliquity = 12°); black arrow shows the convergence rate (DeMets et al., 2010); red arrows show the left-lateral strike-slip motion along the forearc sliver. Note the correlation between LVF, bend in the geometry of the subducting slab, seamount subduction, and the apparent increment in the incision rates.
It is likely that not one but the three invoked mechanisms, explained above, influence uplift rates and their distribution across and along the forearc. The geometry of the subduction across the Guerrero forearc in the Mexican subduction zone influence has also been observed east of the Tecpan River, along the Papagayo River where an increment in uplift rates has been attributed to changes in the geometry of the subducting plate (Ramírez-Herrera et al., 2018). On the other hand, the La Venta strike-slip faults with dip-slip component triggers slip partitioning and sinistral forearc sliver and the normal regime produced by the bend in the geometry of the subducting slab. This fault system also extends east, beyond the Papagayo River (Ramírez-Herrera et al., 2018). Thus, the two mechanisms seem to be related and both can explain differences in the spatial distribution of uplift rates. Finally, the third mechanism, which apparently causes increments in tectonic uplift rates and might be associated with the subduction of seamounts and roughness of the Cocos plate under this portion of the Guerrero forearc, must probably has a local effect.
Conclusion
We mapped, measured, and OSL dated Holocene fluvial terraces along the Tecpan River and calculated incision rates across the forearc in the Guerrero Seismic Gap of the Mexican subduction zone. Our results show uplift rates between 1.2 and 4.9 mm/yr since the mid-Holocene that generally increase upstream with local deviations. High values of long-term vertical deformation of >3.5 mm/yr coincide with the trace of intraplate W-E left-lateral faults with a small dip-slip component and changes in the geometry of the subducting slab. Apparent increment in rock uplift rates upstream seems to be related with subducting slab bending that produces crust thickening, and normal extensional regime in the upper crust of the overriding plate. High uplift rates in this segment of the Mexican subduction zone may be also associated with the roughness and seamount subduction of the Cocos plate. Values of derived uplift rates during the Holocene in the Guerrero seismic gap corroborate high tectonic activity in this zone, and seismic gaps may have ephemeral features. Rock uplift and spatial variations of uplift rates reflect a response to the geometry, crustal strike-slip faults with dip-slip component, and the rugged seafloor of the oceanic Cocos plate subduction beneath a faulted continental lithosphere. Thus, rivers respond to active tectonics along subduction zones including active surface faults on the continental lithosphere and deeper plate tectonic processes. Additional studies are needed in tectonically active subduction zones that decipher fault and underlying plate controls on complex Earth surface processes.
Data Availability Statement
The original contributions presented in the study are included in the article/Supplementary Material. Further inquiries can be directed to the corresponding author.
Author Contributions
MR-H and KG both are principal authors; they wrote the manuscript, analyzed data, and worked in the field. SF worked on OSL dating, wrote OSL methods sections, and reviewed and revised the manuscript.
Conflict of Interest
The authors declare that the research was conducted in the absence of any commercial or financial relationships that could be construed as a potential conflict of interest.
Acknowledgments
MR-H acknowledges funding provided by UNAM Programa de Apoyo a Proyectos de Investigación e Innovación Tecnológica (PAPIIT) IN109117 and Secretaria de Educación Pública (SEP)-Consejo Nacional de Ciencia y Tecnología (CONACYT) grant 284365. We are grateful to the local community of Tecpan and several communities in the Tecpan drainage for kindly giving us access to work and for help in the field.
Supplementary Material
The Supplementary Material for this article can be found online at: https://www.frontiersin.org/articles/10.3389/feart.2020.573081/full#supplementary-material.
References
Anderson, J. G., Singh, S. K., Espindola, J. M., and Yamamoto, J. (1989). Seismic strain release in the Mexican subduction thrust. Phys. Earth Planet. In. 58, 307–322. doi:10.1016/0031-9201(89)90102-7
Arnold, L. J., and Roberts, R. G. (2009). Stochastic modelling of multi-grain equivalent dose (De) distributions: implications for OSL dating of sediment mixtures. Quat. Geochronol. 4, 204–230. doi:10.1016/j.quageo.2008.12.001
Bekaert, D. P. S., Hooper, A., and Wright, T. J. (2015). Reassessing the 2006 Guerrero slow-slip event, Mexico: implications for large earthquakes in the Guerrero Gap. J. Geophys. Res. Solid Earth. 120 (2), 1357–1375. doi:10.1002/2014jb011557
Berryman, K., Marden, M., Eden, D., Mazengarb, C., Ota, Y., and Moriya, I. (2000). Tectonic and paleoclimatic significance of Quaternary river terraces of the Waipaoa River, east coast, North Island, New Zealand. N. Z. J. Geol. Geophys. 43 (2), 229–245. doi:10.1080/00288306.2000.9514883
Berryman, K., Marden, M., Palmer, A., Wilson, K., Mazengarb, C., and Litchfield, N. (2010). The post-glacial downcutting history in the Waihuka tributary of Waipaoa River, Gisborne district: implications for tectonics and landscape evolution in the Hikurangi subduction margin, New Zealand. Mar. Geol. 270 (1), 55–71. doi:10.1016/j.margeo.2009.10.001
Bonnet, S., Reimann, T., Wallinga, J., Lague, D., Davy, P., and Lacoste, A. (2019). Landscape dynamics revealed by luminescence signals of feldspars from fluvial terraces. Sci. Rep. 9 (1), 8569. doi:10.1038/s41598-019-44533-4
Brocklehurst, S. H., and Whipple, K. X. (2002). Glacial erosion and relief production in the Eastern Sierra Nevada, California. Geomorphology. 42, 1–24. doi:10.1016/s0169-555x(01)00069-1
Bull, W. B. (1978). “Geomorphic tectonic activity classes of the south front of the San Gabriel Mountains, California,” in U.S. Geological survey contract report 14-08-001-G-394, office of earthquakes, volcanoes and engineering. Editors W. N. Melhorn, and R. C. Flemal (Menlo Park, CA: Scientific Research Publishing), 59.
Bull, W. B., and McFadden, L. D. (1977). “Tectonic geomorphology north and south of the Garlock fault, California,” in Geomorphology in arid regions: a proceedings volume of the 8th annual geomorphology symposium, Binghamton, NY, September 23–24, 1977 (London, UK: Allen & Unwin), 115–138.
Burbank, D. W., and Anderson, R. S. (2001). Tectonic geomorphology. Oxford, UK: Blackwell Scientific.
Cerny, J., Ramírez-Herrera, M. T., Soliman García, E., and Ito, Y. (2020). Seafloor morphology along the active margin in Guerrero: earthquake implications. J. S. Am. Earth Sci. 102, 1–31. doi:10.1016/j.jsames.2020.102671
Cox, R. T., Hill, A. A., Larsen, D., Holzer, T., Forman, S. L., Noce, T., et al. (2007). Seismotectonic implications of sand blows in the Southern Mississippi Embayment. Eng. Geol. 89 (3-4), 278–299. doi:10.1016/j.enggeo.2006.11.002
Curray, J. R., Emmel, F. J., and Crampton, P. J. S. (1969). “Holocene history of a strand plain lagoonal coast, Nayarit, Mexico,” in Proceedings, simposio internacional: lagunas costeras, Mexico city, Mexico, 28–30 November 1967, (Mexico City, Mexico: UNAM-UNESCO), 63–100.
de Quay, G. S., Roberts, G. G., Rood, D. H., and Fernandes, V. M. (2019). Holocene uplift and rapid fluvial erosion of Iceland: a record of post-glacial landscape evolution. Earth Planet Sci. Lett. 505, 118–130. doi:10.1016/j.epsl.2018.10.026
DeMets, C., Gordon, R. G., and Argus, D. F. (2010). Geologically current plate motions. Geophys. J. Int. 181, 1–80. doi:10.1111/j.1365-246x.2009.04491.x
Dominguez, S., Lallemand, S. E., Malavieille, J., and von Huene, R. (1998). Upper plate deformation associated with seamount subduction. Tectonophysics. 293, 207–224. doi:10.1016/s0040-1951(98)00086-9
Durcan, J. A., and Duller, G. A. T. (2011). The fast ratio: a rapid measure for testing the dominance of the fast component in the initial OSL signal from quartz. Radiat. Meas. 46, 1065–1072. doi:10.1016/j.radmeas.2011.07.016
Evenstar, L. A., Mather, A. E., and Hartley, A. J. (2020). Using spatial patterns of fluvial incision to constrain continental-scale uplift in the Andes. Global Planet. Change 186, 103119. doi:10.1016/j.gloplacha.2020.103119
Fain, J., Soumana, S., Montret, M., Miallier, D., Pilleyre, T., and Sanzelle, S. (1999). Luminescence and ESR dating Beta-dose attenuation for various grain shapes calculated by a Monte-Carlo method. Quat. Sci. Rev. 18, 231–234. doi:10.1016/s0277-3791(98)00056-0
Farías, M., Charrier, R., Comte, D., Martinod, J., and Hérail, G. (2005). Late Cenozoic deformation and uplift of the western flank of the Altiplano: evidence from the depositional, tectonic, and geomorphologic evolution and shallow seismic activity (northern Chile at 19°30′S). Tectonics. 24 (4), TC4001. doi:10.1029/2004tc001667
Fasola, S. L., Brudzinski, M. R., Holtkamp, S. G., Graham, S. E., and Cabral-Cano, E. (2019). Earthquake swarms and slow slip on a sliver fault in the Mexican subduction zone. Proc. Natl. Acad. Sci. U.S.A. 116 (15), 7198–7206. doi:10.1073/pnas.1814205116
Fisher, D. M., Gardner, T. W., Marshall, J. S., Sak, P. B., and Protti, M. (1998). Effect of subducting seafloor roughness on fore‐arc kinematics, Pacific coast, Costa Rica. Geology 26 (6), 467–470. doi:10.1130/0091-7613(1998)026<0467:eossfr>2.3.co;2
Forman, S. L., Tripaldi, A., and Ciccioli, P. L. (2014). Eolian sand sheet deposition in the San Luis paleodune field, western Argentina as an indicator of a semi-arid environment through the Holocene. Palaeogeogr. Palaeoclimatol. Palaeoecol. 411, 122–135. doi:10.1016/j.palaeo.2014.05.038
Forman, S. (2015). “Luminescence dating in paleoseismology,” in Encyclopedia of earthquake engineering. Editors M. Beer, I. A. Kougioumtzoglou, E. Patelli, and I. S.-K. Au (Heidelberg, Germany: Springer Berlin Heidelberg), 1371–1378..
Gaidzik, K., and Ramírez-Herrera, M. T. (2017). Geomorphic indices and relative tectonic uplift in the Guerrero sector of the Mexican forearc. Geosci. Front. 8 (4), 885–902. doi:10.1016/j.gsf.2016.07.006
Gaidzik, K., Ramírez-Herrera, M. T., and Kostoglodov, V. (2016). Active crustal faults in the forearc region, Guerrero sector of the Mexican subduction zone. Pure Appl. Geophys. 173, 3419–3443. doi:10.1007/s00024-015-1213-8
Galbraith, R. F., Roberts, R. G., Laslett, G. M., Yoshida, H., and Olley, J. M. (1999). Optical dating of single and multiple grains of quartz from jinmium rock shelter, northern Australia: part I, experimental design and statistical models. Archaeometry. 41, 339–364. doi:10.1111/j.1475-4754.1999.tb00987.x
Galbraith, R. F., and Roberts, R. G. (2012). Statistical aspects of equivalent dose and error calculation and display in OSL dating: an overview and some recommendations. Quat. Geochronol. 11, 1–27. doi:10.1016/j.quageo.2012.04.020
Gallen, S. F., Pazzaglia, F. J., Wegmann, K. W., Pederson, J. L., and Gardner, T. W. (2015). The dynamic reference frame of rivers and apparent transience in incision rates. Geology. 43 (7), 623–626. doi:10.1130/g36692.1
Gao, H., Li, Z., Pan, B., Liu, F., and Liu, X. (2016). Fluvial responses to late Quaternary climate change in the Shiyang River drainage system, western China. Geomorphology. 258, 82–94. doi:10.1016/j.geomorph.2016.01.018
García-Palomo, A., Macías, J. L., and Espíndola, J. M. (2004). Strike-slip faults and K-alkaline volcanism at El Chichón volcano, southeastern Mexico. J. Volcanol. Geoth. Res. 136, 247–268. doi:10.1016/j.jvolgeores.2004.04.001
Giaconia, F., Booth-Rea, G., Martínez-Martínez, J. M., Azañón, J. M., Pérez-Peña, J. V., Pérez-Romero, J., et al. (2012). Geomorphic evidence of active tectonics in the Sierra Alhamilla (eastern Betics, SE Spain). Geomorphology. 145-146, 90–106. doi:10.1016/j.geomorph.2011.12.043
González-Alfaro, J., Vargas, G., Ortlieb, L., González, G., Ruiz, S., Báez, J. C., et al. (2018). Abrupt increase in the coastal uplift and earthquake rate since ∼40 ka at the northern Chile seismic gap in the Central Andes. Earth Planet Sci. Lett. 502, 32–45. doi:10.1016/j.epsl.2018.08.043
Graham, S., DeMets, C., Cabral-Cano, E., Kostoglodov, V., Rousset, B., Walpersdorf, A., et al. (2015). Slow slip history for the Mexico subduction zone: 2005 through 2011. Pure Appl. Geophys. 173, 3445–3465. doi:10.1007/s00024-015-1211-x10.1007/s00024-015-1211-x
Guerin, G., Mercier, N., and Adamiec, G. (2011). Dose-rate conversion factors: update. Ancient TL. 29 (1), 5–8.
Hack, J. T. (1973). Stream-profile analysis and stream-gradient index. J. Res. U. S. Geol. Surv. 1, 421–429
Hampel, A., Kukowski, N., Bialas, J., Huebscher, C., and Heinbockel, R. (2004). Ridge subduction at an erosive margin: the collision zone of the Nazca Ridge in southern Peru. J. Geophys. Res. 109, B02101. doi:10.1029/2003JB002593
Hovius, N. (2000). “Macroscale process systems of mountain belt erosion,” in Geomorphology and global tectonics. Editor M. A. Summerfield (Chichester, United Kingdom: Wiley and Sons), 77–105.
Kazachkina, E., Kostoglodov, V., Cotte, N., Walpersdorf, A., Ramirez-Herrera, M. T., Gaidzik, K., et al. (2020). Active 650-km long fault system and Xolapa sliver in southern Mexico. Front. Earth Sci. 8, 155. doi:10.3389/feart.2020.00155
Keller, E. A. (1986). “Investigation of active tectonics: use of surficial earth processes,” in Active tectonics. Editor R. E. Wallace (Washington, United States: National Academy Press), 136–147.
Keller, E. A., and Pinter, N. (2002). Active tectonics: earthquakes, uplift, and landscape. 2nd Edn. Upper Saddle River, NJ: Prentice-Hall.
Kim, Y., Clayton, R. W., and Jackson, J. M. (2010). Geometry and seismic properties of the subducting Cocos plate in central Mexico. J. Geophys. Res. 115, B06310. doi:10.1029/2009jb006942
Kirby, E., and Whipple, K. (2001). Quantifying differential rock-uplift rates via stream profile analysis. Geol. 29 (5), 415–418. doi:10.1130/0091-7613(2001)029<0415:qdrurv>2.0.co;2
Kirby, E., and Whipple, K. X. (2012). Expression of active tectonics in erosional landscapes. J. Struct. Geol. 44, 54–75. doi:10.1016/j.jsg.2012.07.009
Kostoglodov, V., Bandy, W., Domínguez, J., and Mena, M. (1996). Gravity and seismicity over the Guerrero seismic gap, Mexico. Geophys. Res. Lett. 23, 3385–3388. doi:10.1029/96gl03159
Kostoglodov, V., Husker, A., Santiago, J. A., Cotte, N., and Walpersdorf, A. (2015). “GPS data reveal large subduction thrust and strike slip fault slow slip events concurrently happening in Guerrero, Mexico,” in Proceedings, reunión anual de la unión geofísica Mexicana, Puerto vallarta, Mexico, November 2–7, 2015, 171.
Kostoglodov, V., Husker, A., Shapiro, N. M., Payero, J. S., Campillo, M., Cotte, N., et al. (2010). The 2006 slow slip event and nonvolcanic tremor in the Mexican subduction zone. Geophys. Res. Lett. 37, L24301. doi:10.1029/2010gl045424
Kostoglodov, V., and Ponce, L. (1994). Relationship between subduction and seismicity in the Mexican part of the Middle America Trench. J. Geophys. Res. 99, 729–742. doi:10.1029/93jb01556
Kostoglodov, V., Singh, S. K., Santiago, J. A., Franco, S. I., Larson, K. M., Lowry, A. R., et al. (2003). A large silent earthquake in the Guerrero seismic gap, Mexico. Geophys. Res. Lett. 30, 1807. doi:10.1029/2003gl017219
Lambeck, K., Antonioli, F., Purcell, A., and Silenzi, S. (2004). Sea-level change along the Italian coast for the past 10,000 yr. Quat. Sci. Rev. 23 (14–15), 1567–1598. doi:10.1016/j.quascirev.2004.02.009
Lavé, J., and Avouac, J. P. (2000). Active folding of fluvial terraces across the Siwaliks Hills, himalayas of central Nepal. J. Geophys. Res. 105 (B3), 5735–5770. doi:10.1029/1999jb900292
Le Béon, M., Tseng, Y.-C., Klinger, Y., Elias, A., Kunz, A., SursockDaeron, A. M., et al. (2018). High-resolution stratigraphy and multiple luminescence dating techniques to reveal the paleoseismic history of the central Dead Sea fault (Yammouneh fault, Lebanon). Tectonophysics. 738-739, 1–15. doi:10.1016/j.tecto.2018.04.009
Lowry, A. R., Larson, K. M., Kostoglodov, V., and Sanchez, O. (2003). The fault slip budget in Guerrero, southern Mexico. Geophys. J. Int. 200,Available at: http://aconcagua.geol.usu.edu/∼arlowry/Papers/Budget.pdf.
Manea, V. C., Manea, M., Kostoglodov, V., Currie, C. A., and Sewell, G. (2004). Thermal structure, coupling and metamorphism in the Mexican subduction zone beneath Guerrero. Geophys. J. Int. 158, 775–784. doi:10.1111/j.1365-246x.2004.02325.x
Marshall, J. S., LaFromboise, E. J., Gardner, T. W., and Protti, M. (2007). Segmented forearc deformation along the Nicoya Peninsula seismic gap, Costa Rica. Eos, Trans. Am. Geophys. Union. 88, T53A–T1121
Matsu'ura, T., Furusawa, A., and Saomoto, H. (2008). Late quaternary uplift rate of the northeastern Japan arc inferred from fluvial terraces. Geomorphology. 95 (3-4), 384–397. doi:10.1016/j.geomorph.2007.06.011
Matsu'ura, T., Furusawa, A., and Saomoto, H. (2009). Long-term and short-term vertical velocity profiles across the forearc in the NE Japan subduction zone. Quat. res. 71 (2), 227–238. doi:10.1016/j.yqres.2008.12.005
Mejdahl, V., and Christiansen, H. H. (1994). Procedures used for luminescence dating of sediments. Quat. Sci. Rev. 13, 403–406. doi:10.1016/0277-3791(94)90049-3
Melgar, D., Pérez-Campos, X., Ramirez-Guzman, L., Spica, Z., Espíndola, V. H., Hammond, W. C., et al. (2018a). Bend faulting at the edge of a flat slab: the 2017 M w 7.1 puebla-morelos, Mexico earthquake. Geophys. Res. Lett. 45 (6), 2633–2641. doi:10.1002/2017gl076895
Melgar, D., Ruiz-Angulo, A., Garcia, E. S., Manea, M., Manea, V. C., Xu, X., et al. (2018b). Deep embrittlement and complete rupture of the lithosphere during the Mw 8.2 Tehuantepec earthquake. Nat. Geosci. 11, 955–960. doi:10.1038/s41561-018-0229-y
Merritts, D. J., Vincent, K. R., and Wohl, E. E. (1994). Long river profiles, tectonism, and eustasy: a guide to interpreting fluvial terraces. J. Geophys. Res. 99 (14), 031–050. doi:10.1029/94jb00857
Mochizuki, K., Yamada, T., Shinohara, M., Yamanaka, Y., and Kanazawa, T. (2008). Weak interplate coupling by seamounts and repeating M∼ 7 earthquakes.. Science. 321 (5893), 1194–1197. doi:10.1126/science.1160250
Morell, K. D. (2016). Seamount, ridge, and transform subduction in southern Central America. Tectonics. 35, 357–385. doi:10.1002/2015TC003950
Murray, A. S., and Wintle, A. G. (2003). The single aliquot regenerative dose protocol: Potential for improvements in reliability. Radiation Measurements. 37, 377–381. doi:10.1016/S1350-4487(03)00053-2
Pacheco, J. F., Iglesias, A., and Singh, S. K. (2002). The 8 October Coyuca, Guerrero, Mexico earthquake (Mw 5.9): a normal fault in the expected compressional environment. Seismol Res. Lett. 73 (2), 263.
Pacheco, J. F., and Singh, S. K. (2010). Seismicity and state of stress in Guerrero segment of the Mexican subduction zone. J. Geophys. Res. 115, B01303. doi:10.1029/2009jb006453
Pardo, M., and Suárez, G. (1995). Shape of the subducted Rivera and Cocos plates in southern Mexico: seismic and tectonic implications. J. Geophys. Res. 100 (12), 357–373. doi:10.1029/95jb00919
Pazzaglia, F. J., and Brandon, M. T. (2001). A fluvial record of long-term steady-state uplift and erosion across the Cascadia forearc high, western Washington State. Am. J. Sci. 301, 385–431. doi:10.2475/ajs.301.4-5.385
Pazzaglia, F. J. (2013). “Fluvial terraces,” in Treatise on geomorphology volume 9: fluvial geomorphology. Editor J. F. Shroder (San Diego, CA: Academic Press), 379–412. doi:10.1016/B978-0-12-374739-6.00248-7
Peltier, W. R., Argus, D. F., and Drummond, R. (2015). Space geodesy constrains ice age terminal deglaciation: the global ICE-6G_C (VM5a) model. J. Geophys. Res. Solid Earth. 120, 450–487. doi:10.1002/2014jb011176
Peltier, W. R. (2004). Global glacial isostasy and the surface of the ice-age Earth: the ICE-5G (VM2) model and GRACE. Annu. Rev. Earth Planet Sci. 32, 111–149. doi:10.1146/annurev.earth.32.082503.144359
Peng, L., and Forman, S. L. (2019). LDAC: an excel-based program for luminescence equivalent dose and burial age calculations. Ancient TL. 37 (2), 21–40.
Pérez-Campos, X., Kim, Y., Husker, A., Davis, P. M., Clayton, R. W., Iglesias, A., et al. (2008). Horizontal subduction and truncation of the Cocos plate beneath central Mexico. Geophys. Res. Lett. 35, L18303. doi:10.1029/2008gl035127
Personius, S. F. (1995). Late Quaternary stream incision and uplift in the forearc of the Cascadia subduction zone, western Oregon. J. Geophys. Res. 100 (B10), 20193–20210. doi:10.1029/95jb01684
Prescott, J. R., and Hutton, J. T. (1994). Cosmic ray contributions to dose rates for luminescence and ESR dating: large depths and long-term time variations. Radiat. Meas. 23, 497–500. doi:10.1016/1350-4487(94)90086-8
Radiguet, M., Cotton, F., Vergnolle, M., Campillo, M., Walpersdorf, A., Cotte, N., et al. (2012). Slow slip events and strain accumulation in the Guerrero gap, Mexico. J. Geophys. Res. 117, B04305. doi:10.1029/2011jb008801
Ramírez-Herrera, M. T., Cundy, A., Kostoglodov, V., Carranza-Edwards, A., Morales, E., and Metcalfe, S. (2007). Sedimentary record of late-Holocene relative sea-level change and tectonic deformation from the Guerrero Seismic Gap, Mexican Pacific Coast. Holocene. 17, 1211–1220. doi:10.1177/0959683607085127
Ramírez-Herrera, M. T., Cundy, A., Kostoglodov, V., and Ortiz, M. (2009). Late Holocene tectonic land-level changes and tsunamis at Mitla lagoon, Guerrero, Mexico. Geofisc. Int. 48, 195–209.
Ramírez-Herrera, M. T., Gaidzik, K., Forman, S., Kostoglodov, V., Bürgmann, R., and Johnson, C. W. (2018). Relating the long-term and short-term vertical deformation across a transect of the forearc in the central Mexican subduction zone. Geosphere. 14 (2), 419–439. doi:10.1130/ges01446.1
Ramírez-Herrera, M. T., and Gaidzik, K. (2017). La Pintada landslide—a complex double-staged extreme event, Guerrero, Mexico. Cogent Geoscience. 3 (1), 1356012. doi:10.1080/23312041.2017.1356012
Ramírez-Herrera, M. T., Kostoglodov, V., and Urrutia-Fucugauchi, J. (2011). Overview of recent coastal tectonic deformation in the Mexican subduction zone. Pure Appl. Geophys. 168, 1415–1433. doi:10.1007/s00024-010-0205-y
Ramírez-Herrera, M. T., and Urrutia-Fucugauchi, J. (1999). Morphotectonic zones along the coast of the Pacific continental margin, southern Mexico. Geomorphology. 28, 237–250. doi:10.1016/S0169-555X(99)00016-1
Repka, J. L., Anderson, R. S., and Finkel, R. C. (1997). Cosmogenic dating of fluvial terraces, Fremont River, Utah. Earth Planet Sci. Lett. 152 (1–4), 59–73. doi:10.1016/s0012-821x(97)00149-0
Robertson, J., Meschis, M., Roberts, G. P., Ganas, A., and Gheorghiu, D. M. (2019). Temporally constant quaternary uplift rates and their relationship with extensional upper-plate faults in south crete (Greece), constrained with 36 Cl cosmogenic exposure dating. Tectonics. 38 (4), 1189–1222. doi:10.1029/2018tc005410
Rosgen, D. L. (1994). A classification of natural rivers. Catena 22 (3), 169–199. doi:10.1016/0341-8162(94)90001-9
Schaller, M., Ehlers, T. A., Stor, T., Torrent, J., Lobato, L., Christl, M., et al. (2016). Timing of European fluvial terrace formation and incision rates constrained by cosmogenic nuclide dating. Earth Planet Sci. Lett 451, 221–231. doi:10.1016/j.epsl.2016.07.022
Scholz, C. H., and Small, C. (1997). The effect of seamount subduction on seismic coupling. Geology 25 (6), 487–490. doi:10.1130/0091-7613(1997)025<0487:teosso>2.3.co;2
Singh, S. K., and Mortera, F. (1991). Source time functions of large Mexican subduction earthquakes, morphology of the Benioff zone, age of the plate, and their tectonic implications. J. Geophys. Res 96 (B13), 21487–21502. doi:10.1029/91jb02047
Sirkin, L. (1985). Late quaternary stratigraphy and environments of the west Mexican coastal plain. Palynology 9, 3–25. doi:10.1080/01916122.1985.9989285
Su, Q., Kirby, E., Ren, Z., Zhang, P., Zhang, H., Manopkawee, P., et al. (2020). Chronology of the yellow river terraces at qingtong gorge (NE tibet): insights into evolution of the yellow river since the Middle pleistocene. Geomorphology 349, 106889. doi:10.1016/j.geomorph.2019.106889
Suárez, G., Monfret, T., Wittlinger, G., and David, C. (1990). Geometry of subduction and depth of the seismogenic zone in the Guerrero gap, Mexico. Nature 345, 336–338. doi:10.1038/345336a0
Tuttle, M. P., Wolf, L. W., Starr, M. E., Villamor, P., Lafferty, R. H., Morrow, J. E., et al. (2019). Evidence for large new madrid earthquakes about A.D. 0 and 1050 B.C., Central United States. Seismol Res. Lett 90 (3), 1393–1406. doi:10.1785/0220180371
Wallace, L. M., Ellis, S., Miyao, K., Miura, S., Beavan, J., and Goto, J. (2009). Enigmatic, highly active left-lateral shear zone in southwest Japan explained by aseismic ridge collision. Geology. 37 (2), 143–146. doi:10.1130/G25221A.1
Wegmann, K. W., and Pazzaglia, F. J. (2002). Holocene strath terraces, climate change, and active tectonics: the Clearwater River basin, Olympic Peninsula, Washington State. Geol. Soc. Am. Bull. 114, 731–744. doi:10.1130/0016-7606(2002)114<0731:HSTCCA>2.0.CO;2
Wegmann, K. W., and Pazzaglia, F. J. (2009). Late Quaternary fluvial terraces of the Romagna and Marche Apennines, Italy: climatic, lithologic, and tectonic controls on terrace genesis in an active orogen. Quat. Sci. Rev. 28 (1-2), 137–165. doi:10.1016/j.quascirev.2008.10.006
Wells, S. G., Bullard, T. F., Menges, C. M., Drake, P. G., Karas, P. A., Kelson, K. I., et al. (1988). Regional variations in tectonic geomorphology along a segmented convergent plate boundary pacific coast of Costa Rica. Geomorphology 1, 239–265. doi:10.1016/0169-555x(88)90016-5
Wintle, A. G., and Murray, A. S. (2006). A review of quartz optically stimulated luminescence characteristics and their relevance in single-aliquot regeneration dating protocols. Radiat. Meas. 41, 369–391. doi:10.1016/j.radmeas.2005.11.001
Wright, D. K., Forman, S. L., Waters, M. R., and Ravesloot, J. C. (2011). Holocene eolian activation as a proxy for broad-scale landscape change on the Gila River Indian Community, Arizona. Quat. Res. 76 (1), 10–21. doi:10.1016/j.yqres.2011.04.008
Wu, D., Li, B., Lu, H., Zhao, J., Zheng, X., and Li, Y. (2020). Spatial variations of river incision rate in the northern Chinese Tian Shan range derived from late Quaternary fluvial terraces. Global Planet. Change. 185, 103082. doi:10.1016/j.gloplacha.2019.103082
Keywords: strath terrace, Holocene uplift rates, forearc deformation, faulted continental lithosphere, subducting slab characteristics
Citation: Ramírez-Herrera MT, Gaidzik K and Forman SL (2021) Spatial Variations of Tectonic Uplift - Subducting Plate Effects on the Guerrero Forearc, Mexico. Front. Earth Sci. 8:573081. doi: 10.3389/feart.2020.573081
Received: 16 June 2020; Accepted: 09 November 2020;
Published: 22 January 2021.
Edited by:
Davide Tiranti, Agenzia Regionale per la Protezione Ambientale (ARPA), ItalyReviewed by:
Valerio Acocella, Roma Tre University, ItalyFabio Matano, National Research Council (CNR), Italy
Copyright © 2021 Ramirez‐Herrera, Gaidzik and Forman.. This is an open-access article distributed under the terms of the Creative Commons Attribution License (CC BY). The use, distribution or reproduction in other forums is permitted, provided the original author(s) and the copyright owner(s) are credited and that the original publication in this journal is cited, in accordance with accepted academic practice. No use, distribution or reproduction is permitted which does not comply with these terms.
*Correspondence: María Teresa Ramírez-Herrera, dHJhbWlyZXpAaWdnLnVuYW0ubXg=