 Jorge Leandro
 Shane Cunneff
 Lorenz Viernstein2
- 1Department of Civil, Geo and Environmental Engineering, Technical University of Munich, Munich, Germany
- 2Department of Electrical and Computer Engineering, Technical University of Munich, Munich, Germany
Of many defining characteristics for a flood resilient city and its infrastructure networks, mitigating flooding impacts and recovering quickly to a pre-flood state are to be considered of high importance. With a likely increase in the frequency and intensity of future heavy precipitation and flooding events in Europe, the vulnerability of the electrical distribution network of Maxvorstadt, Munich will also increase. These facts justify the need for quantifying how the electrical distribution network would respond to flooding, and more so, how stakeholders can better prepare for such an event. For a synthetic electrical distribution network of Maxvorstadt, the timing and location of network components failure due to flooding and affected persons without power have been computed for a combination of realistic future flooding events via the Electrical Network Flood Resilience Model developed in this study. It has been learned that most buildings, and therefore their inhabitants, lose power due to the failure of a specific component, Medium Voltage—Low Voltage transformer buses, and that flood risk solutions should focus on protecting network components from inundation to ensure its functionality through flooding events. Solutions like dry proofing such components before severe flooding occurs is recommended for several neighborhoods analyzed in this study.
Introduction
In the modern world as societies grow more complex, citizens become more demanding of cities being able to deliver high-quality and sustained continuity of the services provided. Sundnes (2014) define water, energy, and communication as part of the Basic Societal Functions (BSF) to be provided to people in modern cities. These functions are fulfilled through the establishment and maintenance of various infrastructure networks, a key trait of smart-cities worldwide (Haidini et al., 1989). Urban areas, like Munich for example, use infrastructure networks in order meet the BSF, through transporting fresh water, ensuring traffic flow management, and distribution of electricity, to name a few. These working civil infrastructures are central parts of modern society, playing an integral role in the vitality of social and economic well-being (Pant et al., 2018). A civil infrastructure can be categorized as “critical” if its failure causes severe economic and societal disruption (Great Britain. Cabinet Office, 2010). In this study, electrical distribution networks (EDN) are the critical urban infrastructure network of foremost consideration that will be investigated.
As concluded by the Intergovernmental Panel on Climate Change (IPCC) in their Synthesis Report of 2014, an effect of a warming atmosphere is the increase in the rate of evaporation leading to a higher moisture content and higher water-holding capacity of atmospheric air (IPCC, 2014). The frequency and intensity of heavy precipitation events has thus seen an increase in Europe. With medium confidence an increase in these extreme precipitation events implies much greater risks of flooding (IPCC, 2014). Furthermore, it is stated with high confidence that the risk of severe ill-health and disruption of livelihoods due to inland flooding in urban regions will be one of many future challenges that society must cope with. As the probability of an extreme flooding event in urban environments increases, the expected flood damages worldwide also trend upwards. This can be attributed to factors such as economic growth, urbanization, and land-use change, leading to the concentration of people and wealth into areas of high flood risk (Whitfield, 2012).
With tools and information developed to quantify the risk of flooding in urban areas, a next step has been taken towards understanding how a region is resilient to flooding. Flood resilience has been defined in reference to flood risk management, as “the ease with which a system recovers from flooding” (de Bruijn, 2004). The Authors state that the system must be hindered by flooding, i.e. temporary disruption followed by a rebounding performance, in order to claim the system can be characterized as resilient. Elaborating upon this definition and in the context of urban flooding, the United Nations defines resilience as “the ability of a system, community or society exposed to hazards to resist, absorb, accommodate, adapt to, transform and recover from the effects of a hazard in a timely and efficient manner, including through the preservation and restoration of its essential basic structures and functions through risk management” (United Nations, 2011). Within the same context, an idea of resilience that addresses the maintenance of social wellbeing through a flooding event was explored in the Zurich Flood Resilience Alliance developed Community Flood Resilience Measurement Framework. In this framework flood resilience is described as “the ability of a system, community, or society to pursue its social, ecological, and economic development and growth objectives, while managing its flood risk over time in a mutually reinforcing way” (Campbell et al., 2017).
A cities overall flood resilience can be quantified through the aggregation of different resilience indicators. Chen & Leandro (2019) developed a time variable Flood Resilience Index (FRI) for quantifying the resilience of a household to flooding by considering three dimensions (economic, social and physical) made of nine indicators. Leandro et al. (2020) later applied the FRI for measuring climate change adaptation and showed that it can be scaled from household to district or borough. Perfrement & Lloyd (2016) have created a flood resilience index following this principle by considering four dimensions in which a flood resilience indicator can be categorized in: natural, social, built and economic. An electrical distribution networks (EDN) resilience during flooding and the resulting monetary losses can therefore be classified as an economic resilience indicator for the cities overall flood resilience index. It is important to not only consider a cities direct loss due to a failing urban infrastructure network, but also any indirect losses generated from business’s inability to continue operating (Tierney, 2007). Each resilience indicator, for example the economic component, can be measured at a point in time, assigned a proportionated weight factor and then be aggregated into the overall flood resilience index, as presented by Perfrement and Lloyd (2016). Bollinger and Dijkema (2016) defined resilience of the EDN as the mean fraction of demand served across the range of possible extreme event magnitudes.
Urban communities’ ability to respond to flooding, as well as their flood resilience, are both improved by implementing actions and measures at each step of flood risk management cycle (Batica and Gourbesville, 2014). While Earthquake induced failure and soil liquefaction have been identified as one of the main causes of damage to buried electric infrastructure (Karagianiis et al., 2017) (Kwasinski et al., 2014), a field of study that has received little attention in past flood risk analysis is quantifying the risks to critical infrastructure and the modeling of network characteristics during flooding (McIntyre et al., 2012). The studies that have been completed on this specified topic have attempted to quantify failing infrastructure networks by estimating the probability a flood would cause disruption using regional flood risk footprints. The footprints represent the risk of flooding and categories of likelihood that an infrastructure network or its components would fail (Pant et al., 2018).
There are nonetheless a few studies dealing with the assessment of resilience of the EDN. Tofani et al., 2019 focuses on one specific attribute of resilience, namely, the readiness. The authors investigated how a EDN can better recover its service functionality after a crisis event by managing and deploying the available resources rapidly and effectively. Fekete (2019) develops a concept for integrating aspects of disaster risk, hazard, vulnerability and resilience with critical infrastructure analytic components such as redundancy, rapidity or resourcefulness. The authors highlight the importance of the electrical network as a major basic need of modern societies next to water services, transportation and information. Bollinger and Dijkema (2016) investigated the resilience of the EDN to flood and heat waves. The former was based on a ready flood map of maximum flood extent; hence it did not capture the time evolution of a real flood event. In addition, the authors assumed that the impact of different flood magnitudes was represented by an increase in the number of substations that failed until the maximum was reached. de Bruijn et al. (2019) showed how shared insights among different sectors and stakeholders about critical infrastructure (including power supply) resilience and potential resilience-enhancing measures can be used to quantify resilience.
However, the modeling of time-variable flooding effects on an electrical distribution network through time series flood simulation outputs, and assessment of the END resilience remains a task that has not yet been completed. This study aims to assess flood impacts on electrical distribution networks, an infrastructure system that is highly sensitive to flooding and whose recovery time, and therefore resilience, is worsened with more severe flooding (Karagiannis et al., 2017).
Study Area and Data
In the center of Munich, Germany lies a 429 km2 borough called Maxvorstadt, where 53,443 residents inhabit (Munchen, 2018). This district comprises various types of business, public services, educational institutions and cultural attractions, all of which bring in upwards of 4 times the number of residents that live there into the municipality during the daytime (Munchen, 2018). Maxvorstadt contains nine neighborhoods and 5,533 buildings, which can be seen in Figure 1A and studied in (Chen et al., 2018). The average household size in Munich as of June 2015 is 1.78 persons (Hanke, 2014), a statistic that will be used to dimension the electrical distribution network.
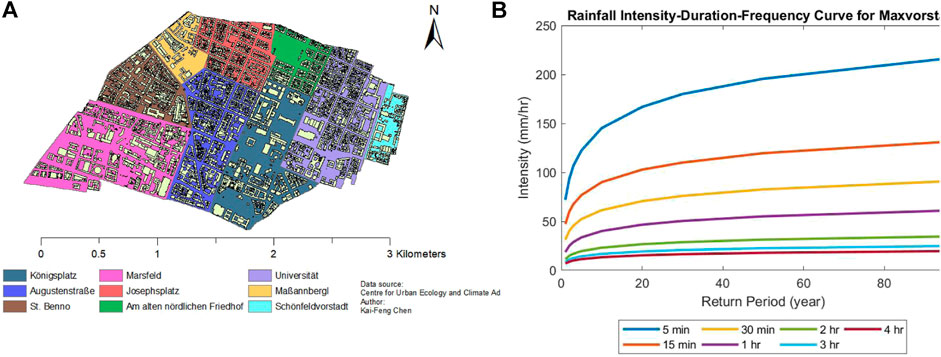
FIGURE 1. (A) Location of the nine districts and buildings within Maxvorstadt, (B) Rainfall Intensity Duration Frequency curve of Maxvorstadt. Data retrieved from KOSTRA-DWD-2010R database (Grid No. 92049) containing information from 1951 to 2010, (Chen et al., 2018).
The flooding events considered for the resilience modeling of the EDN of Maxvorstadt are pluvial in nature. For estimating the rainfall events with different return periods, the data sets provided by the German Meteorological Office are used. These data sets include rainfall intensity values as a function of return period and rainfall duration, referred to as “Koordinierte Starkniederschlagsregionalisierung und -auswertung des Deutscher Wetterdienst,” or KOSTRA-DWD for short (Junghänel et al., 2017). The most recent iteration of these rainfall intensity values, titled KOSTRA-DWD-2010R, include 15-min duration rainfall events for various return periods corresponding to data collected between 1951 and 2010. Of specific focus has been the data for grid number 92049 that Maxvorstadt lies in, and whose duration frequency graph can be seen in Figure 1B.
Methods
The methodology is split into four steps. In the first step the outdoor and indoor 2D flood modeling is performed. This is necessary in order to estimate the impact on the outdoor and indoor components of the EDN. In the second step the EDN is established. This step includes the layout of the EDN including components and its hierarchical structure. The latter enables in the third step to identify the different possible failure criteria of each component of the EDN. The final step is the estimation of the time variable network flood resilience during the event phase.
Flood Modeling
Outdoor 2D Flood Modeling
The first step in modeling the network flood resilience of Maxvorstadts EDN is quantifying the flood hazard that would cause failure of outdoor network components. In the case of flood resilience, the hazard of interest is outdoor inundation, specifically due to high intensity rainfall events. Once rainfall has saturated the ground to the point where excess water cannot be further absorbed,pluvial flooding occurs. Outdoor inundation in this study is to be observed as pluvial and has been simulated using the 2-D Parallel Diffusive Wave Model (P-DWave) (Leandro et al., 2014). P-DWave has been applied/validated against other shallow water equation models in urban areas in the United Kingdom (Martins et al., 2017) and in Germany (Leandro et al., 2016; Pflugbeil et al., 2019). The 2-D shallow water equations this diffusive wave model uses are the continuity Eq. 1, the momentum Eq. 2, and Manning’s formula (3), where h is water depth,
The flooding model along with the duration of this study’s flood resilience analysis last 1h, beginning with a 15min 100-years return period rainfall event. Rainfall intensity values for the 15-min duration event following the current climate scenario were provided as an input to P–DWave. The spatial domain is defined by a Digital Elevation Model (DEM) of Maxvorstadt with a 4 m × 4m gridded structure. Outputs from P–DWave follow the same gridded structure that the DEM has and consists of physical parameters including water depths and x-and-y water velocities. These are the typical outputs from shallow water models.
Indoor Water Depth Modeling
Network functionality depends on both outdoor and indoor electrical components, and therefore modeling of indoor water depth is needed. In addition to observing outdoor inundation (Chen et al., 2018) has developed a model that calculates indoor flooding as a function of outdoor water depth. Inflowing water and resulting indoor water depth can be computed using formulas derived from fluid mechanics. Equation 4 describes the free discharge of water into a building when outdoor water depth is greater than indoor water depth. The second Eq. 5 depicts flow of water into a building when outdoor water depth is equal to indoor water depth.
Electrical Distribution Network Layout
Representation of Electrical Distribution Network Demand
In this study, network flood resilience (NFR) is defined as the ratio of buildings with power to the total number of buildings in a city. Hence the NFR allows measuring how a EDN of a city can withstand a flooding during the event phase. For a NFR to be calculated, an electrical distribution network must be established. As the layout of a city’s critical infrastructure like an EDN is highly sensitive information, it is a task of this study to generate a synthetic distribution network. Generally, the geographical extent of infrastructure networks follows patterns of human development, and any impact to such infrastructure should be quantified in terms of the number of affected customers to which utility is provided (Pant et al., 2018). The creation and representation of Maxvorstadts EDN in this study follow these suggestions. In particular, the guidelines used in designing the EDN follow the recommendations made in Pant et al. (2018) regarding how the layout of the network should follow a 2-D Cartesian Coordinate system. The designed networks coordinate system matches the regional projected coordinate system DHDN_3_Degree_Gauss_Zone_4 assigned to the DEM and used in the flood model (P-DWave). In addition, the customer demands of the infrastructure network should be represented by source, intermediate, and sink nodes. Source nodes act as resources. These are grid connection points which feed electricity into the study area from the surrounding high voltage grid (110 kV). Within the study area of this research, a medium voltage (MV) power station is the single source node connected to the numerous intermediate nodes. Intermediate nodes function to disseminate electricity from a source node to the sink nodes, which are medium voltage to low voltage (MVLV) transformers and distribution buses of Maxvorstadts EDN. Along with the location of sink nodes, customer demand, or more easily understood average household electrical consumption, population size, and electrical limitations all determine the density and location of intermediate nodes. Average household electrical consumption is derived from population and usage statistics. An average household electrical consumption is measured as a fraction of the available power that a customer may connect to. The available power, known as peak power, is sized and selected by a distribution system operator (DSO). For this study, the city’s public works, Stadtwerke München, provides available power connection points starting at 30 kW (München, 2019), which is in line with typical standard parameters in Germany. This study has used a clustering process to determine the coordinate locations of the synthetic MVLV distribution buses. In the scope of this study, sink nodes refer to the buildings in which people live and are to be considered the first connection customers have to the network. The footprint of a sink node is simply the location of a building in the coordinate system and is a preexisting feature of the study area. A schematic representation of what has been explained above can be seen in Figure 2.
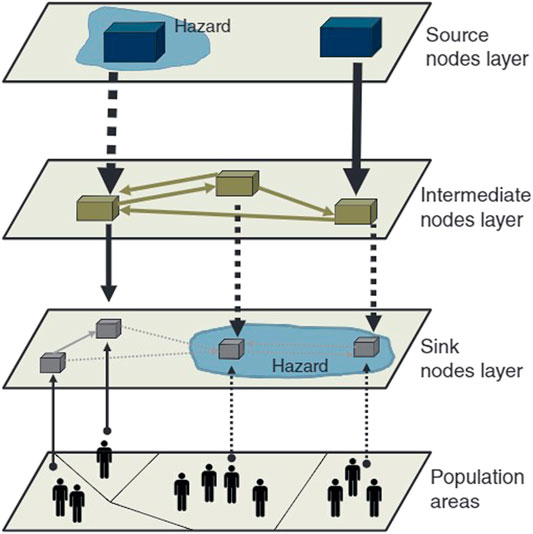
FIGURE 2. Representation of network demand (modified from Pant et al., 2018).
Hierarchical Structure of Electrical Distribution Network
In agreement with the characteristic of network demand, the hierarchical structure of the EDN is established using known network design specifications. The components of the EDN network include a medium voltage power station fulfilling the role of this networks source node, 50 MVLV transformers and distribution buses (both working as intermediate nodes), and a subset of the 5,533 buildings found in Maxvorstadt as sink nodes. For proof of concept and in aiding the assignment of buildings to MVLV transformers, only 600 buildings will be used in this analysis. The network design is accurate for Maxvorstadt even when working with a subset of buildings. Similar to the job of an MVLV transformer, the medium voltage power station functions to down step high voltage supplied from a larger transmission network to a medium voltage for Maxvorstadt’s local distribution network and has an input voltage of 110 kV and output of 10 kV. The 10 kV output is carried to MVLV transformers following distribution loops. Maxvorstadts EDN will be modeled with five medium voltage loops each with 10 MVLV transformers, such that all 50 are accounted for. Evenly distributing the subset of buildings used in this analysis across 50 MVLV transformers results in 12 buildings per MVLV transformer and 120 buildings per MV loop. An illustration of the hierarchical structure of the synthetic EDN can be viewed in Figure 3 below. In the diagram, only MV Loop five is shown to have MVLV transformers, distribution buses, and buildings branching off it, however the same organization is followed for MV Loops one to four.
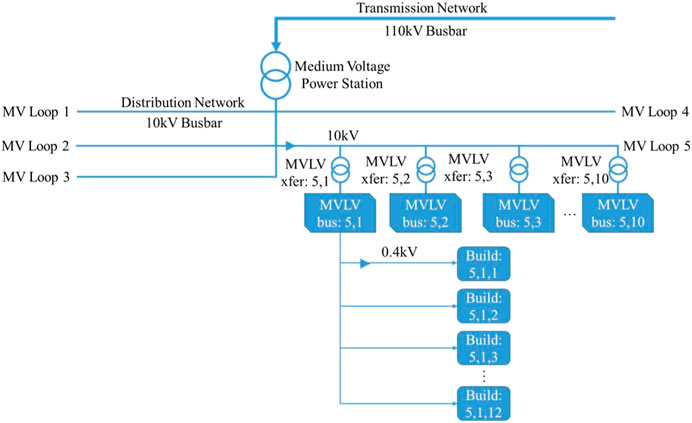
FIGURE 3. Electrical distribution networks hierarchical structure.
Final Network Layout
After selecting and clustering buildings to the MVLV transformers, the final network layout is established for this study. Respecting the limitations prescribed earlier, each MVLV loop consists of only 10 buses and whose route runs along the already constructed streets of Maxvorstadt. All five MVLV loops converge at the MV power station, located on Isabellastraße between Neureutherstraße and Georgenstraße, just north of Maxvorstadt, denoted by an orange bolt in Figure 4.
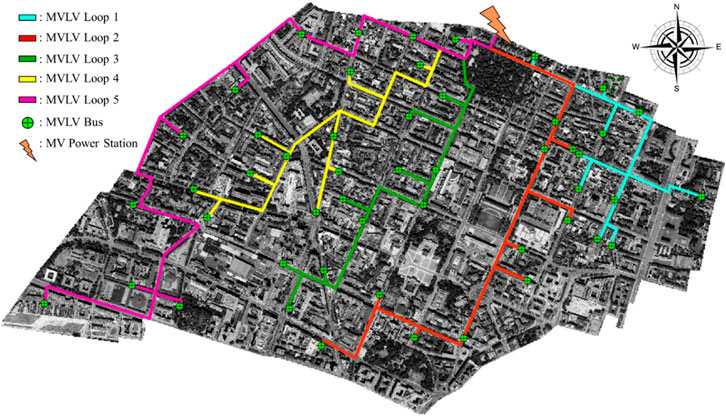
FIGURE 4. Final electrical distribution network layout.
Electrical Distribution Network Failure Definition
MVLV Distribution Bus Failure Criteria
Previously described as a member of a hierarchy or a location in a coordinate system, an MVLV bus is to also be understood as a point of failure for the network. After in-field observations have been made, it has been determined a MVLV bus is nominally raised 30 cm above the ground surface on a cement platform. This is a design specification for these components; however, frequently the height varies above or below 30 cm. This factor has been considered as a controllable parameter in the Electrical Network Flood Resilience Model.
To describe the failure criteria of a single MVLV bus, water depths at its location must be analyzed for the duration of flooding. By letting
MVLV bus inundation can be calculated via Eq. 11, where
Building Electrical Panel Failure Criteria
A building electrical panel is the connection point where electricity is transferred from the MVLV bus to a building through a power line. According with DIN (2018) those panels have to be mounted between 0.3 and 1.5 m above the floor. Typically, they are installed near max. height (professional experience). In order not to overestimate the number of customers affected by flooding, all building electrical panels have been assumed mounted upwards of 1.5 m off the floor on a basement wall. By observing that indoor water depths produced in indoor flood modeling never exceed 1.5m, building electrical panel failure is rather described by using Eqs 13–15.
At the time the indoor water depth surpasses the defined
Since a building electrical panel can either exist in an available or failed state, an available panel is expressed using the same naming convention as Eq. 16. Consequently, if
Network Flood Resilience
Network Flood Resilience
Network flood resilience (NFR) is modeled as a time variant calculation of the ratio of buildings with power to the total number of buildings, at a given point in time. The quantification of NFR is the major goal of this research and is a measure representative of how a cities EDN can withstand a flooding event. The NFR discussed in this study only pertains to the event phase of the flood and can be calculated using Eq. 18. Buildings with or without power have been used as the parameter to measure NFR, such that the systems resilience is evaluated using the nodes customers connect to.
For a total of
Results
Flood Inundation Modeling
In Figure 5 the extent and magnitude of the 2D P-DWave inundation model is show for the 100-years pluvial rainfall event in Maxvorstadt, Munich, Germany. Water routing follows the streets of this neighborhood, where the concentration of maximum depths can be observed in the center of Maxvorstadt.
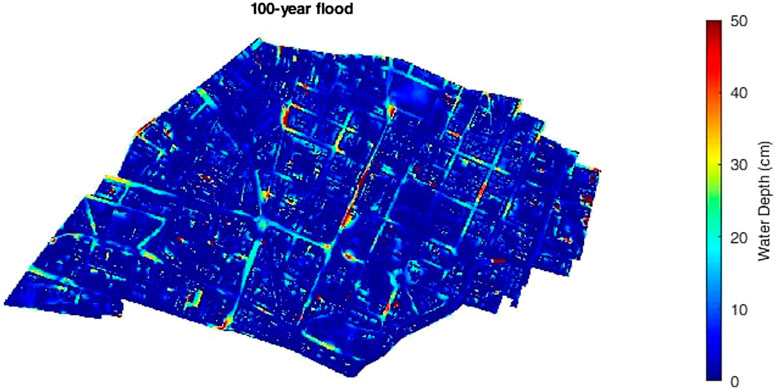
FIGURE 5. 100-years return period outdoor inundation results for Maxvorstadt (Chen et al., 2018).
Electrical Distribution Network Flood Inundation Modeling
In Figure 6, the network components and houses that are disconnected due to flooding are visualized, and the number of component failures (number of failed building panels and failed MVLV buses), percentage of buildings in each indoor water depth class (larger than 30 cm, between 15 and 30 cm, between 0 and 15 cm, and equal to 0 cm), and the resilience of EDN are also displayed. At the end of simulation, 123 buildings, and eight buses have been disconnected from the network, distributed across the study area, and not just following the locations of maximum depths, resulting in a network flood resilience of 0.795.
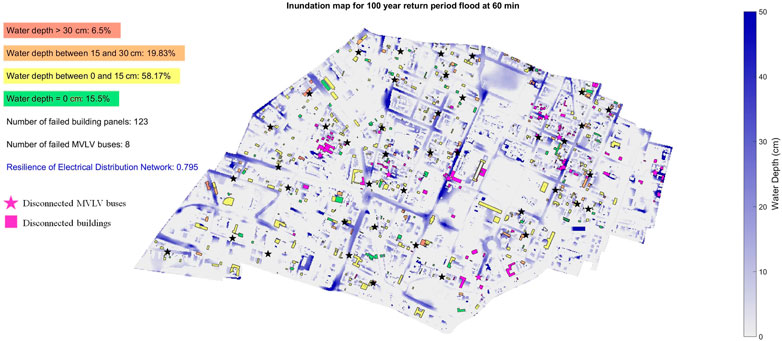
FIGURE 6. Maxvorstadt Electrical Distribution Flooding at 3,600 s.
Network Flood Resilience
Figure 7 depicts the time dependent nature of the network flood resilience through the flooding event, given different control parameter settings. Figure 7A shows the effect of raising MVLV bus heights on network resilience, and Figure 7B shows how the indoor failure criteria influences network resilience. From these two results, it can be understood that by increasing the height at which a MVLV bus will fail, the network flood resilience also increases. Likewise, by reducing the rate at which indoor building panels fail and increasing the depth at which water enters the basement where they are located, we can see a drastic increase in the network's resilience.
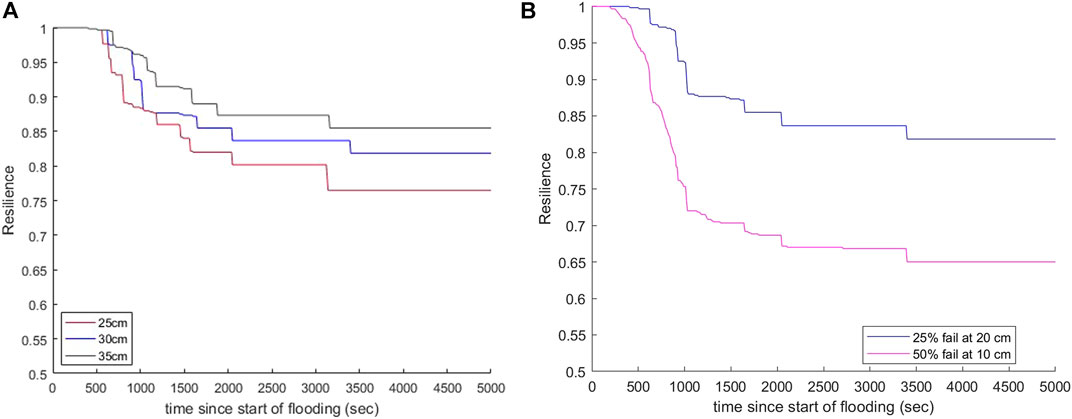
FIGURE 7. Network Flood Resilience for changing (A) critical outdoor water depth; (B) indoor failure criteria.
Discussion
Electrical Distribution Network Inundation Modeling
Along with the magnitude and routing of flood waters seen in Figure 5, NFR is entirely dependent on how the network was created and the positioning of its components. A different building selection or MVLV bus clustering would cause substantial repositioning of all components of the network. This means that the component disconnections seen in Figure 6, would not be the same given a different network generation. Therefore, the NFR would also be expected to change if a different network layout is applied. Any advancements in the development of the EDN, specifically if the actual EDN design of Maxvorstadt becomes available, would produce NFR results more aligned with reality. Seen in Figure 6, the areas of Maxvorstadt that experienced the most severe failure of MVLV buses or buildings disconnected were “St. Benno,” the northern area of “Augustenstrasse,” including its border with “Königsplatz,” and the interface between Technical University of Munich and “Alter Nordfriedhof”. Intuitively, the locations where the EDN is offline coincide with the areas that experience significant flooding. What is also seen in Figure 6 is the percentage of house with certain indoor inundation, but more importantly the disconnected buildings and MVLV buses, denoted by magenta shading. MVLV buses are symbolized by stars in this graphic. Locations of failing EDN should be considered in any NFR improvement measures that would normally be constructed for areas experiencing severe flooding. It would be a suggestion that any NFR improvement measures aimed toward flood damage avoidance, for example educated spatial planning, take the EDN networks failure locations into consideration.
Electrical Network Flood Resilience Model
The network flood resilience value is the output of what is best conceptualized as the interactions between many sub-models. These sub-models include the P-DWave flood model, indoor flood model, failure model of MVLV buses, failure model of indoor building panels, and the EDN causal-effect relationship model. NFR determined in this model and quantified through Eq. 18 are to be thought as minimum values for the EDN because the study has only investigated the event phase of flooding. Repairing practices to the EDN that would happen during the recovery phase would justify the creation of a new repair time model.
The Electrical Network Flood Resilience Model is run multiple times so that the control parameters influence on NFR can be analyzed. The NFRs sensitivity to the 1) critical outdoor water depth, and 2) building electrical panel failure criteria can be seen in Figure 7.
Critical Outdoor Water Depth
The existence of an MVLV bus in one of two states, either functioning or not, as determined in Eqs 9, 10, is realistic as there is no operational state that would only distribute power from an MVLV bus to a fraction of its connected buildings. Where the MVLV bus failure model is simplified is the immediate nature by which it fails once outdoor water depths exceed
Building Electrical Panel Failure Criteria
Where the MVLV bus failure model uses only P-DWave flood outputs to determine if a component is functioning or not, building panel failures involve an additional model before characterizing their operational state, namely the indoor flood model. This model is described by Eqs 4–8. The building panel failure was defined without incorporating a new set of hydraulic computations describing inflowing water down a basement wall, but rather used the failure probability introduced in equation’s (13) to (15), producing the final governing Eq. 16. From observation of Figure 7B, clearly illustrated is the major potential for building electrical panels to have a rapid and significant failure response to flooding, given the used failure definition. The relevance of this observation becomes clearer when applied to those who may be directly affected during a flooding event. When disconnection from the network occurs at the household level, then measures to cope with the situation may vary from building to building, adding complexity to total relief efforts.
Conclusion
Given the combination of control parameters that were tested for the 100-years pluvial flood event, several conclusions can be made regarding Maxvorstadts electrical distribution network resiliency to flooding. Learning that most buildings lose power because of medium voltage to low voltage bus failures, and that great benefit to the network flood resilience was found when increasing the flood depth at which they fail, flood risk solutions should focus on protecting this network component from inundation. Power loss due to indoor flooding has the potential to be significant and occur quickly after flooding begins, justifying that any measure to improve the network flood resilience being applied should be done before an expected flood occurs. Reducing medium voltage to low voltage bus vulnerability to inundations through means of dry proofing, for example, should be administered to neighborhoods of “St. Benno,” the northern area of “Augustenstrasse,” including its border with “Königsplatz,” and the interface between Technical University of Munich and “Alter Nordfriedhof,” for maximum improvement of the network flood resilience (always considering the generated synthetic EDN structure).
The failure mechanics that control the medium voltage to low voltage buses and indoor electrical panel functionality were derived for the purpose of this study and the resulting metric of the network flood resilience is largely dependent on their definitions. A further exploration into how electrical component fail when exposed to flood waters, particularly in the case of the indoor electrical panel, would contribute to an improved failure definition of the network, and a more realistic measure of the network flood resilience. The larger network flood resilience model presented in this study can handle improvements made in the various sub-models’ components.
This research has attempted to capture how a real electrical distribution network would respond to flooding through the newly introduced Electrical Network Flood Resilience Model. The replacement of this works synthetic electrical distribution network with the complete and actual EDN of Maxvorstadt, and the integration of the networks redundant capabilities would enable this model to deliver a more realistic estimation of the network flood resilience. Additionally, the information about the height of the distribution of medium voltage to low voltage buses across Maxvorstadt would make the default parameter “critical outdoor water depth” dependent on each bus and deliver more detailed results. Improvements toward the exact location and height of the building electrical panel would make the failure criteria assessment more realistic and contribute to the overall better estimation of the electrical network flood resilience.
Future research will focus on the recovery times. To fully comprehend the network flood resilience, particularly how it rebounds after a flooding event, a model to incorporate component repair times would need to be created. As is the case of any model, more trial runs would further improve the sensitivity analysis of the network flood resilience, specifically allowing for higher order sensitivity indexes to be calculated. Future work will also focus on cascading effects, since power supply underpins many other infrastructure systems (e.g. communication, water supply, transport, etc). The work completed thus far gives decision makers a direct measure for estimating how Maxvorstadts electrical distribution network will respond to flooding.
Data Availability Statement
The datasets presented in this article are not readily available because the case study data is protected by a no sharing agreement. Requests to access the datasets should be directed to the first or second authors.
Author Contributions
JL from the Chair of Hydrology and River Basin Management of the Department of Civil, Geo and Environmental Engineering, was the main supervisor in this research. SC developed and implemented the resilience Model in Matlab. LV from Chair of High Voltage Engineering and Switchgear Technology of the Department of Electrical and Computer Engineering, supervised the design and architecture of the synthetic electrical distribution network.
Conflict of Interest
The authors declare that the research was conducted in the absence of any commercial or financial relationships that could be construed as a potential conflict of interest.
References
Batica, J., and Gourbesville, P. (2014). “Flood resilience index—methodology and application,” in 11th International conference on hydroinformatics (HIC 2014) informatics environ. data model integr. a heterog. NewYork, Hydro World, 1348–1355.
Bollinger, L. A., and Dijkema, G. P. J. (2016). Evaluating infrastructure resilience to extreme weather – the case of the dutch electricity transmission network. Eur. J. Transp. Infrastruct. Res. 16, 214–239. doi:10.18757/ejtir.2016.16.1.3122
Campbell, K., Keating, A., Burer, M., Nash, D., McQuistan, C., and Szoenyi, M. (2017). Development and testing of a community flood resilience measurement tool. Nat. Hazards Earth Syst. Sci. 17, 77–101. doi:10.5194/nhess-17-77-2017
Chen, K., and Leandro, J. (2019). A conceptual time-varying flood resilience index for urban areas: munich city. Water 11, 830. doi:10.3390/w11040830
Chen, K., Leandro, J., Pauleit, S., and Disse, M. (2018). A Flood Resilience index for an urban area: assessment of climate change impact and adaptation strategies in Munich city. Washington DC, AGU 100 Fall Meeting, 10–14.
de Bruijn, K. M., Maran, C., Zygnerski, M., Jurado, J., Burzel, A., Jeuken, C., et al. (2019). Flood resilience of critical infrastructure: approach and method applied towater (Switzerland), 11. Fort Lauderdale, Florida, 1–21. doi:10.3390/w11030517
de Bruijn, K. M. (2004). Resilience and flood risk management. Water Policy 6, 53–66. doi:10.2166/wp.2004.0004
DIN. (2018). DIN 18012 Haus-Anschlusseinrichtungen in Gebäuden Raum- und Flächenbedarf Planungsgrundlagen (Service connections for buildings - general planning criteria) Available at: https://www.beuth.de/en/standard/din-18012/282632465. DIN, 1–9
Fekete, A. (2019). Critical infrastructure and flood resilience: cascading effects beyond water. WIREs Water 6, 1–13. doi:10.1002/wat2.1370
Great Britain. Cabinet Office. (2010). Strategic framework and policy statement on improving the resilience of critical infrastructure to disruption from natural hazards. London: Oxford University Press.
Haidini, A., Hassani, S., Aqqal, A., and Hannani, A. (1989). The role of communication technologies in building future smart cities. Intech 32, 137–144 .10.5772/64611
IPCC (2014). “Climate change 2014: Synthesis report,” in Chapter observed changes and their causes. Amsterdam: Elsevier. doi:10.1046/j.1365-2559.2002.1340a.x
Junghänel, T., Ertel, H., and Deutschländer, T. (2017). KOSTRA-DWD-2010R Bericht zur Revision der koordinierten. Berlin: Springer.
Karagianiis, G., Turksezer, G. M., Alfieri, Z. I., Feyen, L., and Krausmann, L. (2017). Climate change and critical infrastructure-floods—JRC science for policy Report. Eur. Comm. 11, 33. doi:10.2760/007069
Karagiannis, G. M., Chondrogiannis, S., Zehra, E. K., and Turksezer, I. (2017). Power grid recovery after natural hazard impact—a Science for Policy report. Italy: Electa. doi:10.2760/87402
Kwasinski, A., Eidinger, J., Tang, A., and Tudo-Bornarel, C. (2014). Performance of electric power systems in the 2010-2011 Christchurch, New Zealand, earthquake sequence. Earthq. Spectra 30, 205–230. doi:10.1193/022813EQS056M
Leandro, J., Chen, A. S., and Schumann, A. (2014). A 2D Parallel diffusive wave model for floodplain inundation with variable time step (P-DWave). J. Hydrol. 517, 250–259. doi:10.1016/j.jhydrol.2014.05.020
Leandro, J., Chen, K.-F., Wood, R., and Ludwig, R. (2020). A scalable flood-resilience-index for measuring climate change adaptation: Munich city. Water Res. 1–2
Leandro, J., Schumann, A., and Pfister, A. (2016). A step towards considering the spatial heterogeneity of urban key features in urban hydrology flood modelling. J. Hydrol. 535, 356–365. doi:10.1016/j.jhydrol.2016.01.060
Martins, R., Leandro, J., Chen, A. S., and Djordjević, S. (2017). A comparison of three dual drainage models: shallow water vs local inertial vs diffusive wave. J. Hydroinform. 19, 331–348. doi:10.2166/hydro.2017.075
McIntyre, N., Mawle, R., Kitson, J., Hunt, C. F., Emanuelsson, M. A. E., and Voulvoulis, N. (2012). Flood risk assessment for infrastructure networks. J. Flood Risk Manag. 7, 31–41. doi:10.1111/jfr3.12028
Munchen, Landeshauptstadt. (2018). Munich facts and figures 2018, Regensburg, Stat. Amt der Landeshauptstadt München.
Pant, R., Thacker, S., Hall, J. W., Alderson, D., and Barr, S. (2018). Critical infrastructure impact assessment due to flood exposure. J. Flood Risk Manage. 11, 22–33. doi:10.1111/jfr3.12288
Perfrement, T., and Lloyd, T. (2016). Identifying and visaulising resilience to flooding via a composite flooding disaster resilience index. Floodplain Manag. Aust. Natl. Conf. 14, 1–11. doi:10.1002/9781118259870.ch12
Pflugbeil, T., Broich, K., and Disse, M. (2019). Hydrodynamic simulation of the flash flood events in baiersdorf and simbach (Bavaria)—a model comparison. EGU Gen. Assem. 21, 15509. doi:10.3390/cli1030148
Sundnes, K. O. (2014). 4. The transectional structure of society: the basic societal functions. Scand. J. Public Health 42, 36–47. doi:10.1177/1403494813515099
Tierney, K. J. (2007). “Businesses and disasters: vulnerability, impacts, and recovery,” in Handbook of disaster research. New York, Springer, 275–296. doi:10.1007/978-0-387-32353-4_16
Tofani, A., D’Agostino, G., Di Pietro, A., Giovinazzi, S., La Porta, L., Parmendola, G., et al. (2019). Modeling resilience in electrical distribution networks. IntechOpen 32, 137–144. doi:10.5772/intechopen.85917
United Nations. (2011). Terminology on disaster risk reduction.Geneva, Switzerland: United Nations Publications.
Voeller, J. G., and Dobson, I. (2008). Analysis of cascading infrastructure failures. Wiley Handb. Sci. Technol. Homel. Secur. 27, 1–10. doi:10.1002/9780470087923.hhs244
Keywords: network flood resilience, electrical distribution network, urban floods, flood risk assessment, flood inundation modeling, critical infrastructure
Citation: Leandro J, Cunneff S and Viernstein L (2021) Resilience Modeling of Flood Induced Electrical Distribution Network Failures: Munich, Germany. Front. Earth Sci. 9:572925. doi: 10.3389/feart.2021.572925
Received: 15 June 2020; Accepted: 17 February 2021;
Published: 22 March 2021.
Edited by:
Carmine Galasso, University College London, United KingdomReviewed by:
Maria Pregnolato, University of Bristol, United KingdomThomas O'Shea, University of Bristol, United Kingdom
Copyright © 2021 Leandro, Cunneff and Viernstein. This is an open-access article distributed under the terms of the Creative Commons Attribution License (CC BY). The use, distribution or reproduction in other forums is permitted, provided the original author(s) and the copyright owner(s) are credited and that the original publication in this journal is cited, in accordance with accepted academic practice. No use, distribution or reproduction is permitted which does not comply with these terms.
*Correspondence: Jorge Leandro, Sm9yZ2UubGVhbmRyb0B0dW0uZGU=