 Takeshi Iinuma
 Motoyuki Kido
 Yusaku Ohta
 Tatsuya Fukuda4
 Fumiaki Tomita
 Iwao Ueki
- 1Research Institute for Marine Geodynamics, Japan Agency for Marine-Earth Science and Technology (JAMSTEC), Yokohama, Japan
- 2International Research Institute of Disaster Science, Tohoku University, Sendai, Japan
- 3Graduate School of Science, Tohoku University, Sendai, Japan
- 4Institute for Marine-Earth Exploration and Engineering, Japan Agency for Marine-Earth Science and Technology (JAMSTEC), Yokosuka, Japan
- 5Research Institute for Global Change, Japan Agency for Marine-Earth Science and Technology (JAMSTEC), Yokosuka, Japan
Crustal deformation of the seafloor is difficult to observe solely using global navigation satellite system (GNSS). The GNSS-acoustic (GNSS-A) technique was developed to observe seafloor crustal deformation, and it has produced a steady series of successful observations with remarkable results related to crustal deformation associated with huge earthquakes around the Japanese Islands. However, utilizing GNSS-A incurs very large financial and human costs as it requires the use of a research vessel as a surface platform and has a limited observation frequency, which is less than once a year at seafloor stations along the Japan Trench. To conduct frequent observations, an automatic GNSS-A data acquisition system was developed that operates via an unmanned surface vehicle (wave glider). The first observations using this system were performed at a seafloor station off Aomori Prefecture in July 2019. The wave glider was equipped with two GNSS antennas, an acoustic transducer, a microelectromechanical system gyroscope, and associated control and logging units. Data acquisition and autonomous activation of the seafloor stations were successfully executed by controlling the power supply to the payload via satellite communication with the wave glider. The glider rarely strayed off the configured course and the solar panels generated sufficient power to perform the observations although the weather was mostly cloudy. The GNSS-A data processing results show that the position of the station was determined with the same accuracy and precision as in previous observations performed using a research vessel.
Introduction
While terrestrial crustal deformation has been monitored using global navigation satellite system (GNSS) observations since the 1990s, crustal deformation of submarine offshore regions is difficult to detect using satellite geodetic methods as the electromagnetic waves cannot penetrate the deep ocean to reach the seafloor. The GNSS-acoustic (GNSS-A) technique was developed to overcome this difficulty in observing seafloor crustal deformation (Spiess, 1985; Spiess et al., 1998; Asada and Yabuki, 2001; Fujita et al., 2006). Recent results related to crustal deformation associated with huge earthquakes around the Japanese Islands have shown the usefulness of the GNSS-A technique (e.g., Kido et al., 2011; Sato et al., 2011; Sun et al., 2014; Watanabe et al., 2014; Yokota et al., 2016).
Conventional GNSS-A requires large financial and human costs because a research vessel that functions as a surface platform is exclusively necessary. Therefore, increasing the observation frequency at the seafloor stations along the Japan Trench is quite difficult. Tohoku University installed 20 seafloor GNSS-A stations in 2012 following the 2011 Tohoku-oki earthquake to detect post-seismic deformation due to the earthquake (Kido et al., 2015). However, repeated observations at all stations have not been conducted frequently (i.e., less than once a year), especially after 2017 due to financial difficulties as usage of a research vessel costs several tens of thousands of dollars per day (cf. Tomita et al., 2017).
Another issue associated with using a research vessel is the accessibility to the hull-mounted acoustic transducer. A hull-mounted system enables us to perform the GNSS-A observations along ideal well-balanced track lines and increases observation frequency (Ishikawa et al., 2020). However, once the hull-mounted transducer fails, it cannot be repaired until the vessel is dry-docked. Easier maintenance access is desirable for continuous observations over an extended period (years to decades).
To conduct frequent observations and ensure easy maintenance, we have developed an automatic GNSS-A data acquisition system using a wave glider (WG), which is an unmanned surface vehicle. As Chadwell et al. (2016) demonstrated, the WG has the capability for GNSS-A observations. The WG can navigate from station to station on autopilot without an external power supply or fuel consumption. The solar panels on the WG generate sufficient power to change course, manage satellite communications, and perform the GNSS-A observations. The deployment and recovery operations are also easy such that we can handle the WG from small vessels as long as they are equipped with a derrick or crane capable of lifting the WG whose weight and length are about 250 kg and 3 m, respectively.
Herein, we report on the developed GNSS-A system installed in the WG, initial sea trial conducted in July 2019, and results of data processing from the trial deployment of the WG. We also present planned future work regarding the development of the system.
Methods
Automatic GNSS-A Data Acquisition System
In the automatic GNSS-A data acquisition system, the WG transits to a seafloor station, initiates the GNSS-A observation, and remains at the station for several hours (up to ∼20 h) to record the GNSS-A observation data. These actions should be performed automatically and as autonomously as possible. It is also desirable that the WG remains offshore and continues recording observations for as long as possible. Thus, the required functions of the system are as follows:
(1) Autonomous transit according to a pre-configured course or target waypoints while avoiding other ships
(2) Automatic control of the GNSS-A system, consisting of the GNSS receiver, acoustic unit, and microelectromechanical system (MEMS) gyroscope
(3) Power generation using the solar panels and internal batteries, whose capacity is sufficient to carry out the cruise and observations
(4) Satellite communication for configuring the course or target waypoints and for monitoring power generation and the battery status
The SV3 WG (manufactured by Liquid Robotics, Inc., CA, United States) has the capability for functions 1 and 4. We then constructed a system that would accomplish function 2 and considered power needs (function 3). Note that the observation includes waking-up the seafloor transponders, transmitting the acoustic ranging signals, receiving/recording the replies from the transponders, and storing GNSS and gyroscope data.
Figure 1A shows the block diagram of the GNSS-A data acquisition system developed for this study. It consists of two GNSS antennas, a GNSS receiver, an acoustic transducer, an acoustic unit, an MEMS gyroscope, a controlling and recording single board computer (SBC), a wired/wireless router, band filters to filter out Iridium satellite signals, and power supply units (a DC/DC converter, a supercapacitor, and a charge–discharge relay board to the supercapacitor). The supercapacitor is necessary to supply the acoustic unit with instantaneous high current to transmit a wake-up signal to the seafloor transponder. The GNSS antennas and the acoustic transducer are mounted on the float, while the other instruments are installed inside a waterproof container (Figures 1B,C). The router has a wireless port that allows for access after the waterproof container is sealed. We can modify the controlling script installed in the SBC, configure the GNSS receiver setting, and check the recording status of acoustic ranging and gyroscope data via the wireless port on the deck before deployment.
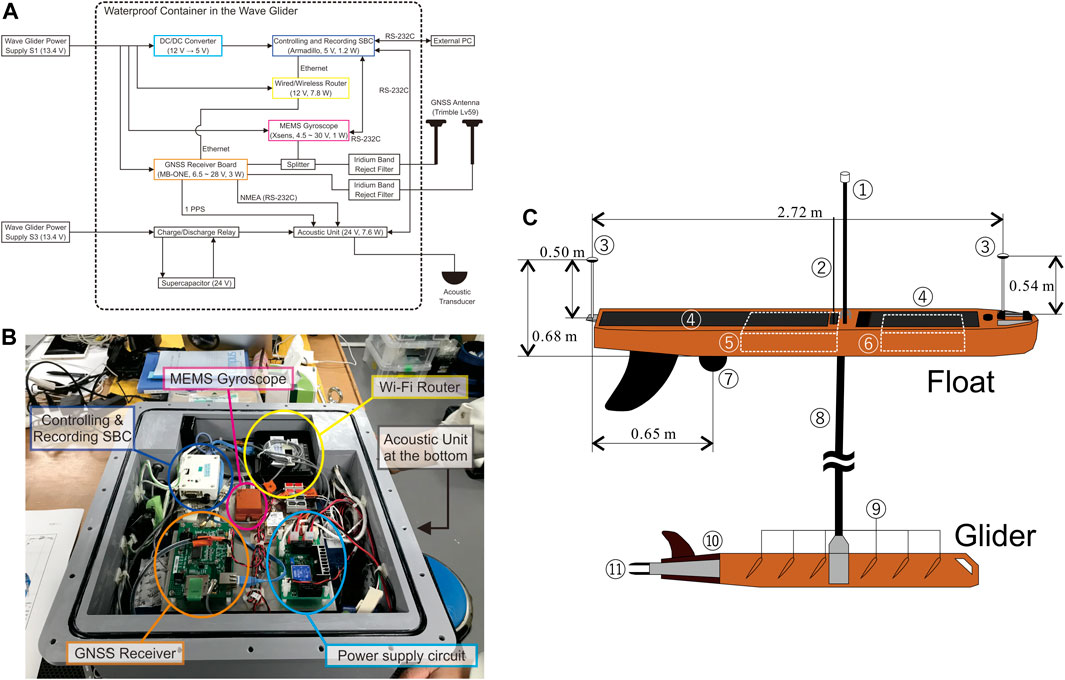
FIGURE 1. (A) Block diagram of the GNSS-A data acquisition system. Items within a rounded rectangle with dashed line are installed inside a water-proof container as shown in (B). PPS and NMEA are pulse per second and NMEA (National Marine Electronics Association) 0183 sentences, respectively. (B) The waterproof container prior to sealing. Its internal dimensions are 342 mm (width) × 380 mm (length) × 174 mm (maximum depth). (C) Schematic diagram of the WG. ① to ⑪ indicate the parts and equipment as follows: ①: weather sensor, ②: AIS antenna, ③: GNSS antennas, ④: solar panels, ⑤: command and controlling unit and batteries inside the float, ⑥: water-proof container shown in Figure 1B inside the float, ⑦: acoustic transducer, ⑧: umbilical cable (∼8 m), ⑨: wings, ⑩: rudder, and ⑪: thruster.
The power supply to the payload can be remotely turned on and off (i.e., the S1 and S3 ports on the WG (Figure 1A) from land via communication from an Iridium satellite. The power supply for the acoustic unit is started when the S3 port is turned on. Once the S1 port is turned on, the GNSS receiver and the gyroscope are activated, and the SBC is booted up. The GNSS receiver itself records the raw data. The startup script in the SBC checks the current geographic location through the GNSS output. If the location is found sufficiently close to a certain GNSS-A observation site, it starts recording GNSS National Marine Electronics Association (NMEA) 0183 sentence output and raw gyroscope data, as well as starts sending a sequence of acoustic commands of wake-up and delay setting to the corresponding seafloor transponders at the site. After confirming that all the transponders have woken-up based on their reply messages, the acoustic ranging session is initiated. The acoustic ranging signal is transmitted every minute, and the replies from the seafloor transponders are recorded by the acoustic unit. When the WG leaves the site at a threshold distance, acoustic ranging and data recording of GNSS NMEA and gyroscope are automatically stopped, and the SBC halts and is ready to turn off the S1 port. In this experiment, data processing to estimate the position of the site, which is defined as the center of the array of seafloor transponders, is performed after the cruise ends. However, it can be estimated onboard in semi-real time and the position of the site can be transmitted to shore via satellite communication. Effecting such semi-real time observations is the next step in the development of this system.
Trial Observations at Sea and Data Processing
We conducted GNSS-A observations at a seafloor station off the coast of Aomori Prefecture in July 2019 during a survey cruise (KS-19-12) using the research vessel Shinsei-maru (Joint Usage/Research Center for Atmosphere and Ocean Science and Japan Agency for Marine-Earth Science and Technology, 2019). Figure 2 shows the tracks of the Shinsei-maru and the WG throughout the cruise. Table 1 shows the extracted time schedule with respect to the GNSS-A observations made by the WG during the survey cruise. Shinsei-maru deployed the WG at site G02 on July 4. After conducting the GNSS-A observation by means of its own system parallel with the WG for about 3 h, Shinsei-maru moved toward northeast to install observation instruments at other sites. On July 7, it returned to the retrieval point ER4 to recover the WG. Note that the activation of the seafloor transponders at site G02 was performed using the GNSS-A observation equipment mounted on the Shinsei-maru before the deployment of the WG, and the GNSS-A observation by Shinsei-maru was suspended and resumed at 23:36 on July 3 and 00:05 on July 4 in order to confirm that the WG was transducing the acoustic ranging signal as shown in Table 1.
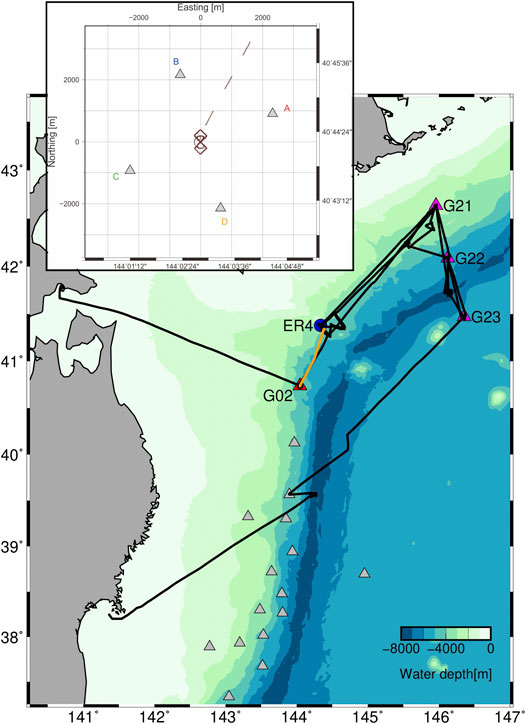
FIGURE 2. Cruise tracks of the research vessel Shinsei-maru (black line) and the WG (orange line) during survey cruise KS-19-12 (Joint Usage/Research Center for Atmosphere and Ocean Science and Japan Agency for Marine-Earth Science and Technology, 2019). A red triangle and a blue circle point the sites G02 and ER4, respectively. Gray and magenta triangles indicate the seafloor sites that were installed in 2012 and during this cruise, respectively. The inset shows the track of the WG at site G02 with the locations of the seafloor acoustic transponders.
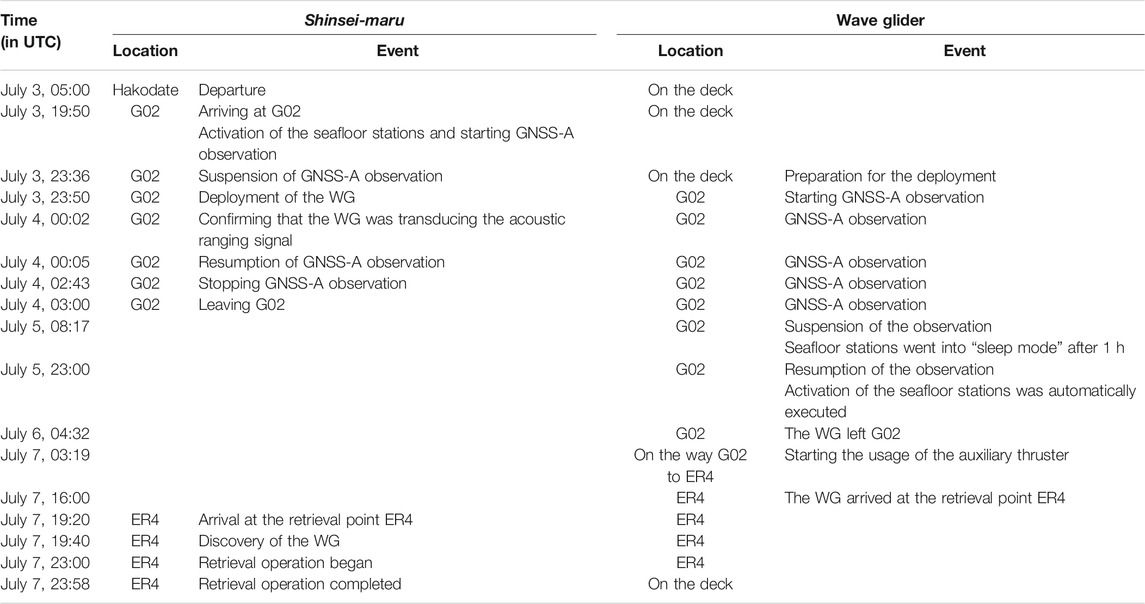
TABLE 1. Itinerary of the research vessel Shinsei-maru and the WG during survey cruise KS-19-12.
The items tested during the trial observations were as follows:
(1) Data acquisition from the sensors, namely, the GNSS carrier phase, attitude of the float (heading, roll, and pitch), and acoustic waveforms from the transponders
(2) Autonomous activation of the seafloor transponders by turning the power supply to the payload on or off from shore via satellite communication
(3) Autonomous transit between the sites and tracing a pre-configured course at each site
To examine these items, in the initial plan, the WG was deployed at a site (G02), performed GNSS-A observations with tracing a figure-eight course that was centered at the center of the array of seafloor transponders (Figure 2), and then was ordered to transit to another site (G03), which is located just south of site G02 (item 3), and GNSS-A observations were initiated at site G03 (item 2). However, as the weather forecast stated that the state of the sea will become worse from the south, we altered the recovering point of the WG (G03) to site ER4, where a long-term ocean bottom seismograph was installed during the same survey cruise. Therefore, item 2 was examined at site G02 by suspending GNSS-A observations for a period of time. One hour after the final acoustic shot is received, the seafloor transponders go into a “sleep mode.” Thus, we suspended and resumed the GNSS-A observations at 08:17 and 23:00 by turning off and on the S1 port, respectively, to test whether the autonomous activation of the seafloor transponders was successful. We could ascertain whether the data acquisition was successful (item 1) only after we recovered the WG on deck.
After the recovery of the WG, we analyzed the collected GNSS-A data by applying the method devised by Kido et al. (2006). We estimated the translational horizontal displacements of the seafloor transponder array relative to the pre-defined position and net sound velocity change for each shot by combining the absolute position of the surface transducer and its distances to the seafloor transponders under the condition of a stratified sound velocity structure. The pre-defined array geometry and its position were estimated by Honsho et al. (2019) in the past using vessel-based moving observations. The positions of the surface transducer at timings of transmission and reception in a global coordinate system are derived based on the position of GNSS antenna and the WG’s attitude. The GNSS NMEA and MEMS gyroscope data provide information about the attitude of the WG, which is defined by the heading, pitch, and roll angles. The heading angle was estimated based on the dual antenna GNSS, while the pitch and roll angles were observed directly by the MEMS gyroscope. The relative position between the GNSS antenna and surface transducer in the body-fixed frame is also regarded as an unknown that can be solved by minimizing travel time residuals throughout the campaign. Once the relative position is solved, we can finally estimate the position of the array and temporal change in the average sound velocity for each acoustic shot to evaluate the temporal stability of the estimated array positions.
Results
Data Acquisition and Power Management
The data acquisition from the sensors performed well at site G02. Figure 3A shows the time series of the pseudo ranges between the acoustic transducer mounted on the WG and the seafloor acoustic transponders. Note that the pseudo ranges include apparent distances due to artificial response delays of seafloor transponders. Owing to a bug in the controlling script of the acoustic unit, the wake-up sequence, in which the acoustic commands to wake-up the seafloor transponder and configure the artificial delay were sent for each transponder, and an acoustic ranging session that was composed of 20 acoustic signal transmissions at the rate of 1 shot/min were repeated. The wake-up sequence and acoustic ranging session took ∼35 min and 20 min, respectively. Therefore, the acoustic ranging data is discontinuous. Although the total amount of the acoustic ranging data was reduced by this script error, the acquired data are sufficient to estimate the position of the seafloor transponder array. The wake-up sequence succeeded in activating the seafloor stations when the power supply to the payload was turned on from the shore via satellite communication after the observations were suspended. This proved that the WG can autonomously perform observations from a site on another site.
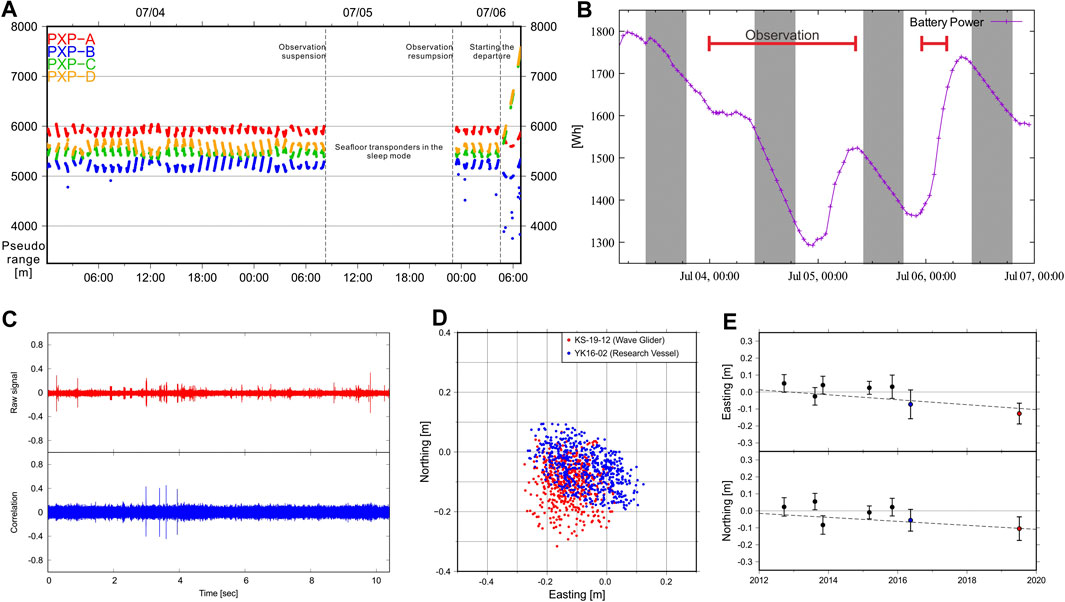
FIGURE 3. (A) Time series of the slant ranges between the acoustic transducer mounted on the WG and the seafloor acoustic transponders (PXPs). Red, blue, green, and orange dots correspond to the pseudo ranges (in m) with respect to transponder A (northeast), B (northwest), C (southwest), and D (southeast), respectively (see the inset of Figure 2). The horizontal axis is the time in UTC. (B) Time series of the battery power. Gray areas correspond to nighttime. Red bars indicate the periods when the GNSS-A observations were performed. The horizontal axis is the time in UTC. (C) An example of the raw acoustic waveform (upper panel) and the correlation waveform between the transmitted code and the recorded signal (lower panel) The horizontal axis shows time of the whole recording duration of up to 10 s for a single shot. The vertical axes are normalized pressure level for the upper panel and correlation coefficient for the lower panel. (D) The position of the center of the array estimated for each acoustic shot. Red and blue dots indicate the positions based on the data obtained by the WG and the research vessel Yokosuka in 2016 (Tomita et al., 2017). (E) Time series of the average array center positions of site G02 estimated by utilizing the method of Kido et al. (2006). The upper and lower panels correspond to the E–W and N–S components, respectively. The dashed lines correspond to the displacement rate estimated from the array center position data obtained before 2017 (Honsho, et al., 2019).
The solar panels generated sufficient power to perform the GNSS-A observations although the weather was mostly cloudy during the deployment. Figure 3B shows the time series of the battery power. During the periods when GNSS-A observations were performed, the total operation consumed approximately 24 Wh per hour at night. However, the total consumption rate was almost balanced or was exceeded by the power generation rate during the day.
Results of the GNSS-A Data Processing
The GNSS data were processed by IT (interferometric translocation) software (Colombo et al., 2000). The quality of the GNSS data has no significant problem considering the temporal stability of the vertical positions which was evaluated using the technique provided by Fujita and Yabuki (2003).
An example of the recorded acoustic raw waveform and the time series of cross-correlation between the transmitted and received signals is shown in Figure 3C. The raw waveform shows that the background noise is high, and the signal-to-noize ratio is low, while the cross-correlation time series exhibits clear correlation peaks that correspond to the arrival of reply signals from the four seafloor transponders. The correlation waveforms are similar to those obtained using a research vessel (e.g., Azuma et al., 2016), and the differences in the correlation waveforms of individual seafloor transponders are not significant. Thus, the quality of the acoustic data is equivalent to that obtained using a research vessel. We obtained the travel time of the acoustic wave between the acoustic transducer mounted on the WG and the seafloor transponders by applying the detection method devised by Azuma et al. (2016) to the cross-correlation time series for the estimation of the position of the seafloor transponder array. Note that an ingenious method to obtain the travel time is necessary because the correlation peak sometimes does not correspond with the direct arrival of the reply signal from the seafloor transponder in the correlation waveform (Azuma et al., 2016).
Figure 3D shows the position of the center of the array estimated for each acoustic shot. The scatter in the WG-derived positions (red points) is not larger than the positions estimated from observations made using a research vessel (blue points). The precision of the estimated position of the center of the array for this campaign is less than 10 cm; that is, the standard deviations of the scatter for each acoustic shot are 7.0 cm and 6.1 cm for both N–S and E–W components, respectively.
To estimate the seafloor displacement rate with high precision, both precision and accuracy (i.e., repeatability between observation campaigns) are required. Figure 3E shows the time series of the average array position of site G02. The array position estimated from the WG data is consistent with past observations. This indicates that negligible systematic bias is included in the estimated position. Therefore, we can directly compare the results from the WG data with past observations that were performed using research vessels and expect to estimate displacement rates as large as the plate convergence rate (i.e., ∼8 cm/year) along the Japan Trench with the observations at least once a year for a couple of years. For instance, we can estimate the displacement rate with the estimation error of less than 5 cm/year based on three observations with the observation error at 7.0 cm during 3 years at even intervals.
Discussion
The WG GNSS-A observation system worked well during the first trial cruise. The tested items performed satisfactorily encouraging us to proceed to the next step of undertaking a long observation cruise and real-time data processing.
As there are more than 20 GNSS-A sites located along the Japan Trench, a cruise of more than one month will be required to visit all the sites and perform GNSS-A observations. One of the next steps is to conduct an observation cruise that is longer than a month. The stability, robustness, and reliability of the entire system during this month-long cruise will be tested. It will enable us to detect not only secular and transient seafloor crustal deformation.
Recently, Uchida et al. (2016) revealed the periodic changes in interplate locking along the northeastern Japan subduction zone based on the activity of small repeating earthquakes and terrestrial crustal deformation data. They found that slow slip along the plate interface has occurred repeatedly at intervals of 2–6 years depending on the location. In the northern part of the Japan Trench, a tsunami-generating earthquake occurred and ruptured the shallow plate boundary in 1896; however, it is not known whether the coseismic slip fully released the interseismic slip deficit, and whether periodic slow slip events occur near the trench or not. To investigate the interplate locking state in this region, more frequent GNSS-A observations are essential. Such repeated observations could be carried out by a WG system.
Furthermore, the development of the WG GNSS-A system is to perform real-time data processing. If we can estimate the position of the transponder array for each seafloor site in real time, and if the WG transmits the positioning results to shore via satellite communications, the WG can remain offshore depending on our preference. The WG system will enable us to perform more frequent GNSS-A observations and monitor the interplate locking state in real time. Moreover, flexible operations will be possible such that we can arrange the observation schedule depending on the results of the real-time data processing. Although the real-time GNSS-A positioning has been investigated using a moored buoy (e.g., Kido et al., 2018), further improvements of the processing system are required. One of the obstacles in performing real-time positioning is the detection of accurate travel time for acoustic ranging. Detection of accurate travel time presupposes post-processing as the highest correlation peak is not always the true arrival time (e.g., Azuma et al., 2016). Therefore, automating this procedure is required for real-time processing.
Some limitations are observed in utilizing the WG for collecting GNSS-A observations. The most significant issue is the speed of the WG. Using the WG in areas where ocean currents are strong may be difficult. The effect of the heterogeneity of the acoustic velocity structure in the sea water is difficult to eliminate owing to the slow speed of the WG. We generally assume that the velocity structure is laterally stratified when analyzing the GNSS-A data. However, if a horizontal gradient in the acoustic velocity structure exists, the position of an acoustic transponder on the slower (faster) side of the gradient is mis-determined as a farther (closer) position (Tomita et al., 2019). As a result, a horizontal gradient in acoustic velocity structure adds critical systematic biases to the estimates (i.e., horizontal positions) of the GNSS-A measurements. Recent studies have successfully eliminated the influence of a long-term (over 12 h) horizontal gradient in acoustic velocity structure by simultaneously solving the gradients and positions (Yasuda et al., 2017; Honsho et al., 2019; Yokota et al., 2019). Note that these methods are applicable only when one set of moving survey (e.g., a single circling) can be completed within a time much shorter than the duration of the gradient structure. The WG with a typical speed of 1–1.5 knot takes 5–7 h to complete a square course around four transponders, whose sides are 1.8 nautical miles each at G02 site (Figure 2). This speed is not sufficient to stably solve the gradient. Therefore, while we examine the practical limits of the moving survey using the WG along the Japan Trench for solving the gradient, depending on ocean conditions and the purpose of the observations, a research vessel that has a hull-mounted system and the WG should be used.
Data Availability Statement
The raw data supporting the conclusions of this article will be made available by the authors, without undue reservation.
Author Contributions
TI directed the project and wrote this manuscript; MK developed the system to control the acoustic unit and to perform data acquisition from the sensors; YO directed the survey cruise (KS-19-12) and oversaw the GNSS observations; TF designed and produced the circuits, container, and jigs to mount all of the equipment on the WG; FT participated in the survey cruise to collect data and analyzed the data to estimate the station positions; IU managed the usage of the WG.
Funding
A part of this study and the submission of the manuscript were supported by JSPS KAKENHI Grant Number JP19H05596. The development of the observation system and operation of the WG were supported by Japan Agency for Marine-Earth Science and Technology and Tohoku University.
Conflict of Interest
The authors declare that the research was conducted in the absence of any commercial or financial relationships that could be construed as a potential conflict of interest.
Acknowledgments
The figures were generated using Generic Mapping Tools software. The observation data were obtained using the Research Vessel Shinsei-maru, which was supported by the Collaborative Research Program of Atmosphere and Ocean Research Institute, University of Tokyo.
References
Asada, A., and Yabuki, T. (2001). Centimeter-level positioning on the seafloor. Proc. Jpn. Acad. Ser. B 77, 7–12. doi:10.2183/pjab.77.7
Azuma, R., Tomita, F., Iinuma, T., Kido, M., and Hino, R. (2016). Development and examination of new algorithms of traveltime detection in GPS/acoustic geodetic data for precise and automated analysis. Earth Planet. Space 68, 143. doi:10.1186/s40623-016-0521-2
Chadwell, C. D., Webb, S., and Nooner, S. (2016). “Campaign-style GPS-Acoustic with wave gliders and permanent seafloor benchmarks,” in Proceedings of the Subduction Zone Observatory Workshop, Boise Center, Boise, ID, (Sep 29–Oct 1, 2016).
Colombo, O. L., Evans, A. G., Vigo-Aguiar, M. I., Ferrandiz, J. M., and Benjamin, J. J. (2000). Long-baseline (>1000 km), sub-decimeter kinematic positioning of buoys at sea, with potential application to deep sea studies. Salt Lake City, Utah: ION GPS 2000 Meeting, 19–22 Sep.
Fujita, M., Ishikawa, T., Mochizuki, M., Sato, M., Toyama, S., Katayama, M., et al. (2006). GPS/Acoustic seafloor geodetic observation: method of data analysis and its application. Earth Planet. Space 58, 265–275. doi:10.1186/BF03351923
Fujita, M., and Yabuki, T. (2003). A way of accuracy estimation of K-GPS results in the seafloor geodetic measurement. Tech. Bull. Hydrogr. Oceanogr. 21, 62–66. (in Japanese).
Honsho, C., Kido, M., Tomita, F., and Uchida, N. (2019). Offshore postseismic deformation of the 2011 Tohoku earthquake revisited: application of an improved GPS-acoustic positioning method considering horizontal gradient of sound speed structure. J. Geophys. Res. Solid Earth 124, 5990–6009. doi:10.1029/2018JB017135
Ishikawa, T., Yokota, Y., Watanabe, S., and Nakamura, Y. (2020). History of on-board equipment improvement for GNSS-A observation with focus on observation frequency. Front. Earth Sci. 8, 150. doi:10.3389/feart.2020.00150
Joint Usage/Research Center for Atmosphere and Ocean Science and Japan Agency for Marine-Earth Science and Technology (2019). Shinsei-maru KS-19-12 cruise data. Yokosuka: JAMSTEC. doi:10.17596/0002041
Kido, M., Fujimoto, H., Hino, R., Ohta, Y., Oasda, Y., Iinuma, T., et al. (2015). “Progress in the project for development of GPS/acoustic technique over the last 4 years,” in International symposium on geodesy for earthquake and natural hazards (GENAH). Editor M. Hashimoto (Cham: Springer), 3–10. doi:10.1007/1345_2015_127
Kido, M., Fujimoto, H., Miura, S., Osada, Y., Tsuka, K., and Tabei, T. (2006). Seafloor displacement at Kumano-nada caused by the 2004 off Kii Peninsula earthquakes, detected through repeated GPS/Acoustic surveys. Earth Planet. Space 58, 911–915. doi:10.1186/BF03351996
Kido, M., Imano, M., Ohta, Y., Fukuda, T., Takahashi, N., Tsubone, S., et al. (2018). Onboard realtime processing of GPS-acoustic data for moored buoy-based observation. J. Disaster Res. 13 (3), 472–488. doi:10.1007/1345_2015_127
Kido, M., Osada, Y., Fujimoto, H., Hino, R., and Ito, Y. (2011). Trench-normal variation in observed seafloor displacements associated with the 2011 Tohoku-Oki earthquake. Geophys. Res. Lett. 38, L24303. doi:10.1029/2011GL050057
Sato, M., Ishikawa, T., Ujihara, N., Yoshida, S., Fujita, M., Mochizuki, M., et al. (2011). Displacement above the hypocenter of the 2011 tohoku-oki earthquake. Science 332, 1395. doi:10.1126/science.1207401
Spiess, F. N., Chadwell, C. D., Hildebrand, J. A., Young, L. E., Purcell, G. H., and Dragert, H. (1998). Precise GPS/Acoustic positioning of seafloor reference points for tectonic studies. Phys. Earth Planet. Inter. 108, 101–112. doi:10.1016/S0031-9201(98)00089-2
Spiess, F. N. (1985). Suboceanic geodetic measurements. IEEE Trans. Geosci. Remote Sens. Ge- 23, 502–510. doi:10.1109/TGRS.1985.289441
Sun, T., Wang, K., Iinuma, T., Hino, R., He, J., Fujimoto, H., et al. (2014). Prevalence of viscoelastic relaxation after the 2011 Tohoku-oki earthquake. Nature 514, 84–87. doi:10.1038/nature13778
Tomita, F., Kido, M., Ohta, Y., Iinuma, T., and Hino, R. (2017). Along-trench variation in seafloor displacements after the 2011 Tohoku earthquake. Sci. Adv. 3, e1700113. doi:10.1126/sciadv.1700113
Tomita, F., Kido, M., Honsho, C., and Matsui, R. (2019). Development of a kinematic GNSS-Acoustic positioning method based on a state-space model. Earth Planet. Space 71, 102. doi:10.1186/s40623-019-1082-y
Uchida, N., Iinuma, T., Nadeau, R. M., Bürgmann, R., and Hino, R. (2016). Periodic slow slip triggers megathrust zone earthquakes in northeastern Japan. Science 351, 488–492. doi:10.1126/science.aad3108
Watanabe, S., Sato, M., Fujita, M., Ishikawa, T., Yokota, Y., Ujihara, N., et al. (2014). Evidence of viscoelastic deformation following the 2011 Tohoku-Oki earthquake revealed from seafloor geodetic observation. Geophys. Res. Lett. 41, 5789–5796. doi:10.1002/2014GL061134
Yasuda, K., Tadokoro, K., Taniguchi, S., Kimura, H., and Matsuhiro, K. (2017). Interplate locking condition derived from seafloor geodetic observation in the shallowest subduction segment at the Central Nankai Trough. Jpn. Geophys. Res. Lett. 44, 3572–3579. doi:10.1002/2017GL072918
Yokota, Y., Ishikawa, T., Watanabe, S., Tashiro, T., and Asada, A. (2016). Seafloor geodetic constraints on interplate coupling of the Nankai Trough megathrust zone. Nature 534, 374–377. doi:10.1038/nature17632
Keywords: seafloor crustal deformation, GNSS-acoustic technique, wave glider, unmanned surface vehicle, 2011 tohoku-oki earthquake, Japan trench
Citation: Iinuma T, Kido M, Ohta Y, Fukuda T, Tomita F and Ueki I (2021) GNSS-Acoustic Observations of Seafloor Crustal Deformation Using a Wave Glider. Front. Earth Sci. 9:600946. doi: 10.3389/feart.2021.600946
Received: 31 August 2020; Accepted: 02 February 2021;
Published: 11 March 2021.
Edited by:
Keiichi Tadokoro, Nagoya University, JapanCopyright © 2021 Iinuma, Kido, Ohta, Fukuda, Tomita and Ueki. This is an open-access article distributed under the terms of the Creative Commons Attribution License (CC BY). The use, distribution or reproduction in other forums is permitted, provided the original author(s) and the copyright owner(s) are credited and that the original publication in this journal is cited, in accordance with accepted academic practice. No use, distribution or reproduction is permitted which does not comply with these terms.
*Correspondence: Takeshi Iinuma, aWludW1hQGphbXN0ZWMuZ28uanA=