- 1School of Earth and Space Sciences, University of Science and Technology of China, Hefei, China
- 2School of Atmospheric Science, Nanjing University of Information Science and Technology, Nanjing, China
- 3Baidu Inc., Beijing, China
- 4School of Atmospheric Sciences, Sun Yat-sen University, Key Laboratory of Tropical Atmosphere-Ocean System Ministry of Education, and Southern Marine Science and Engineering Guangdong Laboratory, Zhuhai, China
- 5State Key Laboratory of Numerical Modeling for Atmospheric Sciences and Geophysical Fluid Dynamics, Institute of Atmospheric Physics, Chinese Academy of Sciences, Beijing, China
Precipitation change, which is closely related to drought and flood disasters in China, affects billions of people every year, and the demand for subseasonal forecasting of precipitation is even more urgent. Subseasonal forecasting, which is more difficult than weather forecasting, however, has remained as a blank area in meteorological service for a long period of time. To improve the accuracy of subseasonal forecasting of China precipitation, this work introduces the machine learning method proposed by Hwang et al. in 2019 to predict the precipitation in China 2–6 weeks in advance. The authors used a non-linear regression model called local linear regression together with multitask feature election (MultiLLR) model and chosen 21 meteorological elements as candidate predictors to integrate diverse meteorological observation data. This method automatically eliminates irrelevant predictors so as to establish the forecast equations using multitask feature selection process. The experiments demonstrate that the pressure and Madden–Julian Oscillation (MJO) are the most important physical factors. The average prediction skill is 0.11 during 2011–2016, and there are seasonal differences in forecasting skills, evidenced by higher forecast skills of winter and spring seasons than summer and autumn seasons. The proposed method can provide effective and indicative guidance for the subseasonal prediction of precipitation in China. By adding another three factors, Arctic Oscillation (AO) index, Western North Pacific Monsoon (WNPM) index and Western North Pacific Subtropical High (WNPSH) index into the MultiLLR model, the authors find that AO can improve the forecast skill of China precipitation to the maximum extent from 0.11 to 0.13, followed by WNPSH. Moreover, the ensemble skill of our model and CFSv2 is 0.16. This work shows that our subseasonal prediction of China precipitation should be benefited from the MultiLLR model.
Introduction
Against the backdrop of global warming, relatively frequent extreme floods and droughts can not only cause heavy economic damages but also life of threaten people, especially in China who has the largest population in the world (Cai et al., 2017; Matthews et al., 2017). Subseasonal prediction of 2-weekly to 2-monthly time scale with good skill of China precipitation is associated with crop-planting choice, disaster reduction, and life safety. Furthermore, subseasonal prediction will fill the gap between weather forecasting and climate prediction (Vitart et al., 2012). Although the statistical method and dynamic models, two mainstream methods for subseasonal prediction, have shown a higher forecast skill (Li and Robertson, 2015; Zhu and Li, 2017), subseasonal prediction that depends on both local weather and global atmospheric circulations (Robertson et al., 2015; Vitart et al., 2017) is called “predictability desert” (Vitart et al., 2012) and still remains full of challenges. It is encouraging that previous research has found certain processes in the land, ocean, and atmosphere that would increase the possibility of subseasonal prediction. Sea surface temperature (SST), which affects the atmospheric circulation through air-sea heat flux and convection, can improve the intraseasonal variability forecast skill (Woolnough et al., 2007; Liang and Lin, 2018). Arctic Oscillation (AO) and the Madden–Julian Oscillation, which modulate the teleconnection patterns in Northern Hemisphere (NH) and the tropic convective activity, are two important sources of subseasonal predictability in the atmosphere process (Baldwin, 2003; Waliser et al., 2003; Black et al., 2017). Sea ice (Holland et al., 2011), snow cover (Sobolowski et al., 2010), and soil moisture (Koster et al., 2010) are the key factors of prediction on intraseasonal time scales. Besides, the summer precipitation intraseasonal variability (ISV) in China also serves as an important factor (Liu et al., 2020).
With the development of machine learning (ML) in meteorology, ML, as a new statistical technique, has been used in various forecast systems and helps to improve the forecast skill on different time scales (McGovern et al., 2014; Liu et al., 2016). ML improves the decadal climate predictions (Strobach and Bel, 2016). As for the subseasonal to seasonal (S2S) forecast, statistical techniques are noticed again due to the ML method (Cohen et al., 2019). ML makes precipitation nowcasting no longer be limited to two existing methods, radar echo extrapolation and numerical weather prediction (NWP) (Shi et al., 2015; Qiu et al., 2017). Besides, ML techniques are also able to improve the prediction and detection of severe weather events (McGovern et al., 2014; Liu et al., 2016).
Hwang et al. (2019) developed a forecasting system, which was a combination of two non-linear regression models based on ML, to improve the subseasonal prediction skills. To improve the accuracy of subseasonal prediction of China precipitation, the authors explore the effects of Hwang's forecasting system on them. The article is presented as follows. In the “Data and Methodology” section, the data and methodology are introduced. In the “Results” section, we provide the conclusions of the effects of Hwang's forecasting system on subseasonal forecasting of China precipitation. Finally, the last section offers the summary of the study.
Data and Methodology
Data
This study uses the newly released CN 05.1 daily precipitation dataset in China from 1961 to 2017, which is provided by the observing stations of the China National Climate Center (Wu and Gao, 2013). The daily precipitation is converted to a sum of ensuing 2 weeks. The authors choose daily reanalysis data from NCEP/NCAR Reanalysis dataset (Kalnay et al., 1996), and obtain temperature data at 2 m, relative humidity at the sigma level 0.995, pressure at the surface, and geopotential height at 10 hPa. By projecting the daily geopotential height anomalies into the leading EOF mode at 1,000 hPa, the daily AO index has been obtained from the Climate Prediction Center (CPC). Besides, the Madden–Julian Oscillation (MJO) and the Multivariate ENSO index (MEI) are obtained from the NOAA/Earth System Research Laboratory and the Australian Government Bureau of Meteorology. Phase and amplitude are extracted from the daily MJO data starting from 1974 on the target forecast date to characterize tropical convection (Hwang et al., 2019). MEI values combine six variables associated with ENSO from 1949, including SST, sea-level pressure, surface air temperature, zonal and meridional surface wind components, and sky cloudiness.
The sea ice concentration and the sea surface temperature (SST) are obtained from the optimum interpolation sea surface temperature (OISST) analysis of NOAA, and the top three principal components (PCs) over the Pacific (20°S–65°N, 150°E–90°W) from 1981 to 2017 are also used.
The Western North Pacific Monsoon (WNPM) index is defined as the difference of zonal wind between a southern region of 5°–15°N, 100°–130°E and a northern region of 20°–30°N, 110°–140°E at the level of 850 hPa, and U850 represents the zonal wind at 850 hPa (Wang and Fan, 1999; Wang et al., 2001). WNPM index is defined as follows:
Following the results of Lu (2002), this research selected two indexes to describe the location of Western North Pacific Subtropical High (WNPSH) by averaging the geopotential height anomalies at 850 hPa over two regions. WNPSH1 is meridional index, over the area of 120°–150°E, 30°–40°N, and WNPSH2 is zonal index, over the area of 110°–150°E, 10°–30°N. The authors select the two WNPSH indexes because of considering the advantages in well describing the precipitation pattern (Lu, 2002), and WNPSH stands for WNPSH1 and WNPSH2 below.
According to the forecast date of the local linear regression together with multitask feature election (MultiLLR) model, we got the forecast results for the total precipitation of CFSv2 Operational Forecasts 6-Hourly Products from 2011 to 2016.
The three-dimensional predictors, i.e., temperature data at 2 m, relative humidity at the sigma level 0.995, pressure at the surface, and total precipitation of CFSv2, were interpolated with a resolution of 1° by 1° and extracted over the forecast China region (14.75°N to 55.75°N, 69.75°E to 139.75°E). The top three principal components (PCs) of geopotential height at 10 hPa for all grid points globally, sea ice concentration, and sea surface temperature over the Pacific (20°S−65°N, 150°E−90°W) are also used. Except for MJO, which has the property of weekly time scales, all predictors used in this study were converted into the average of ensuing 2 weeks to be consistent with the sum precipitation of ensuing 2 weeks. The total precipitation of CFSv2 averaged during the next 14 days for each forecast date is also used.
MultiLLR Model
The authors take reference from the method of Hwang's MultiLLR model (Hwang et al., 2019) and put forward the physical factors mentioned earlier, which lagged on the basis of the frequency of the dataset, so as to provide the latest data and the temporal resolution and to add “ones” as a candidate regressor to represent intercept term that equals 1 for all data points in the total 21 candidate regression factors into the model, which is shown in the Y-axis of Figure 3. As shown in the Y-axis of Figure 3, the suffix anom of some candidate regression factors means that candidate regression factors are the anomalies based on daily climatology over the period of 1980–2010, and the “shift x” has a hysteresis characteristic from the measurement of the previous x days based on the data update time and the temporal resolution of measurement.
The MultiLLR model includes two parts, one part named local linear regression (LLR), by which we get regression coefficients for each grid point separately, and the other part called multitask backward stepwise feature selection, by which the relevant predictors are obtained from the candidate regressors through the performance forecast based on the spatial cosine similarity automatically. More algorithm details of the MultiLLR model can be referred from Hwang et al. (2019). Twenty-six forecast target dates for each year from 2011 to 2016 were made by the MultiLLR model, with a total of 156 times. For a forecast target date, the range of training data is from the first year when all the selected predictor data are commonly available to the year of the target date.
The authors choose spatial cosine similarity as the forecast skill, which is defined as:
where Y represents observed anomalies and Ŷ represents predicted anomalies; the anomalies were obtained by removing the climatological annual cycle during 1981–2010. We forecast every 2 weeks, resulting in 26 times forecast for each year. The forecast skill for annual mean or seasonal mean can be calculated by averaging the associated period.
Results
Figure 1A shows that the average prediction skill is 0.11 for all target dates, and the forecast skills vary from 2011 to 2016. The prediction skill for 2012 is highest with a value near 0.2, and it is around 0.15 for 2011 and 2016. The forecast skill for 2014, however, is −0.027, the lowest one among 6 years in the model. The 6 years can be divided into high-skill years, including 2011, 2012, 2013, and 2016, and low-skill years including 2014 and 2015.
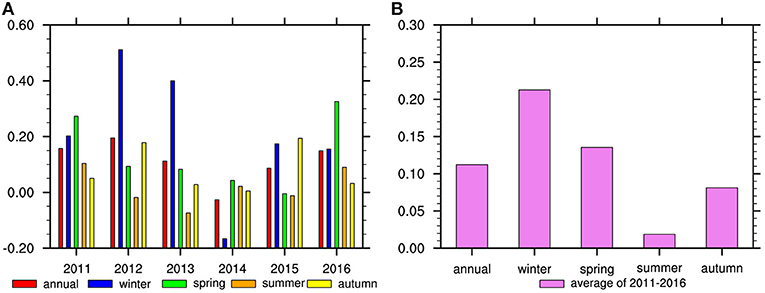
Figure 1. The prediction skill of (A) annual average (red bar), winter (blue bar), spring (green bar), summer (orange bar), and autumn (yellow bar) for each year of 2011–2016. (B) 2011–2016 averaged skills for annual mean and four seasons.
There are also seasonal differences in forecasting skills (Figure 1B). To be specific, the skills of winter and spring are higher than the annual average, especially that the winter skill is the highest and exceeds 0.21. On the contrary, the summer forecast skill is the lowest and near zero, and the skill of the autumn season is also lower than the annual average. The result shows that the model is poor in forecasting precipitation in summer and autumn seasons. As a result, the authors divide the four seasons into two types according to the annual mean values of the forecast skills, one type with winter and spring called Win-Spr, whose prediction skills are above the annual average, and the other type is to add summer and autumn together called Sum-Aut. Figure 2B shows that the prediction skills of Win-Spr are much higher than those of Sum-Aut in high-skill years. But in low-skill years, the skills of Win-Spr are lower than those of Sum-Aut. Moreover, not only the skills of Sum-Aut are <0.1 but also the changes are small during 2011–2016 (Figure 2A). In contrast, the Win-Spr prediction skills are high. Whether it is in the high-skill years or the low-skill years, the skills of Sum-Aut are nearly equal (Figure 2B). As for Win-Spr, the skill is very high in the high-skill years, but the skill in the low-skill years is lower than that of Sum-Aut. In summary, the annual average skill depends on that in Win-Spr, and the forecast model has good effect on winter and spring, compared with that on summer and autumn.
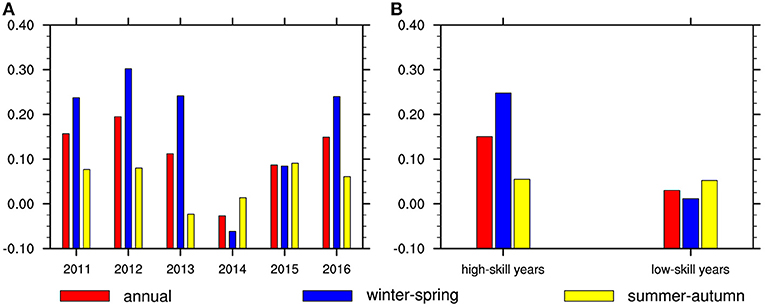
Figure 2. The prediction skill of (A) annual average (red bar), winter–spring season (blue bar), and summer–autumn (yellow bar) for each year of 2011–2016 and of (B) annual average (red bar), winter–spring season (blue bar), and summer–autumn (yellow bar) for high-skill years and low-skill years, respectively.
The authors put 21 candidate factors into MultiLLR model in the precipitation prediction task for weeks 3–4. The MultiLLR model chooses relevant features automatically from the 21 candidate factors for different target dates to improve the pertinence. According to the inclusion frequency of 21 candidate factors shown in Figure 3, different factors are selected with different frequencies, and the average is about 30 times. “Ones” that represent intercept term is the most frequently selected factor of them and has been used 66 times, followed by pressure (pres) and phase of MJO as the second and third, respectively. The selection frequency of temperature anomaly (tmp2m), which is the lowest, is only 7 times. Pressure and MJO are the most important physical factors in all 21 indexes for weeks 3–4 precipitation forecasting in China, inconsistent with many previous findings (He et al., 2011; Neena et al., 2014; Yao et al., 2015). Since MJO is a major source of intraseasonal predictability (Neena et al., 2014), Yao et al. (2015) found that the MJO makes effects on part of the variability of precipitation during November–March in South China, and as for the rest part which has nothing with MJO, and “cold surge” indicated by pressure at surface plays an important role. MJO is also found to be related to the subseasonal variability of precipitation over East Asian (He et al., 2011).
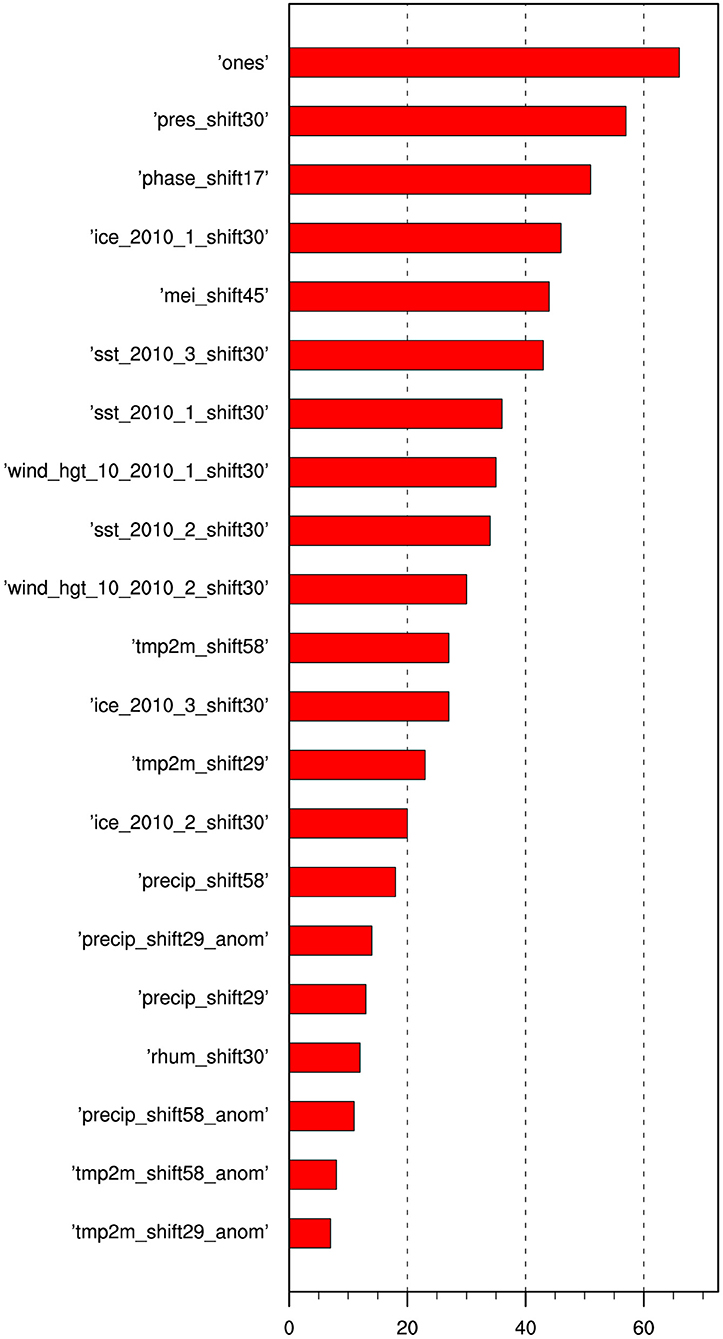
Figure 3. Candidate factors inclusion frequencies selected by local linear regression with multitask feature selection (MultiLLR) models for all target dates during 2011–2016.
Figure 4 shows the distribution of ISV activity, represented by the variance of forecast and observed precipitation for four patterns. The strong ISV activity is located over the Yangtze River and Southeastern China in the Win-Spr season and expands to Central China, Northern China, and Northeast China in the Sum-Aut season (Liu et al., 2020). The model for the forecast of ISV activity performs better in winter and spring of high-skill years, which is reflected in the forecast of value and range for the ISV activity over China, including strong ISV activity over the Yangtze River and Southeastern China. In the Win-Spr season of low-skill years, the prediction of strong ISV activity value is much weaker than the observed. The forecast ability of ISV activity in the Sum-Aut season of high-skill years is similar to that of low-skill years. Specifically, forecast patterns show weak ISV activity over Northern China and Northeast China in the Sum-Aut season, inconsistent with the observations. The predicted ISV activity of Win-Spr is better than that of Sum-Aut, consistent with the higher prediction skill of Win-Spr than Sum-Aut.
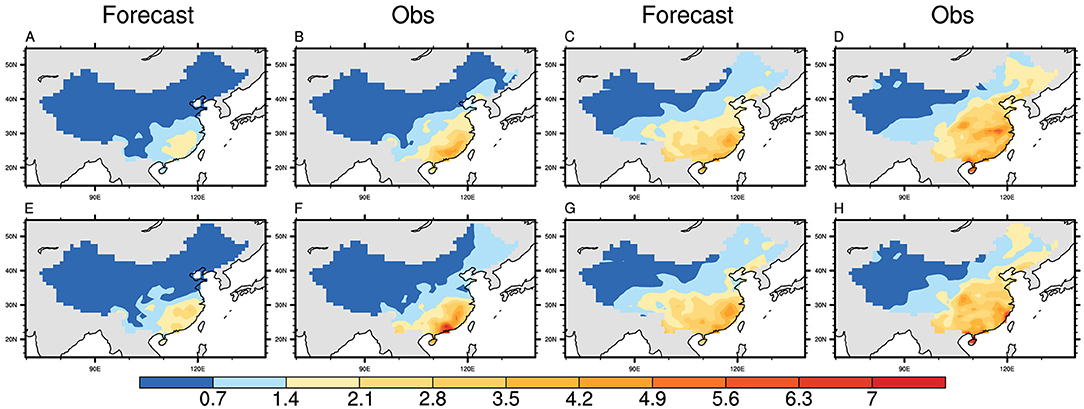
Figure 4. Standard deviation of MultiLLR model predicted and observed precipitation (mm/day) of Win-Spr (A,B,E,F) and Sum-Aut season (C,D,G,H) in the high-skill years (up panels) and low-skill years (low panels), the first and third columns represent the forecast, and the second and fourth columns represent the observation values.
According to the earlier classification, the seasonal mean forecasted pattern is near to negative anomalies, which show that the MultiLLR model mainly predicts a drought pattern for China precipitation no matter which season and year, except Win-Spr of high-skill years (Figure 5). Figure 5 means the seasonal mean of the predicted precipitation, not ISV, which indicates the average statement of the forecast. The observed seasonal mean precipitation of years with higher forecast skills is less than that of lower skills. For summer and autumn seasons, the positive anomalies of the observed truths are hard to be predicted whether in the high-skill years or low-skill years, which is consistent with the low prediction skills of summer and autumn mentioned above. Comparing the forecast results of summer with those of autumn, the forecasted pattern of Win-Spr can resolve the distribution of drought and flood in certain parts of China. Furthermore, in high-skill years, the model forecast results were consistent with precipitation truth values, except for Southeastern China. But in the low-skill years, the forecast results of Win-Spr were worse than those in high-skill years. As for the seasonal mean precipitation pattern in Southeastern China, the model can hardly predict the distribution with 21 candidate factors.
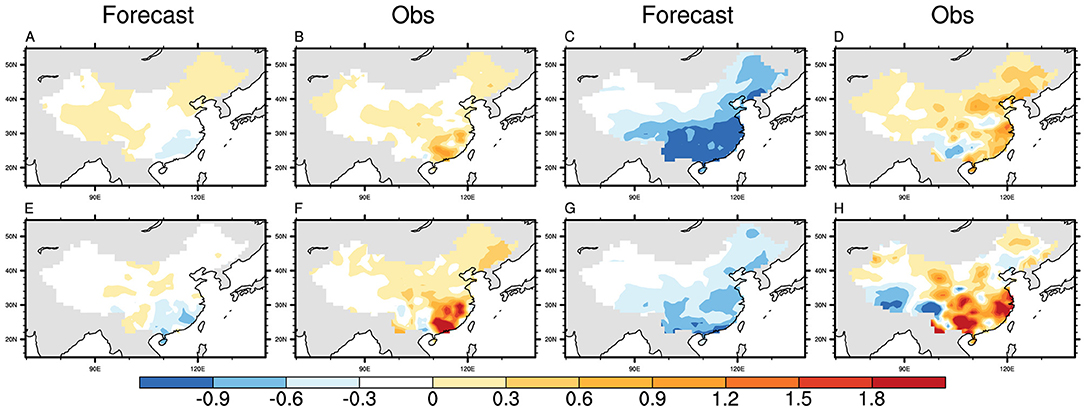
Figure 5. Seasonal-mean MultiLLR model prediction and observations (mm/day) of Win-Spr (A,B,E,F) and Sum-Aut (C,D,G,H) seasons in the high-skill years (up panels) and low-skill years (low panels). The first and third columns represent the forecast, and the second and fourth columns represent the observation.
Arctic Oscillation and the East Asian monsoon affect rainfall in China through changing the southern branch trough (SBT) and Middle East jet stream (MEJS) over the Bay of Bengal, and northward moisture transport and convergence, respectively (Ding et al., 2008; Mao et al., 2011). Many studies show that WNPSH is related to the subseasonal forecast of rainfall over China. The WNPSH has an important impact on the precipitation over Eastern China (Xiao-Xia et al., 2010), and the enhancement and location of the WNPSH were associated with two dominant subseasonal variation modes of the summer rainfall over the Yangtze River (Yang et al., 2010). Moreover, El Niño and La Niña cause the asymmetry of southern China rainfall anomalies in the winter half year, mainly through the intraseasonal oscillation of the WNPSH in lower troposphere (Zhang et al., 2015). Based on MultiLLR model with the 21 candidate factors mentioned earlier, the authors added WNPM index, two WNPSH indexes and AO index, which were notably related to rainfall in China, into the MultiLLR model to improve the subseasonal China precipitation forecast skills, namely, 21 index+AO model, 21 index+WNPM model, and 21 index+WNPSH model. It is encouraging that the model including the new factor improves the rainfall forecast skill, especially the forecast skills of 21 index+AO model is 0.13, 16.1% more than that of the 21 index model, and AO is used 36 times. Also, the predication skill is improved, due to WNPSH index being added to the 21 index model. WNPSH1 and WNPSH2, which describe WNPSH in two ways, were selected 31 times and 35 times, respectively. After adding WNPM, the forecasting skill is reduced to 0.1 during 2011–2016. This means that AO and WNPSH physical factors contribute to the forecast skills of China precipitation, but WNPM is a negative contribution factor. Figure 6 shows that the performance of forecasting skills improvement varies in each season. As for 21 index+AO model, all seasons forecast skills have improved except for the summer season, and the autumn forecast skill improves by the maximum extent among the four seasons by 49.1%, from 0.081 to 0.121. The 21 index+WNPSH model results of rainfall forecast skill in four seasons are consistent with those of the 21 index+AO model, but only improved in a slight way. In the winter, the 21 index+WNPSH model improves by the maximum extent. On the contrary, the 21 index+WNPM model only improves the autumn forecast skill. In summary, the comparison of the three newly added factors shows that AO is most conducive in improving the forecasting skills for MultiLLR model with the 21 candidate factors, followed by WNPSH. Moreover, WNPM is a negative factor in the MultiLLR model for subseasonal forecasting of China precipitation due to the annual average forecast skill of 0.1, less than that of the 21 index model, despite that it increases the autumn forecast skill. In a summary, the inclusion of AO mainly improves the prediction skill of spring and autumn, while the WNPSH mainly works to improve that of winter. The skill of summer, however, is weakened by the inclusion of these teleconnection factors.
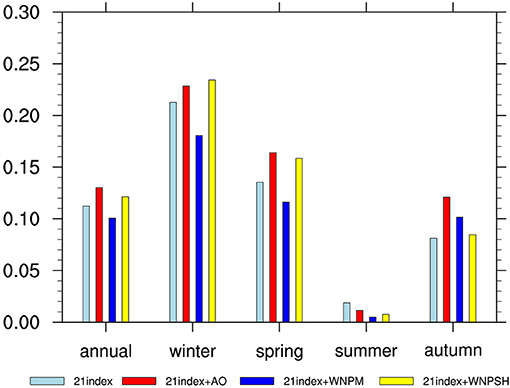
Figure 6. The prediction skill of annual average, winter season, spring season, summer, and autumn season of 2011–2016 for 21 index model (light blue bar), 21 index+AO model (red bar), 21 index+WNPM model (blue bar), and 21 index+WNPSH model (yellow bar).
This study not only evaluates the performances of MultiLLR models with different candidate predictors mentioned above, but also makes a comparison with the dynamical Climate Forecasting System (CFSv2) model. The forecast skill of CFSv2 is 0.11, compared to which the empirical model with 21 index+AO has a little better skill of 0.13. The ensemble model combining the 21 index+AO model and the CFSv2 by the same weight presents a much better skill of 0.16, and the skill improvement from 0.11 to 0.16 is above 80% confidence level, more than one standard deviation which has some reference significance. This shows that the MultiLLR model, a new statistical model, is useful to improve the subseasonal precipitation predication of China.
Also, authors try to improve the MultiLLR model by implementing the AutoKNN method proposed by Hwang et al. (2019), a local linear regression with the precipitation of 20 historical dates when the precipitation is the highest similarity to that of the target date. The negative skill of the AutoKNN model shows that subseasonal forecasting of China precipitation is hard from historical precipitation.
Summary
Due to unique local weather conditions and climate circulations, subseasonal forecast of precipitation 2 weeks to 2 months in advance remains full of challenges. This study takes advantage of the local linear regression with multitask feature selection model with 21 candidate factors in the precipitation prediction task for weeks 3–4 to predict the precipitation of China in the ensuing 2 weeks. The result shows that the average prediction skill is 0.11, and the skills for four seasons vary from each other. To be specific, the forecast skill of winter is the highest, more than 0.21, and the summer forecast skill is near zero. In general, the skills of winter and spring are much higher than those of summer and autumn (Figure 1). This means that the model is poor in forecasting precipitation in summer and autumn. Consistent with the results of the forecast skills are that the predicted ISV activity of Win-Spr is better than that of Sum-Aut. And the model can hardly predict the seasonal mean precipitation pattern in Southeastern China with 21 candidate factors.
Besides, on the basis of MultiLLR model with 21 candidate factors, the additional physical factors AO and WNPSH are helpful to improve the forecasting skills, especially in winter, spring, and autumn. In contrast, WNPM is a useless factor for China precipitation generally in the MultiLLR model. Therefore, it is necessary that AO and WNPSH are to be added into MultiLLR model as candidate factors to improve the prediction ability of subseasonal forecasting of China precipitation. Moreover, when authors combine the MultiLLR model and CFSv2 model by the same weight, the forecast skills improved from 0.11 to 0.16. This result shows that the MultiLLR model, a new statistical model, improves the accuracy of the dynamical CFSv2 model for the subseasonal forecasting of China precipitation.
In this study, we make a first try on the subseasonal prediction of China precipitation using a simple machine learning method. In the MultiLLR, only the local regression has been used, limiting the forecast skill. More suitable methods should be tested in the future.
Data Availability Statement
The original contributions presented in the study are included in the article/supplementary material, further inquiries can be directed to the corresponding author/s.
Author Contributions
ZY and FL designed the experiments. CW, ZJ, and ZY prepared the data and performed the experiments. CW led the writing of the manuscript. All authors discussed the analysis and results and contributed to the manuscript.
Funding
This work was supported by the Guangdong Major Project of Basic and Applied Basic Research (2020B0301030004), and the Natural Science Foundation of China (41975107).
Conflict of Interest
ZY is employed by the company Baidu Inc.
The remaining authors declare that the research was conducted in the absence of any commercial or financial relationships that could be construed as a potential conflict of interest.
References
Baldwin, M. P. (2003). Stratospheric memory and skill of extended-range weather forecasts. Science 301, 636–640. doi: 10.1126/science.1087143
Black, J., Johnson, N. C., Baxter, S., Feldstein, S. B., Harnos, D. S., and L' Heureux, M. L. (2017). The predictors and forecast skill of northern hemisphere teleconnection patterns for lead times of 3-4 weeks. Month. Weather Rev. 145, 2855–2877. doi: 10.1175/MWR-D-16-0394.1
Cai, W., Li, K., Liao, H., Wang, H., and Yu, L. (2017). Weather conditions conducive to Beijing severe haze more frequent under climate change. Nat. Clim. Change 7, 257–262. doi: 10.1038/nclimate3249
Cohen, J., Coumou, D., Hwang, J., Mackey, L., Orenstein, P., Totz, S., et al. (2019). S2S reboot: An argument for greater inclusion of machine learning in subseasonal to seasonal forecasts. Wiley Interdiscip. Rev. Clim. Change 10:e00567. doi: 10.1002/wcc.567
Ding, Y., Wang, Z., and Sun, Y. (2008). Inter-decadal variation of the summer precipitation in East China and its association with decreasing Asian summer monsoon. Part I: observed evidences. Int. J. Climatol. 28, 1139–1161. doi: 10.1002/joc.1615
He, J., Lin, H., and Wu, Z. (2011). Another look at influences of the Madden-Julian oscillation on the winter time East Asian weather. J. Geophys. Res. 116:D03109. doi: 10.1029/2010JD014787
Holland, M. M., Bailey, D. A., and Vavrus, S. (2011). Inherent sea ice predictability in the rapidly changing Arctic environment of the community climate system model version 3. Clim. Dyn. 36, 1239–1253. doi: 10.1007/s00382-010-0792-4
Hwang, J., Orenstein, P., Cohen, J., Pfeiffer, K., and Mackey, L. (2019). “Improving subseasonal forecasting in the western U.S. with machine learning,” in The 25th ACM SIGKDD Conference on Knowledge Discovery and Data Mining (KDD'19), August 4-8, Anchorage (New York, NY: ACM). doi: 10.1145/3292500.3330674
Kalnay, E., Kanamitsu, M., Kistler, R., Collins, W., Deaven, D., Gandin, L., et al. (1996). The NCEP/NCAR 40-year reanalysis project. Bull. Am. Meteorol. Soc. 77, 437–472. doi: 10.1175/1520-0477(1996)077<0437:TNYRP>2.0.CO;2
Koster, R. D., Mahanama, S. P. P., Yamada, T. J., Balsamo, G., Berg, A. A., Boisserie, M., et al. (2010). The contribution of land surface initialization to subseasonal forecast skill. Geophys. Res. Lett. 37, 489–496. doi: 10.1029/2009GL041677
Li, S., and Robertson, A. W. (2015). Evaluation of submonthly precipitation forecast skill from global ensemble prediction systems. Month. Weather Rev. 143, 2871–2889. doi: 10.1175/MWR-D-14-00277.1
Liang, P., and Lin, H. (2018). Sub-seasonal prediction over East Asia during boreal summer using the ECCC monthly forecasting system. Clim. Dyn. 50, 1007–1022. doi: 10.1007/s00382-017-3658-1
Liu, F., Ouyang, Y., Wang, B., Yang, J., Ling, J., and Hsu, P. C. (2020). Seasonal evolution of the intraseasonal variability of China summer precipitation. Clim. Dyn. 54, 4641–4655. doi: 10.1007/s00382-020-05251-0
Liu, Y., Racah, E., Correa, J., Khosrowshahi, A., Lavers, D., Kunkel, K., et al. (2016). Application of deep convolutional neural networks for detecting extreme weather in climate datasets. arXiv [Preprint]. arXiv:1605.01156. doi: 10.475/123_4
Lu, R. (2002). Indices of the summertime Western North Pacific subtropical high. Adv. Atmos. Sci. 19, 1004–1028. doi: 10.1007/s00376-002-0061-5
Mao, R., Gong, D. Y., Yang, J., and Bao, J. D. (2011). Linkage between the arctic oscillation and winter extreme precipitation over Central-Southern China. Clim. Res. 50, 187–201. doi: 10.3354/cr01041
Matthews, T. K., Wilby, R. L., and Murphy, C. (2017). Communicating the deadly consequences of global warming for human heat stress. Proc. Natl. Acad. Sci. U.S.A. 114, 3861–3866. doi: 10.1073/pnas.1617526114
McGovern, A., Gagne, D. J., Williams, J. K., Brown, R. A., and Basara, J. B. (2014). Enhancing understanding and improving prediction of severe weather through spatiotemporal relational learning. Mach. Learn. 95, 27–50. doi: 10.1007/s10994-013-5343-x
Neena, J. M., Lee, J. Y., Waliser, D., Wang, B., and Jiang, X. (2014). Predictability of the Madden-Julian oscillation in the intraseasonal variability hindcast experiment (ISVHE). J. Clim. 27, 4531–4543. doi: 10.1175/JCLI-D-13-00624.1
Qiu, M., Zhao, P., Zhang, K., Huang, J., Shi, X., Wang, X., et al. (2017). “A short-term rainfall prediction model using multi-task convolutional neural networks,” in Data Mining (ICDM), IEEE International Conference on IEEE (New Orleans, LA), 395–404. doi: 10.1109/ICDM.2017.49
Robertson, A. W., Kumar, A., Pea, M., and Vitart, F. (2015). Improving and promoting subseasonal to seasonal prediction. Bull. Am. Meteorol. Soc. 96, ES49–ES53. doi: 10.1175/BAMS-D-14-00139.1
Shi, X., Chen, Z., Wang, H., Yeung, D. Y., Wong, W. K., and Woo, W. C. (2015). Convolutional LSTM network: a machine learning approach for precipitation nowcasting. Adv. Neural Inform. Process. Syst. 28, 802–810. doi: 10.1007/978-3-319-21233-3_6
Sobolowski, S., Gong, G., and Ting, M. (2010). Modeled climate state and dynamic responses to anomalous North American snow cover. J. Clim. 23, 785–799. doi: 10.1175/2009JCLI3219.1
Strobach, E., and Bel, G. (2016). Decadal climate predictions using sequential learning algorithms. J. Clim. 29, 3787–3809. doi: 10.1175/JCLI-D-15-0648.1
Vitart, F., Ardilouze, C., Bonet, A., Brookshaw, A., Chen, M., Codorean, C., et al. (2017). The Subseasonal to Seasonal (S2S) prediction project database. Bull. Am. Meteorol. Soc. 98, 163–173. doi: 10.1175/BAMS-D-16-0017.1
Vitart, F., Robertson, A. W., and Anderson, D. L. T. (2012). Subseasonal to seasonal prediction project: bridging the gap between weather and climate. Bull. World Meteorol. Organ. 61, 23–28. doi: 10.1029/2018JD029375
Waliser, D. E., Lau, K. M., Stern, W., and Jones, C. (2003). Potential predictability of the Madden-Julian oscillation, Bull. Am. Meteorol. Soc. 84, 33–50. doi: 10.1175/BAMS-84-1-33
Wang, B., and Fan, Z. (1999). Choice of South Asian summer monsoon indices. Bull. Amer. Meteor. Soc. 80, 629–638. doi: 10.1175/1520-0477(1999)080<0629:COSASM>2.0.CO;2
Wang, B., Wu, R., and Lau, K. M. (2001). Interannual variability of Asian summer monsoon: Contrast between the Indian and western North Pacific-East Asian monsoons. J. Clim. 14, 4073–4090. doi: 10.1175/1520-0442(2001)014<4073:IVOTAS>2.0.CO;2
Woolnough, S. J., Vitart, F., and Balmaseda, M. A. (2007). The role of the ocean in the Madden-Julian Oscillation: implications for the MJO prediction. Quart. J. Meteor. Soc. 133, 117–128. doi: 10.1002/qj.4
Wu, J., and Gao, X. (2013). A gridded daily observation dataset over China region and comparison with the other datasets. Chin. J. Geophys. 56, 1102–1111. doi: 10.6038/cjg20130406
Xiao-Xia, C., Zheng-Guo, S., and Wan-Li, L. (2010). Relationships between Western Pacific subtropical high and seasonal precipitation in Eastern China. Meteorol. Res. 1, 81–86.
Yang, J., Wang, B., and Qing, B. (2010). Biweekly and 21–30-Day Variations of the Subtropical summer monsoon rainfall over the lower reach of the Yangtze river basin. J. Clim. 23, 1145–1159. doi: 10.1175/2009JCLI3005.1
Yao, Y., Lin, H, and Wu, Q. (2015). Subseasonal variability of precipitation in China during boreal winter. J. Clim. 28, 6548–6559. doi: 10.1175/JCLI-D-15-0033.1
Zhang, R. H., Li, T. R., Wen, M., and Liu, L. K. (2015). Role of intraseasonal oscillation in asymmetric impacts of El Niño and La Niña on the rainfall over Southern China in boreal winter. Clim. Dyn. 45, 559–567. doi: 10.1007/s00382-014-2207-4
Keywords: subseasonal forecasting, machine learning, MultiLLR, China precipitation, intraseasonal variability, seasonal cycle
Citation: Wang C, Jia Z, Yin Z, Liu F, Lu G and Zheng J (2021) Improving the Accuracy of Subseasonal Forecasting of China Precipitation With a Machine Learning Approach. Front. Earth Sci. 9:659310. doi: 10.3389/feart.2021.659310
Received: 27 January 2021; Accepted: 16 April 2021;
Published: 12 May 2021.
Edited by:
Wei Zhang, Utah State University, United StatesReviewed by:
June-Yi Lee, Pusan National University, South KoreaXiaojing Jia, Zhejiang University, China
Copyright © 2021 Wang, Jia, Yin, Liu, Lu and Zheng. This is an open-access article distributed under the terms of the Creative Commons Attribution License (CC BY). The use, distribution or reproduction in other forums is permitted, provided the original author(s) and the copyright owner(s) are credited and that the original publication in this journal is cited, in accordance with accepted academic practice. No use, distribution or reproduction is permitted which does not comply with these terms.
*Correspondence: Zhaohui Yin, eWluemhhb2h1aTAxQGJhaWR1LmNvbQ==; Fei Liu, bGl1ZmVpMjZAbWFpbC5zeXN1LmVkdS5jbg==
 Cen Wang
 Zhaoying Jia
 Zhaohui Yin3*
 Fei Liu
 Gaopeng Lu
 Jianqiu Zheng