 Yan Yan
 Shuyue Ma3
- 1Key Laboratory of High-Speed Railway Engineering, Ministry of Education/School of Civil Engineering, Southwest Jiaotong University, Chengdu, China
- 2Institute of Geographic Sciences and Natural Resources Research, Chinese Academy of Sciences, Beijing, China
- 3College of Urban and Environmental Sciences, Northwest University, Xi’an, China
- 4Sinopec Marketing South China Branch, Guangzhou, China
Western China is rich in oil and gas resources, and many oil and gas pipelines are under construction or have been completed. However, many water-related natural hazards, such as landslides, collapses, rockfalls, and debris flows, have developed in the areas passed through by oil and gas pipelines and seriously threaten the operational safety of these pipelines. Therefore, it is urgent to carry out large-scale identification and assessment of pipeline geological hazards. At present, conventional on-site investigation, evaluation, monitoring, and early warning methods are difficult to apply for rapid identification and evaluation of pipeline geological hazards across large-scale areas. Based on this, this study takes the pipeline of Sinopec Marketing South China Branch in Yunnan Province as the research area. In this research, unmanned aerial vehicle (UAV) and photogrammetry technology were used to quickly and accurately obtain multi-phase images of an oil pipeline passing through the study area, and the images were post-processed to obtain multi-phase high-resolution, high-precision digital orthophoto maps and digital terrain models (DTMs) to identify landform changes and deformation. The focus of this research is to propose a set of technical methods for UAV point cloud filtering. The DTMs obtained based on this method can effectively identify unstable areas of oil pipelines. In addition, we have carried out numerical simulations under different motion scenarios in unstable regions, providing scientific support for future geological hazard prevention and mitigation and engineering practices in oil pipeline areas.
Introduction
China’s oil and gas pipeline construction is in a period of rapid development. By the end of 2019, the total mileage of China’s oil and gas pipelines had reached 13.9 × 10⁴ km; these pipelines are especially extensive in Western China, which is rich in oil and gas resources, and a large number of oil and gas pipelines are under construction or have been completed (Gao et al., 2020). The steep terrain and complex geological environment in Western China have caused a large number of geological hazards such as landslides, collapses, rockfalls, and debris flows (Yan et al., 2019a, b, 2020a,b, 2021), threatening the safe operation of oil and gas pipelines. Many pipeline geological hazards have occurred in this area and have caused serious losses. For example, the landslide on December 3 in Jianyang, Sichuan caused oil pipeline leakage in 2013 (Hua, 2013). The event on July 2 in 2017 was caused by the combustion and explosion of a gas pipeline in Qinglong County, Guizhou, which resulted in the deaths of eight people and injuries of 35 people (Wang and Pan, 2017). In 2020, an explosion occurred after a gas pipeline in Suide County, Shaanxi Province, broke on August 5, causing more than 10 houses to collapse and many cars to be buried (Tang, 2020). Thus, there is an urgent need to carry out large-scale identification and assessment of pipeline geological hazards, which will help in the monitoring, early warning, prevention, and control of pipeline geological hazards in the future.
Currently, pipeline geological hazard identification and assessment research is mainly carried out through on-site investigation, assessment, monitoring, and early warning methods (Yan et al., 2019b). Information is collected on the topography, geomorphology, geological structure, lithology, hydrology, and residential areas in the area where the pipeline passes through on-site surveys, and the risks and scope of the impacts of geological hazards around the pipeline are then assessed (Topal and Akin, 2009). However, this approach is time-consuming and labor-intensive, as well as difficult to implement in steep terrain (Keay-Bright and Boardman, 2009; Vergari et al., 2013); consequently, it is not suitable for large-scale pipeline geological hazard assessment. With the rapid development of “Internet of Things” technology, pipeline geological hazard monitoring and early warning research have made a certain degree of progress (Leynes et al., 2005; Li et al., 2009; Vasconez et al., 2010). Monitoring and early warning mainly focus on various parameters related to the deformation and destruction associated with the hazard, such as rainfall, surface and deep displacement, inclination, crack width, and soil moisture content. Through long-term monitoring and analysis of abnormal changes in parameters, the occurrence of pipeline geological hazards can be effectively identified and early warnings issued (Vasconez et al., 2010). In recent years, with the development of artificial intelligence algorithms, pipeline geological hazard monitoring and early warning have gradually moved toward artificial intelligence-based approaches (Cao et al., 2012; Yan et al., 2019b). Although these monitoring and early warning studies are becoming more mature and effective, the monitoring equipment is often limited to identified pipeline geological hazard areas and cannot yet meet the needs of large-scale identification of pipeline geological hazards. All in all, these two methods of on-site investigation, evaluation, monitoring, and early warning are difficult to apply for rapid identification and evaluation of pipeline geological hazards across large-scale areas.
With the rapid development of unmanned aerial vehicle (UAV) technology, the use of a UAV equipped with measurement equipment can flexibly and conveniently obtain high-precision and high-resolution images, and the cost is relatively low (Cook, 2017; Rusnák et al., 2018; Alan et al., 2019). Through geographic information technology processing, high-resolution images obtained by UAV can be converted into formats such as digital surface models (DSMs), digital orthophoto maps (DOMs), and digital terrain models (DTMs), which can be used to evaluate landform changes and geological hazards (Yutaka and Kawahara, 2016; Pineux et al., 2017; Meinen and Robinson, 2020), such as landslides (Niethammer et al., 2009, 2012; Hu et al., 2018; Zhou et al., 2021), volcanic eruptions (Emanuela et al., 2019), coastal erosion (Delacourt et al., 2009; Gonçalves and Henriques, 2015), valley erosion (Gómez-Gutiérrez et al., 2014), and glacier dynamics (Immerzeel et al., 2014), across large areas. The above-mentioned related studies have shown that multi-phase UAV high-resolution images can clearly record the deformation of a single landslide, deposition processes, and even the development of slope surface cracks and micro-topography (Niethammer et al., 2012; Hu et al., 2019). For the large-scale situation of multiple hazards, the high-precision terrain data obtained by UAV technology can also be used to explore the spatial distribution of hazards and the development patterns of hazard chains (Maciej et al., 2017; Hu et al., 2019, 2020). In summary, UAV technology has a strong foundation in the study of large-area geomorphological changes and surface processes, which provides the possibility for UAV technology to be applied for large-scale identification and assessment of pipeline geological hazards.
However, for areas where potential geological hazards have been identified through UAV monitoring, we pay more attention to the impact of the current degree of hazard development on the pipeline itself, as well as the mechanical behavior, deformation, and damage characteristics of the pipeline during the continued development of subsequent hazards. In recent years, with the development of numerical methods, the use of finite element methods to study the mechanical behavior of pipelines under unstable slopes has made good progress (Cocchetti et al., 2009a, b; Bruschi et al., 2010; Yuan et al., 2012; Gao et al., 2013). By assuming that the pipeline is a buried beam model, a soil spring model, or an inelastic contact model to consider the interaction between the pipe and the soil, the displacement and stress distribution characteristics of the pipeline under different crossing modes (such as transverse, longitudinal, and diagonal) have been fully explained (Di Frisco et al., 2004; Cocchetti et al., 2009a, b). On this basis, considering the influence of slope structure parameters (slope width, slope, and displacement) and pipeline process parameters (burial depth, diameter-thickness ratio, internal pressure) on the mechanical characteristics of the pipeline, and expanding the multi-condition finite element method simulation, the effect of slopes on pipelines has been discussed in a more comprehensive and detailed manner (Lollino et al., 2010; Zhang et al., 2016, 2018). After mastering the law of pipe mechanics response, the research work gradually turned to the prediction of pipeline safety, such as: discussing the maximum safe length of the pipeline under the above-mentioned multiple working conditions, proposing a prediction formula for the maximum stress of the pipeline, and using actual monitoring data to verify related reliability of conclusions (Ishii et al., 2012; Luo et al., 2014; Li et al., 2016; Vasseghi et al., 2021). In summary, the slope–pipe coupling finite element simulation and monitoring data combined analysis is an effective method for pipeline safety assessment in unstable slope areas.
Based on this, this paper uses Phantom 4 RTK UAV to carry out geomorphological change monitoring in the oil pipeline area in Yunnan Province, and proposes a complete set of UAV data pre-processing and post-processing technical solutions, trying to refine the processed UAV point cloud data to generate a more accurate DTM and realize the identification of unstable areas in this area through GCD (Geomorphic Change Detection) 7.0 software. Subsequently, based on geological engineering practice and future hazards prevention and mitigation considerations, we used the slope–pipe coupling finite element simulation method to perform numerical values of surface displacement, pipeline stress change, and pipeline displacement under different motion scenarios in the identified unstable area. This research explores the combination of UAV technology and numerical simulation to provide scientific support for hazard identification, risk assessment, and hazard prevention and mitigation in the oil pipeline area.
Study Site
This study area is located in a place in eastern Eshan Yi Autonomous County, Yuxi City, Yunnan Province. Eshan County is characterized by a plateau landform, with a long and narrow terrain in the east that widens in the west. The terrain is high in the northeast and low in the southwest. The eastern part is cut by the Qujiang River, forming a landform with alternating mountains and valleys from northwest to southeast. The townships of Chahe, Tadian, and Furangpeng in the central part of county are limestone areas with relatively well-developed karsts, with many caves and depressions. In the west and north, the mountains are high and steep, the valleys are deep and narrow, and the terrain is broken. The study area has a subtropical–plateau mountain monsoon climate, with an average annual temperature of 18°C and annual rainfall of 800 mm. The altitude of this study area is between 1,556 and 1,648 m. The land use types in the area include cultivated land, forest land, residential land, and transportation land. In addition, this area is also passed through by a Sinopec refined oil pipeline (Figure 1A). The QR code in Figure 1B can be scanned to browse a panorama of the area.
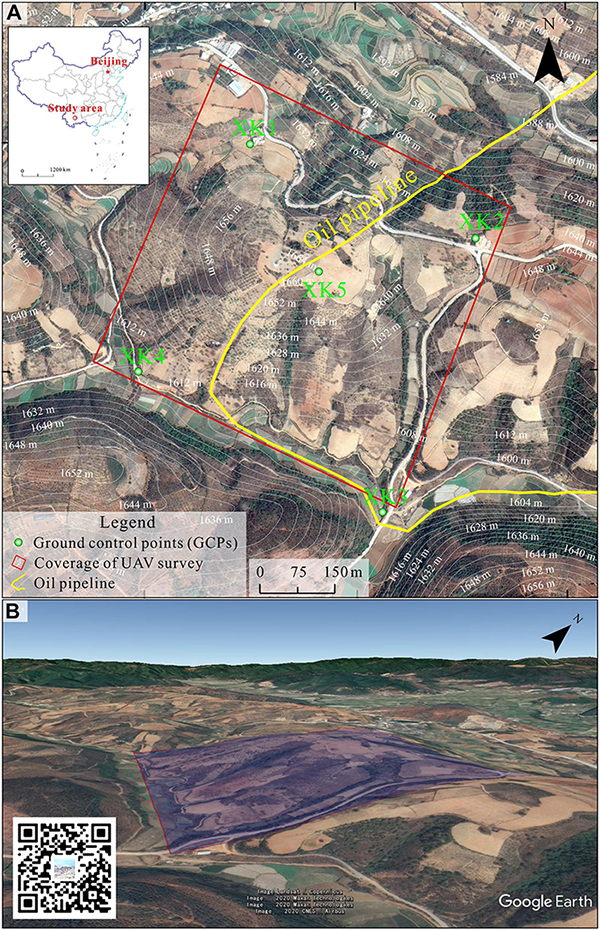
Figure 1. Location map of the study area. (A) Location map of Sinopec oil pipeline in the study area and (B) Panorama of the study area.
Figure 2 shows the 1:200,000 regional geological map of the study area. It can be seen from the figure that the geological structure of this area is complex, and the active faults are extremely developed (the number is as many as 10), among which the most famous is Qujiang Major Fault. According to historical records, there were seven major earthquakes in Eshan County during the 275 years from 1695 AD to 1970 AD. The last major earthquake (magnitude 7.7 on the Richter scale) occurred at 1:00:34 on January 5, 1970. The epicenter was located in Meizishu Village, Xiaojie Town, only 3.8 km southeast of the study area (Figure 2). The extreme earthquake zone of this earthquake is distributed along the Qujiang fault in a long and narrow strip of northwest direction in the Qujiang River Valley, with a long axis of about 52 km. After the earthquake, many ground fissures were distributed along the Qujiang fault, forming a huge ground fissure zone with a total length of nearly 60 km. The oil pipelines in this study area crossed several fault zones. The activities of these fault zones pose a huge threat to the safe operation of the oil pipelines and at the same time damage the stability of the slope.
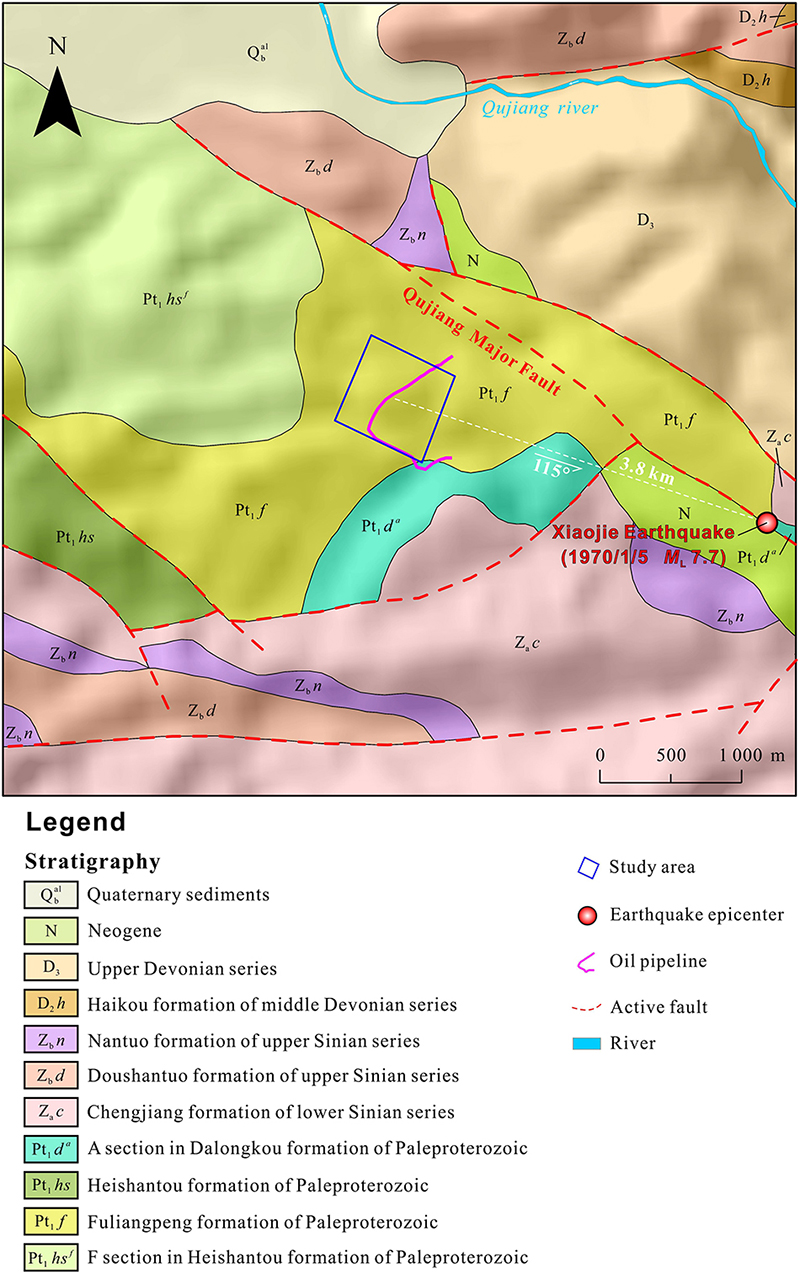
Figure 2. Regional geological map of the study area.
Materials and Methods
Data Surveying
GCP Arrangement and Measurement
Before the UAV monitoring in the study area (Figure 3A), we carried out equipment installation and equipment measurement parameter adjustment for the five control points (Figures 3B–G). The measurement equipment used in this study mainly included a Phantom 4 RTK UAV and Zhonghui i50 RTK equipment. The Phantom 4 RTK UAV was mainly used to obtain images in the study area (Figure 3H); these images have 20 million effective pixels (20.48 million total pixels). The Zhonghui i50 RTK equipment was mainly used to measure the coordinates of control points and provide RTK differential signals for the UAV. The horizontal accuracy of this equipment was ±(10 + 1 × 10⁻⁶ × D) mm, and the elevation accuracy was ±(20 + 1 × 10⁻⁶ × D) mm. For UAV monitoring, UAV GCPs are necessary, because the coordinates of GCPs can be used to generate more accurate absolute coordinate models (Lucieer et al., 2014; Benoit et al., 2015; Pineux et al., 2017). To better control image distortion and improve mapping accuracy, we deployed five ground control points (Figure 1A) every time we conducted UAV operations in the research area. These coordinates were measured by the Zhonghui i50 RTK equipment (Figure 3D).
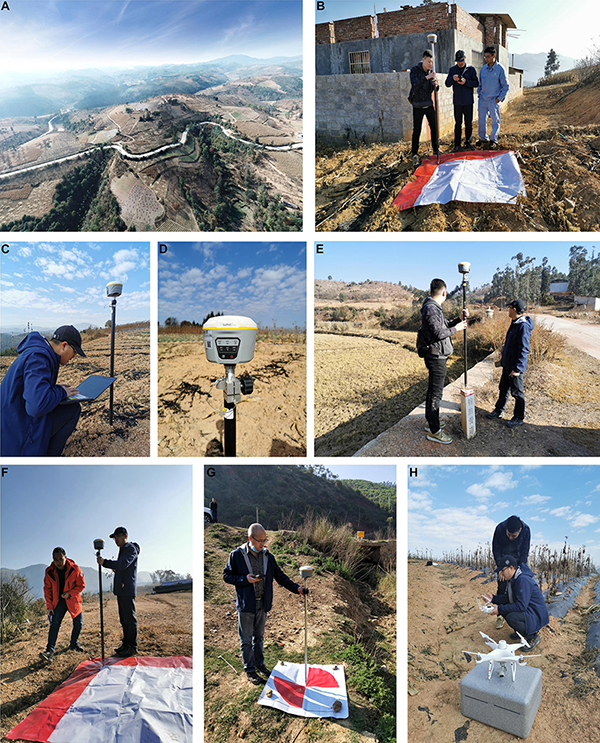
Figure 3. UAV phase control point layout and measurement operations: (A) UAV photo of the study area, (B–G) Control points measurement, and (H) Phantom 4 RTK UAV used in this study.
UAV Route Planning and Flight Period
First, we set up the RTK measurement base station, logged in to the Qianxun location service account, and used the laptop WIFI LAN to set the base station parameters, including base station longitude, latitude, elevation, mode, and other parameters (Figure 4A). Second, the UAV survey area was delimited in advance on Google Earth, and the ASTER 30 m DEM of the study area was downloaded. The UAV survey area and 30 m DEM were imported into the DJI flight control software. The ground-like flight mode was set in the software, the flight altitude was set to 100 m, the course overlap ratio was set to 70 or 80%, and the camera shooting mode was selected as timed shooting. The flight control software automatically generated flight routes according to these set parameters (Figure 4B). According to the parameters set in the flight control software, the positions of ground control points and UAV are shown in Figure 4C. Finally, a flat location was selected as the take-off point of the UAV to perform the automatic flight measurement task. Because the main purpose of this research was to use multi-temporal UAV data to monitor surface changes, we conducted three unmanned operations on December 19, 2019, April 20, 2020, and June 22, 2020. For field operations, the relevant parameter settings for each UAV operation are shown in Table 1.
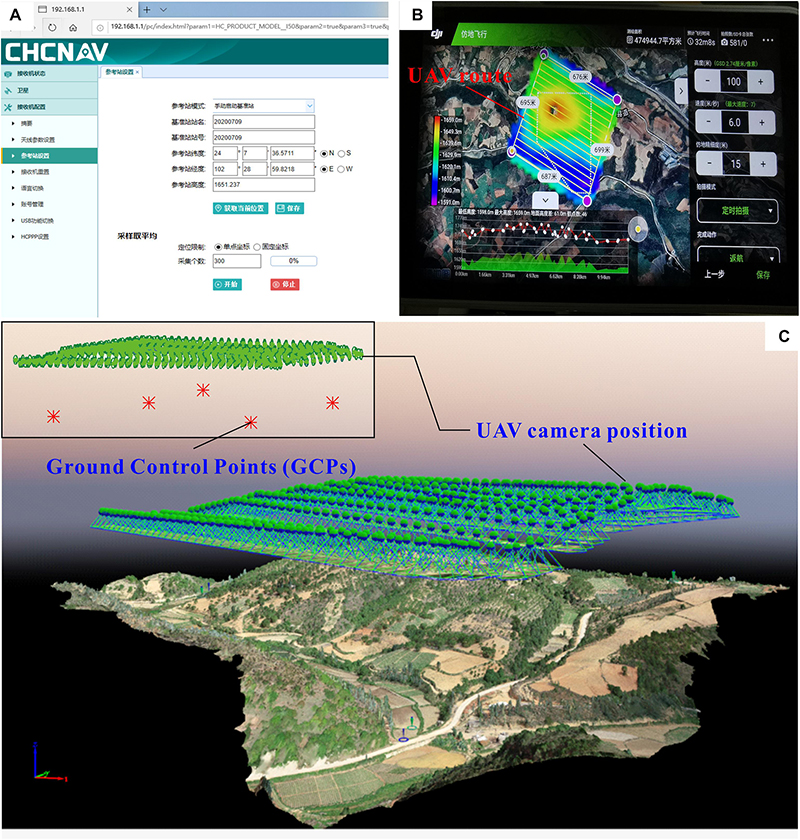
Figure 4. UAV route planning: (A) Parameter setting of measuring base station, (B) Route planning interface of UAV ground station, and (C) Camera location, GCPs, and 3D model.
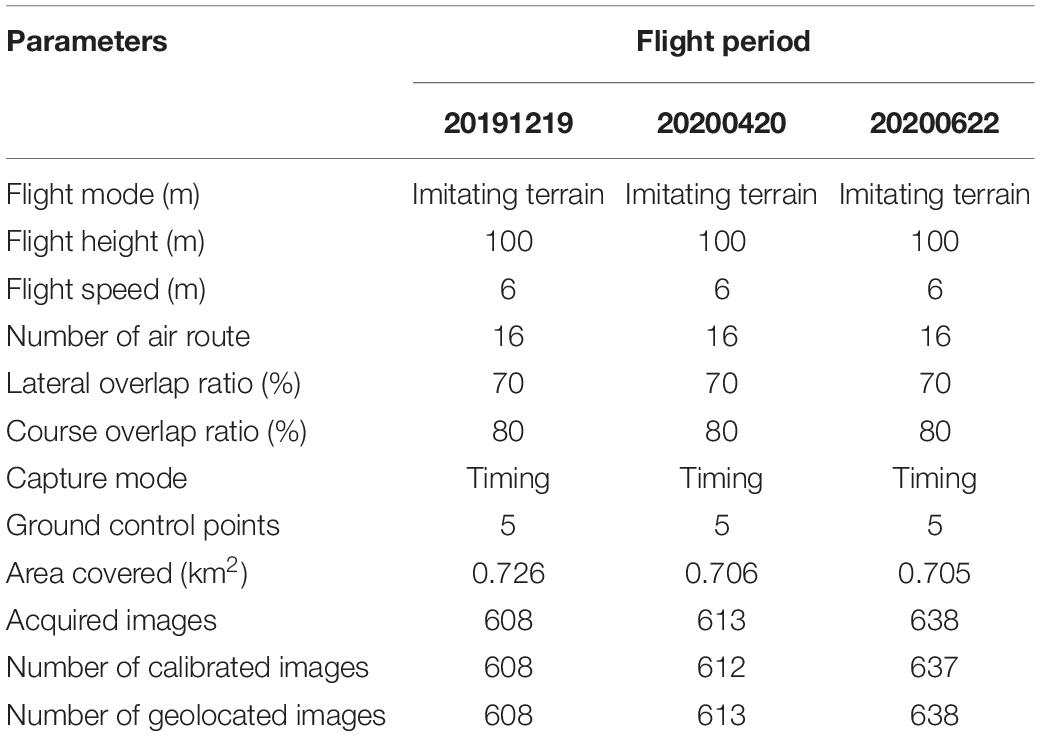
Table 1. Final parameter settings of UAV surveys.
UAV Data Pre-processing
The pre-processing of UAV data was completed in the Pix4D software. The general process was as follows: the original data were obtained → the project was built and the data were imported → fast processing and inspection were performed → ground control points were established → fully automatic aerial triangulation was applied → the DSM was generated → the DOM was generated → results were output (Figure 5). Figure 6 presents a screenshot of Pix4D during UAV data processing. We mapped the high-resolution DOMs and DSMs produced by Pix4D in ArcGIS 10.5. The spatial resolution of the original DOMs and DSMs was about 3.7 cm. Figures 7A–F shows the preliminary three-phase digital orthophoto map (DOM) and digital surface model (DSM) obtained by the pre-processing of UAV data.

Figure 5. Flowchart of UAV data pre-processing.
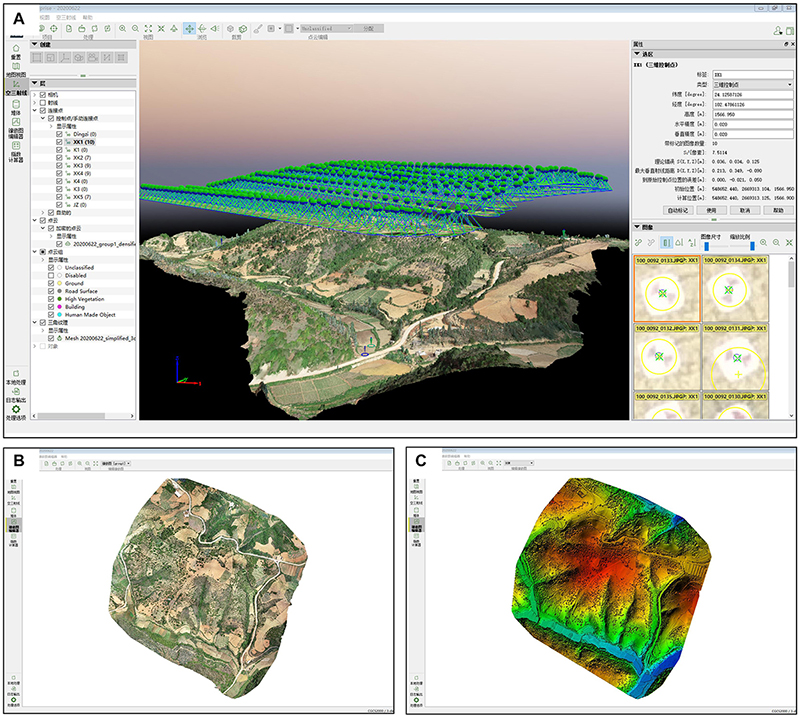
Figure 6. Screenshots of UAV data processing: (A) Pix4D working window, (B) DOM generated by Pix4D, and (C) DSM generated by Pix4D.
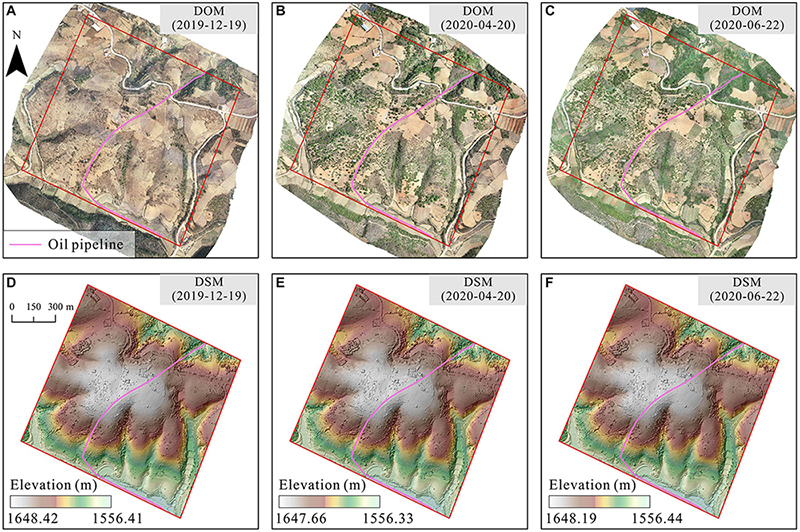
Figure 7. Preliminary products of UAV photogrammetry. (A–C) Digital Orthophoto Maps (DOMs) of UAV in December 2019, April 2020, June 2020 and (D–F) Digital Surface Models (DSMs) of UAV in December 2019, April 2020, June 2020.
UAV Data Post-processing
The DSM data obtained by UAV data processing in the early stage cannot be directly used for surface change detection because it contains non-terrain elements such as vegetation, buildings, and cars. Therefore, it is necessary to further filter the UAV point cloud to obtain the real digital terrain model (DTM). At present, the point cloud filtering generated by UAV optical cameras has always been a difficult problem in the world (Wang et al., 2015; Tan et al., 2018; Yilmaz et al., 2018; Gruszczyński et al., 2019; Zeybek and Şanlıoğlu, 2019). This research mainly refers to the calculation formula of VDVI (Visible-band Difference Vegetation Index) proposed by Wang et al. (2015) in vegetation point cloud filtering:
where ρgreen, ρred, and ρblue denote the color values of green, red, and blue, respectively.
In order to better extract the vegetation from the VDVI map, we use the histogram entropy threshold method to determine the vegetation threshold. This study determined that the part with VDVI value > 0.076 is vegetation. We import the extracted vegetation into Meptek I-Site Studio for vegetation point cloud filtering. In addition, we also manually filtered other non-terrain point clouds, such as cars, buildings, people, etc., in the Meptek I-Site Studio software. Finally, import the obtained topographic point cloud into ArcGIS 10.5 to generate DTM. Figure 8 is the technical framework diagram of the UAV point cloud data processing-DTM production proposed in this research. Figure 9 is an example of UAV point cloud filtering.
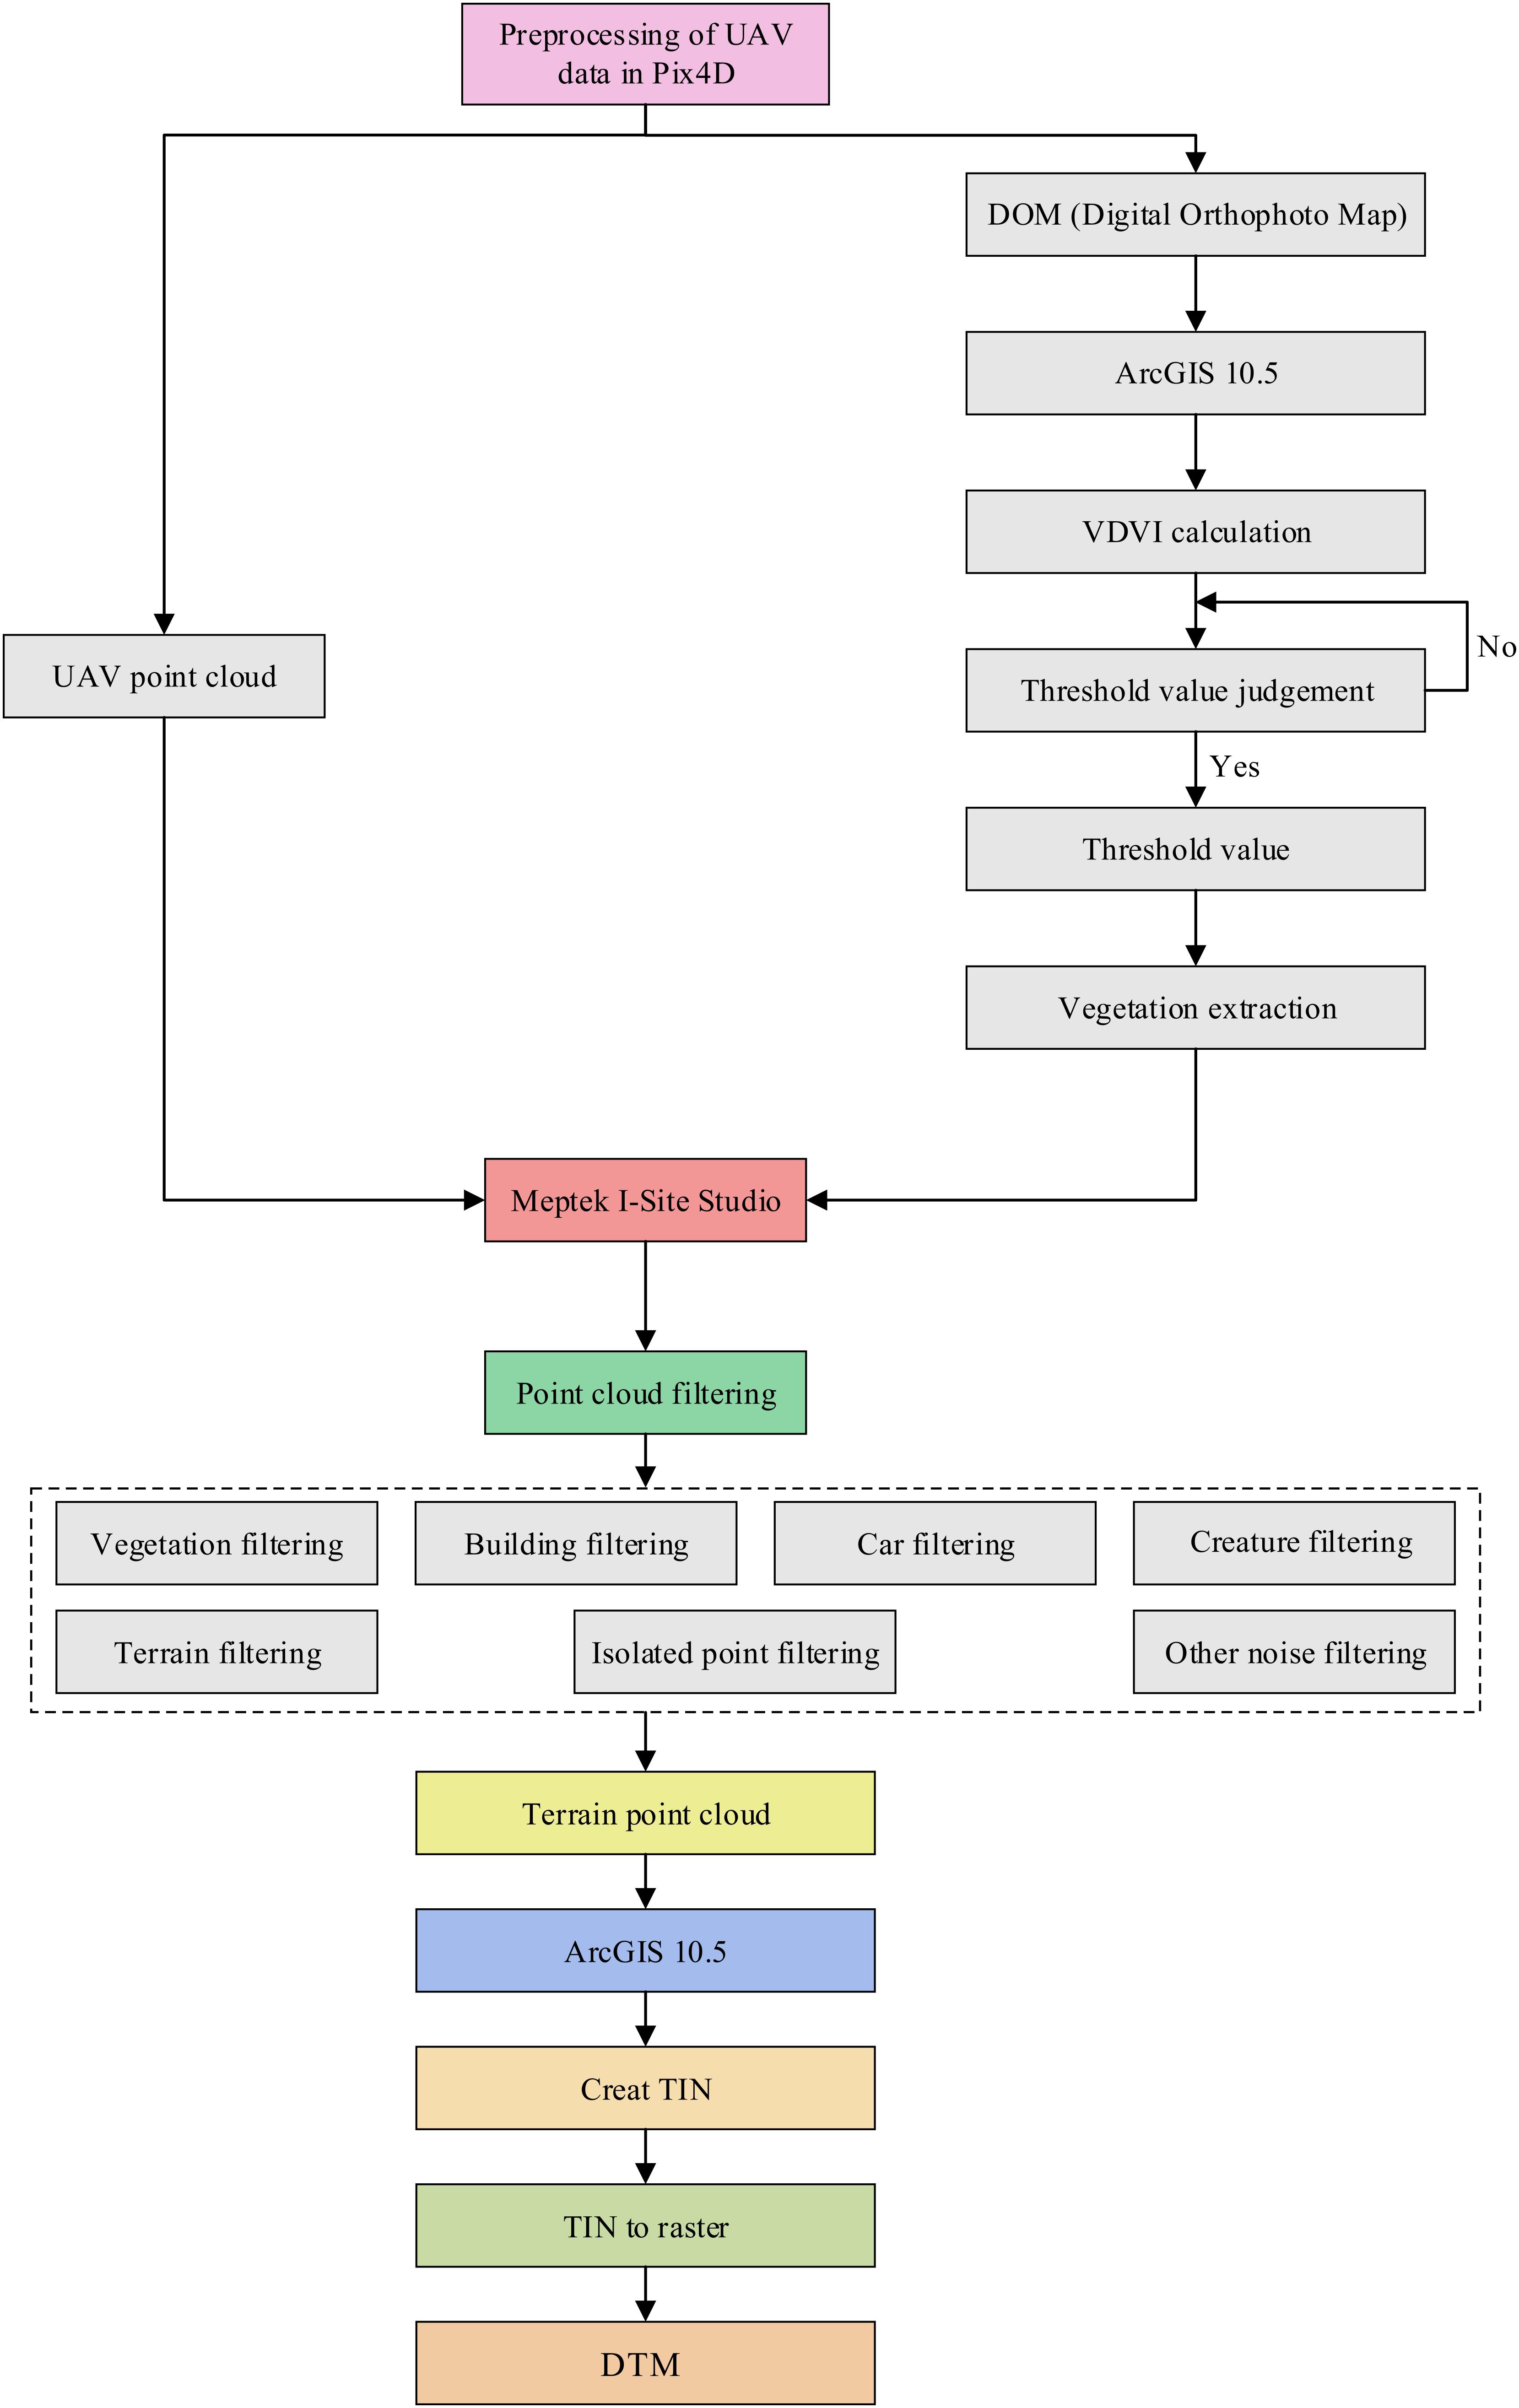
Figure 8. Framework of UAV data post-processing.
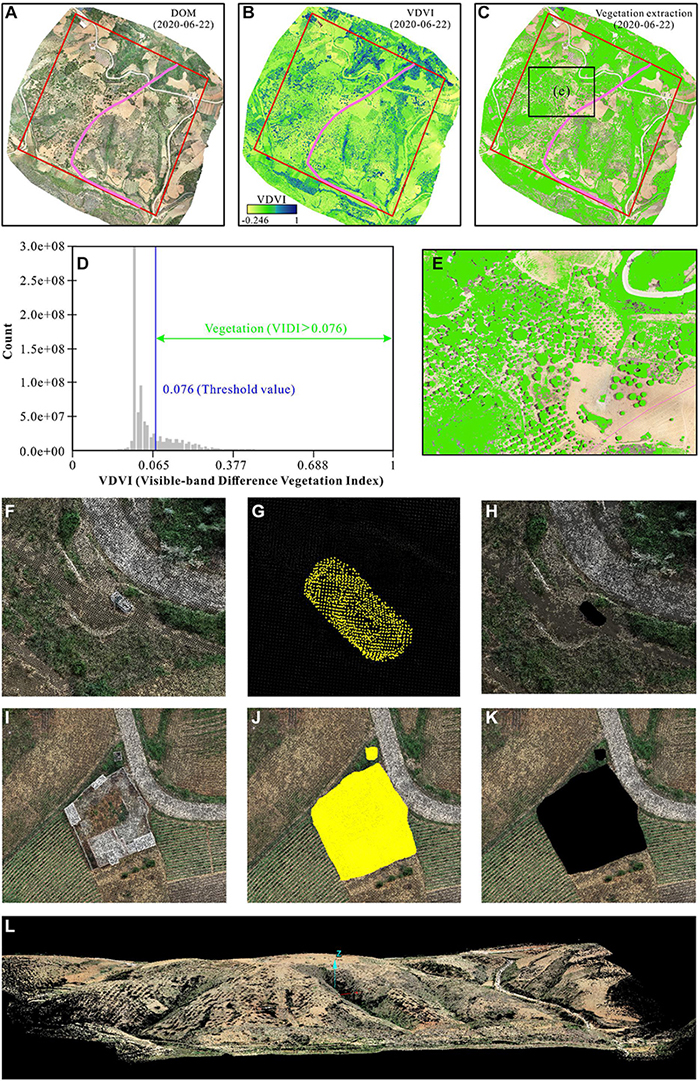
Figure 9. UAV point cloud filtering: (A) DOM, (B) VDVI (Visible-band Difference Vegetation Index) map calculated from the DOM, (C) Vegetation extraction result, (D) Vegetation extraction threshold, (E) Enlarged view of vegetation extraction, (F–H) Car point clouds filtering, (I–K) Building point clouds filtering, and (L) Topographic point clouds after vegetation filtering.
Surface Change Detection
To better detect surface change and unstable slope activity in the area of oil and gas pipelines, we used the most commonly used international geomorphic change detection software GCD 7.0 (Geomorphic Change Detection 7.0) to carry out this work. This is a very well-known and widely used terrain change detection tool (Wheaton et al., 2010; Shahverdian et al., 2017; Hamill et al., 2018; Hu et al., 2019) that distinguishes the noise information of DEMs, and can perform DEM uncertainty analysis on real landform changes; thus, the DEM of difference (DoD) results are convincing (Shahverdian et al., 2017). In this study, the 99% confidence level was used in the GCD 7.0 software to analyze DoDs of the study area.
Finite Element Simulation of Slope–Pipe Coupling
Establishing a slope–pipe coupling finite element model to analyze slope stability and pipeline stress and deformation is a widely used method in current research (Han et al., 2012; Li et al., 2016; Zhang et al., 2016; Mamuzo Edeki, 2020). As the UAV monitoring data cannot directly and quantitatively analyze the influence of unstable slope on the deformation of the pipeline body, this study is based on the strength reduction method and adopts the slope–pipe fully coupled finite element model to carry out multi-scenario simulation from stable state to unstable state. Due to the limitations of finite element software in the establishment of complex three-dimensional models, this research uses the three-dimensional modeling software Rhino to process the DTM data with a precision of 2 m obtained by the UAV, establish a three-dimensional model similar to the real terrain, and import the finite element software Abaqus perform subsequent calculation and analysis. In order to facilitate the calculation and convergence, this study temporarily ignores the ups and downs of the pipeline laying with the change of terrain, and simplified the pipeline to a straight pipe model, so the buried depth of the pipeline is 0.5–2.5 m. The established slope finite element model range is 145 × 115 × 90 m, and the boundary conditions are set for the model (the bottom boundary is fixed, and the front, back, left, and right sides are restricted normal displacements) (Zhang et al., 2017, 2018), material parameters (Tables 2, 3), and apply gravity load. Subsequently, by continuously reducing the cohesive force and internal friction angle of the unstable slope area, the slope gradually developed to the limit equilibrium state. Combined with UAV monitoring data, select small sliding scenarios, slope acceleration slip scenarios, and limit equilibrium scenarios where the model is consistent with the real displacement conditions, and carry out analysis of slope displacement, pipeline stress, and displacement.
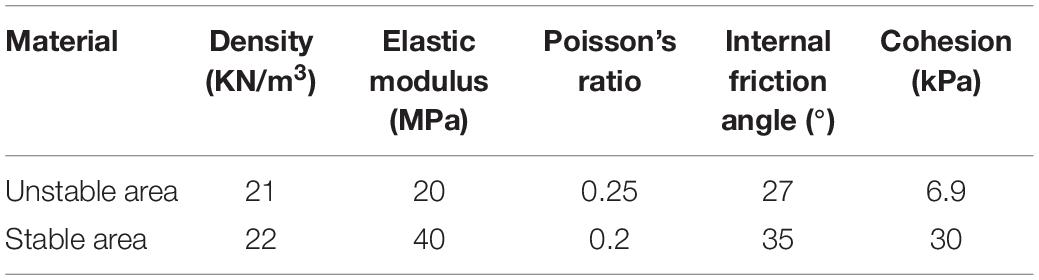
Table 2. Physical and mechanical parameters of the slope.
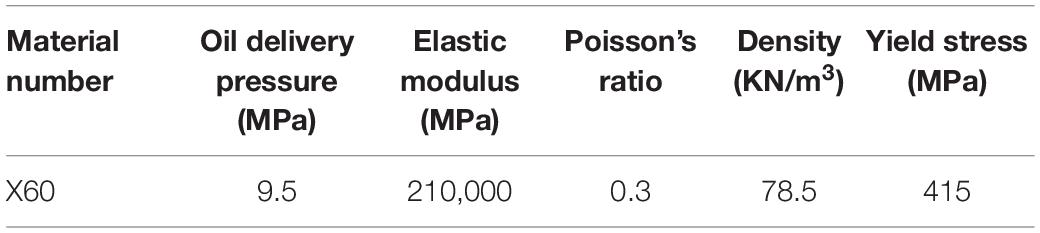
Table 3. X60 pipe material parameters.
Results and Analysis
Precision Evaluation of High-Resolution DTMs
Directly evaluating the absolute accuracy of DTMs has always been a difficult problem. At present, a common method is to indirectly evaluate the accuracy of DTMs by evaluating the accuracy of GCPs (i.e., UAV ground control points). Table 4 displays a third-phase UAV image control point accuracy report generated by the Pix4D software. The results show that the errors of the five GCPs were very small and fully met the 1:500 UAV mapping accuracy requirement, which also indicates that the UAV photo generation had high accuracy.
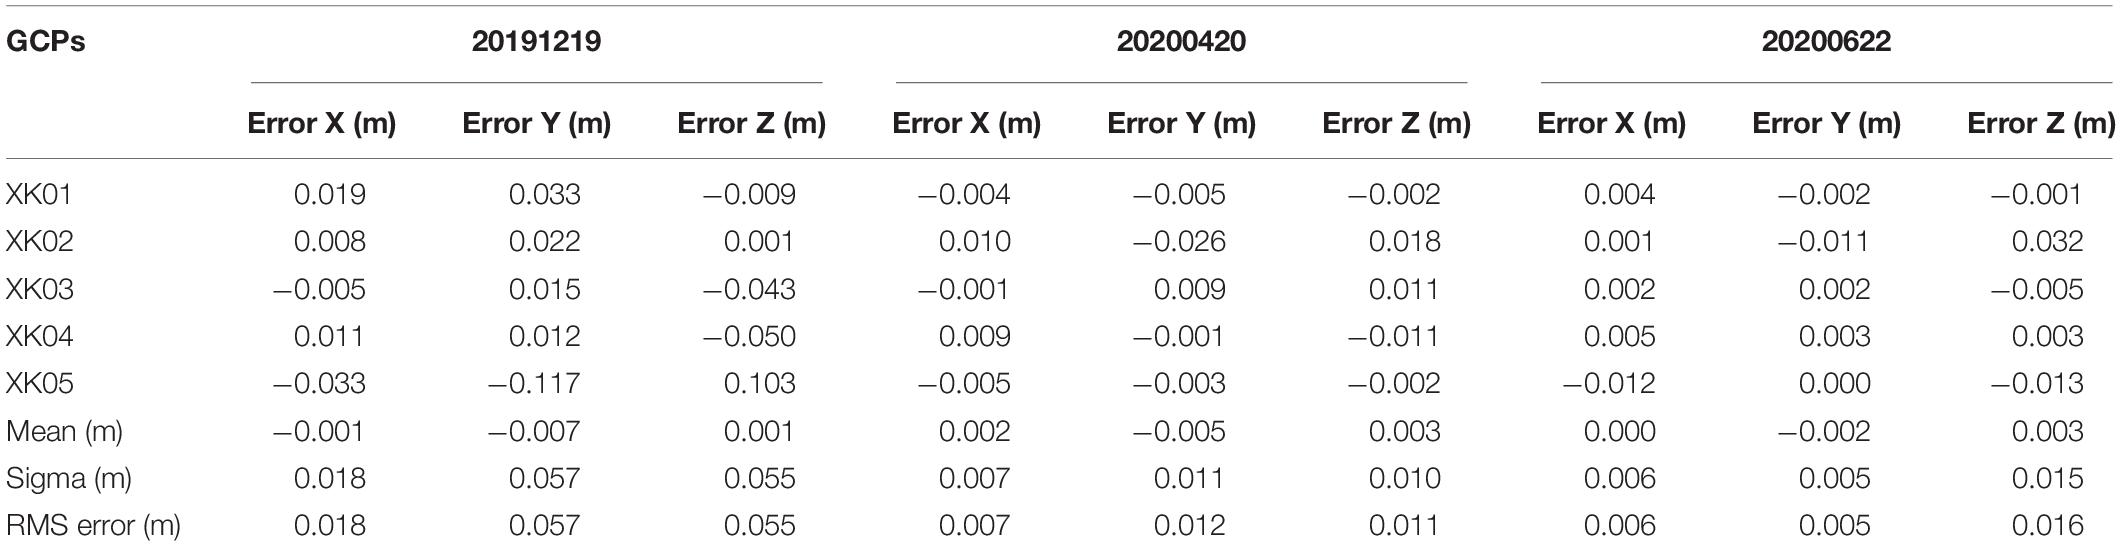
Table 4. Accuracy evaluation results of UAV ground control points.
Unstable Region Detection
Figure 10 shows the results of DoDs analysis in the study area. The results showed that from December 2019 to June 2020, the overall topographical difference in this area did not change much, and the DTM difference range was mainly concentrated between −0.25 and 0.25 m. The green area in the figure is mainly the area with increased elevation, mainly due to the increase in surface elevation caused by the plowing of the land by local farmers, while the red area is due to the decrease in elevation caused by soil erosion, land subsidence, and slope movement. It can be seen from the distribution of the oil and gas pipelines in the 5 m buffer zone that during the monitoring period, the deformation of most areas of the oil pipelines is small, and only the area where the oil pipelines and the highway intersect in the northeast (the blue area) has a large ground subsidence; the vertical deformation is between −0.25 and 0.05 m. The results of DoDs analysis preliminarily indicate that the blue area is an unstable area and there may be hidden dangers of geological hazards.
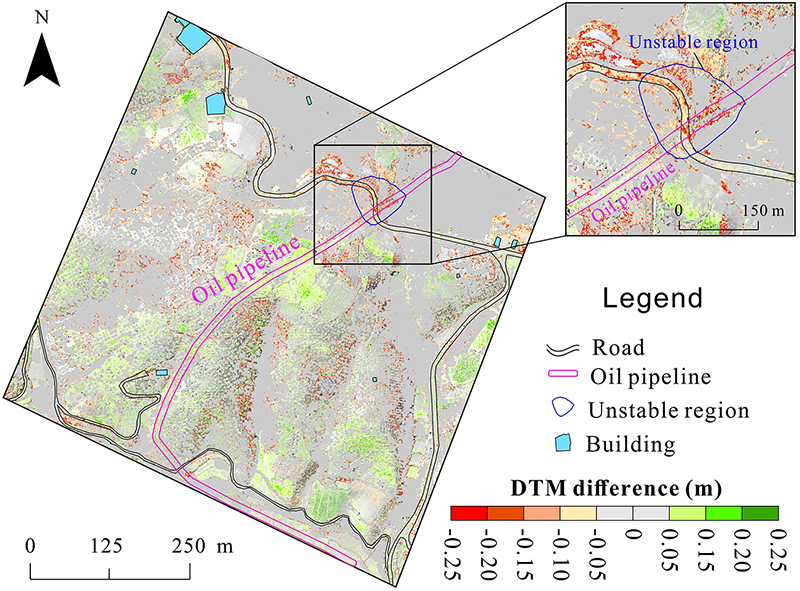
Figure 10. The results of DTMs of difference (DoDs) from December 2019 to June 2020.
Numerical Simulation of Unstable Areas
In order to better reveal the current deformation of the unstable area and the influence of the different stages of the gradual development to the instability process on the pipeline body, we established a finite element model (terrain data are derived from DTM data obtained from the UAV survey on June 22, 2020) of the pipeline longitudinally traversing the slope body, and developed a method of slope deformation and force analysis of the pipe based on the strength reduction method. Before carrying out the numerical simulation, according to the engineering geological experience combined with the geographical location of the study area, it is judged that the soil in the unstable slope area is a typical Yunnan red-bed multi-phase soil (composed of a set of sandstone, siltstone, mudstone, and shale with weaker lithology), and obtain the pipeline material model according to the pipeline design data. On this basis, consult the Engineering Geology Manual and the “Oil Pipeline Engineering Design Code” (GB50253-2014), and obtain the input parameters required for the simulation (Tables 2, 3). Furthermore, according to the DTM of the study area, a finite element model of the real slope topography containing pipes was established, and then the cohesive force and internal friction angle were continuously reduced, and three different scenarios of the slope development from stable to unstable state were obtained: small-scale sliding state, accelerated sliding state, and limit equilibrium state.
Slope Displacement, Pipe Stress, and Pipe Displacement Under Small Slip Conditions
The small slip state represents a stage where the slope begins to produce small displacements and may develop into an unstable slope. In a small sliding state, the spatial range of the slope body’s displacement is “inverted drop-shaped,” and the obvious displacement area is concentrated in the middle of the range where the terrain begins to sink (Figure 11A). In this state, the displacement value of the entire unstable region is about 0.64–7.72 cm. The cross-sectional view made by the location of the pipeline shows that a small decrease in vertical displacement began to appear in the middle of the area, accompanied by a small increase in the vertical displacement of the front edge (Figure 11B). These are the characteristics of the initial development of unstable slopes. In this state, the deformation of the pipeline is mainly manifested as an overall downward movement along the sliding direction of the unstable slope (Figure 11C). The maximum deformation occurs at the front edge of the slope with a value of 1.09 cm (Figure 11D). The pipeline stress in the area corresponding to the displacement of the slope increases, and the maximum stress occurs at the place where the displacement of the slope body decreases. The stress value is 45.88 MPa (Figure 11C), which is less than the “Oil Pipeline Engineering Design Code” (GN50253-2014). The allowable stress value of the X60 pipeline is 249 MPa, so a small slope sliding does not pose a threat to the safety of pipeline operation. Since the simulated maximum displacement of 7.72 cm is relatively close to the displacement of 7.2 cm monitored by the UAV at point D, this state can more truly reflect the current slope displacement and pipeline deformation.
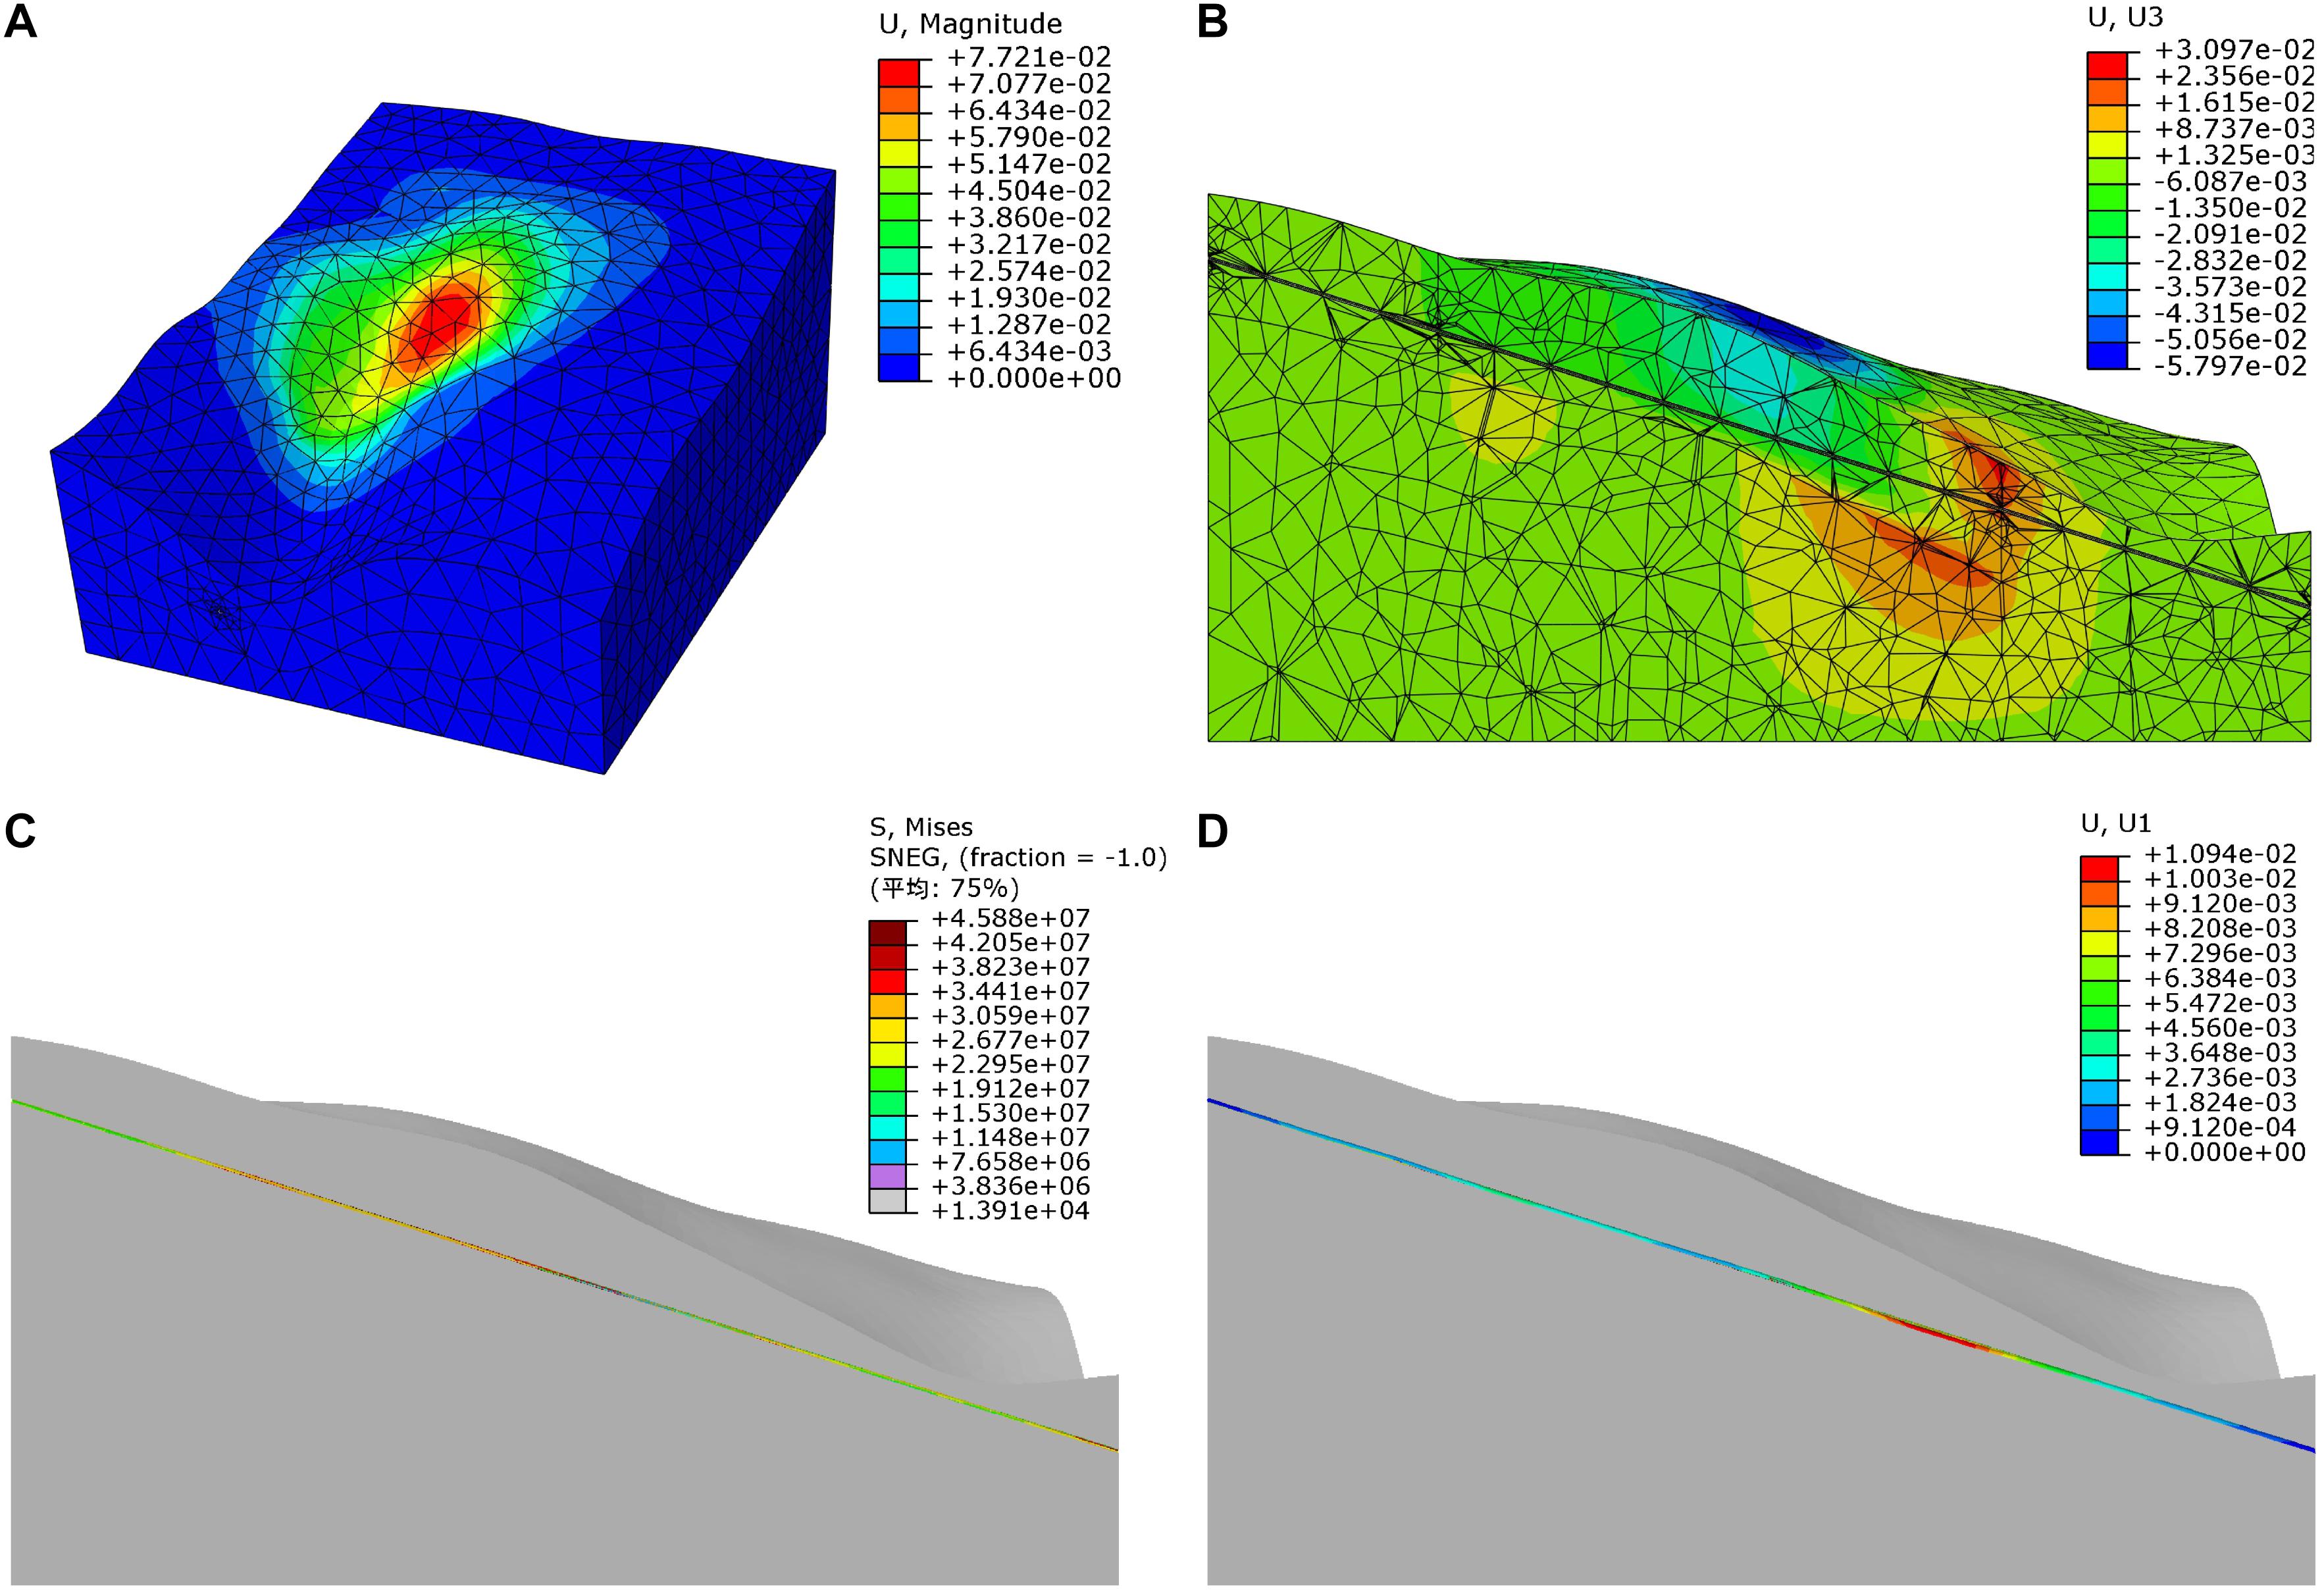
Figure 11. Slope displacement, pipeline Mises’s stress, and pipeline displacement in a small sliding state. (A) Slope displacement, (B) Slope vertical displacement along the pipe section, (C) Pipe Mises stress, and (D) Along an unstable slope deformation of the pipe in the direction of movement (x direction).
Slope Displacement, Pipe Stress, and Pipe Displacement Under Accelerated Sliding Conditions
The accelerated slip state represents a stage where the displacement of the slope increases rapidly, and the slope gradually develops into an unstable slope. The slope displacement value range during the accelerated sliding stage is 1.85–22.27 cm, and the large displacement area in the middle of the area expands outward (Figure 12A). There was a significant decrease in vertical displacement in the entire range of the unstable slope, accompanied by an increase in the vertical displacement of the front edge, of which the maximum vertical displacement appeared in the middle of the slope, which was 13.49 cm (Figure 12B). The larger value of pipeline stress at this stage is mainly distributed in the sinking area of the slope in the middle of the slope, the squeezing and uplifting area of the soil at the front of the slope, the area with shallow ground depth and risk of exposed pipes, and the boundary near the toe (it is caused by the x-direction constraint imposed on the pipe so that it will not slip out of the model boundary) (Figure 12C). The displacement of the pipe along the x-direction also continued to increase, reaching a maximum of 1.59 cm (Figure 12D). These characteristics all indicate that the slope is more likely to develop into a landslide. At this stage, it is necessary to increase the frequency of UAV monitoring, and if necessary, cooperate with surface monitoring equipment to pay close attention to the slope displacement.
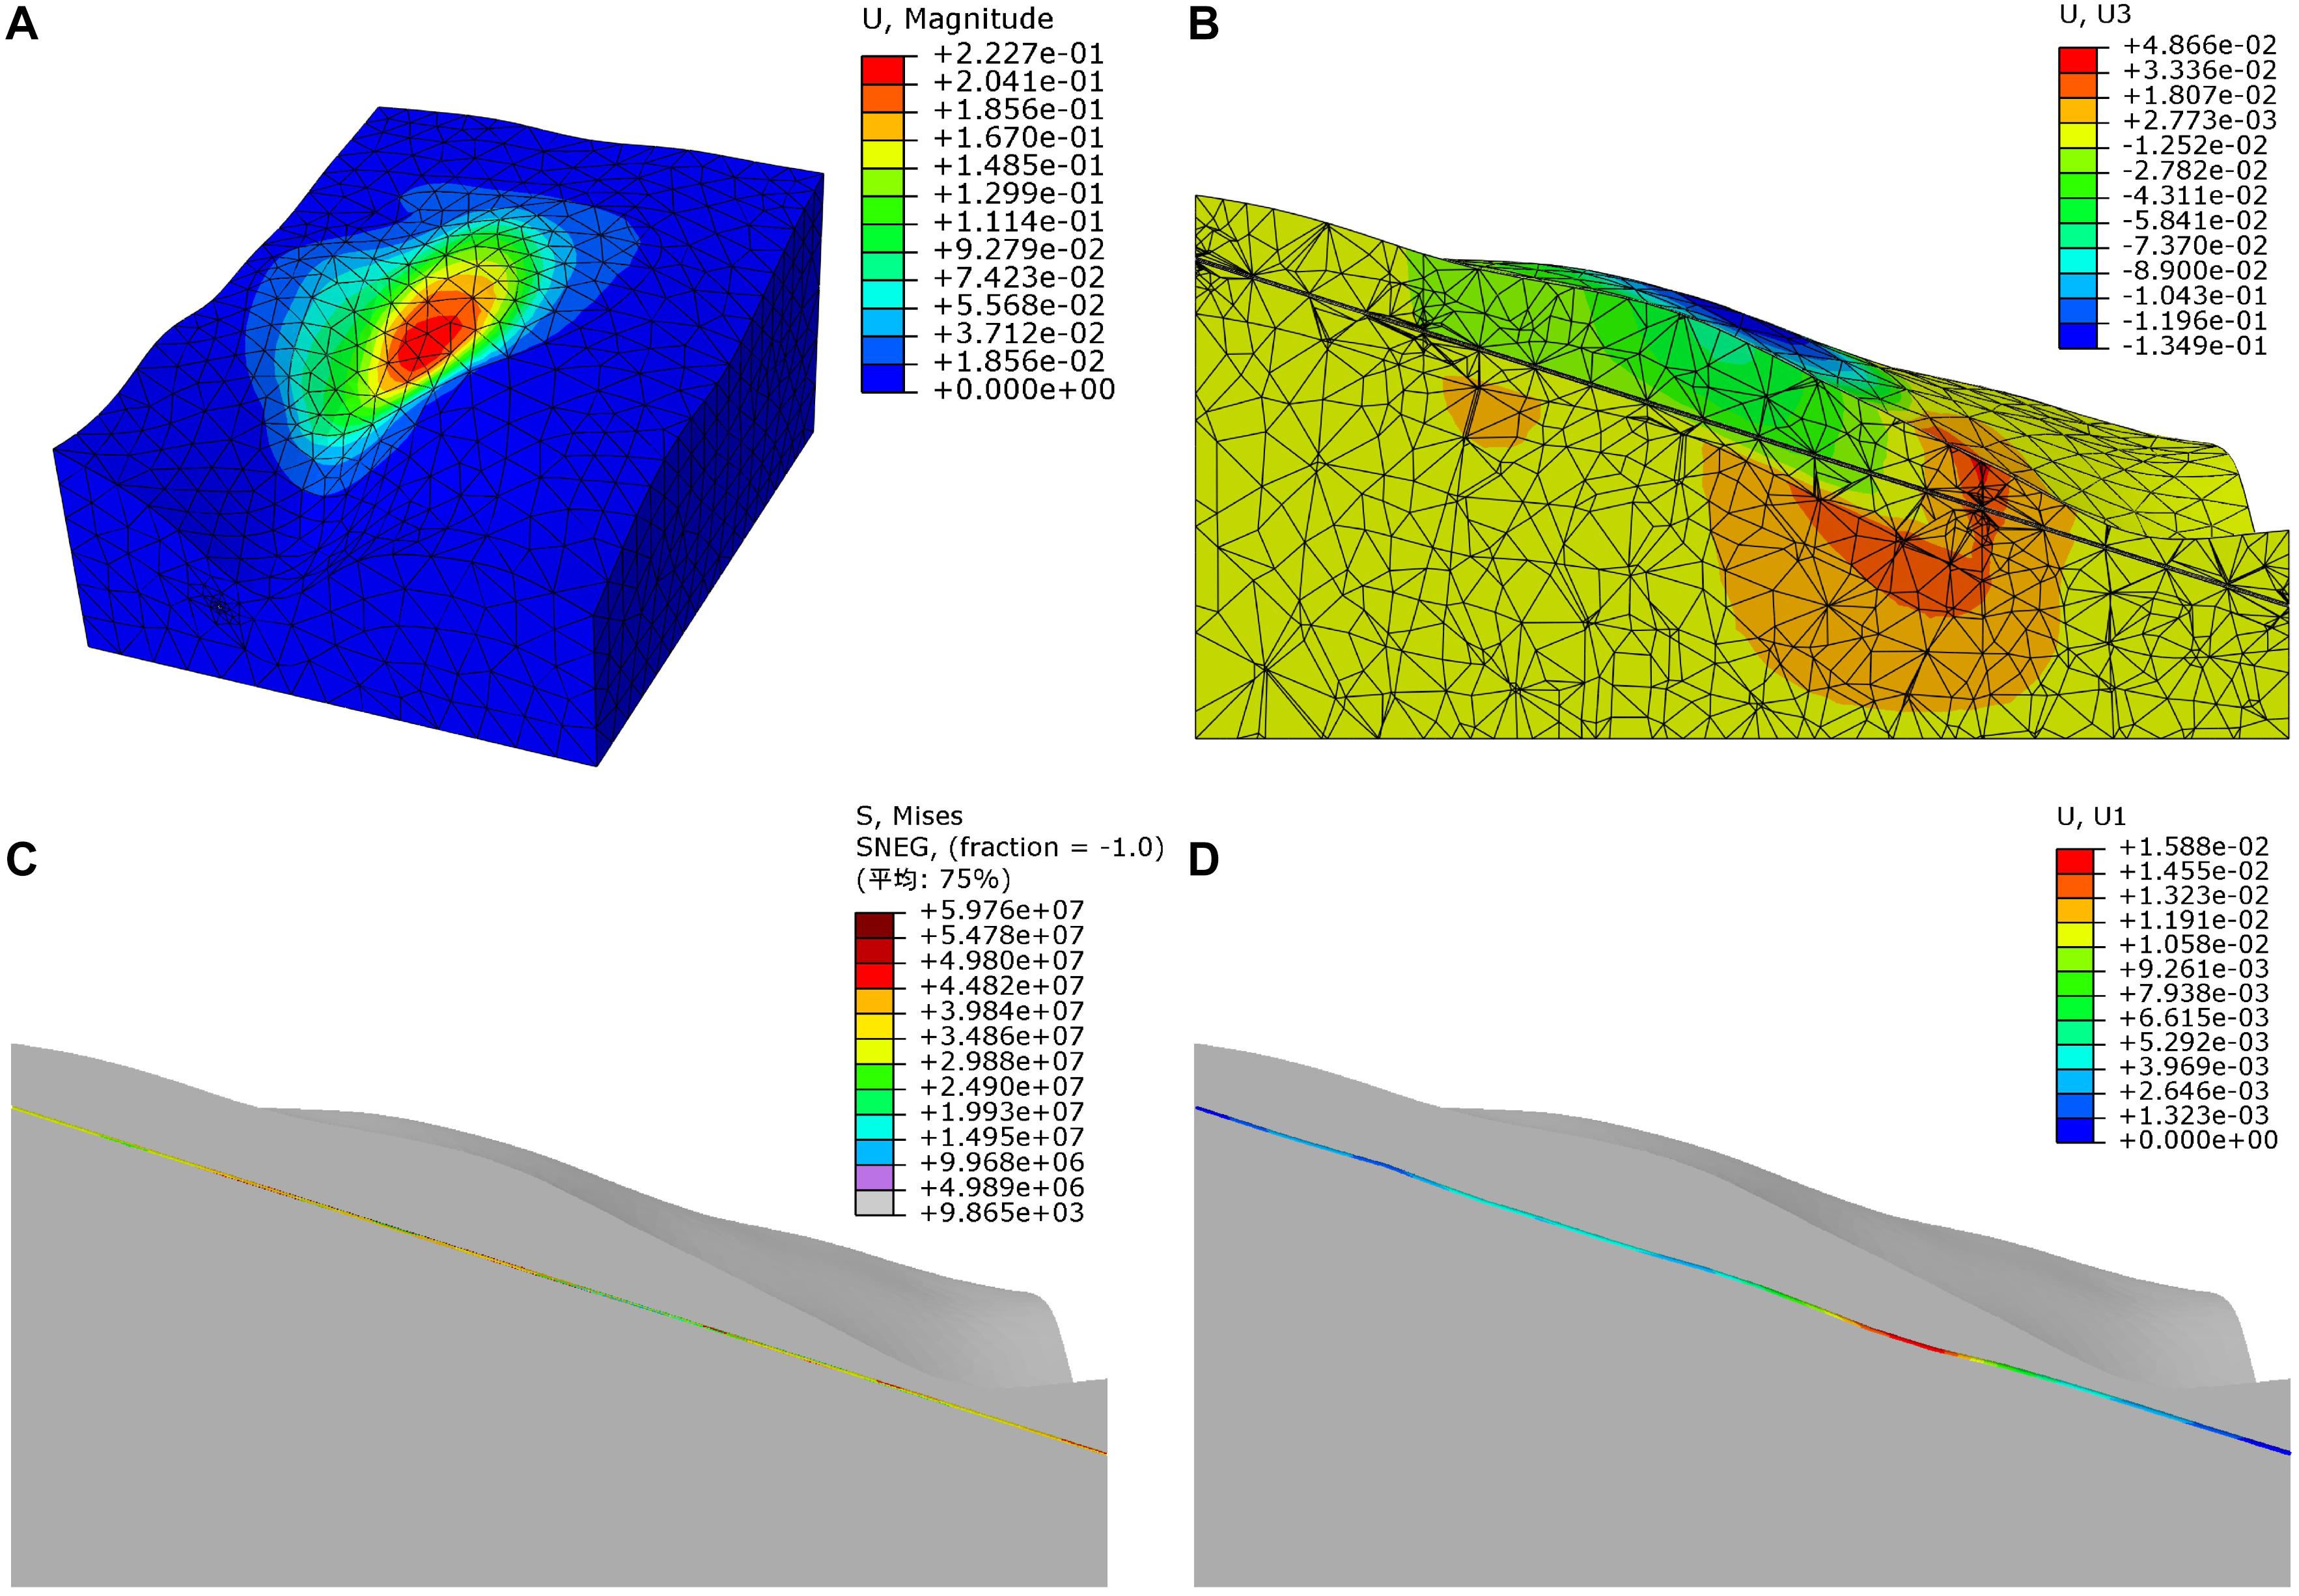
Figure 12. Slope displacement, pipeline Mises’s stress, and pipeline displacement under accelerated sliding conditions. (A) Slope displacement, (B) Slope vertical displacement along the pipe section, (C) Pipe Mises stress, and (D) Along an unstable slope deformation of the pipe in the direction of movement (x direction).
Slope Displacement, Pipeline Stress, and Pipeline Displacement in the Limit Equilibrium State
The limit equilibrium state represents a critical stage in which the slope has not yet become unstable and is about to become unstable. At this stage, the slope displacement increased significantly, with the maximum displacement reaching 167.9 cm (Figure 13A), and the area where the displacement increased significantly could basically represent the area where the landslide occurred in the future. Combined with the vertical displacement showing a clear and continuous sliding surface state at this stage, we can see that the slope is in a state of imminent instability (Figure 13B). At this time, the greater stress and greater deformation of the pipeline are the same as the accelerated sliding stage, where the maximum stress reaches 63.55 kPa, and the maximum displacement in the x direction is 1.714 cm (Figures 13C,D). At this time, the pipeline has not yet yielded, which may be due to the shallow potential sliding surface of the unstable slope and the relatively deep buried depth of the pipeline. The slope strength reduction factor corresponding to this critical state is that the safety factor of the slope is 1.316, the cohesion is 5.24 kPa, and the internal friction angle is 21.16°.
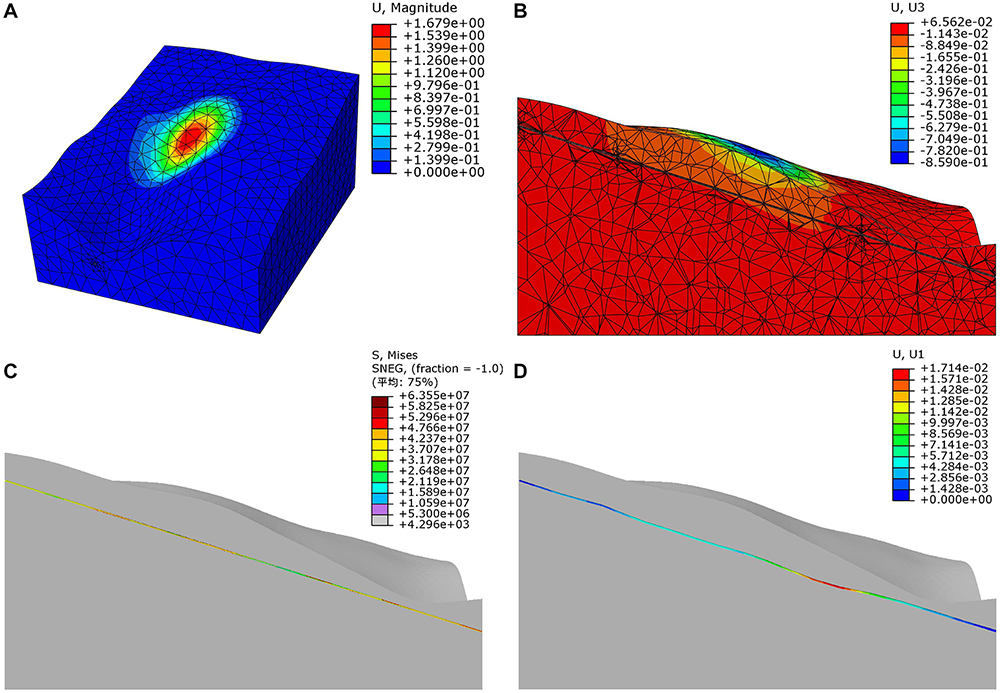
Figure 13. Slope displacement, pipeline Mises’s stress, and pipeline displacement in the limit equilibrium state. (A) Slope displacement, (B) Slope vertical displacement along the pipe section, (C) Pipe Mises stress, and (D) Along an unstable slope deformation of the pipe in the direction of movement (x direction).
Discussion
At present, the two methods of on-site investigation, evaluation, monitoring, and early warning are difficult to apply in the rapid identification and evaluation of pipeline geological hazards across large-scale areas. Therefore, in this study, multi-temporal UAV data were used to detect geomorphological changes in oil and gas pipeline regions, and rapid identification and assessment of pipeline geological hazards were then conducted, which are of great significance for timely and accurate implementation of safe oil and gas pipeline operation and prevention of pipeline geological hazards.
Compared with traditional large-area identification and assessment methods of pipeline geological hazards, the method proposed in this study has the following advantages: (1) this method can flexibly and conveniently obtain high-precision and high-resolution images at low cost; (2) this method cannot only clearly record the deformation and deposition processes of a single hazard, but also explore the spatial distribution of multiple hazards and the development patterns of hazard chains in large areas; (3) this method employs a UAV to monitor the surface for oil pipeline-related changes to identify large landslides, collapses, ground fissures, ground subsidence, soil erosion, and other geological hazards near the pipeline, and identify other human activities that threaten the safety of pipeline operation.
Considering that the vertical accuracy of the ground control points measured by RTK in this study has an error of 5 cm, we have performed the vertical error elimination process on the result of Figure 10 in ArcGIS 10.0. In order to better reveal the deformation of the above-mentioned unstable area, we enlarged this area and displayed the error-eliminated results of the DoDs analysis on the road separately (Figure 14). It can be seen from Figure 14 that most of the road section has no vertical deformation, only there is a significant elevation reduction near the pipeline, especially on the road to the southeast of the pipeline. This shows that the road area passed by the oil pipeline is indeed unstable. It is worth mentioning that because the road is not affected by vegetation, the terrain data obtained by the UAV should be relatively accurate. But at the same time, considering that this study did not use static Global Navigation Satellite System (GNSS) method to measure the ground control points of the UAV, it is inevitable that there will be some errors in the actual DTM obtained. In other words, although Figure 14 shows the DTM difference after error elimination, the actual vertical deformation of the ground may not be so large. However, in terms of the overall deformation trend, the results in Figure 14 can still explain some problems. Therefore, in the future, we will choose static GNSS measurement methods when measuring ground control points and use airborne lidar equipment with the ability to penetrate vegetation, so that the DTM data obtained will be more accurate. In addition, in order to better verify whether there is vertical deformation in the road area, we also recommend that pipeline safety authorities install static GNSS monitoring equipment for real-time monitoring, so as to ensure the safe operation of oil pipelines.
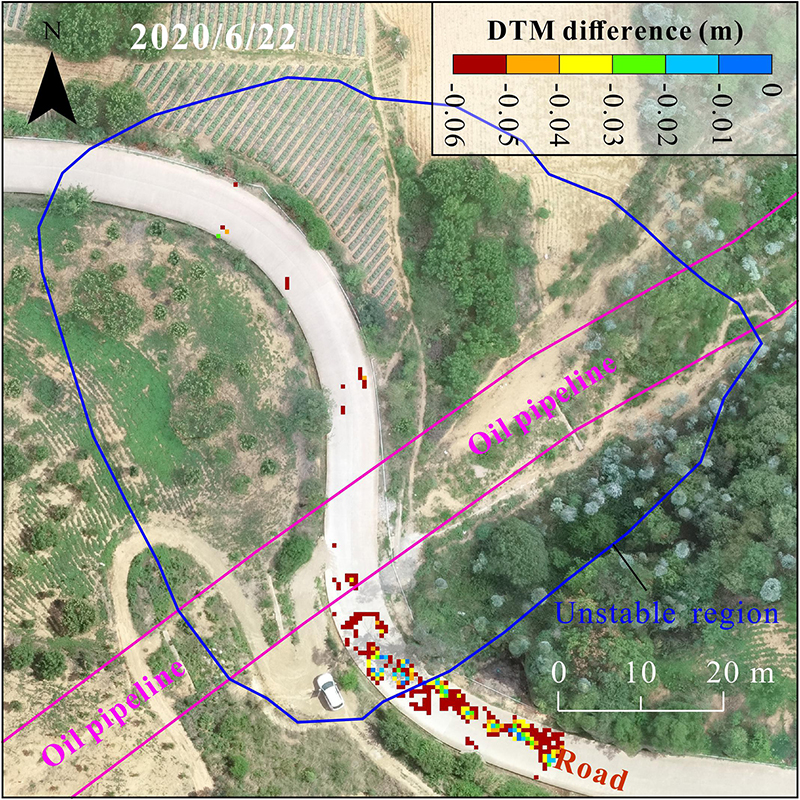
Figure 14. Vertical and horizontal displacement analysis.
In this study, we found that soil erosion caused by rainfall is an important reason for the decrease in surface elevation (Figures 15A,B, 16A–I). It is necessary to focus on preventing soil erosion and exposure of the pipeline (Figure 16B). However, in areas with dense vegetation, it is necessary to focus on the impact of vegetation on the accuracy of the terrain information obtained by the UAV. This will be the focus of urgently needed research in subsequent work. In addition, since this area is a strong area of structural movement, fault activity and fracture development pose a huge threat to the safe operation of oil pipelines. In the future, we must pay close attention to the damage effect of structural deformation on oil pipelines and strengthen the assessment of structural movement on the safety of oil pipelines.
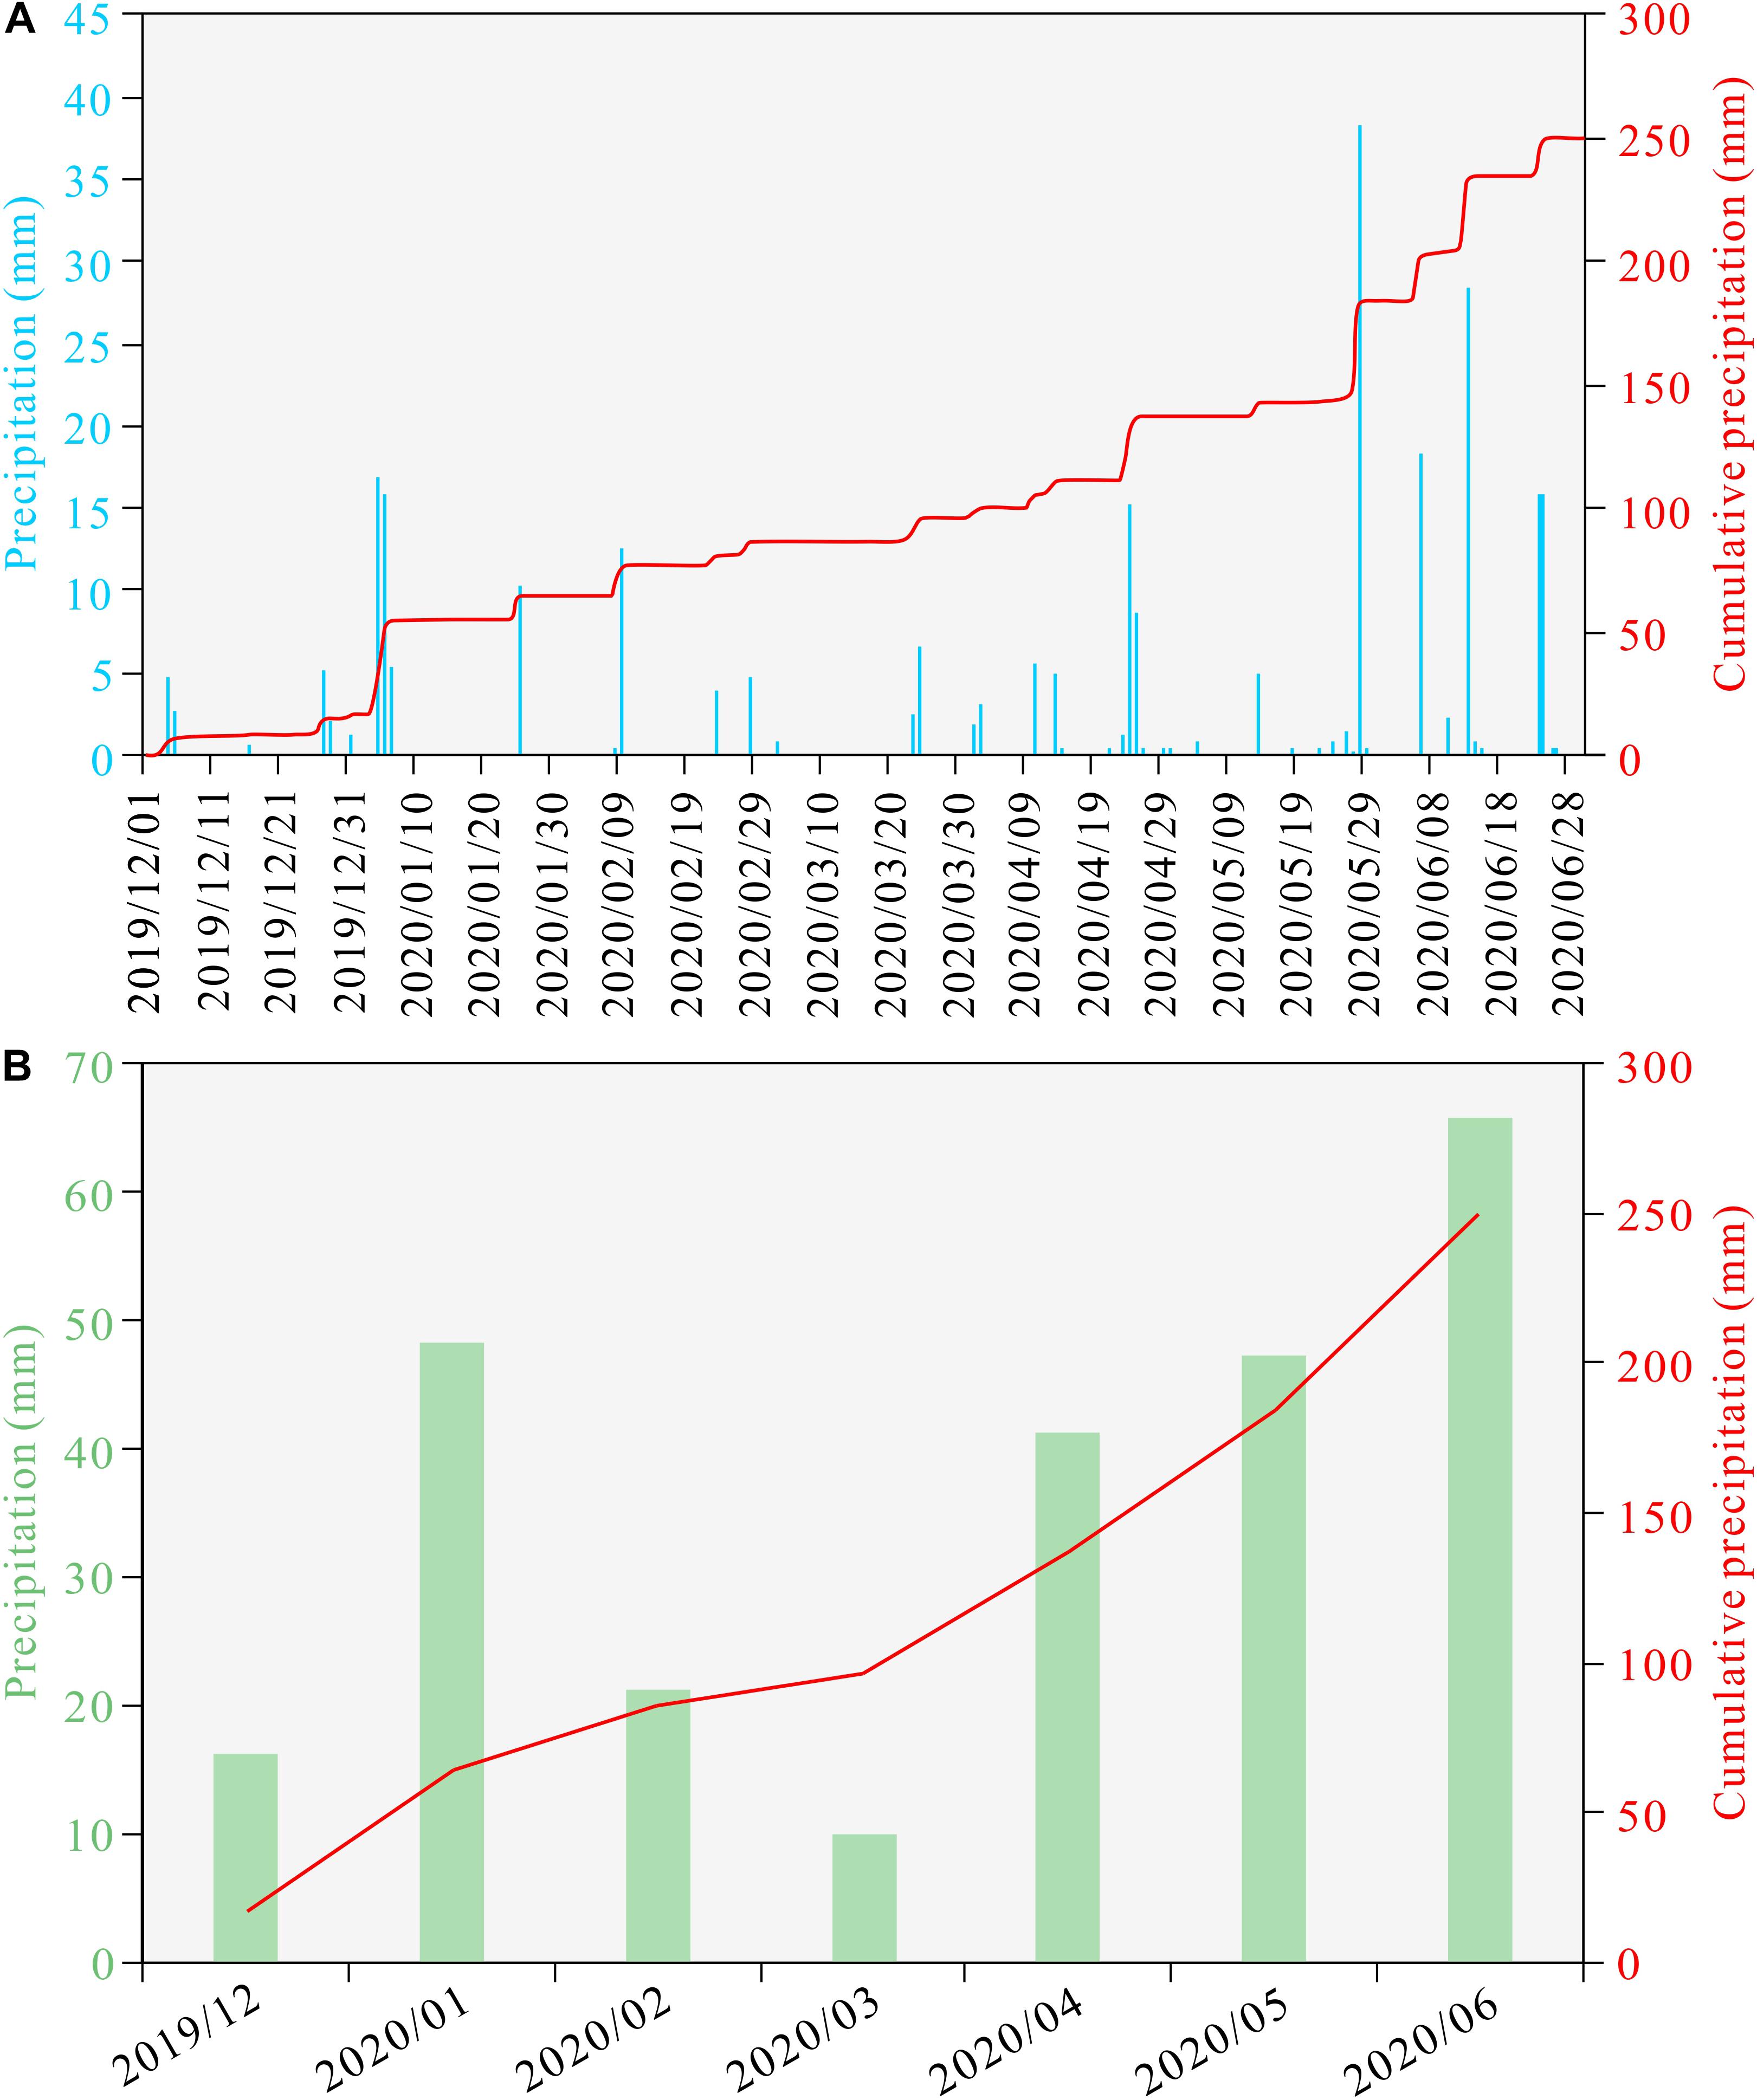
Figure 15. Changes in rainfall in the study area during UAV monitoring. (A) Daily precipitation and cumulative precipitation of study area from December 2019 to June 2020 and (B) Monthly total precipitation and cumulative precipitation from December 2019 to June 2020.
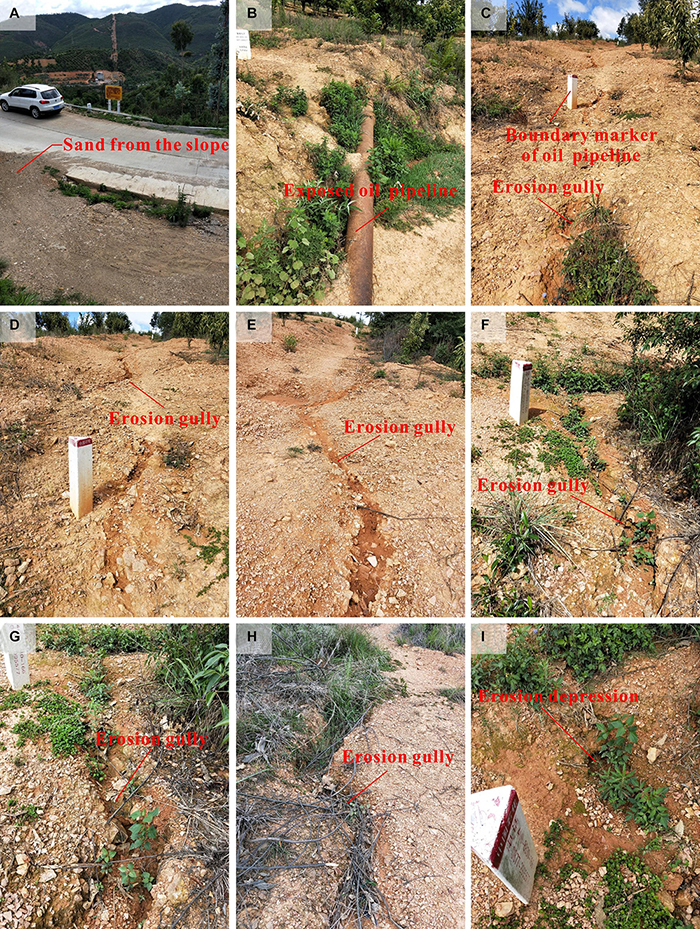
Figure 16. Soil erosion near the oil pipeline. (A) The slope material was washed up on the road by the rain, (B) Exposed oil pipeline, and (C–I) Erosion gullies formed by rainfall.
In this research, the whole process of “potentially unstable slope area identification–slope deformation quantitative analysis–pipeline stress and deformation quantitative analysis” was realized through the method of UAV monitoring and numerical simulation, which is convenient for understanding the current development status of the slope and the impact of this state on the pipeline. On this basis, this study previewed the impact of the occurring slope on the pipeline under accelerated sliding and limit equilibrium conditions through numerical simulation based on the strength reduction method, which is crucial for providing reliable pipeline emergency advice in advance. However, there is still a certain gap between this model and the real situation. For example, in the case of large undulations on the ground, the buried pipeline will often undulate along the ground and no longer show a straight line. The current model simplifies the complicated curved pipeline, which shows that the linear pipeline is affected by the deformation of the slope. In the next step, we will continue to improve the optimization model and carry out research on the influence of slope deformation on the pipeline under the shape of a curved pipeline that is closer to the real situation.
Conclusion
After the finished oil and gas pipeline is completed and put into operation, regular inspections and investigations of geological hazards around the pipeline are still a very arduous and tedious task. Traditional manual pipeline inspection is not only inefficient but also expensive. Fortunately, in recent years, with the development of UAV and photogrammetry technology, the use of UAV to carry out oil and gas pipeline inspections and geological hazard investigations has become a new development trend. However, what is the accuracy of surveying and mapping using UAV to carry out this work? Can you monitor abnormal areas of surface changes? Can the hidden dangers of geological hazards be identified? What are the difficulties and challenges faced by using UAV to detect surface changes? This research discusses these issues. The accuracy evaluation of the UAV photogrammetry results in this study is convincing. The highest accuracy of the X coordinate of the image control point is 0.006 m, the highest accuracy of the Y coordinate is 0.005 m, and the highest accuracy of the Z coordinate is 0.011 m. We use the low-cost Phantom 4 RTK UAV with Zhonghui i50 RTK and ground control points to carry out the UAV 1:500 mapping work. The high-resolution and high-precision DOM and DSM obtained are effective for monitoring surface changes of oil and gas pipelines with strong data support. In the multi-temporal monitoring of UAV surface changes, the UAV DSM data can identify areas where the surface elevation changes more than 5 cm.
In order to better eliminate the negative effects of vegetation and other non-terrain elements when generating DTM, this research proposes a complete set of technical solutions for UAV point cloud filtering. Based on this method, we obtained high-quality DTM data and performed surface change detection based on DTM. The results of DoDs analysis show that the vertical deformation of most areas of the oil pipeline area is small. There is obvious local vertical deformation on the road near the oil pipeline, and this area is an unstable area. At the same time, based on geological engineering practice and future hazard prevention and mitigation considerations, we carried out numerical simulations of surface displacement, pipeline stress changes, and pipeline displacement under different motion scenarios in unstable regions. The simulation results show that the small sliding state can better correspond to the current UAV field monitoring results. At this time, the maximum pipeline stress is 45.88 MPa, which is less than the allowable stress of the X60 pipeline in the specification and does not threaten the operational safety of the pipeline. In addition, simulations of accelerated sliding state and limit equilibrium state show that during the development of the slope to an unstable state (excluding the influence of boundary conditions), the larger value of pipeline stress is concentrated in the sinking area of the slope in the middle of the slope and the soil at the front edge of the slope. The larger values of pipeline stress are concentrated in the areas of slope subsidence, soil extrusion and uplift at the front edge of the slope, and shallow buried depth of the pipeline, which are the areas that need to pay more attention to pipeline safety.
Although the use of UAV time series DSM data for oil and gas surface change detection has great potential, this method also has some shortcomings. For example, due to RTK measurement error, UAV system error, image control point stab deviation, wind speed, etc., the accuracy of UAV terrain data will have certain errors. Therefore, the UAV terrain data are still slightly insufficient to detect changes within 5 cm of the surface; also, vegetation filtering has always been a difficult point in UAV terrain data processing. If the vegetation is not filtered, the true surface elevation cannot be obtained, and filtering vegetation sometimes affects the accuracy of the true surface elevation. In future studies, if a UAV airborne lidar sensor with stronger penetrating capability is used to obtain terrain data, vegetation filtering may be easier. Although there are still some shortcomings in this research, this research provides technical support and method reference for the rapid detection of multi-phase oil pipeline surface changes using UAV, identification of potential geological hazards near the pipeline, and identification of other human activities that threaten the safety of pipeline operation.
Data Availability Statement
The original contributions presented in the study are included in the article/supplementary material. further inquiries can be directed to the corresponding author/s.
Ethics Statement
Written informed consent was obtained from the relevant individual(s) for the publication of any potentially identifiable images or data included in this article.
Author Contributions
YY was responsible for most of the work and manuscript writing in this research. SM was responsible for the processing and verification of the article data. SY was responsible for processing and verification part of the article data, numerical simulation and drawing the tables. SH was responsible for the production of the article figures. YL was responsible for checking the overall logical structure of the article. CX and HJ were responsible for the measurement of field data. All authors contributed to the article and approved the submitted version.
Funding
This study was financially supported by the Fundamental Research Funds for the Project of Science and Technology Department of Sichuan Province (No. 2020YFH0085), the National Natural Science Foundation of China (No. 41901008), and the China Postdoctoral Science Foundation (Grant No. 2019M663792). This work was also financially supported by the China Scholarship Council.
Conflict of Interest
Authors CX and HJ were employed by the company Sinopec Marketing South China Branch.
The remaining authors declare that the research was conducted in the absence of any commercial or financial relationships that could be construed as a potential conflict of interest.
Acknowledgments
We thank Sara J. Mason from Liwen Bianji, Edanz Editing China, for editing the English text of a draft of this manuscript.
References
Alan, K., Nathaniel, D. B., Joel, B., Caster, J., and Sankey, T. T. (2019). The effects of topographic surveying technique and data resolution on the detection and interpretation of geomorphic change. Geomorphology 333, 1–15. doi: 10.1016/j.geomorph.2019.02.020
Benoit, L., Briole, P., Martin, O., Thoma, C., Maletc, J. P., and Ulrichc, P. (2015). Monitoring landslide displacements with the Geocube wireless network of low-cost GPS. Eng. Geol. 195, 111–121. doi: 10.1016/j.enggeo.2015.05.020
Bruschi, R., Bughi, S., and Spinazzè, M. (2010). The role of FEM in the operation of pipelines in unstable soils. J. Pipeline Eng. 9, 167–177.
Cao, X., Wei, C., Li, J., Yang, L., Zhang, D., and Tang, G. (2012). “The geological disasters defense expert system of the massive pipeline network SCADA system based on FNN,” in Asia-Pacific Web Conference, eds H. Wang, L. Zou, G. Huang, J. He, C. Pang, and H. L. Zhang (Berlin: Springer), 19–26. doi: 10.1007/978-3-642-29426-6_4
Cocchetti, G., di Prisco, C., and Galli, A. (2009b). Soil–pipeline interaction along unstable slopes: a coupled three-dimensional approach. Part 2: Numerical analyses. Can. Geotech. J. 46, 1305–1321. doi: 10.1139/T09-102
Cocchetti, G., di Prisco, C., Galli, A., and Nova, R. (2009a). Soil–pipeline interaction along unstable slopes: a coupled three-dimensional approach. Part 1: theoretical formulation. Can. Geotech. J. 46, 1289–1304. doi: 10.1139/T09-028
Cook, K. L. (2017). An evaluation of the effectiveness of low-cost UAVs and structure from motion for geomorphic change detection. Geomorphology 278, 195–208. doi: 10.1016/j.geomorph.2016.11.009
Delacourt, C., Allemand, P., Jaud, M., Grandjean, P., Deschamps, A., and Ammann, J., et al., (2009). DRELIO: an unmanned helicopter for imaging coastal areas. J. Coast. Res. 56, 1489–1493.
Di Frisco, C., Nova, R., and Corengia, A. (2004). A model for landslide-pipe interaction analysis. Soils Found. 44, 1–12. doi: 10.3208/sandf.44.3_1
Emanuela, D. B., Massimo, C., and Alfio, M. (2019). UAVs for volcano monitoring: a new approach applied on an active lava flow on Mt. Etna (Italy), during the 27 February–02 March 2017 eruption. J. Volcanol. Geother. Res. 369, 250–262. doi: 10.1016/j.jvolgeores.2018.12.001
Gao, F. P., Wang, N., and Zhao, B. (2013). Ultimate bearing capacity of a pipeline on clayey soils: slip-line field solution and FEM simulation. Ocean Eng. 73, 159–167. doi: 10.1016/j.oceaneng.2013.09.003
Gao, P., Gao, Z. Y., and Liu, G. R. (2020). New progress of China’s oil and gas pipeline construction in 2019. Int. Petrol. Econ. 28, 52–58.
Gómez-Gutiérrez, Á, Schnabel, S., Berenguer-Sempere, F., Lavado-Contadora, F., and Rubio-Delgado, J. (2014). Using 3D photo-reconstruction methods to estimate gully headcut erosion. Catena 120, 91–101. doi: 10.1016/j.catena.2014.04.004
Gonçalves, J. A., and Henriques, R. (2015). UAV photogrammetry for topographic monitoring of coastal areas. ISPRS J. Photogram. Rem. Sens. 104, 101–111. doi: 10.1016/j.isprsjprs.2015.02.009
Gruszczyński, W., Puniach, E., Ćwiąkała, P., and Matwij, W. (2019). Application of convolutional neural networks for low vegetation filtering from data acquired by UAVs. ISPRS J. Photogram. Rem. Sens. 158, 1–10. doi: 10.1016/j.isprsjprs.2019.09.014
Hamill, D., Buscombe, D., and Wheaton, J. M. (2018). Alluvial substrate mapping by automated texture segmentation of recreational-grade side scan sonar imagery. PLoS One 13:e0194373. doi: 10.1371/journal.pone.0194373
Han, B., Wang, Z., Zhao, H., Jing, H., and Wu, Z. (2012). Strain-based design for buried pipelines subjected to landslides. Petrol. Sci. 9, 236–241. doi: 10.1007/s12182-012-0204-y
Hu, S., Qiu, H., Pei, Y., Cui, Y., Xie, W., and Wang, X., et al., (2019). Digital terrain analysis of a landslide on the loess tableland using high-resolution topography data. Landslides 16, 617–632. doi: 10.1007/s10346-018-1103-0
Hu, S., Qiu, H., Wang, N., Cui, Y., Wang, J., and Wang, X., et al., (2020). The influence of loess cave development upon landslides and geomorphologic evolution: a case study from the northwest Loess Plateau, China. Geomorphology 359, 107167. doi: 10.1016/j.geomorph.2020.107167
Hu, S., Qiu, H., Wang, X., Gao, Y., Wang, N., and Wu, J., et al., (2018). Acquiring high-resolution topography and performing spatial analysis of loess landslides by using low-cost UAVs. Landslides 15, 593–612. doi: 10.1007/s10346-017-0922-8
Hua, X. (2013). Leakage of oil pipeline damaged by Baokan collapse in Jianyang, Sichuan. Available online at: https://www.chinanews.com/tp/hd2011/2013/12-03/272491.shtml (accessed December 3, 2013).
Immerzeel, W. W., Kraaijenbrink, P. D. A., Shea, J. M., Shrestha, A. B., Pellicciotti, F., and Bierkens, M. F. P., et al., (2014). High-resolution monitoring of Himalayan glacier dynamics using unmanned aerial vehicles. Remote Sensing of Environment 150, 93–103. doi: 10.1016/j.rse.2014.04.025
Ishii, Y., Ota, K., Kuraoka, S., and Tsunaki, R. (2012). Evaluation of slope stability by finite element method using observed displacement of landslide. Landslides 9, 335–348. doi: 10.1007/s10346-011-0303-7
Keay-Bright, J., and Boardman, J. (2009). Evidence from field-based studies of rates of soil erosion on degraded land in the central Karoo, South Africa. Geomorphology 103, 455–465. doi: 10.1016/j.geomorph.2008.07.011
Leynes, R. D., Pioquinto, W. P. C., and Caranto, J. A. (2005). Landslide hazard assessment and mitigation measures in Philippine geothermal fields. Geothermics 34, 205–217. doi: 10.1016/j.geothermics.2004.08.002
Li, C. D., Tang, H. M., Wang, L. Q., and Jing, H. (2009). “Hazard evaluation method study on pipeline of underground crossing landslide area,” in Proceedings of the International Conference on Pipelines and Trenchless, Shanghai, doi: 10.1061/41073(361)115
Li, G., Zhang, P., Li, Z., Ke, Z., and Wu, G. (2016). Safety length simulation of natural gas pipeline subjected to transverse landslide. Electr. J. Geotech. Eng. 21, 4387–4399.
Lollino, P., Elia, G., Cotecchia, F., and Mitaritonna, G. (2010). “Analysis of landslide reactivation mechanisms in Daunia clay slopes by means of limit equilibrium and FEM methods,” in GeoFlorida 2010: Advances in analysis, modeling & design, eds A. J. Puppala, D. Fratta, and B. Muhunthan (West Palm Beach, FL: ASCE), 3155–3164. doi: 10.1061/41095(365)322
Lucieer, A., Jong, S. M., and Turner, D. (2014). Mapping landslide displacements using structure from motion (SfM) and image correlation of multi-temporal UAV photography. Prog. Phys. Geogr. 38, 97–116. doi: 10.1177/0309133313515293
Luo, X., Ma, J., Zheng, J., and Shi, J. (2014). Finite element analysis of buried polyethylene pipe subjected to seismic landslide. J. Press. Vessel Technol. 136:031801. doi: 10.1115/1.4026148
Maciej, D., Anna, Z., Piotr, P., Korczak-Abshirec, M., Karsznia, I., and Chwedorzewska, K. J., et al., (2017). UAV-based detection and spatial analyses of periglacial landforms on Demay Point (King George Island, South Shetland Islands, Antarctica). Geomorphology 290, 29–38. doi: 10.1016/j.geomorph.2017.03.033
Mamuzo Edeki, S. G. (2020). Strain-Based Mechanical Failure Analysis of Buried Steel Pipeline Subjected to Landslide Displacement Using Finite Element Method. Electronic Theses and Dissertations. Brookings: South Dakota State University, 4110.
Meinen, B. U., and Robinson, D. T. (2020). Mapping erosion and deposition in an agricultural landscape: Optimization of UAV image acquisition schemes for SfM-MVS. Rem. Sens. Environ. 239:111666. doi: 10.1016/j.rse.2020.111666
Niethammer, U., James, M. R., Rothmund, S. J., Travelletti, J., and Joswig, M. (2012). UAV-based remote sensing of the Super-Sauze landslide: evaluation and results. Eng. Geol. 128, 2–11. doi: 10.1016/j.enggeo.2011.03.012
Niethammer, U., Rothmund, S., and Joswig, M. (2009). “UAV-based remote sensing of the slow-moving landslide Super-Sauze,” in Proceedings of the International Conference on Landslide Processes: From Geomorpholgic Mapping to Dynamic Modelling, Strasbourg.
Pineux, N., Lisein, J., Swerts, G., Bielders, C. L., Lejeune, P., and Colinet, G., et al., (2017). Can DEM time series produced by UAV be used to quantify diffuse erosion in an agricultural watershed? Geomorphology 280, 122–136. doi: 10.1016/j.geomorph.2016.12.003
Rusnák, M., Sládek, J., Kidová, A., and Lehotský, M. (2018). Template for high-resolution river landscape mapping using UAV technology. Measurement 115, 139–151. doi: 10.1016/j.measurement.2017.10.023
Shahverdian, S., Macfarlane, W., Stevens, G., Meier, M., and Wheaton, J. M. (2017). Geomorphic response to Pilot River Restoration on the San Rafael River. A Pilot Installation of Beaver Dam Analogues, Utah. Available online at: https://www.researchgate.net/publication/322133022 (accessed August 15, 2020).
Tan, Y., Wang, S., Xu, B., and Zhang, J. B. (2018). An improved progressive morphological filter for uav-based photogrammetric point clouds in river bank monitoring. ISPRS Journal of Photogrammetry and Remote Sensing 146, 421–429. doi: 10.1016/j.isprsjprs.2018.10.013
Tang, Z. Y. (2020). Rupture and explosion of natural gas pipeline caused by road collapse in Suide, Shaanxi Province. Available online at: https://m.baidu.com/sf_baijiahao/s?id=1674167473749322696&wfr=spider&for=pc&sa=vs_ob_realtime (accessed August 5, 2020).
Topal, T., and Akin, M. (2009). Geotechnical assessment of a landslide along a natural gas pipeline for possible remediations (Karacabey-Turkey). Environ. Geol. 57, 611–620. doi: 10.1007/s00254-008-1330-0
Vasconez, F., Estrella, M., Velastegui, A., Nunez, J., Ponce, H., and Riofrio, P. (2010). “Landslide hazard assessment, monitoring, and stabilization: villano oil pipeline system, ecuador,” in Proceedings of the SPE Annual Technical Conference and Exhibition (Florence: Society of Petroleum Engineers), doi: 10.2118/135504-MS
Vasseghi, A., Haghshenas, E., Soroushian, A., and Rakhshandeh, M. (2021). Failure analysis of a natural gas pipeline subjected to landslide. Eng. Fail. Anal. 119:105009. doi: 10.1016/j.engfailanal.2020.105009
Vergari, F., Della Seta, M., Del Monte, M., Fredi, P., and Lupia Palmieri, E. (2013). Long- and short-termevolution of several Mediterranean denudation hot spots: the role of rainfall variations and human impact. Geomorphology 183, 14–27. doi: 10.1016/j.geomorph.2012.08.002
Wang, F. X., and Pan, J. K. (2017). Explosion of Natural Gas Pipeline in Southwest Guizhou: 8 Dead and 35 Injured. Available online at: http://www.bjnews.com.cn/news/2017/07/02/448871.html?from=timeline&isappinstalled=0 (accessed July 3, 2017).
Wang, X. Q., Wang, M. M., Wang, S. Q., and Wu, Y. D. (2015). Extraction of vegetation information from visible unmanned aerial vehicle images. Trans. Chin. Soc. Agric. Eng. 31, 152–158.
Wheaton, J. M., Brasington, J., Darby, S. E., and Sear, D. A. (2010). Accounting for uncertainty in DEMs from repeat topographic surveys: improved sediment budgets. Earth Surf. Process. Landforms 35, 136–156. doi: 10.1002/esp.1886
Yan, Y., Cui, Y. F., Guo, J., Hu, S., Wang, Z., and Yin, S. (2020a). Landslide reconstruction using seismic signal characteristics and numerical simulations: case study of the 2017 “6.24” Xinmo landslide. Eng. Geol. 270:105582. doi: 10.1016/j.enggeo.2020.105582
Yan, Y., Cui, Y. F., Liu, D. Z., Tang, H., Li, Y. J., Tian, X., et al. (2021). Seismic signal characteristics and interpretation of the 2020 “6.17” Danba landslide dam failure hazard chain process. Landslides doi: 10.1007/s10346-021-01657-x
Yan, Y., Cui, Y. F., Tian, X., Hu, S., Guo, J., and Wang, Z., et al., (2020b). Seismic signal recognition and interpretation of the 2019 “7.23” Shuicheng landslide by seismogram stations. Landslides 17, 1191–1206. doi: 10.1007/s10346-020-01358-x
Yan, Y., Li, T., Liu, J., Wang, W., and Su, Q. (2019a). Monitoring and early warning method for a rockfall along railways based on vibration signal characteristics. Sci. Rep. 9:6606. doi: 10.1038/s41598-019-43146-1
Yan, Y., Yang, D. S., Geng, D. X., Hu, S., Wang, Z., and Hu, W., et al., (2019b). Disaster reduction stick equipment: a method for monitoring and early warning of pipeline-landslide hazards. J. Mount. Sci. 16, 2687–2700. doi: 10.1007/s11629-019-5613-6
Yilmaz, V., Konakoglu, B., Serifoglu, C., Gungor, O., and Gökalp, E. (2018). Image classification-based ground filtering of point clouds extracted from UAV-based aerial photos. Geocarto Int. 33, 310–320. doi: 10.1080/10106049.2016.1250825
Yuan, F., Wang, L., Guo, Z., and Shi, R. (2012). A refined analytical model for landslide or debris flow impact on pipelines. Part I: Surface pipelines. Appl. Ocean Res. 35, 95–104. doi: 10.1016/j.apor.2011.12.001
Yutaka, W., and Kawahara, Y. (2016). UAV photogrammetry for monitoring changes in river topography and vegetation. Proc. Eng. 154, 317–325. doi: 10.1016/j.proeng.2016.07.482
Zeybek, M., and Şanlıoğlu, İ. (2019). Point cloud filtering on UAV based point cloud. Measurement 133, 99–111. doi: 10.1016/j.measurement.2018.10.013
Zhang, J., Liang, Z., and Han, C. (2016). Mechanical behavior analysis of the buried steel pipeline crossing landslide area. J. Press. Vessel Technol. 138:051702. doi: 10.1115/1.4032991
Zhang, L., Fang, M., Pang, X., Yan, X., and Cao, Y. (2018). Mechanical behavior of pipelines subjecting to horizontal landslides using a new finite element model with equivalent boundary springs. Thin Walled Struct. 124, 501–513. doi: 10.1016/j.tws.2017.12.019
Zhang, S. Z., Li, S. Y., Chen, S. N., Wu, Z. Z., Wang, R. J., and Duo, Y. Q. (2017). Stress analysis on large-diameter buried gas pipelines under catastrophic landslides. Petrol. Sci. 14, 579–585. doi: 10.1007/s12182-017-0177-y
Keywords: water-related natural hazards, pipeline geological hazards, UAV survey, numerical simulation, hazard identification and assessment
Citation: Yan Y, Ma S, Yin S, Hu S, Long Y, Xie C and Jiang H (2021) Detection and Numerical Simulation of Potential Hazard in Oil Pipeline Areas Based on UAV Surveys. Front. Earth Sci. 9:665478. doi: 10.3389/feart.2021.665478
Received: 08 February 2021; Accepted: 29 March 2021;
Published: 30 April 2021.
Edited by:
Jia-wen Zhou, Sichuan University, ChinaReviewed by:
Resul Comert, Gumushane University, TurkeyChao Kang, University of Northern British Columbia, Canada
Copyright © 2021 Yan, Ma, Yin, Hu, Long, Xie and Jiang. This is an open-access article distributed under the terms of the Creative Commons Attribution License (CC BY). The use, distribution or reproduction in other forums is permitted, provided the original author(s) and the copyright owner(s) are credited and that the original publication in this journal is cited, in accordance with accepted academic practice. No use, distribution or reproduction is permitted which does not comply with these terms.
*Correspondence: Sheng Hu, c2hlbmdodUBud3UuZWR1LmNu