- 1Geography Earth and Environmental Sciences and Natural Resources and Environmental Studies Institute, University of Northern British Columbia, Prince George, BC, Canada
- 2Department of Geography, University of British Columbia, Vancouver, BC, Canada
The mass-balance—elevation relation for a given glacier is required for many numerical models of ice flow. Direct measurements of this relation using remotely-sensed methods are complicated by ice dynamics, so observations are currently limited to glaciers where surface mass-balance measurements are routinely made. We test the viability of using the continuity equation to estimate annual surface mass balance between flux-gates in the absence of in situ measurements, on five glaciers in the Columbia Mountains of British Columbia, Canada. Repeat airborne laser scanning surveys of glacier surface elevation, ice penetrating radar surveys and publicly available maps of ice thickness are used to estimate changes in surface elevation and ice flux. We evaluate this approach by comparing modeled to observed mass balance. Modeled mass-balance gradients well-approximate those obtained from direct measurement of surface mass balance, with a mean difference of +6.6
1 Introduction
Variation of surface mass balance with elevation, also known as a mass-balance gradient, characterizes the relation between a given glacier and climate (Meier and Post, 1962; Oerlemans and Hoogendoorn, 1989; Vallon et al., 1998), and regionally determines glacier distribution (Furbish and Andrews, 1984). Regional glacier models (e.g., Radić and Hock, 2011; Clarke et al., 2015; Rounce et al., 2020) must accurately represent balance gradients to reliably estimate ice flux. The distribution of mass balance is typically either prescribed using available glaciological balance data (Farinotti et al., 2009; Huss and Farinotti, 2012; Clarke et al., 2013; Bach et al., 2018) or simulated and calibrated with available mass-balance data (Clarke et al., 2015; Maussion et al., 2019). Observations of balance gradients are uncommon (Rea, 2009; WGMS, 2018) which hampers accurate model simulation of balance gradients. Geodetic estimates of mass change have become widespread (e.g., Berthier et al., 2014; Brun et al., 2017), but these estimates cannot be used to infer mass balance with elevation since elevation change at-a-point arises from both surface mass change and ice flux. Methods to quantify ice flux exist (e.g., Gudmundsson and Bauder, 1999; Berthier et al., 2003; Jarosch, 2008; Vincent et al., 2009; Bisset et al., 2020) but are limited in application by lack of input data regarding elevation and ice-flux changes.
The continuity equation shows the relationship between the rate of change of glacier thickness (
We assume that
Publically-available data now exist to estimate mass balance from the continuity equation (Eq. 1): surface height change data for glaciers (e.g., Berthier et al., 2014; Brun et al., 2017); density and glacier facies (Rabatel et al., 2017; Pelto et al., 2019); ice velocity (e.g., Burgess et al., 2013; Dehecq et al., 2019; Gardner et al., 2020); and ice thickness (e.g., Farinotti et al., 2019). Fewer than 1% of glaciers worldwide have long-term mass-balance observations (WGMS, 2018) or observations of subglacial topography (GlaThiDa, 2019). The lack of subglacial topographic information limits calculation of ice flux to relatively few glaciers (e.g., Berthier et al., 2003; Vincent et al., 2009; Belart et al., 2017; Rabatel et al., 2018; Bisset et al., 2020; Young et al., 2020). Previous efforts to infer the spatial distribution of mass balance from ice flux have primarily focused on glacier tongues (e.g., Gudmundsson and Bauder, 1999; Kääb and Funk, 1999; Berthier et al., 2003; Vincent et al., 2009, 2021; Berthier and Vincent, 2012; Gao et al., 2020), where ice thickness, glaciological balance and ice velocity measurements are most numerous, density is assumed to be that of ice, and glacier geometry is simplest.
The primary motivation for our study is to examine whether we can use remotely-sensed data to reliably estimate the altitude-mass balance relation (balance gradients) for five glaciers in the Columbia Basin, Canada. We use sequential airborne laser scanning (ALS) digital elevation models (DEMs) to calculate elevation-dependent changes in surface elevation and ice flow. We combine these data with radar surveys (Pelto et al., 2020) and ice thickness maps produced from surface inversion (Farinotti et al., 2019; Pelto et al., 2020) to solve the continuity equation (Eq. 1) using a “flux gate approach” (Berthier and Vincent, 2012). Flux gates provide the relation of mass balance to altitude by inferring the average surface mass balance between (or above or below) selected cross sections where the bedrock topography is known. This approach does not yield a complete spatial coverage of glacier mass balance, but is simpler and less data demanding than alternative methods (e.g., Hubbard et al., 2000; Sold et al., 2013; Belart et al., 2017; Young et al., 2020), and thus easier to apply for more glaciers. We collected field observations of surface mass balance (
2 Study Area: Columbia Mountains, Canada
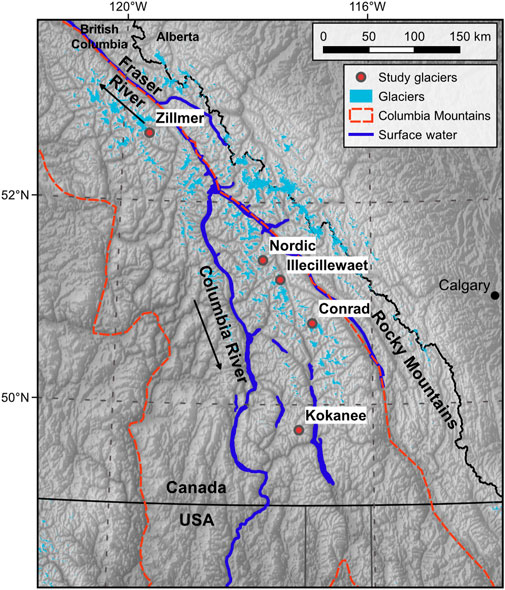
The Columbia Mountains are located in southeastern British Columbia, Canada and contain over 2,300 glaciers covering 1960 km2 (Bolch et al., 2010). These glaciers provide runoff to the Columbia and Fraser rivers (Figure 1). We selected five glaciers for which glaciological mass-balance measurements, geodetic surveys and ice thickness data exist: Conrad, Illecillewaet, Kokanee, Nordic, and Zillmer glaciers (Figure 1). Conrad Glacier is a valley glacier in the Purcell Mountains bordering Bugaboo Provincial Park with a 1,400 m elevation range (Table 1). Comprising half of Illecillewaet Névé, the broad Illecillewaet Glacier is part of a 22 km2 icefield within the Selkirk Mountains in Glacier National Park. Kokanee Glacier is a broad, small (1.8 km2) alpine glacier in the Purcell Mountains. Nordic Glacier is a steep alpine glacier in the Selkirk Mountains on the northern boundary of Glacier National Park. Zillmer Glacier is located in the Premier Range at the far north-western edge of the Columbia Basin.
3 Methods and Data
3.1 Ice Velocity
We calculate surface ice velocity with velocity mapping software,
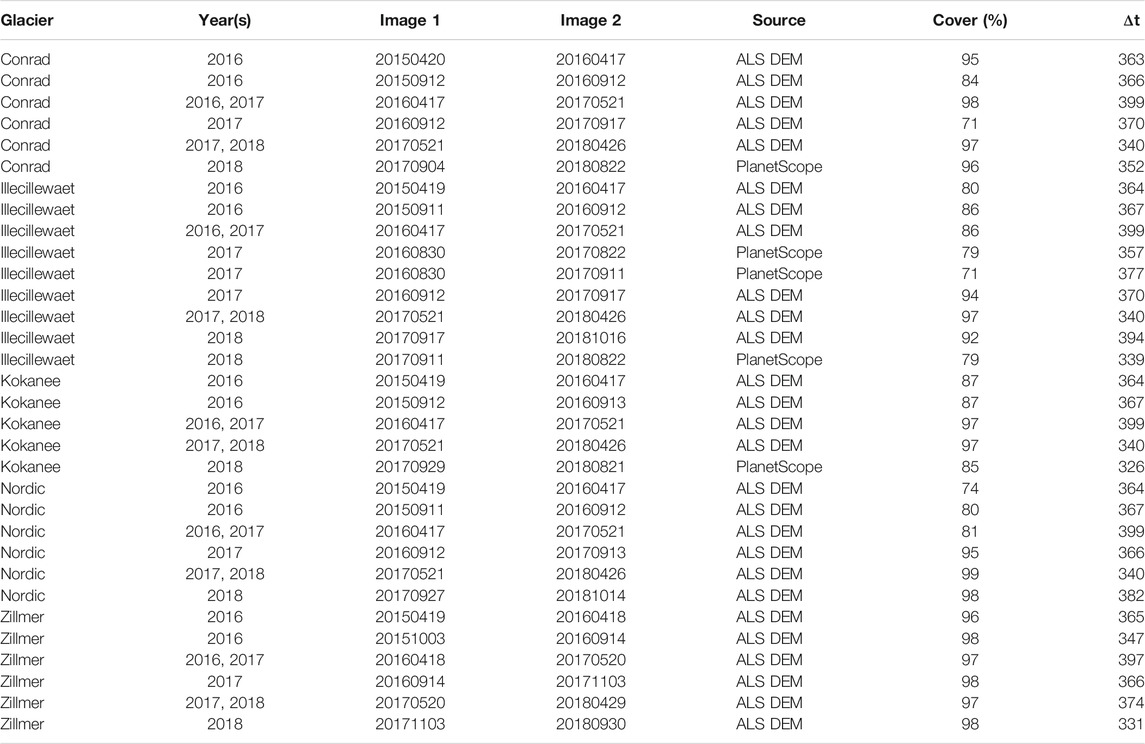
TABLE 2. Acquisition dates, sources and coverage of individual velocity fields. Year(s) documents which annual velocity mosaics the velocity fields contribute to.
3.2 Ice Thickness
We use ice penetrating radar (IPR) measurements of ice thickness from Pelto et al. (2020) for the five glaciers, with uncertainty estimated between 5 and 10% depending on the quality of the bed reflection. We assume an uncertainty of 10% for IPR observations (Pelto et al., 2020). We also use modeled ice thickness from Farinotti et al. (2019), Pelto et al. (2020). For the modeled ice thickness estimates, we double the average relative error from Pelto et al. (2020) for these five glaciers (5.1%) as we are using the ice thickness at-a-point rather than glacier-wide, yielding an uncertainty on ice thickness (
We correct modeled ice thickness for thinning that occurred between the date of the ice thickness estimates, which all used the Shuttle Radar Topographic Mission DEM and our 2016 LiDAR DEMs as described in Pelto et al. (2020). We also correct modeled and observed ice thickness for thinning which occurs during our three-year study using ALS DEMs.
3.3 Ice Flux
Our velocity fields (Figure 2) and ice thickness measurements (Figure 3) allow us to calculate ice flux at several cross-glacier “gates” approximately transverse to flow. We sample points every 25 m along each gate, effectively breaking each gate into small segments through which the ice flux is calculated and summed. We use our x and y velocity fields to calculate ice flow direction and magnitude. Due to the curvilinear nature of flow at our glaciers (Figure 2) we take the angle of a given flux gate to calculate the velocity perpendicular to that gate for each segment. To convert this velocity from mean-surface to depth-averaged velocity, we compare seasonal (June–September) to annual stake velocity estimates on Conrad Glacier (the only glacier where we measured seasonal stake velocities) and find that average seasonal surface velocities generally varied by less than 10%. Assuming the discrepancy between winter and summer velocity to represent sliding velocity (
which we find to be 85% of the surface velocity for (
where
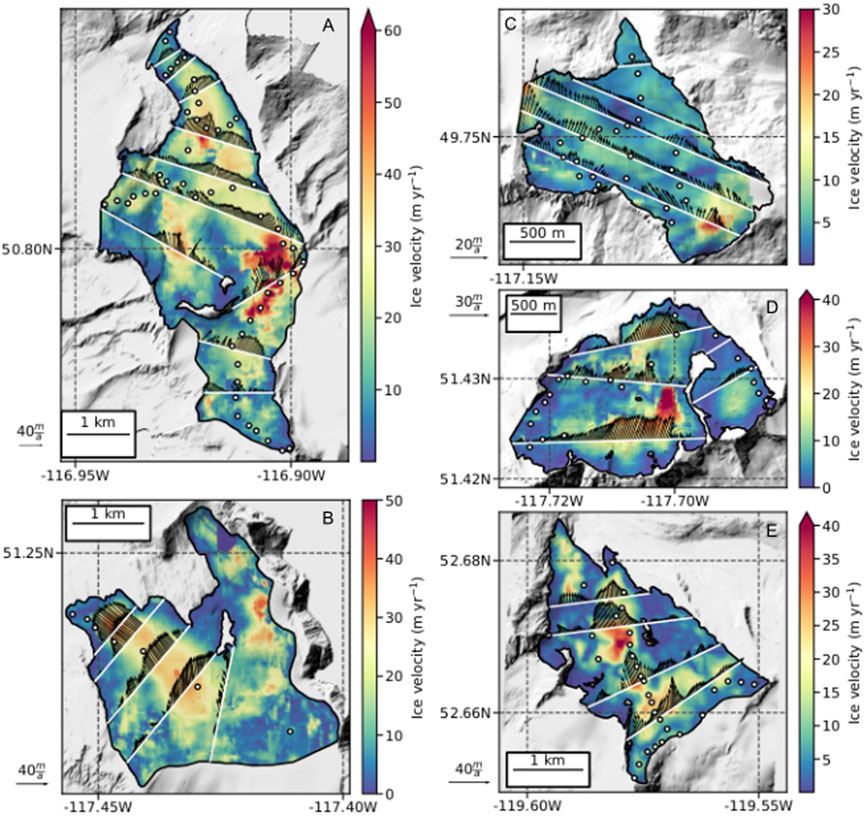
FIGURE 2. Surface velocity of (A) Conrad, (B) Illecillewaet, (C) Kokanee, (D) Nordic and (E) Zillmer glaciers. Velocity fields are 2018 mosaics of individual feature-tracking-derived velocity fields (Table 2). Flux gates are white lines and glaciological observations are white dots with black outline. Black arrows depict surface ice velocity vectors at the flux gates with variable scaling for visibility.
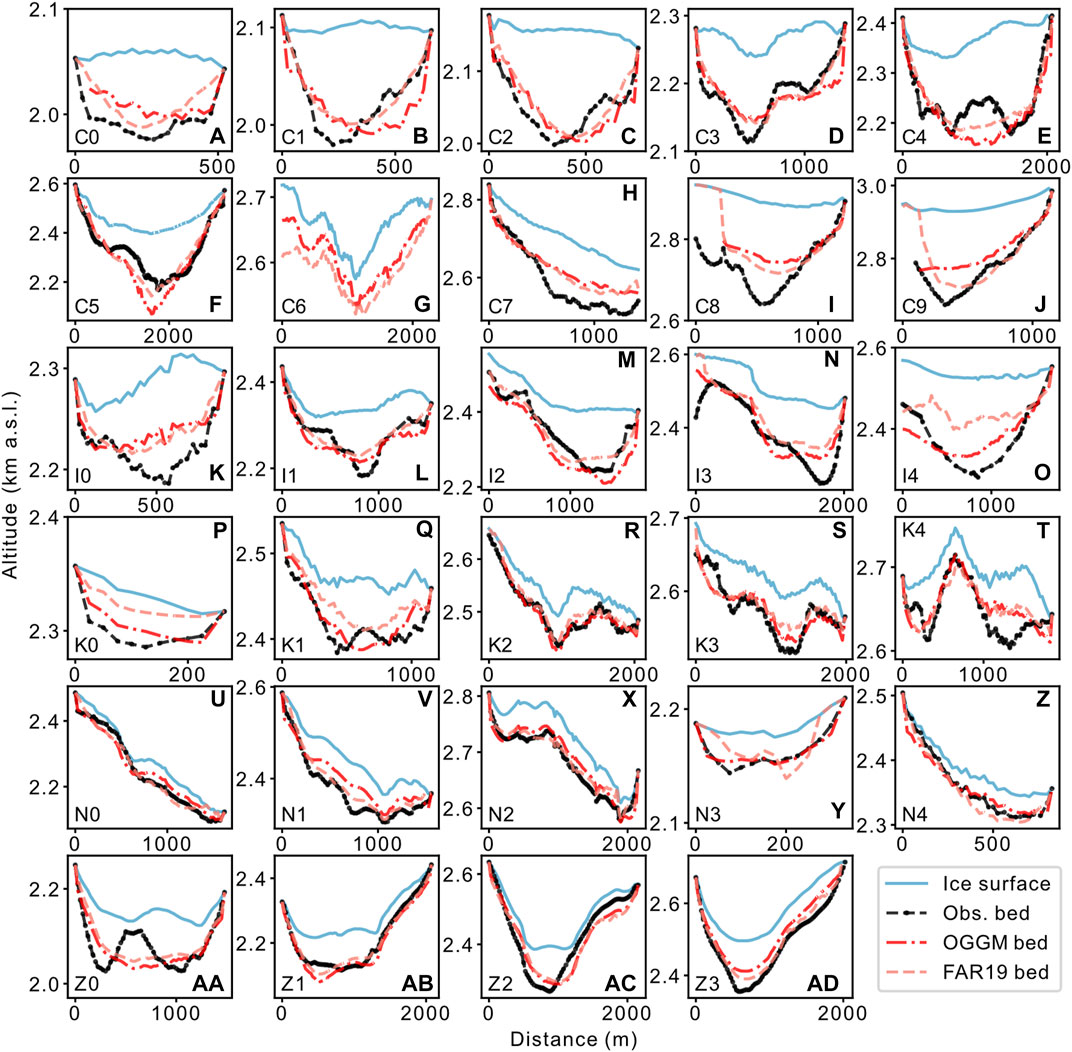
FIGURE 3. Flux gate cross-sections for (A–J) Conrad, (K–O) Illecillewaet, (P–T) Kokanee, Nordic (U–Z), and Zillmer (AA–AD) glaciers. Gates are numbered according to glacier, e.g., Conrad gate 0 = C0.
3.4 Surface Mass Balance
To calculate
We use coregistered 1 m resolution DEMs collected via repeat fixed-wing ALS surveys to generate
While our primary analysis excludes firn compaction, we test including
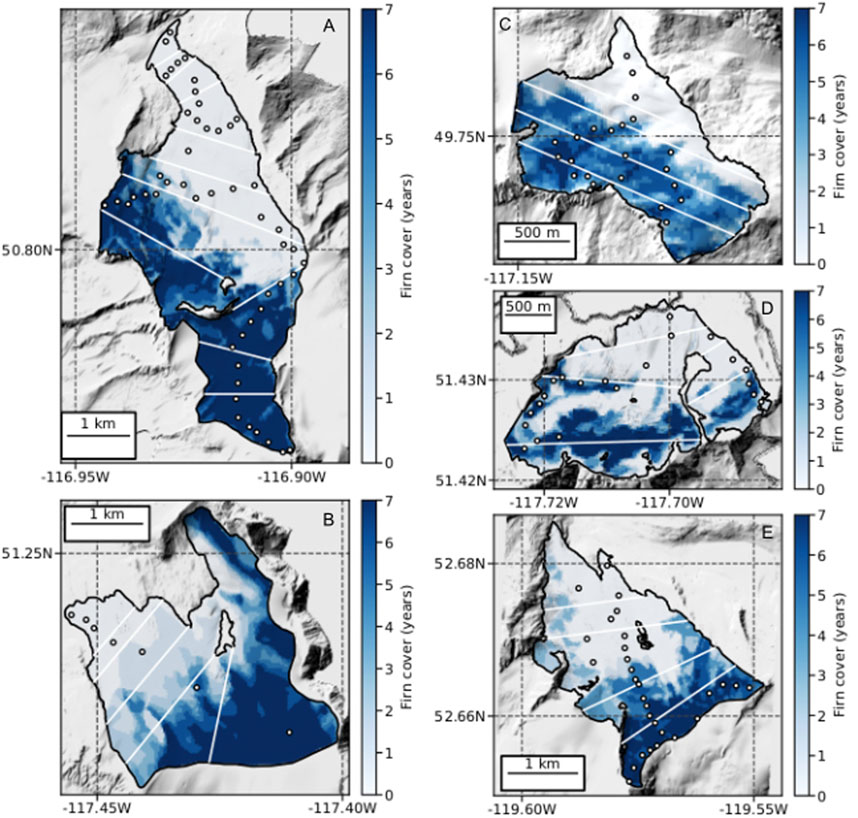
FIGURE 4. Accumulation area coverage derived from merging all recent accumulation area masks from 2012 to 2018 for (A) Conrad, (B) Illecillewaet, (C) Kokanee, (D) Nordic and (E) Zillmer glaciers. For a pixel with a value of seven, that pixel retained accumulation in all seven years. A value of zero implies a bare ice surface in all years. Flux gates are white lines and glaciological observations are white dots with black outline.
To estimate the mean density of each flux bin with retained accumulation (Figure 4), we use a firn model to estimate the density-depth relationship, which combined with the density of ice and mean ice thickness for the associated flux gate at the bottom of the bin, we estimate the mean column density of the flux bin. We use the Nabarro-Herring firn model (Arthern et al., 2010, Eq. 4), which we adapted from (Grinsted, 2021), fed with average annual temperature (Supplementary Figure 1), and average annual accumulation based on the nearest automatic snow weather station to each glacier (Supplementary Table 1) and a environmental lapse rate of −6.0 K km-1. We scale firn column thickness by firn area for each bin (Figure 4). More details are in Supplementary Material 1.
We assess our modeled
and
We use mean error (
We assess the mass-balance profile by approximating the profile as a single linear function (
We estimate the ELA by regressing modeled mass-balance. We compare these ELA to satellite-observations of the transient snow line (TSL), which we sample every 50 m. We estimate the satellite-ELA as the mean
3.5 Uncertainties
Systematic error in velocity can be assessed off-ice (e.g., Dehecq et al., 2019), and may stem from the cross-correlation itself, or DEM pre-processing. To assess systematic error, we quantify off-ice velocity, consider the uncertainty of the coregistration, and compare velocity fields against stake velocities. We assume coregistration accuracy of
While IPR observations are numerous, gaps in IPR data exist along some flux gates (Figure 3). We interpolate between the available measurements using a polynomial function (the degree of the polynomial function varies and is chosen to avoid overfitting i.e., unrealistic bed shapes) (Supplementary Figure 2), and where we interpolate, we assume an additional 10% uncertainty on ice thickness.
To calculate uncertainty in ice flux for a given gate (
To address uncertainty in our depth-averaged velocity (we approximate depth-averaged velocity as 85% of surface velocity), we consider full slip (depth-averaged velocity is 100% of surface velocity) and no slip (depth-averaged velocity is 80% of surface velocity) to produce a
Uncertainty on ice column density is taken as 10%. Uncertainties on
4 Results
4.1 Cross-Sectional Area
The ice thickness estimates from IPR, OGGM and FAR19 produce different cross-sectional areas and variable bed shapes (Figure 3). However, the ratios of cross-sectional area between adjacent gates have a median difference of 4.8% between the three sources. These ratios play a major role in the estimates of flux in and flux out for a given bin. IPR cross-sectional areas are, on average, 6.1
4.2 Surface and Vertical Ice Velocity
Average glacier-wide ice velocity for Conrad Glacier is 18.7
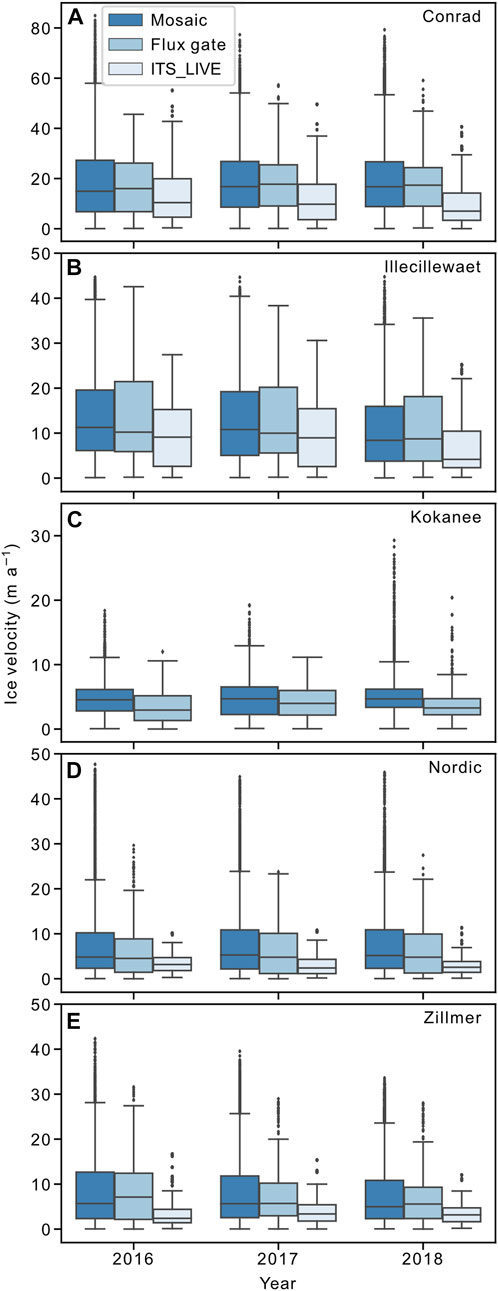
FIGURE 5. Surface ice velocity of each glacier from mosaics of our feature-tracking-derived annual velocity mosaics, for those mosaics as sampled along flux gates, and from ITS_LIVE annual mosaics. Boxplots depict 95% confidence interval (whiskers), interquartile (IQR) range (box), and median line.
The median and interquartile (IQR) range of our glacier-wide annual feature-tracking-derived velocity fields and those same velocity fields as sampled along the flux gates, are all within
We find a mean difference between our 99 stake velocity pairs and feature-tracking velocity of 1.7
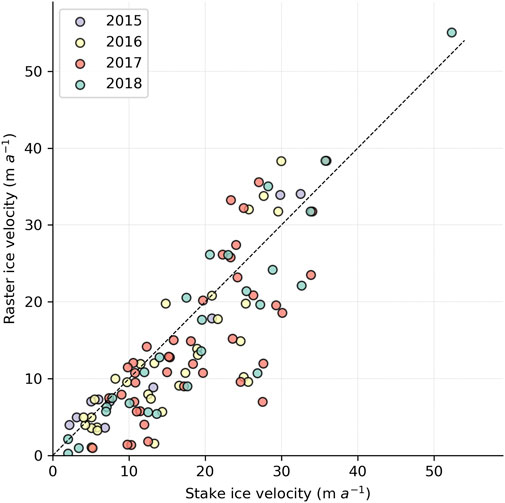
FIGURE 6. Surface ice velocity from 99 stake measurements on Conrad, Kokanee, Nordic and Zillmer glaciers vs. feature-tracking-derived velocity fields.
Flux-bin vertical ice velocities are generally between −2 and +3 m a−1 (Figure 7). Vertical ice velocities estimated at ablation stakes and from modeled ice flux are visually similar, but a quantitative comparison is not attempted. The model estimates are for entire flux bins and not intended to produce point observations. Our greatest observed stake emergence velocity was +3.2 m a−1, with a surface velocity of 47 m a−1. Further details are in Supplementary Material 4.

FIGURE 7. Vertical ice velocity from model estimates using the three ice thickness sources (IPR, OGGM, FAR19) and ablation stakes observations (Eq. 5), here averaged over the flux bins. The ELA is taken as the average ELA (defined here as the mean TSL elevation from satellite imagery at the end of the ablation season) from 2013 to 2018
4.3 Mass Balance
Modeled
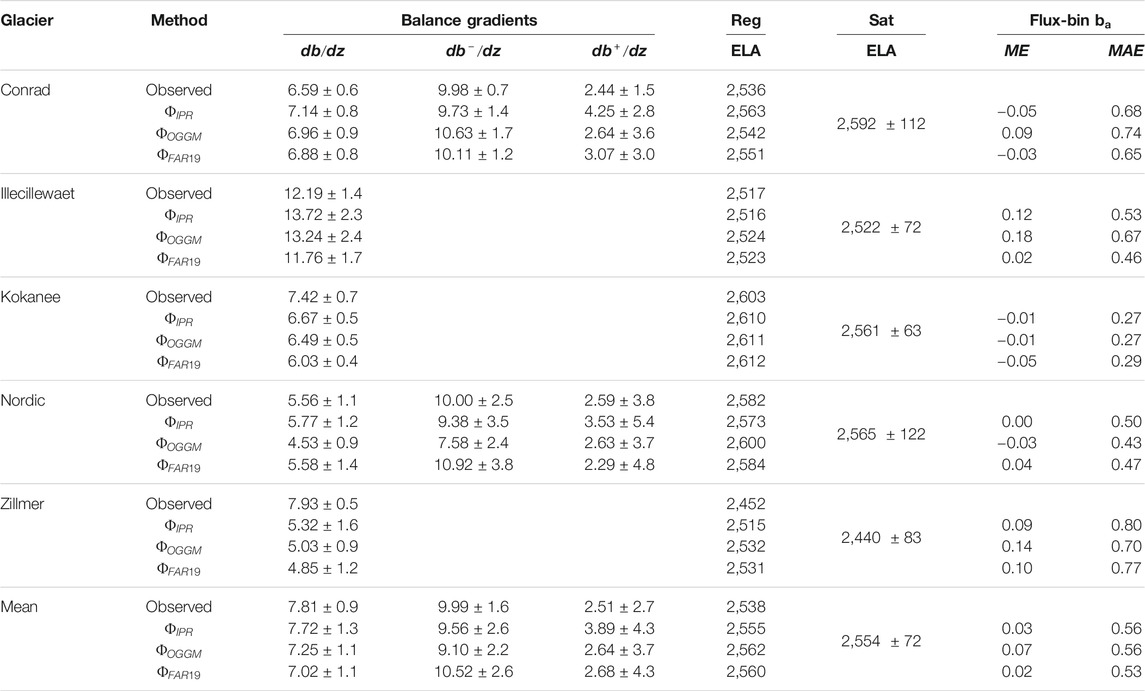
TABLE 3. Average mass-balance gradients (mm w.e. m−1), regression-estimated ELA (Reg), satellite-estimated ELA (Sat), and flux-bin
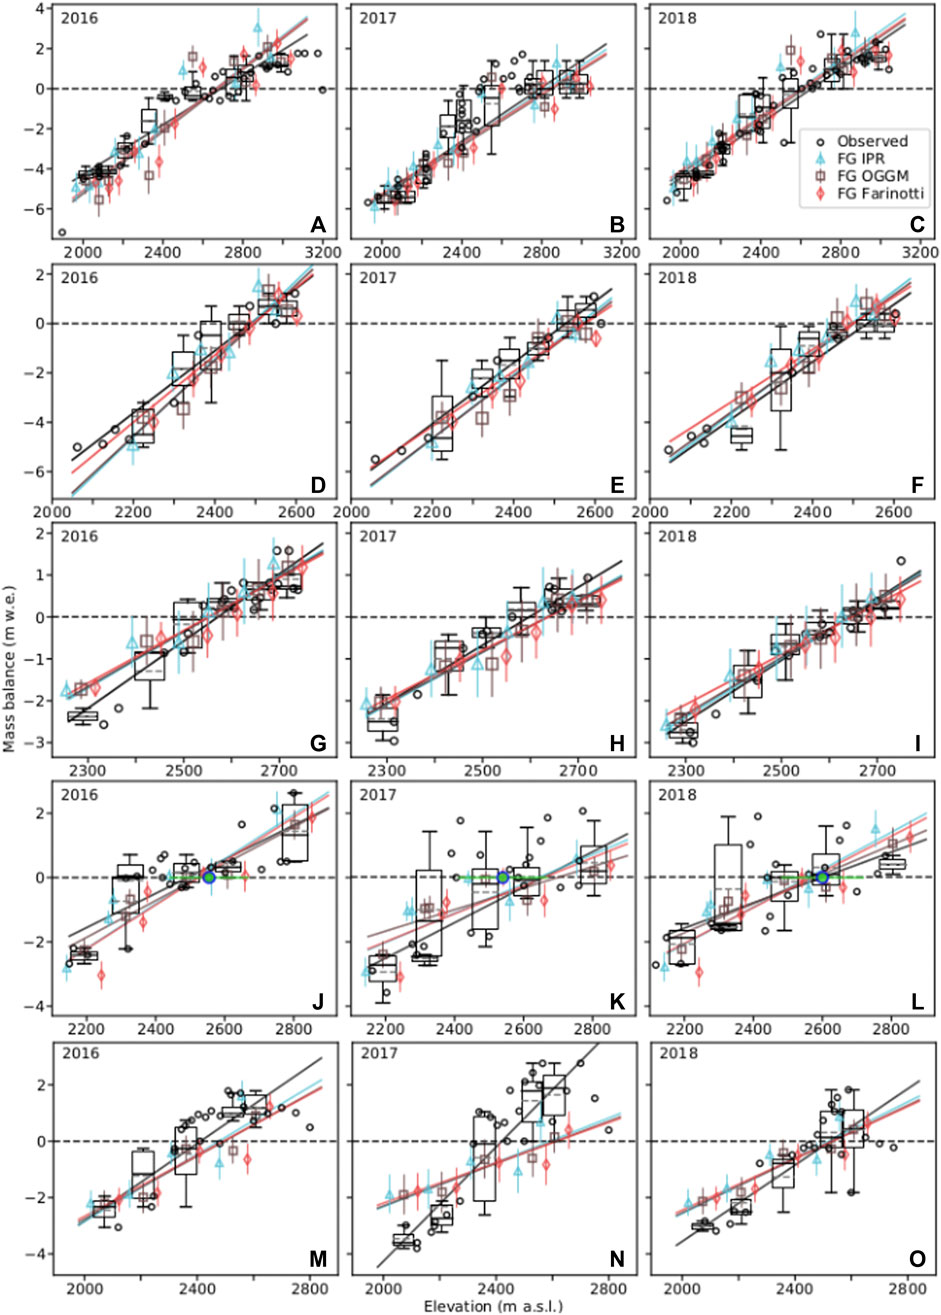
FIGURE 8. Observed and modeled (flux gate, FG)
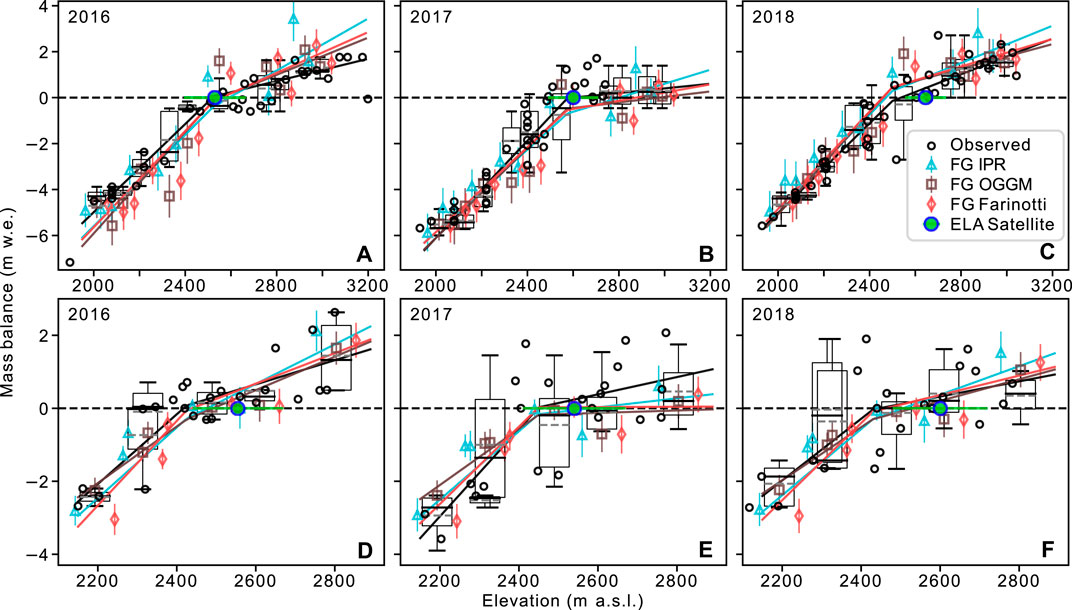
FIGURE 9. Observed and modeled (flux gate, FG)
Comparing observed and modeled flux-bin
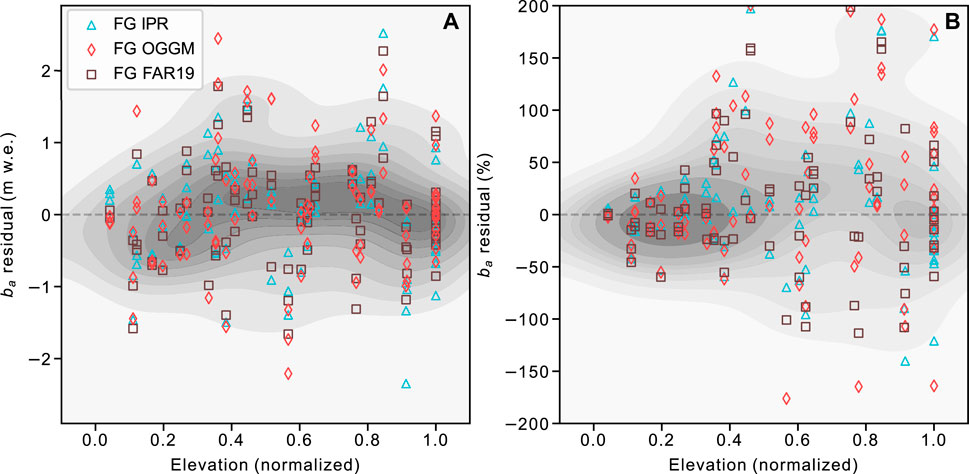
FIGURE 10. Mass-balance residuals (observed—modeled) for flux bins against normalized elevation for Conrad, Illecillewaet, and Kokanee glaciers. Residuals are expressed as (A) net residuals, and (B) percent residuals. All points are used for the kernel density estimation plot (grey) which represents the probability distribution as a non-parametric estimator of density. For (B), 40 large residuals
Our estimates of height change due to firn compaction range from 0.01 to 0.89 m a−1 for specific bins. Including our estimate of firn compaction for flux bins which contain retained accumulation, our balance gradients are 10.6% steeper than without firnification. The inclusion of firn compaction slightly reduces error for modeled
4.4 Uncertainty
We estimate ice velocity uncertainty (
5 Discussion
5.1 Does Our Modeled Mass Balance Achieve Mass Conservation?
We consider mass to be conserved if the sum of h (glaciological balance height change) and modeled
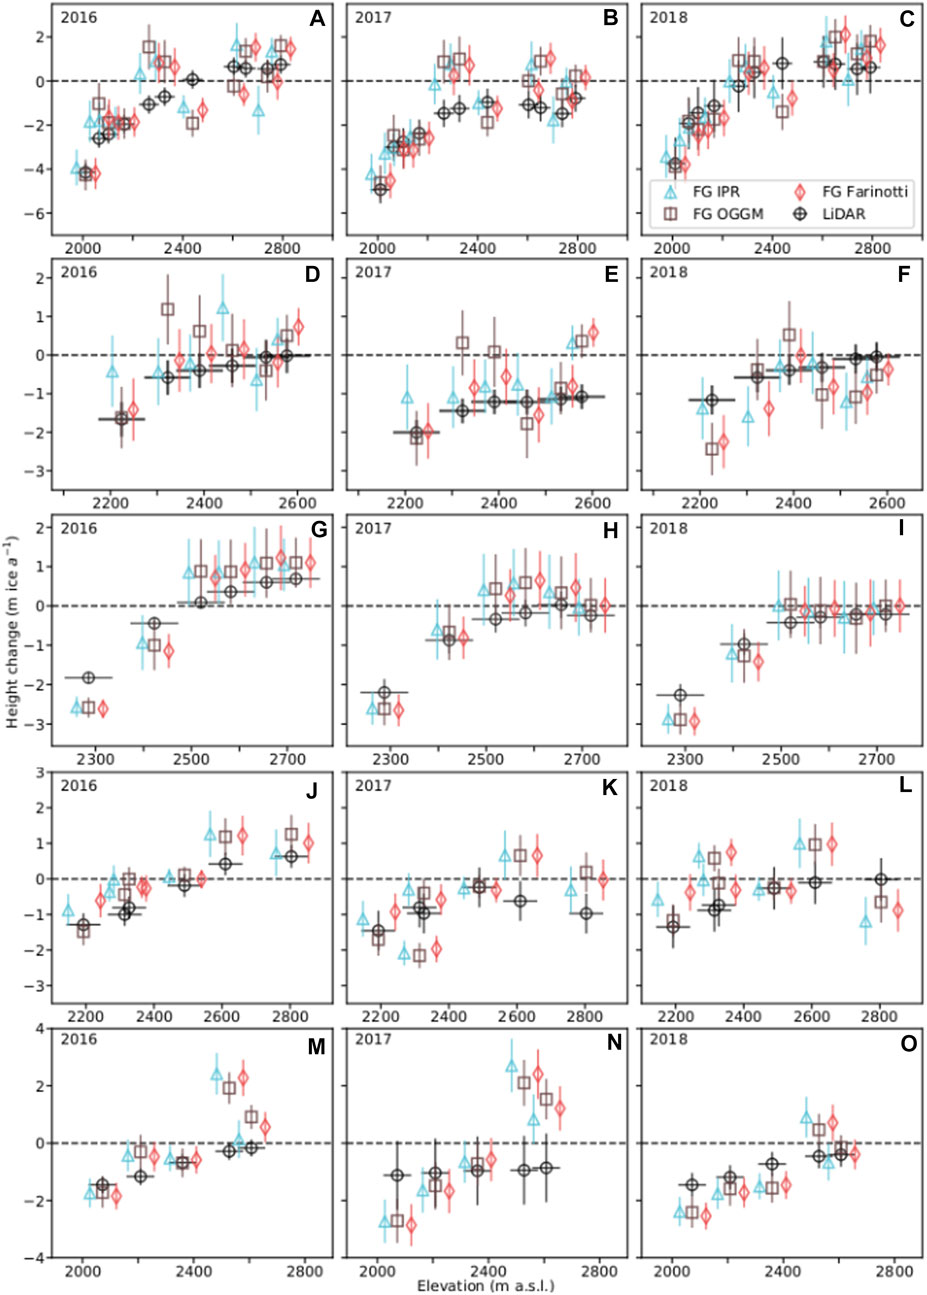
FIGURE 11. Mass conservation plot Conrad (A–C), Illecillewaet (D–F), Kokanee (G–I), Nordic (J–L) and Zillmer (M–O) glaciers for 2016, 2017, and 2018. The black error bars represent ALS-derived
5.2 Can we Reliably Reproduce the Mass-Balance Profile From Remotely Sensed Data?
Our modeled gradients from all three ice thickness sources accord with observed gradients (Table 3). We chose single linear functions (Figure 8), and piecewise linear functions (Figure 9) to define balance gradients (Furbish and Andrews, 1984), however,
Individual flux-bin
Our mass balance gradients are relatively insensitive to segmentation of the glacier (the number and location of flux gates), however, the flux bin estimates are sensitive to the segmentation. Using more gates we find that the altitude profile is more variable. Primary causes for this effect appear to be ice velocity sampling (e.g., adjacent gates on areas of faster flow and slower flow, respectively) and the effect of width scaling on cross-sectional area.
Including firn compaction steepens our mass balance gradients via an increase in accumulation zone
ITS_LIVE velocities systematically underestimate ice velocity (Figure 5). That our feature-tracking-derived ice velocities from 3 m resolution DEMs and optical satellite imagery are greater than those from ITS_LIVE is unsurprising, particularly for smaller glaciers with a large ratio of edge to interior pixels, yet the magnitude of the difference is surprising. Ice velocity and
Worse fit of
5.3 What Are the Primary Challenges to Flux Estimates of Mass Balance?
Challenges to calculate
The relative influence of
Our velocity fields from individual image pairs reveals tolerable inter-annual variability in ice velocity but often contained data gaps (Table 2). Variability among individual velocity fields is likely due to the quality of the DEMs from variability in ALS point density, noise and artifacts in the velocity fields and data coverage, as much as to real changes in ice velocity. We chose to produce a mosaic of velocity fields for each year separately to best represent potential inter-annual variability, though find that the mean difference between the annual and three-year mosaics were minor and within uncertainties. Using a single velocity mosaic rather than annual mosaics only slightly increases
The limitation of our validation dataset is the sparse nature of our glaciological observations for some bins. Calculations of
5.4 Can This Method Be Expanded?
Farinotti et al. (2019) (FAR19) produced globally distributed ice thickness maps and we suggest that they can be used to represent ice thickness to estimate
Recent efforts to remotely estimate surface mass balance are limited but growing (Bisset et al., 2020; Gao et al., 2020; Young et al., 2020; Vincent et al., 2021). Some of these approaches resolve point mass-balance but require data inputs which render them more suitable for individual glaciers (Young et al., 2020), or specific areas of individual glaciers (Vincent et al., 2021). Vincent et al. (2021) derive point surface mass balances from vertical ice velocities and surface elevation change. Their method estimates point surface mass balance, and demonstrates the potential for expanding the limited number of point observations of surface mass balance available globally, but relies upon an assumption of constant vertical ice velocities and requires a dense network of in situ observations, which limits application of their approach in space and time. Young et al. (2020) use a fully distributed mass-balance model driven by downscaled and bias-corrected climate-reanalysis data, requiring spatially distributed glacio-meteorological data (e.g., reanalysis products, weather station timeseries, in situ accumulation and ablation measurements). Their approach is best suited to quantify the mass budget of individual glaciers, particularly large, regionally significant glaciers. Remote-sensing-based mass-continuity approaches, like the one employed here and by Bisset et al. (2020), may be readily scaled up, and should expand the number of glaciers for which the mass balance-altitude relation can be quantified, providing model validation (of balance gradients) in a framework like that of OGGM (Maussion et al., 2019).
6 Conclusion
We use a mass-conservation approach to quantify the distribution of surface mass balance of five alpine glaciers over three years in the Columbia Mountains of BC, using an extensive dataset of field and remote-sensing observations. We quantify elevation change with annual 1 m resolution ALS DEMs. Our feature-tracking-derived velocity fields and three ice thickness sources, both modeled and observed, estimate ice fluxes through cross-sections. Our modeled mass-balance gradients (
Reasonable fit of modeled and observed
Data Availability Statement
The datasets presented in this study can be found in online repositories. The names of the repository/repositories and accession number(s) can be found below: The ice penetrating radar data used in this study can be found in the Glacier Thickness Database (GlaThiDa, https://www.gtn-g.ch/data_catalogue_glathida/). The glacier mass balance data can be found in the Fluctuations of Glaciers (FoG) Database (WGMS, 2018). Point observations of mass balance, DEMs, and ice velocity products are all available by request. Code used for the analyses can be found at https://github.com/bpelto/continuity_flux.
Author Contributions
Both authors contributed to the development of the research question and general conceptual approach. BP wrote all code, conducted the analyses and led the writing and production of the manuscript. Both authors reviewed and edited the manuscript.
Funding
This research was supported by the Canadian Columbia Basin Glacier and Snow Research Network (CCBGSRN) with funding from Columbia Basin Trust, BC Hydro, Tula Foundation, the Natural Sciences and Engineering Research Council of Canada, Canada Foundation for Innovation and Canada Research Chairs Program. Funding for BP was provided via a Pacific Institute for Climate Solutions fellowship, the University of Northern British Columbia, and the Columbia Basin Trust.
Conflict of Interest
The authors declare that the research was conducted in the absence of any commercial or financial relationships that could be construed as a potential conflict of interest.
Acknowledgments
We are grateful for the insightful feedback provided by Gwenn Flowers and BP’s committee members Shawn Marshall, Peter Jackson, Stephen Déry, and Roger Wheate. We thank Planet for access to their excellent imagery though their Ambassador program. We thank reviewers Evan Miles and Ellyn Enderlin and the Scientific Editor, Alun Hubbard, for providing detailed reviews that substantially improved our manuscript.
Supplementary Material
The Supplementary Material for this article can be found online at: https://www.frontiersin.org/articles/10.3389/feart.2021.675681/full#supplementary-material
References
Arthern, R. J., Vaughan, D. G., Rankin, A. M., Mulvaney, R., and Thomas, E. R. (2010). In Situ measurements of Antarctic Snow Compaction Compared with Predictions of Models. J. Geophys. Res. 115, F03011. doi:10.1029/2009jf001306
Bach, E., Radić, V., and Schoof, C. (2018). How Sensitive Are Mountain Glaciers to Climate Change? Insights from a Block Model. J. Glaciol. 64, 247–258. doi:10.1017/jog.2018.15
Beedle, M. J., Menounos, B., and Wheate, R. (2014). An Evaluation of Mass-Balance Methods Applied to Castle Creek Glacier, British Columbia, Canada. J. Glaciol. 60, 262–276. doi:10.3189/2014JoG13J091
Belart, J. M. C., Berthier, E., Magnússon, E., Anderson, L. S., Pálsson, F., Thorsteinsson, T., et al. (2017). Winter Mass Balance of Drangajökull Ice Cap (NW Iceland) Derived from Satellite Sub-meter Stereo Images. The Cryosphere 11, 1501–1517. doi:10.5194/tc-11-1501-2017
Berthier, E., Raup, B., and Scambos, T. (2003). New Velocity Map and Mass-Balance Estimate of Mertz Glacier, East Antarctica, Derived from Landsat Sequential Imagery. J. Glaciol. 49, 503–511. doi:10.3189/172756503781830377
Berthier, E., Vincent, C., Magnússon, E., Gunnlaugsson, Á. Þ., Pitte, P., Le Meur, E., et al. (2014). Glacier Topography and Elevation Changes Derived from Pléiades Sub-meter Stereo Images. The Cryosphere 8, 2275–2291. doi:10.5194/tc-8-2275-2014
Berthier, E., and Vincent, C. (2012). Relative contribution of surface mass-balance and ice-flux changes to the accelerated thinning of Mer de Glace, French Alps, over1979-2008. J. Glaciol. 58, 501–512. doi:10.3189/2012JoG11J083
Bisset, R. R., Dehecq, A., Goldberg, D. N., Huss, M., Bingham, R. G., and Gourmelen, N. (2020). Reversed Surface-Mass-Balance Gradients on Himalayan Debris-Covered Glaciers Inferred from Remote Sensing. Remote Sensing 12, 1563. doi:10.3390/rs12101563
Bolch, T., Menounos, B., and Wheate, R. (2010). Landsat-based Inventory of Glaciers in Western Canada, 1985-2005. Remote Sensing Environ. 114, 127–137. doi:10.1016/j.rse.2009.08.015
Brun, F., Berthier, E., Wagnon, P., Kääb, A., and Treichler, D. (2017). A Spatially Resolved Estimate of High Mountain Asia Glacier Mass Balances from 2000 to 2016. Nat. Geosci 10, 668–673. doi:10.1038/ngeo2999
Burgess, E. W., Forster, R. R., and Larsen, C. F. (2013). Flow Velocities of Alaskan Glaciers. Nat. Commun. 4, 2146. doi:10.1038/ncomms3146
Clarke, G. K. C., Anslow, F. S., Jarosch, A. H., Radić, V., Menounos, B., Bolch, T., et al. (2013). Ice Volume and Subglacial Topography for Western Canadian Glaciers from Mass Balance fields, Thinning Rates, and a Bed Stress Model. J. Clim. 26, 4282–4303. doi:10.1175/JCLI-D-12-00513.1
Clarke, G. K. C., Jarosch, A. H., Anslow, F. S., Radić, V., and Menounos, B. (2015). Projected Deglaciation of Western Canada in the Twenty-First century. Nat. Geosci 8, 372–377. doi:10.1038/ngeo2407
Cogley, J. G., Hock, R., Rasmussen, L., Arendt, A., Bauder, A., Braithwaite, R., et al. (2011). Glossary of Glacier Mass Balance and Related Terms, IHP-VII Technical Documents in Hydrology No. 86, IACS Contribution No. 2. Paris: International Hydrological Program, UNESCO, 114.
Cuffey, K. M., and Paterson, W. S. B. (2010). The Physics of Glaciers. fourth edn.. Burlington, MA: Elsevier.
Dehecq, A., Gourmelen, N., Gardner, A. S., Brun, F., Goldberg, D., Nienow, P. W., et al. (2019). Twenty-first century Glacier Slowdown Driven by Mass Loss in High Mountain Asia. Nat. Geosci 12, 22–27. doi:10.1038/s41561-018-0271-9
Dunse, T., Schuler, T. V., Hagen, J. O., Eiken, T., Brandt, O., and Høgda, K. A. (2009). Recent Fluctuations in the Extent of the Firn Area of Austfonna, Svalbard, Inferred from GPR. Ann. Glaciol. 50, 155–162. doi:10.3189/172756409787769780
Dussaillant, I., Berthier, E., Brun, F., Masiokas, M., Hugonnet, R., Favier, V., et al. (2019). Two Decades of Glacier Mass Loss along the Andes. Nat. Geosci. 12, 802–808. doi:10.1038/s41561-019-0432-5
Farinotti, D., Huss, M., Bauder, A., Funk, M., and Truffer, M. (2009). A Method to Estimate the Ice Volume and Ice-Thickness Distribution of alpine Glaciers. J. Glaciol. 55, 422–430. doi:10.3189/002214309788816759
Farinotti, D., Huss, M., Fürst, J. J., Landmann, J., Machguth, H., Maussion, F., et al. (2019). A Consensus Estimate for the Ice Thickness Distribution of All Glaciers on Earth. Nat. Geosci. 12, 168–173. doi:10.1038/s41561-019-0300-3
Frey, H., Machguth, H., Huss, M., Huggel, C., Bajracharya, S., Bolch, T., et al. (2014). Estimating the Volume of Glaciers in the Himalayan-Karakoram Region Using Different Methods. The Cryosphere 8, 2313–2333. doi:10.5194/tc-8-2313-2014
Furbish, D. J., and Andrews, J. T. (1984). The Use of Hypsometry to Indicate Long-Term Stability and Response of valley Glaciers to Changes in Mass Transfer. J. Glaciol. 30, 199–211. doi:10.3189/S0022143000005931
Gao, H., Zou, X., Wu, J., Zhang, Y., Deng, X., Hussain, S., et al. (2020). Post-20th century Near-Steady State of Batura Glacier: Observational Evidence of Karakoram Anomaly. Sci. Rep. 10, 987. doi:10.1038/s41598-020-57660-0
Gardner, A. S., Fahnnestock, M. A., and Scambos, T. A. (2020). ITS_LIVE Regional Glacier and Ice Sheet Surface Velocities. Data archived at National Snow and Ice Data Center. doi:10.5067/6II6VW8LLWJ7
GlaThiDa, (2019). Glacier Thickness Database 3.0.1. World Glacier Monitoring Service, Zurich, Switzerland. doi:10.5904/wgms-glathida-2019-03
Grinsted, A. (2021). Steady State Snow and Firn Density Model. Available at: https://www.mathworks.com/matlabcentral/fileexchange/47386-steady-state-snow-and-firn-density-model (Accessed March29 2021).
Gudmundsson, G. H., and Bauder, A. (1999). Towards an Indirect Determination of the Mass-Balance Distribution of Glaciers Using the Kinematic Boundary Condition. Geografiska Annaler A 81, 575–583. doi:10.1111/j.0435-3676.1999.00085.x
Heid, T., and Kääb, A. (2012). Repeat Optical Satellite Images Reveal Widespread and Long Term Decrease in Land-Terminating Glacier Speeds. The Cryosphere 6, 467–478. doi:10.5194/tc-6-467-2012
Helfricht, K., Huss, M., Fischer, A., and Otto, J.-C. (2019). Calibrated Ice Thickness Estimate for All Glaciers in Austria. Front. Earth Sci. 7, 68. doi:10.3389/feart.2019.00068
Hubbard, A., Willis, I., Sharp, M., Mair, D., Nienow, P., Hubbard, B., et al. (2000). Glacier Mass-Balance Determination by Remote Sensing and High-Resolution Modelling. J. Glaciol. 46, 491–498. doi:10.3189/172756500781833016
Huss, M., and Farinotti, D. (2012). Distributed Ice Thickness and Volume of All Glaciers Around the globe. J. Geophys. Res. 117, F04010–n. doi:10.1029/2012JF002523
Jarosch, A. H. (2008). Icetools: A Full Stokes Finite Element Model for Glaciers. Comput. Geosciences 34, 1005–1014. doi:10.1016/j.cageo.2007.06.012
Kääb, A., and Funk, M. (1999). Modelling Mass Balance Using Photogrammetric and Geophysical Data: a Pilot Study at Griesgletscher, Swiss Alps. J. Glaciol. 45, 575–583. doi:10.3189/S0022143000001453
Klug, C., Bollmann, E., Galos, S. P., Nicholson, L., Prinz, R., Rieg, L., et al. (2018). Geodetic Reanalysis of Annual Glaciological Mass Balances (2001-2011) of Hintereisferner, Austria. The Cryosphere 12, 833–849. doi:10.5194/tc-12-833-2018
Kuhn, M. (1984). Mass Budget Imbalances as Criterion for a Climatic Classification of Glaciers. Geografiska Annaler: Ser. A, Phys. Geogr. 66, 229–238. doi:10.1080/04353676.1984.11880111
Magnússon, E., Muñoz-Cobo Belart, J., Pálsson, F., Ágústsson, H., and Crochet, P. (2016). Geodetic Mass Balance Record with Rigorous Uncertainty Estimates Deduced from Aerial Photographs and Lidar Data - Case Study from Drangajökull Ice Cap, NW Iceland. The Cryosphere 10, 159–177. doi:10.5194/tc-10-159-2016
Malone, A. G. O., Doughty, A. M., and Macayeal, D. R. (2019). Interannual Climate Variability Helps Define the Mean State of Glaciers. J. Glaciol. 65, 508–517. doi:10.1017/jog.2019.28
Maussion, F., Butenko, A., Champollion, N., Dusch, M., Eis, J., Fourteau, K., et al. (2019). The Open Global Glacier Model (OGGM) v1.1. Geosci. Model. Dev. 12, 909–931. doi:10.5194/gmd-12-909-2019
Mcnabb, R. W., Hock, R., O’Neel, S., Rasmussen, L. A., Ahn, Y., Braun, M., et al. (2012). Using Surface Velocities to Calculate Ice Thickness and Bed Topography: a Case Study at Columbia Glacier, Alaska, USA. J. Glaciol. 58, 1151–1164. doi:10.3189/2012JoG11J249
Meier, M. F., and Post, A. S. (1962). Recent Variations in Mass Net Budgets of Glaciers in Western North America. IAHS Publ. 58, 63–77.
O'Neel, S., McNeil, C., Sass, L. C., Florentine, C., Baker, E. H., Peitzsch, E., et al. (2019). Reanalysis of the US Geological Survey Benchmark Glaciers: Long-Term Insight into Climate Forcing of Glacier Mass Balance. J. Glaciol. 65, 850–866. doi:10.1017/jog.2019.66
Oerlemans, J., and Hoogendoorn, N. C. (1989). Mass-Balance Gradients and Climatic Change. J. Glaciol. 35, 399–405. doi:10.3189/S0022143000009333
Pelto, B. M., Maussion, F., Menounos, B., Radić, V., and Zeuner, M. (2020). Bias-corrected Estimates of Glacier Thickness in the Columbia River Basin, Canada. J. Glaciol. 66, 1051–1063. doi:10.1017/jog.2020.75
Pelto, B. M., Menounos, B., and Marshall, S. J. (2019). Multi-year Evaluation of Airborne Geodetic Surveys to Estimate Seasonal Mass Balance, Columbia and Rocky Mountains, Canada. The Cryosphere 13, 1709–1727. doi:10.5194/tc-13-1709-2019
Pfeffer, W. T., Arendt, A. A., Bliss, A., Bolch, T., Cogley, J. G., Gardner, A. S., et al. (2014). The Randolph Glacier Inventory: A Globally Complete Inventory of Glaciers. J. Glaciol. 60, 537–552. doi:10.3189/2014JoG13J176
Rabatel, A., Dedieu, J.-P., and Vincent, C. (2005). Using Remote-Sensing Data to Determine Equilibrium-Line Altitude and Mass-Balance Time Series: Validation on Three French Glaciers, 1994-2002. J. Glaciol. 51, 539–546. doi:10.3189/172756505781829106
Rabatel, A., Sanchez, O., Vincent, C., and Six, D. (2018). Estimation of Glacier Thickness from Surface Mass Balance and Ice Flow Velocities: A Case Study on Argentière Glacier, France. Front. Earth Sci. 6, 112. doi:10.3389/feart.2018.00112
Rabatel, A., Sirguey, P., Drolon, V., Maisongrande, P., Arnaud, Y., Berthier, E., et al. (2017). Annual and Seasonal Glacier-wide Surface Mass Balance Quantified from Changes in Glacier Surface State: A Review on Existing Methods Using Optical Satellite Imagery. Remote Sensing 9, 507. doi:10.3390/rs9050507
Radić, V., and Hock, R. (2011). Regionally Differentiated Contribution of Mountain Glaciers and Ice Caps to Future Sea-Level Rise. Nat. Geosci 4, 91–94. doi:10.1038/ngeo1052
Rea, B. R. (2009). Defining Modern Day Area-Altitude Balance Ratios (AABRs) and Their Use in Glacier-Climate Reconstructions. Quat. Sci. Rev. 28, 237–248. doi:10.1016/j.quascirev.2008.10.011
Rounce, D. R., Hock, R., and Shean, D. E. (2020). Glacier Mass Change in High Mountain Asia through 2100 Using the Open-Source Python Glacier Evolution Model (PyGEM). Front. Earth Sci. 7, 331. doi:10.3389/feart.2019.00331
Shean, D. E., Alexandrov, O., Moratto, Z. M., Smith, B. E., Joughin, I. R., Porter, C., et al. (2016). An Automated, Open-Source Pipeline for Mass Production of Digital Elevation Models (DEMs) from Very-High-Resolution Commercial Stereo Satellite Imagery. ISPRS J. Photogrammetry Remote Sensing 116, 101–117. doi:10.1016/j.isprsjprs.2016.03.012
Shean, D. E., Bhushan, S., Montesano, P., Rounce, D. R., Arendt, A., and Osmanoglu, B. (2020). A Systematic, Regional Assessment of High Mountain Asia Glacier Mass Balance. Front. Earth Sci. 7, 363. doi:10.3389/feart.2019.00363
Sold, L., Huss, M., Eichler, A., Schwikowski, M., and Hoelzle, M. (2015). Unlocking Annual Firn Layer Water Equivalents from Ground-Penetrating Radar Data on an alpine Glacier. The Cryosphere 9, 1075–1087. doi:10.5194/tc-9-1075-2015
Sold, L., Huss, M., Hoelzle, M., Andereggen, H., Joerg, P. C., and Zemp, M. (2013). Methodological Approaches to Infer End-Of-winter Snow Distribution on alpine Glaciers. J. Glaciol. 59, 1047–1059. doi:10.3189/2013JoG13J015
Tennant, C., and Menounos, B. (2013). Glacier Change of the Columbia Icefield, Canadian Rocky Mountains, 1919-2009. J. Glaciol. 59, 671–686. doi:10.3189/2013JoG12J135
Vallon, M., Vincent, C., and Reynaud, L. (1998). Altitudinal Gradient of Mass-Balance Sensitivity to Climatic Change from 18 Years of Observations on Glacier d'Argentière, France. J. Glaciol. 44, 93–96. doi:10.3189/S0022143000002380
Vincent, C., Cusicanqui, D., Jourdain, B., Laarman, O., Six, D., Gilbert, A., et al. (2021). Geodetic point Surface Mass Balances: A New Approach to Determine point Surface Mass Balances from Remote Sensing Measurements. The Cryosphere 1–30. doi:10.5194/tc-2020-239
Vincent, C., Soruco, A., Six, D., and Le Meur, E. (2009). Glacier Thickening and Decay Analysis from 50 Years of Glaciological Observations Performed on Glacier d'Argentière, Mont Blanc Area, France. Ann. Glaciol. 50, 73–79. doi:10.3189/172756409787769500
WGMS (2018). Fluctuations of Glaciers Database. Zurich, Switzerland: World Glacier Monitoring Service. doi:10.5904/wgms-fog-2018-11
Young, E. M., Flowers, G. E., Berthier, E., and Latto, R. (2020). An Imbalancing Act: the Delayed Dynamic Response of the Kaskawulsh Glacier to Sustained Mass Loss. J. Glaciol. , 67, 313. doi:10.1017/jog.2020.107
Keywords: ice flux, glacier mass balance, ice velocity, flux gate, ice thickness, balance gradient, geodetic mass balance
Citation: Pelto BM and Menounos B (2021) Surface Mass-Balance Gradients From Elevation and Ice Flux Data in the Columbia Basin, Canada. Front. Earth Sci. 9:675681. doi: 10.3389/feart.2021.675681
Received: 03 March 2021; Accepted: 30 June 2021;
Published: 19 July 2021.
Edited by:
Alun Hubbard, Aberystwyth University, United KingdomReviewed by:
Evan Stewart Miles, Swiss Federal Institute for Forest, Snow and Landscape Research (WSL), SwitzerlandEllyn Mary Enderlin, University of Maine, United States
Copyright © 2021 Pelto and Menounos. This is an open-access article distributed under the terms of the Creative Commons Attribution License (CC BY). The use, distribution or reproduction in other forums is permitted, provided the original author(s) and the copyright owner(s) are credited and that the original publication in this journal is cited, in accordance with accepted academic practice. No use, distribution or reproduction is permitted which does not comply with these terms.
*Correspondence: Ben M. Pelto, YmVuLnBlbHRvQHViYy5jYQ==
 Ben M. Pelto
 Brian Menounos1