 Maren Böse1*
 Allie A. Hutchison1,2
 Isabelle Manighetti2
 Jiawei Li3
 Frédérick Massin1
 John Francis Clinton1
- 1Eidgenössische Technische Hochschule (ETH), Swiss Seismological Service (SED), Zurich, Switzerland
- 2Université Côte d’Azur, Observatoire de la Côte d’Azur, IRD, CNRS, Géoazur, Sophia Antipolis, Nice, France
- 3Southern University of Science and Technology (SUSTech), Institute of Risk Analysis, Prediction and Management (Risks-X), Shenzhen, China
The Finite-Fault Rupture Detector (FinDer) algorithm computes rapid line-source rupture models from high-frequency seismic acceleration amplitudes (PGA). In this paper, we propose two extensions to FinDer, called FinDerS and FinDerS+, which have the advantage of taking into account a geological property of the source fault, its structural maturity, as well as its relation to the earthquake slip distribution. These two new algorithms calculate real-time earthquake slip profiles by backprojecting seismic and/or geodetic displacement amplitudes onto the FinDer line-source. This backprojection is based on a general empirical equation established in previous work that relates dynamic peak ground displacement (PGD) at the stations to on-fault coseismic slip. While FinDerS projects PGD onto the current FinDer line-source, FinDerS+ allows the rupture to grow beyond the current model extent to predict future rupture evolution. For an informed interpolation and smoothing of the estimated slip values, FinDerS and FinDerS+ both employ a generic empirical function that has been shown to relate the along-strike gradient of structural maturity of the ruptured fault, the earthquake slip distribution, and the rupture length. Therefore, while FinDer derives magnitudes from a relatively uncertain and general empirical rupture length-magnitude relations, FinDerS and FinDerS+ provide alternate and better informed magnitude estimates using the mean slip of the profiles derived from the integration of fault source maturity. The two new algorithms can incorporate both seismic strong-motion and geodetic displacement data. In order to recover PGD from strong-motion instruments, we double-integrate and high-pass filter (
1 Introduction
Earthquake early warning (EEW) uses real-time data from an ongoing earthquake to provide seconds of warning to people and users prior to the arrival of strong ground motions (e.g. Allen et al., 2009; Clinton et al., 2016; Allen and Melgar, 2019). Using the earliest radiated energy, EEW systems attempt to rapidly characterize the final size of an earthquake and to predict seismic ground motions in potentially affected areas. The timing of EEW depends on multiple factors, including the speed of the earthquake fault source location and size characterization, the distance from the earthquake’s source to the alert recipient, as well as delays for data transmission and processing. Different approaches exist to constrain the location and size of the ongoing earthquake, including for instance the Earthquake Point-Source Integrated Code (EPIC; Chung et al. (2019), Virtual Seismologist [VS; Cua et al. (2009)], PRobabilistic and Evolutionary early warning SysTem [PRESTo; Satriano et al. (2011)], Propagation of Local Undamped Motion [PLUM; Kodera et al. (2018)], and Finite-Fault Rupture Detector [FinDer; Böse et al. (2018)] algorithms. In addition to these regional, network-based EEW approaches, a number of faster, though less accurate, single-station onsite algorithms have been proposed (e.g. Wu et al., 2006; Böse et al., 2012a). Regional EEW algorithms differ in how they utilize the energy radiated from a growing earthquake to derive information about the source fault. EPIC, for instance, uses trilateration and a grid search to determine the earthquake location, while the magnitude is estimated from empirical scaling relations (Chung et al., 2019). FinDer generates line-source models (i.e., location, strike, and length of the fault source) from the spatial distribution of high-frequency ground motions (Böse et al., 2012b). PLUM, by contrast, does not determine the earthquake fault source properties, but simply extrapolates observed motions to larger distances (Kodera et al., 2018).
Large earthquakes provide the best opportunity to implement EEW: they are associated with long fault ruptures of tens to hundreds of kilometers in length. Since earthquake ruptures typically propagate at fairly low speed (about 2.8 km/s), warning times to affected areas can thus exceed several tens of seconds, allowing efficient EEW. In small and moderate-sized (M
A recent study by Hutchison et al. (2020) showed that the final rupture length of an earthquake can be predicted from 20%, and its magnitude from 15% of the way through the rupture length, if the earthquake slip is known accurately and some intrinsic long-term properties of the source fault, namely its structural maturity, were considered. Structural maturity relates to the longevity of fault slip over geological time; the longer the slip history, the more mature the fault is overall (Manighetti et al., 2007). Additionally, a fault extends laterally (i.e., propagates) as it grows over the long-term (commonly, millions of years), generating a gradient in structural maturity along its length: the more mature part of the fault is where it originally initiated, while the fault becomes increasingly more immature towards its propagating tip(s) (Manighetti et al., 2001). Interestingly, as a fault or fault section becomes more mature, some of its geometrical (i.e., segment connections) and mechanical (damage compliance and possibly friction) properties evolve, and these changes impact an earthquake’s behavior (Wesnousky, 1988; Manighetti et al., 2007; Perrin et al., 2016a). In particular, coseismic earthquake slip is greatest on the most mature section of the ruptured fault, generating an asymmetry in the earthquake slip-length distribution (Manighetti et al., 2005; Perrin et al., 2016a). Hutchison et al. (2020) formalized this generic relation between the along-strike fault maturity gradient and the earthquake slip asymmetry, and demonstrated that this empirical equation can be used to anticipate the final earthquake rupture length from several slip values measured in the first stages of the rupture growth, provided these slip values are accurately determined.
However, the study of Hutchison et al. (2020) was done on final static earthquake slip profiles, that is, the time required to reach and to calculate final displacements is neglected. Furthermore, the slip profiles are accurate as they were measured in the field or remote data right after the earthquakes. Here, we explore the application of the algorithm in a retrospective study by simulating the real-time streams of seismic and geodetic data in a regional network recording a growing earthquake. In order for this to operate, it is necessary that we can generate an earthquake slip profile in real-time. This requires two pieces of information: 1) a finite-source model that characterizes the spatial dimensions (i.e., location, length) and orientation (i.e., strike) of the fault source and that updates in real-time based on the growing available data, and 2) a real-time estimated slip distribution along this source model. For the first element, we utilize in this study the line-source models computed from the Finite-Fault Rupture Detector (FinDer) algorithm (Böse et al., 2012b, 2015, 2018). For the second element, we utilize an empirically-based algorithm (Aagaard et al., 2004; Yamada, 2007) that backprojects dynamic peak ground displacement (PGD) amplitudes from individual stations onto this source model to determine slip (FinDerS, FinDerS+).
We test the FinDer algorithms here on three earthquakes for which available data are dense enough: the 2019 MW 7.1 Ridgecrest, California, the 2016 MW 7.0 Kumamoto, Japan, and the 2008 MW 7.9 Wenchuan, China, earthquakes.
2 Methods
The three FinDer algorithms presented in this paper exploit the full spectrum of seismic ground-motions (Figure 1): FinDer (Böse et al., 2012b; Böse et al., 2015; Böse et al., 2018) derives a line-source model from high-frequency amplitudes; FinDerS and FinDerS+ determine the static offsets along this model from low-frequency displacement. FinDerS and FinDerS+ both estimate slip profiles along the source fault by backprojecting dynamic displacement (PGD) amplitudes onto the FinDer source model. However, while FinDerS projects PGD onto the current line-source, FinDerS+ allows the rupture to grow beyond the current model to predict future rupture evolution. For an informed interpolation and smoothing of the estimated slip values, FinDerS and FinDerS+ both employ the generic empirical relationship developed by Hutchison et al. (2020) that relates the along-strike gradient of long-term structural maturity of the ruptured fault to the coseismic slip distribution along the rupture. With both PGA and PGD changing over time, estimates from FinDer, FinDerS, and FinDerS+ are continuously updated. Each of these processes is described in more detail in the following.
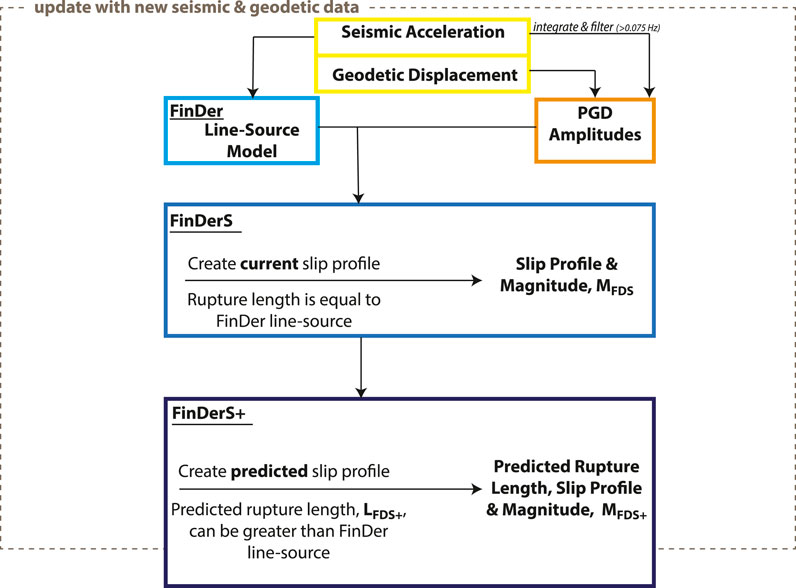
FIGURE 1. Schematic illustration of FinDer algorithms, including the original FinDer main algorithm that computes line-source models from seismic acceleration data, and the new FinDerS and FinDerS+ algorithms (from top to bottom). FinDerS determines slip profiles by backprojecting peak ground displacement (PGD) amplitudes onto the FinDer line-source. FinDerS+ does the same, but allows the line-source to grow beyond the current FinDer model. This enables FinDerS+ to predict future rupture growth, while FinDer and FinDerS both characterize the (close to) current rupture state. PGD amplitudes are derived from integrated and high-pass (
2.1 FinDer: Current Rupture Line-Source Model and Magnitude, MFD
The Finite-Fault Rupture Detector (FinDer) algorithm (Böse et al. (2012b), Böse et al. (2015), Böse et al. (2018)) provides rapid earthquake line-source models, that describe the position, length (LFD) and strike of a fault rupture. These parameters are computed from the spatial distribution of high-frequency PGA amplitudes recorded across a dense seismic network. Using template matching, FinDer compares these motions with theoretical spatial PGA templates, which are calculated from an empirical ground-motion model (here: Cua and Heaton (2009)) derived from worldwide earthquake data with different magnitudes, rupture lengths, and source mechanisms. The best template and resulting FinDer line-source model is found from a combined grid-search and divide-and-conquer approach (Böse et al., 2018). The FinDer magnitude, MFD, is estimated from a selected empirical rupture length-magnitude relation [typically Wells and Coppersmith (1994)]. Comparing different relationships (Wells and Coppersmith, 1994; Blaser et al., 2010; Leonard, 2014) suggest that the resulting magnitude estimates have an uncertainty of about +/−0.3 magnitude units.
2.2 FinDerS: Slip Profile and Magnitude, MFDS
FinDerS (“S” stands for slip) determines 1D slip profiles from the backprojection of PGD amplitudes onto the FinDer line-source. The backprojection is done by employing a general empirical equation developed by Yamada (2007) and Aagaard et al. (2004) from worldwide earthquake data and simulations. This equation relates the seismic slip (or static offset), D, to the dynamic PGD amplitudes measured at closest distance, R, of the surface projected rupture
where D and PGD are in cm and R in km. According to Eq. 1 the dynamic PGD is approximately 2/3 of the static slip along the ruptured fault. As originally proposed by Böse et al. (2013), we apply Eq. 1 here to dynamically backproject PGD observations (i.e. backproject the time-dependent data) onto the FinDer line-source, which will also evolve and grow over time. Here, the FinDerS slip profile has, at each time step, the length of the FinDer line-source model. We only backproject PGD from stations within a certain distance to the fault (here: R
Then, to interpolate and smooth the estimated backprojected slip values, FinDerS employs the empirical relationship developed in Hutchison et al. (2020) that relates the along-strike gradient of long-term structural maturity of the ruptured fault to the coseismic slip distribution along the rupture. This equation solves for D at any given point along the rupture, l, up to length L using a least squares fitting technique:
where Dpeak and q represent amplitude and skewedness of the slip profile, respectively. These are interdependent variables that change with each other. See Hutchison et al. (2020) for details.
Finally, as described in Hutchison et al. (2020), we estimate the (moment) magnitude from the profile average slip value, Dmean, and the rupture length, L, at each time step:
Since FinDerS is based upon the FinDer line-source, L corresponds in Eqs. 2, 3 to LFD. The resulting magnitude is named M = MFDS. Since both the FinDer line-source and PGD evolve over time, Eqs. 1–3) are dynamically recomputed.
2.3 FinDerS+: Predicted Final Rupture Length, Slip Profile and Magnitude, MFDS+
As opposed to FinDerS, which fits the slip profile to the current FinDer line-source, FinDerS+ does not restrict the final rupture length and allows the FinDer-determined fault rupture to continue growing towards both directions up to a maximum reasonable rupture length, which we here set to 500 km (Manighetti et al., 2007). The slip values are determined as in FinDerS, by backprojection of PGD amplitudes. Then, as for FinDerS, FinDerS+ interpolates the slip values by using Eq. 2, where L = LFDS+ (same in Eq. 3). Again, FinDerS+ estimates are updated over time. From the slip profiles derived at each step, FinDerS+ predicts the final rupture length, the final slip distribution, and the final magnitude, M = MFDS+.
2.4 PGD-Based Magnitude, MPGD
Throughout this paper, we will compare the magnitude results of the three FinDer algorithms to estimates obtained from more simple, previously established PGD-magnitude scaling relationships of the form
where R is the distance in km between the earthquake hypocenter and the station at which the PGD is observed. We are testing here three sets of coefficients published by various authors: 1) A = −5.919, B = 1.009, C = −0.145 (Ruhl et al., 2019); 2) A = −4.434, B = 1.047, C = −0.138 (Melgar et al., 2015), and 3) A = −6.687, B = 1.5, C = −0.214 (Crowell et al., 2016), respectively. PGD, here defined as
2.5 Magnitude from Seismic Moment-Rate Function, Mmr
Finally, we will compare all magnitude estimates to the moment-rate function-derived magnitude, Mmr. To determine Mmr at time t relative to the rupture nucleation time, we use the moment magnitude definition of Hanks and Kanamori (1979),
3 Data and Preprocessing
3.1 Earthquakes
We will demonstrate our suite of FinDer algorithms for three continental earthquakes: the 2019 MW 7.1 Ridgecrest earthquake with a right-lateral slip, the 2016 MW 7.0 Kumamoto earthquake with a dominant right-lateral and additional normal slip, and finally the 2008 MW 7.9 Wenchuan earthquake that had a right lateral and reverse slip (Table 1). We select these earthquakes mainly because of their availability of seismic (and in the cases of Ridgecrest and Kumamoto of geodetic) data, and their large rupture sizes (MW 7.0+). As will be shown later, the slip distributions of the three earthquakes show the generic asymmetry encapsulated in the empirical equation from Hutchison et al. (2020) (Eq. 2), even though the surface slip data for the Kumamoto earthquake are few. This means that the gradient of maturity along the three ruptured faults can be derived from the empirical Eq. 2. Furthermore, the performance of the FinDer algorithm, although for older code versions, has been demonstrated and documented for these three events in previous studies (Böse et al., 2018; Chung et al., 2020; Li et al., 2020). Finally, the empirical equation from Hutchison et al. (2020) has been previously applied to the static slip distribution of the Wenchuan earthquake. It demonstrated a very good performance on the magnitude prediction (from the rupture start), and modest results on the length prediction (from
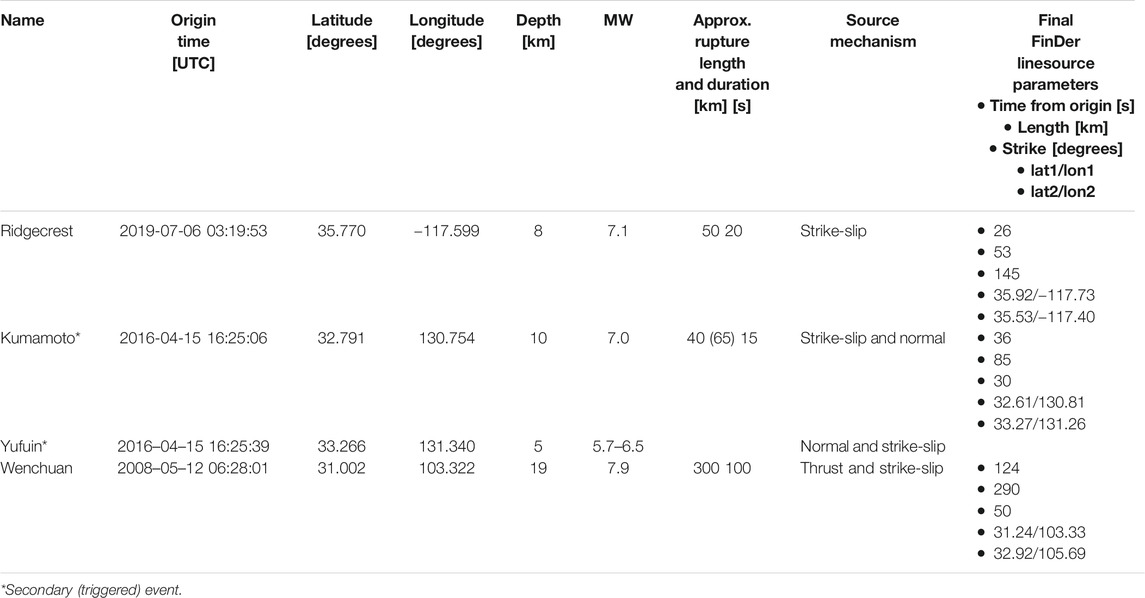
TABLE 1. Source parameters and final FinDer line-source parameters for the MW 7.1 Ridgecrest (California), MW 7.0 Kumamoto (Japan), and MW 7.9 Wenchuan (China) earthquakes.
The July 5, 2019 MW 7.1 Ridgecrest earthquake ruptured a major NW-trending right-lateral fault in the eastern California shear zone, along with many secondary subparallel faults, and others of sub-perpendicular orientation (Milliner and Donnellan, 2020). The earthquake produced strong shaking with up to Modified Mercalli Intensity (MMI) IX in the epicentral area, and was felt in large parts of southern California and Nevada (e.g. Barnhart et al., 2019). The earthquake mainly produced a NW-SE surface rupture of
The MW 7.0 Kumamoto earthquake of April 16, 2016, ruptured at least
The MW 7.9 Wenchuan earthquake on May 12, 2008 produced seismic intensities of up to XI on the MMI scale (Chen and Booth, 2011). The event primarily ruptured the NE-trending Beichuan fault with a dextral and reverse slip, along with the adjacent Pengguan reverse fault, both within the Longmenshen fault zone. The total rupture length was about 280 km, while the earthquake produced 12–13 m of slip at the ground surface. The largest slip occurred in the southwest, close to the epicenter (Shen et al., 2009; Perrin et al., 2016a). The earthquake slip profile is markedly asymmetric with slip tapering from the SW to the NE (Shen et al. (2009); Perrin et al. (2016a)). The fault has been described as of intermediate maturity, with a gradient of maturity decreasing towards NE (Perrin et al., 2016a).
3.2 Data Preprocessing
For the Ridgecrest earthquake, we use strong-motion data from the Southern California Seismic Network (SCSN), as well as preprocessed 1-Hz displacement time series from 10 GNSS stations from the Geodetic Facility for the Advancement of Geoscience (GAGE) Network of the Americas (NOTA) that were obtained through UNAVCO (Mattioli et al., 2020). For the Kumamoto earthquake, we use strong-motion records from both KiK-net and K-NET stations, as well as preprocessed GEONET Global Positioning System time series downloaded from Ruhl et al. (2019). For the Wenchuan earthquake, we use strong-motion records obtained through the China Strong Motion Networks Center (CSMNC) at the Institute of Engineering Mechanics, China Earthquake Administration. These records start 20 s before the P-wave arrival. As described in Li et al. (2020) we reconstruct absolute times from the event location and origin time (Table 1) and align in each record the theoretical and observed P-wave arrivals assuming vp = 6.1 km/s. Figure 2 shows the distributions of seismic and geodetic sensors used in this study along with the final FinDer line-source models (Table 1) for the Ridgecrest, Kumamoto, and Wenchuan earthquakes at 26 s, 36 s, and 124 s from origin times, respectively.
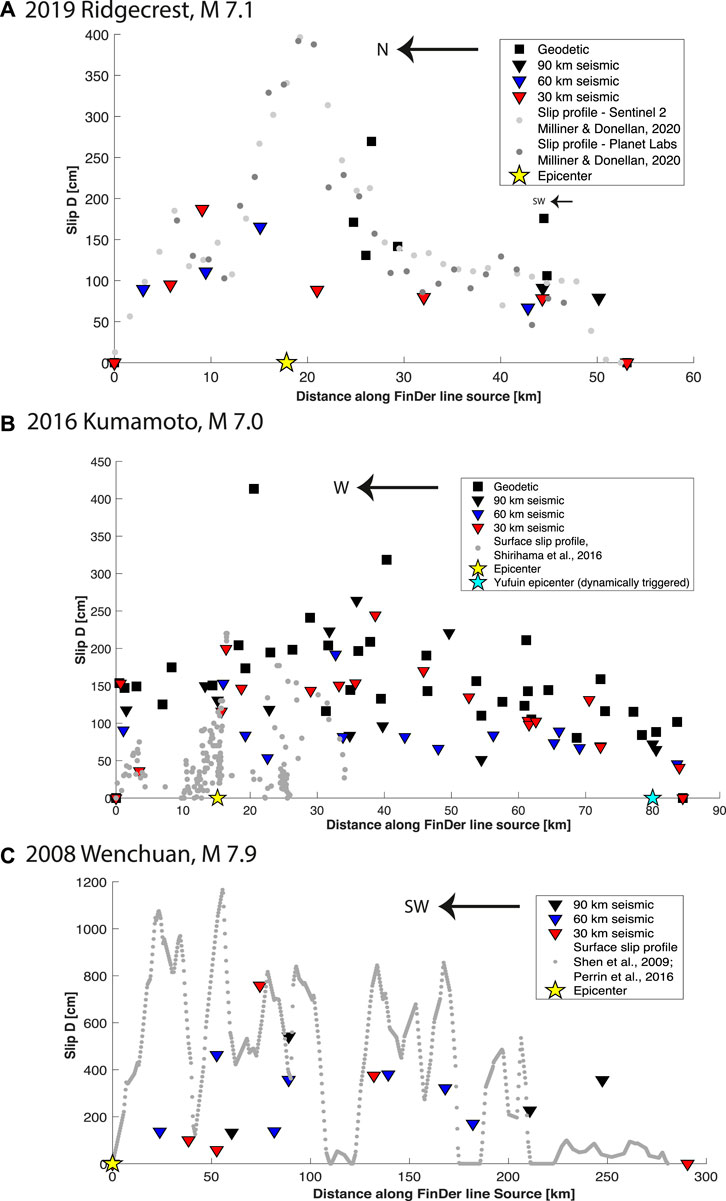
FIGURE 2. Maps showing earthquake epicenters (stars), seismic strong-motion and geodetic GNSS stations (triangles and squares, respectively), and FinDer line-source models (black lines) for the a) MW 7.1 Ridgecrest, California, b) MW 7.0 Kumamoto (and Yufuin), Japan, and c) MW 7.9 Wenchuan, China, earthquakes. The line-source models were calculated from seismic waveform playback and correspond to the final FinDer solutions at 26, 36, and 124 s, respectively (Table 1). Color of station markers shows their respective distance range relative to the FinDer line-source.
While the FinDer line-source models are recovered directly from the high-frequency strong-motion data (Böse et al., 2018), the slip values are computed from the backprojected dynamic displacement amplitudes using Eq. 1. Following Yamada (2007; page 45), we determine the maximum peak ground displacement at each seismic/geodetic station as
Recovering displacement from strong-motion recordings is generally challenging and will be discussed further in later sections. We are doing the following: first, we cut all strong-motion waveforms so that they begin at the origin time,
The GNSS data for Ridgecrest and Kumamoto is already preprocessed with a precise-point-positioning (PPP) algorithm and in displacement (Ruhl et al., 2019; Mattioli et al., 2020), so we do not apply any filters. We simply detrend the data and, like the seismic data, we remove the pre-event median of the data by calculating the median amplitude between the start time of the waveform and the arrival of the P-wave, assuming vp = 6.1 km/s, and subtracting this value from the entire waveform. We use all geodetic stations within 100 km from the FinDer line-source regardless of the seismic threshold we are testing (30 km, 60 km, 90 km). We remove again stations that backproject onto the tips of the FinDer line-source.
The resulting displacement waveforms are shown in the Supplementary Material of this paper (Supplementary Figures 2A–4). The extracted final PGD amplitudes from the preprocessed seismic and geodetic waveforms are summarized in Supplementary Table 1 (Supplementary Material) and plotted in Figure 3. As expected the amplitudes decay as a function of distance from the (final) FinDer line-source with values of about 1 m close to the rupture and of a few cm at about 100 km distance. PGD amplitudes extracted from seismic and GNSS recordings generally agree well.
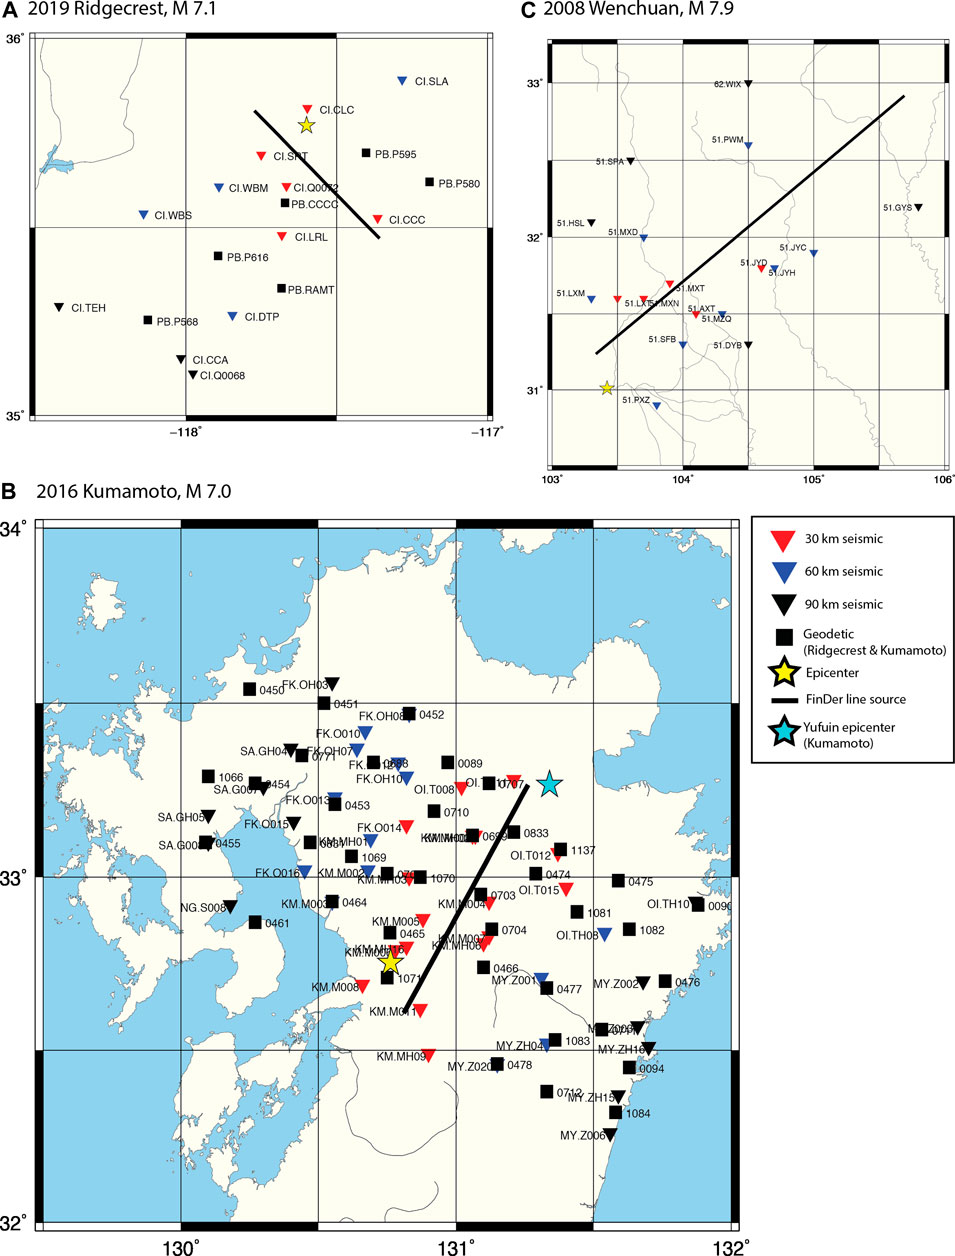
FIGURE 3. Peak ground displacement (PGD) amplitudes recovered from high-pass filtered seismic and geodetic recordings of the Ridgecrest, Kumamoto, and Wenchuan earthquakes, sorted as a function of the closest distance to the final FinDer line-source. Values are listed in Supplementary Table 1 (Supplementary Material). Seismic (triangles) and geodetic (squares) PGD values generally agree well. In the new FinDerS and FinDerS+ algorithms we backproject the time-varying PGD amplitudes onto the evolving FinDer line-source to estimate seismic slip profiles at any given time through the rupture.
4 Results
4.1 Static Application: Final Rupture Lengths and Slips
Figure 4 shows the backprojection results of final dynamic PGD amplitudes onto the final FinDer line-source models (Table 1) compared to measured surface slip profiles available in the literature. Even though Eq. 1 has been calibrated with the slip at depth, for a steep-dipping fault (as examined here) the results should provide a first-order approximation of surface slip. As shown in (Manighetti et al., 2005), the general (oblique-triangular) pattern of the slip profiles, which we take advantage of in Eq. 2, persists at depth.
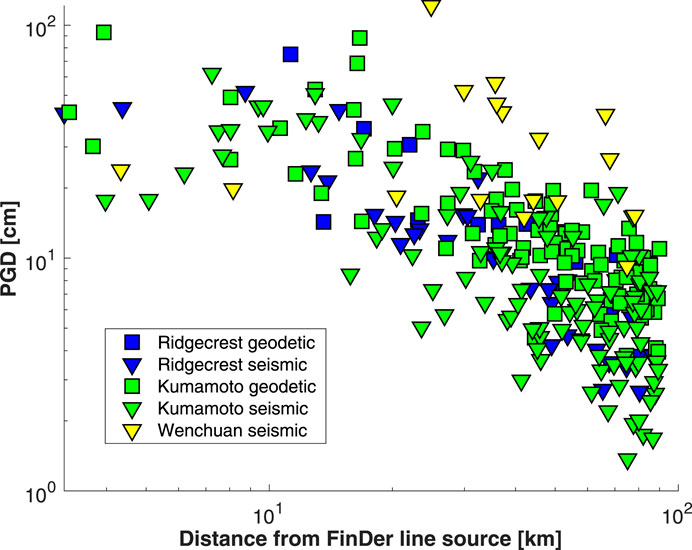
FIGURE 4. Fault slip, D, estimated from the backprojection of final PGD amplitudes onto the final FinDer line-source (Figure 2) for the a) Ridgecrest, b) Kumamoto, and c) Wenchuan earthquakes. Gray dots show surface slip profiles published by various authors as given in the legends. For Ridgecrest and Kumamoto, the published values show lateral slip, while for Wenchuan, they show net slip. Note that the backprojected slip values and epicenters are relative to the respective FinDer line-source model, oriented as indicated on the plots.
For Ridgecrest (Figure 4A), we compare backprojected values with surface slip values derived from subpixel correlation of high-resolution optical imagery from two different satellites (Milliner and Donnellan, 2020). The backprojected seismic and geodetic slip values follow the overall distribution of surface slip along strike, though, the maximum slip value identified by Milliner and Donnellan (2020) of
For Kumamoto (Figure 4B), the rupture trace observed at the ground surface was only
For Wenchuan (Figure 4C) backprojected slip values also compare quite well with the surface slip profile measured in the field. Like in the other events, however, the maximum backprojected slip values (
In all three earthquakes, we note that the backprojected slip tends to under-estimate the actual surface slip. In general, there is no clear distance range of stations (here: 30 km, 60 km and 90 km from the line-source model) that works best for the backprojection, but stations less than 60 km from the line-source provide slip values in closer agreement with those in the literature. Therefore, in the subsequent analyses we will select the 60 km station cutoff for further demonstration of our approach. Results for the other two cutoffs are shown in the Supplementary Material (Supplementary Figures 5, 6).
4.2 Dynamic Application: Evolving Ruptures and Slips
For the dynamic application of the three FinDer algorithms (Figure 1) we run playbacks for the three earthquakes using the preprocessed seismic and geodetic waveform records (see Section 3.2) to emulate the evolution of possible output of FinDer, FinDerS, and FinDerS+ over time using the respectively available information (even if final peak values have not yet been reached). Table 2 summarizes the results (here with parameters being updated every 5 s even though a higher resolution is possible), while Figures 5–7 illustrate the results at some selected time steps. Figure 8 compares the evolution of estimated magnitudes for the various approaches.
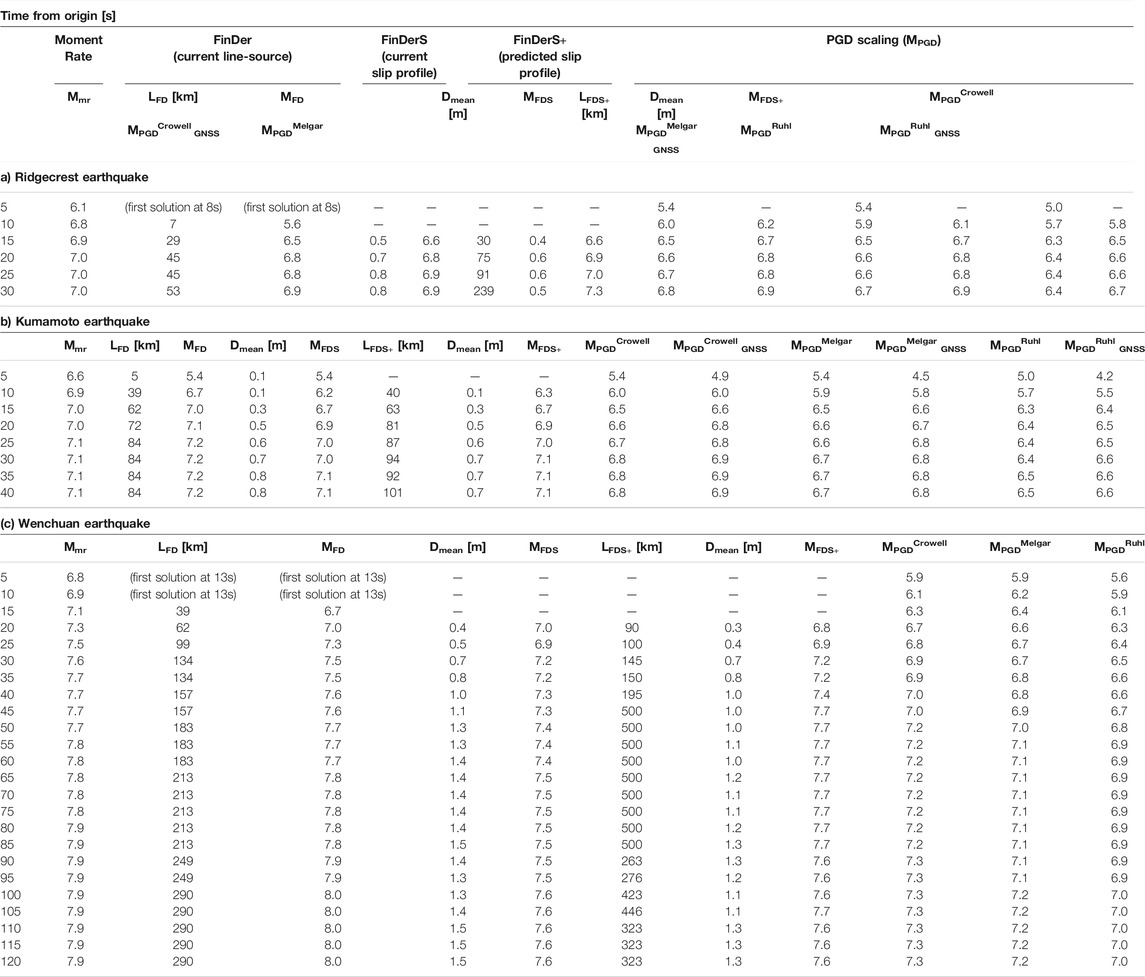
TABLE 2. Results from FinDer (rupture length, LFD, and magnitude, MFD), FinDerS (mean slip, Dmean, and magnitude, MFDS, both from fitted slip profile) and FinDerS+ (predicted final rupture length, LFDS+, predicted final mean slip, mean, and predicted final magnitude, MFDS+) for the a) Ridgecrest, b) Kumamoto, and c) Wenchuan earthquake as a function of time from origin for a 60 km station distance cutoff. Magnitudes Mmr and MPGD are estimated from the USGS moment rate function and empirical PGD-distance relationships (Melgar et al., 2015; Crowell et al., 2016; Ruhl et al., 2019), respectively. Table shows updates in increments of 5 s.
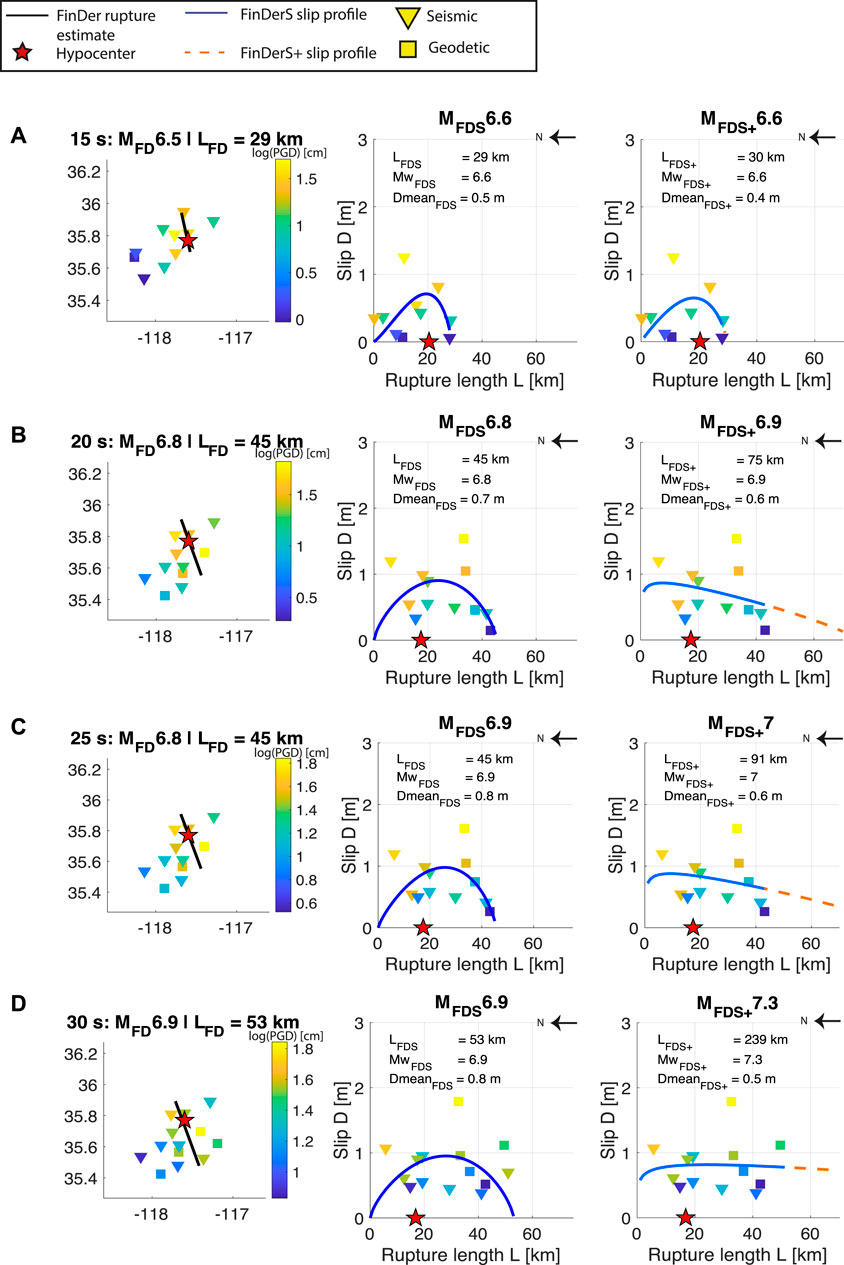
FIGURE 5. Playback results for the MW 7.1 Ridgecrest earthquake (L
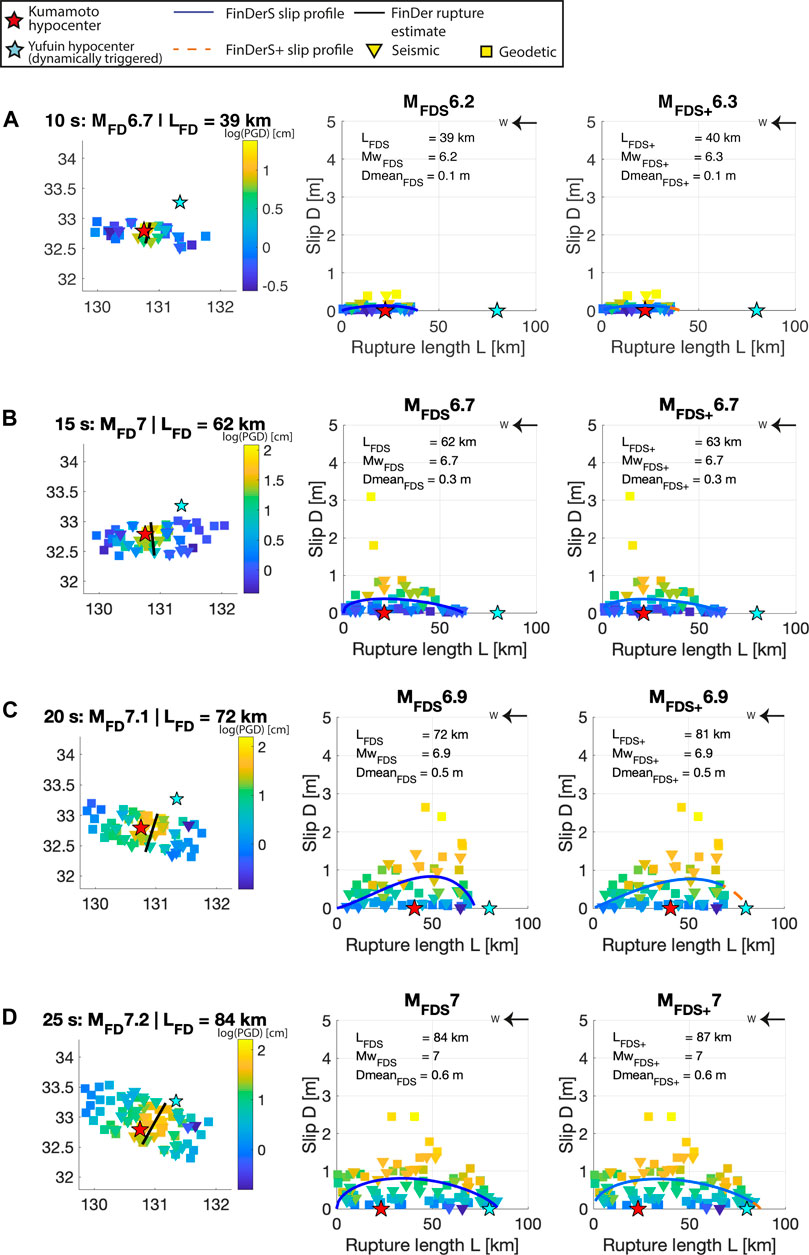
FIGURE 6. Playback results for the MW 7.0 Kumamoto earthquake (L
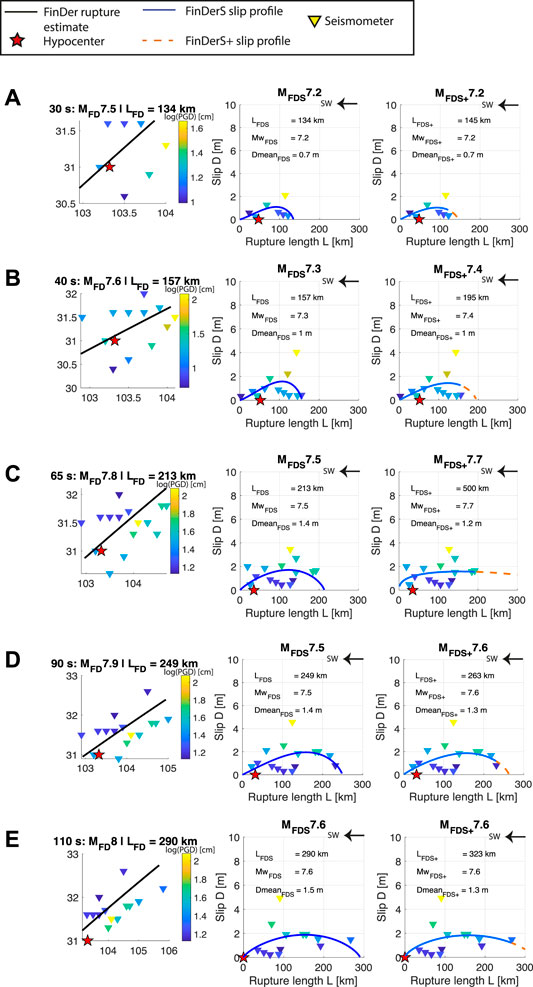
FIGURE 7. Playback results for the MW 7.9 Wenchuan earthquake (L
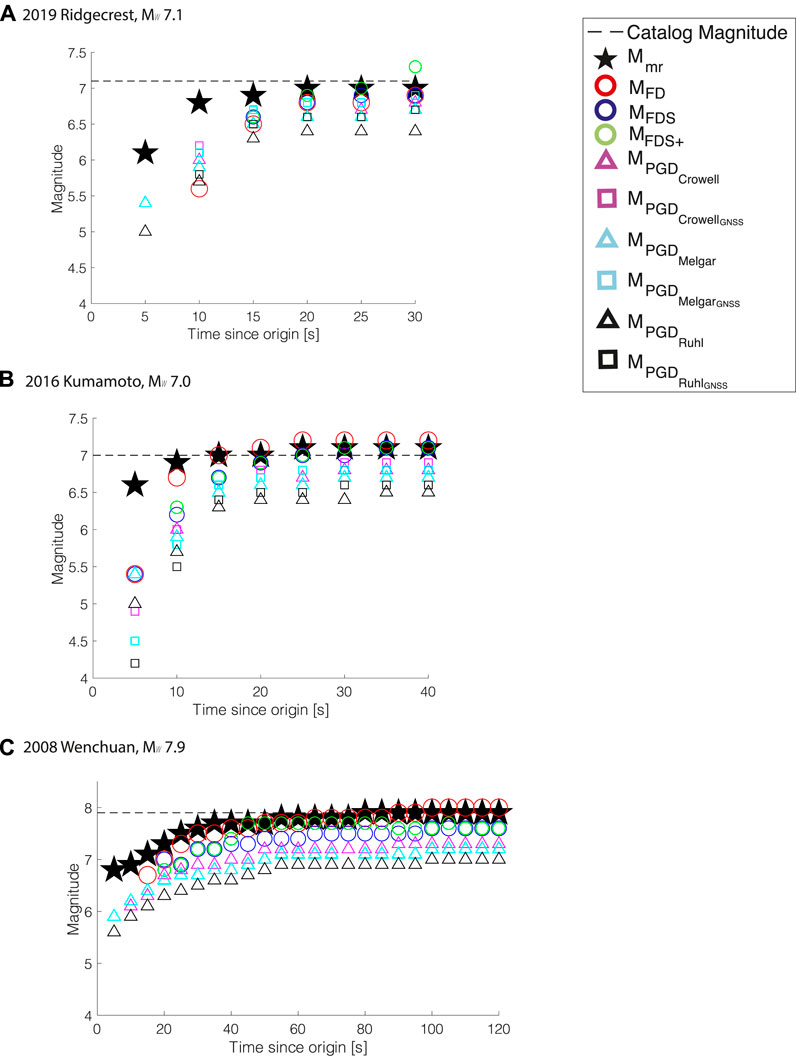
FIGURE 8. Comparison of magnitudes from FinDer, FinDerS, FinDerS+, and PGD-based magnitude estimates as function of time from event origin for a) MW 7.1 Ridgecrest, b) MW 7.0 Kumamoto, and c) MW 7.9 Wenchuan. Triangles mark estimates derived from seismic and geodetic data, squares mark estimates from geodetic data only. Mmr is determined from the seismic moment rate and shown for reference. See Table 2 for details.
For simplicity we neglect data latencies, which typically are on the order of 1–2 s for a fast seismic network (e.g. Behr et al., 2015).
Details on the FinDer results for the three earthquakes are given in Böse et al. (2018), Chung et al. (2020), and Li et al. (2020). Due to the FinDer trigger settings applied in this study, which requires the P-wave to have reached at least 4 neighbouring stations, FinDer triggers in this retrospective study 8 s after
4.2.1 Playback Results for MW 7.1 Ridgecrest
For the MW 7.1 Ridgecrest earthquake (Figure 5 and Table 2) FinDer triggers 8 s after
4.2.2 Playback Results for MW 7.0 Kumamoto
For the MW 7.0 Kumamoto earthquake (Figure 6 and Table 2) FinDer triggers 4 s after
FinDerS+ performs very similarly to FinDerS, which indicates a well-formed slip profile resulting from a good station coverage, which does not leave much room for fitting a longer rupture in FinDerS+. Notably, despite the over-estimated rupture length, the maximum slip values are fairly consistent with observed surface slip values (Shirahama et al., 2016), particularly in the earliest time windows.
4.2.3 Playback Results for MW 7.9 Wenchuan
FinDer triggers 13 s after
The backprojected slip values are significantly under-estimated, by a factor of 3–6. With such poor slip estimates, we cannot expect that FinDerS and FinDerS+ perfom well. FinDerS, using the FinDer rupture length, performs less well than FinDer for magnitude, never arriving at the cataloged final value, MW 7.9. FinDerS+, however, performs somewhat better in terms of magnitude, at least in the middle time steps, with MFDS+ 7.7 at 45 s, compared to MFDS 7.3 (Figure 7B). This, however, results from an over-prediction of the final rupture length, where at 45–85 s, the predicted final rupture length for FinDerS+ is 500 km (our theoretically allowed maximum value), showing that the fitting does not converge. The fitting resumes converging in the later stages, predicting the final rupture length fairly well.
4.2.4 Magnitudes
Figure 8 and Table 2 compare the magnitude estimates from the FinDer algorithms with magnitudes derived from the USGS moment rate function, Mmr, as well as from simple PGD-magnitude scaling relationships (Eq. 4). While these PGD-magnitude relations (Melgar et al., 2015; Crowell et al., 2016; Ruhl et al., 2019) were regressed originally from GNSS displacement data, we are applying them here to both seismic+GNSS and GNSS-only amplitudes. We compute MPGD for each of the three earthquakes by taking the median magnitude estimate taken over all stations at which the seismic waves should have arrived at a given time assuming a moveout velocity of 3 km/s.
For the MW 7.1 Ridgecrest earthquake (Figure 8A and Table 2), MPGD for both GNSS data and the combined seismic and GNSS datasets are the same for each of the three empirical scaling relationships, so we discuss them together. On the whole, MPGD under-estimates the magnitude of the Ridgecrest earthquake, and is similar to what is predicted by the FinDer family of algorithms. At the earliest time step when each FinDer algorithm is giving magnitudes, 15 s after
PGD-based magnitude estimates for the MW 7.0 Kumamoto earthquake (Figure 8B and Table 2) continuously under-estimate the true magnitude. For the first calculation of magnitude at 5 s, using Eq. 4, the values range from MPGD 4.2 (GNSS-only) to MPGD 5.4 (seismic+GNSS). For the same time step, the FinDer family of algorithms give MFD 5.4. At 10 s, the PGD based magnitudes range from MPGD 5.5 (GNSS-only) to MPGD 6.0 (seismic+GNSS), and FinDer magnitudes range from MFDS 6.2 to MFD 6.7. At 20 s, halfway through the time period, we calculate MPGD 6.4 (seismic+GNSS) to MPGD 6.8 (GNSS-ony), however, the FinDer algorithms give larger values that are closer to the cataloged magnitude of MW 7.0, MFDS 6.9 to MFD 7.1. Finally, at 40 s, the PGD based magnitudes give a range of MPGD 6.5 (seismic+GNSS) to MPGD 6.9 (GNSS-only), and the FinDer algorithms give a range of MFDS 7.1 to MFD 7.2. It is notable that at first the combined geodetic and seismic PGD-based magnitude estimates are higher, and thus closer to the cataloged values. However, in the final time step, the geodetic (only) dataset gives higher PGD-based magnitudes.
For the MW 7.9 Wenchuan earthquake (Figure 8C and Table 2), we have only seismic records, so our PGD-based magnitude estimates are solely based on seismic data. Throughout the duration of the event, there is a relatively large discrepancy between MPGD and the true magnitude; the FinDer algorithms arrive at magnitude estimates much closer to that of the event. To begin with, at 20 s, once more than three stations can be used to calculate the entire FinDer suite of algorithms, the PGD based magnitude estimates range from MPGD 6.3 to MPGD 6.7. Meanwhile, the FinDer algorithms give a range of MFDS+ 6.8 to MFD 7.0. At 60 s, the FinDer suite of algorithms gives a range of MFDS 7.4 to MFD 7.7, while the PGD based magnitudes give a range between MPGD 6.9 and MPGD 7.2. The final spread of magnitude estimates at 120 s from PGD based estimates is MPGD 7.0 to MPGD 7.3, while the FinDer family of algorithms gives magnitude estimates much closer to the cataloged final magnitude MW 7.9, MFDS(+) 7.6 to MFD 8.0.
Generally, in terms of magnitude, the FinDer suite of algorithms performs quite well with respect to Mmr. FinDer continues to perform consistently for all three events, matching the Mmr values for all three events, though for Kumamoto and Ridgecrest, FinDerS and FinDerS+ perform similarly well. The FinDerS+ magnitude estimates are slightly better aside from the Wenchuan earthquake, where FinDer has the best results. This is mainly due to FinDerS+ under-estimating the Wenchuan slip significantly. The algorithms consistently outperform the PGD-based magnitude estimates.
5 Discussion
Ideally, FinDerS+ is expected to provide the best performance because, on the one hand, it builds on the FinDer results which determine the fault location and strike, and on the other hand, it takes into account an important property of the source fault, its structural maturity gradient, in the form of the empirical equation Eq. 2. The latter allows integration of the location and strike of the fault delivered by FinDer with the slip estimates independently obtained from PGD amplitudes, and derives the best-fitting slip-length profile at every stage of the growing rupture. FinDerS provides a more basic approach as, at each stage of the rupture growth, it adopts the rupture length delivered by FinDer.
5.1 Performance for MW 7.1 Ridgecrest
Since March 2018, the U.S. West Coast ShakeAlert system (Given et al., 2018) is comprised of two independent algorithms - FinDer and the EPIC point-source algorithm (Chung et al., 2019). Both algorithms detected the 2019 MW 7.1 Ridgecrest shortly after its nucleation and sent an alert within 6.9 s from
In our playback, FinDer determines the final rupture length of the MW 7.1 Ridgecrest earthquake within 25–30 s after
While, for the most part, the slip profiles predicted through FinDerS and especially FinDerS+ match the overall pattern of the observed slip profile (Milliner and Donnellan, 2020), the backprojected slip values are under-estimated, with a maximum slip that is about half as large as measured at surface shortly after the earthquake (thus, these measures are not expected to include significant post-seismic slip, Barnhart et al., 2019; Wang and Bürgmann, 2020) (Figures 4A, 5A–D). This under-estimation may be a product of our approach using a very simple equation to estimate slip (Eq. 1), combined with using filtered PGD data, which is known to artificially reduce PGD amplitudes (Yamada, 2007). We come back to this point further below. The under-estimated slip values are likely the source of low magnitude predictions in FinDerS, and of the difficulty of FinDerS+ to recover the asymmetry of the final slip profile and hence, its actual (shorter) final length.
The main output of the FinDer algorithm is a line-source model, not a magnitude estimate (Böse et al., 2018). As a matter of fact, while the FinDer rupture length estimate of 53 km is excellent, the final FinDer magnitude MFD 6.9 under-estimates the cataloged magnitude by 0.2 units. This is mainly due to the use of a simple empirical rupture length-magnitude relation (Wells and Coppersmith, 1994) in FinDer; although valuable, this relation has significant uncertainties. Using the slip information in addition to rupture length is expected to compensate for limitations in the empirical error-prone relation used in FinDer. In the Ridgecrest earthquake, FinDerS, however, also never arrives at the cataloged magnitude, MW 7.1 (Figures 5A–D). FinDerS+, while over-predicting the final rupture length, does provide a better magnitude prediction. This, however, comes at the cost of a largely over-estimated rupture length, in turn likely related to slip under-estimation. This raises a fundamental question about trade-offs in algorithms, where accuracy in one area (magnitude) may mean a sacrifice in other metrics (final rupture length). In the future, it may be useful to combine the family of FinDer algorithms to find a magnitude and a length prediction that considers all three values.
5.2 Performance for MW 7.0 Kumamoto
The Japanese EEW system operated by Japan Meteorological Agency (JMA) issued a first alert 8 s after
For the Kumamoto earthquake, the family of FinDer algorithms predicts the final rupture length at surface from 10 s after
Looking at slip distributions up to
5.3 Performance for MW 7.9 Wenchuan
At the time of the MW 7.9 Wenchuan earthquake, which is by far the largest event in this study and hence has the longest rupture duration, China had no operational EEW system. Thus, we cannot compare the performance of the FinDer suite of algorithms to another early warning system. However, in a previous study using the FinDer algorithm and the same dataset, Li et al. (2020) reported a slightly slower magnitude convergence for the Wenchuan earthquake, which can be attributed to their use of an older version of the FinDer code.
The FinDer algorithms all anticipate from the very start (25–30 s after
In terms of magnitude, FinDer predicts a MFD 7.8 by 60–65 s after
5.4 Seismic/Geodetic Displacement Versus Fault Slip
Long-period PGD amplitudes provide information about fault slip and magnitudes (e.g. Melgar et al., 2015; Crowell et al., 2016; Ruhl et al., 2019). As demonstrated in this study, both GNSS and seismic data can produce PGD datasets that can help to quickly constrain the metrics of an ongoing earthquake. Although more reliable at long periods and in particular at the static offset, GNSS data is generally more noisy compared to strong-motion data. The GNSS noise level is typically 1–2 cm and data is thus useful only for moderate and large earthquakes at local to regional distances (Ruhl et al., 2019).
It is well known that recovering seismic displacement from double-integrated strong-motion data can present issues in the presence of strong nonphysical drifts and saturation of the sensor (Bock et al., 2011). These drifts typically emerge from small baseline offsets in the acceleration data that are accentuated when double-integrated to displacement (Emore et al., 2007). Since this issue mainly affects long-period motions (and we are mainly interested in dynamic rather than static displacement), we apply in this study a high-pass filter with a cutoff-frequency at 0.075 Hz. A drawback of this approach, however, is that PGD amplitudes are reduced (Yamada, 2007), which will be reflected in smaller slip values resulting from the backprojection of PGD using Eq. 1. Nonetheless, first-order differences between seismic and geodetic dynamic PGD amplitudes are small (Figure 3) and the utility of the filtered amplitudes is clearly demonstrated in this paper.
Contrary to the results of the same algorithm using accurate static slip profiles, where final rupture lengths and magnitudes could be determined within 10–20% of the way through the signal’s duration (Hutchison et al., 2020), the results from the dynamic application of FinDerS+ in this paper suggest that the true convergence might actually take longer. Instead, as shown by the examples of the earthquakes presented here, FinDerS and FinDerS+ rarely reach the cataloged magnitude until 40–50% of the rupture duration. For Wenchuan, the actual magnitude is never reached, though both algorithms do converge at a reasonable solution (within 0.2–0.5 magnitude units) about 30% of the way through the event. This slower ability to predict the final length and magnitude of the earthquake arises from two issues: first, it takes some time until final slip values in an earthquake are reached. Second, the (final) slip tends to be significantly under-estimated in our backprojection algorithm. This difficulty to reproduce the slip values accurately leads in some cases to over-predict the rupture length (see Figures 5D, 7C). While this over-prediction might not be too much an issue in large earthquakes as those analyzed here, it would become more critical for smaller magnitude earthquakes. The approach developed here is thus best suited for earthquakes with MW greater than 7. However, more systematic studies (and adjustments of the algorithms) are required to determine the best range of applicability.
The systematic under-estimation of slip from the backprojected PGD amplitudes largely relates to the function Eq. 1 we are applying. This function, taken from Yamada (2007), was derived from near-source ground motion simulations by Aagaard et al. (2004), made to relate dynamic ground displacements at some distance from the fault rupture to on-rupture slip. These simulations were done using reference rupture source models, having variable dips and slip modes, but similar length of 100 km and similar largest slips of about 6 m. Would these ruptures be real, available earthquake slip-length scaling relations (Manighetti et al., 2007) would suggest that these reference earthquakes occurred on fairly mature faults. In contrast, the three earthquakes we analyzed here ruptured fairly immature faults, as described in Section 3.1. Their slip-to-length ratios actually confirm this inference (compare their slip-length values to Figure 5A in (Manighetti et al., 2007)). Earthquakes on immature faults have been shown to produce larger displacements and stronger ground accelerations than earthquakes on more mature faults (Radiguet et al., 2009). As the function from Aagaard et al. (2004) does not take these source differences into account, it likely smooths them out, in effect under-estimating the slips produced by earthquakes on fairly immature faults, as those analyzed here.
To address the problem of slip under-estimation in the future, we might consider an updated backprojection function that takes the overall maturity of the ruptured fault into account, provided that the latter can be known in real-time (Böse and Heaton, 2010). Alternatively, if the ruptured fault is not identified or if its overall maturity is unknown, in future we might be able to derive from analysis of the increasing number of well instrumented earthquakes, a “generic” coefficient of correction that would compensate for the systematic slip under-estimation for immature faults. As a first estimate, for the three earthquakes analyzed here, a factor of two is suggested. By using simultaneously the “raw” and the corrected slip data, the FinDer algorithms might be able to bracket more efficiently, i.e., faster, the actual final rupture length and magnitude.
5.5 FinDer-Versus PGD-Based Magnitudes
For the three earthquakes studied here, the FinDer family of algorithms systematically outperforms the simple PGD-based magnitude estimates, both using exclusively GNSS data or combined GNSS and seismic datasets. While the PGD-hypocentral distance scaling relationship is simple, the fact that the coefficients in Eq. 4 change repeatedly based on the introduction of new earthquakes (Melgar et al., 2015; Crowell et al., 2016; Ruhl et al., 2019), and that station selectivity can have a significant impact on the accuracy of the magnitude estimate (e.g. Dahmen et al., 2020), make this scaling relationship imprecise. Furthermore, these PGD-based magnitude relations ignore the earthquake fault source dimensions and properties, while those have been shown to impact both the ground accelerations (Radiguet et al., 2009) and displacements (Manighetti et al., 2007). The FinDer group of algorithms consistently does a better job of calculating magnitude accurately, without the introduction of complex station selection parameters or subsequently extending empirical datasets. FinDerS and FinDerS+, which take some of the earthquake fault source properties into account, are generally more efficient at predicting the final magnitudes (Figures 8A,B).
Our PGD-based magnitudes for the Kumamoto earthquake (Figure 8) differ from the results of a previous GNSS data-based study (Dahmen et al., 2020), in which magnitude predictions are much closer to the cataloged magnitude. For example, Dahmen et al. (2020) estimate MPGD 6.3 14 s after the event detection, MPGD 6.8 after 20 s, and finally MPGD 7.0 after 100 s. However, there are a couple of differences compared to our study. First, at least five stations that were included in the Dahmen et al. (2020) study, were not included in the GNSS dataset available through Ruhl et al. (2019) that we used here. Second, Dahmen et al. (2020) utilized a noise-based threshold criteria to select stations. Because of this, Dahmen et al. (2020) used only 27 of the 39 available GNSS stations that we used (Ruhl et al., 2019). Without applying this selection criteria, the PGD-based magnitude estimate of Dahmen et al. (2020) 14 s after the event detection is MPGD 6.7, which is similar to our estimates. It is notable that - despite not applying station selection criteria - the FinDer algorithm suite magnitude estimates are consistent with the PGD-based magnitude estimates from Dahmen et al. (2020) and the true magnitude evolution reflected in Mmr (Table 2). The same applies for the MW 7.1 Ridgecrest earthquake, where the MPGD values of Hodgkinson et al. (2020) differ slightly from our results.
5.6 Implications and Benefits for EEW
The main output of the FinDer algorithm is a line-source model, which is determined from the spatial distribution of high-frequency PGA amplitudes. FinDer magnitudes, MFD, are a secondary product only, that are estimated from the application of general empirical rupture length-magnitudes relationships. These relations are known to have significant uncertainties. Our two new algorithms, FinDerS and FinDerS+, can help to improve magnitude estimates by incorporating the additional information on the earthquake slip-fault maturity relation and on long-period motions, which are closely related to the static fault offset and seismic moment (Hanks and Kanamori, 1979).
Furthermore, the new addition of a fault slip profile estimated by FinDerS and FinDerS+ can improve the spatial prediction of the ground motions, the ultimate goal of EEW. Slip distributions with large and smooth slip patches affect mainly long-period ground motions along the fault rupture and thus matter most for high-rise buildings at close distance as well as tsunami generation (e.g. Scholz, 2019). Furthermore, by associating the greatest coseismic slip with the most mature parts of the rupture, we can extrapolate the locations of the strongest radiation of high-frequency ground motions. It has indeed been shown that the amplitude of the ground motions is partly controlled by the structural maturity of the source fault, with immature faults or fault sections producing the largest ground motions (Radiguet et al., 2009), furthermore, likely, of highest frequencies. This implies that the output of FinDerS and FinDerS+ does not help only with magnitude estimates (at least for redundancy checks), but potentially improves the seismic ground-motion predictions for EEW.
As proposed by Hutchison et al. (2020), we could even go further by deriving and using two extreme slip-length-maturity empirical functions (Eq. 1 in Hutchison et al. (2020)), one describing the slip behavior of earthquakes on mature faults, and one that of earthquakes on immature faults (see Manighetti et al., 2007). By using simultaneously these two extreme equations, the FinDer algorithms would better bracket the actual range of lengths and magnitudes and hence probably converge faster towards the actual final length and magnitude of the earthquake.
6 Conclusion
We recover earthquake line-source models from high-frequency seismic acceleration data using FinDer (Böse et al., 2012b, 2015, 2018) and give 1D slip profile estimates from the backprojection of long-period displacement amplitudes onto these models using two new algorithms, FinDerS and FinDerS+. While FinDerS backprojects displacement onto the current FinDer line-source, FinDerS+ allows for additional rupture growth along this model. Both FinDerS and FinDerS+ make use of a general relationship that we established in an earlier study (Hutchison et al., 2020) that relates the along-strike gradient of long-term structural maturity of the ruptured fault to the coseismic slip distribution along the rupture. As such, FinDerS and FinDerS+ incorporate a part of the earthquake physics described through this empirical relation, which we use to produce an informed interpolation and smoothing of the backprojected slip values. The two new algorithms provide independent magnitude estimates from FinDer based on slip which could be useful to speed-up magnitude convergence and for redundancy checks with FinDer estimated magnitudes.
FinDerS+ can over-predict the rupture length in two cases: 1) when the slip data are not well determined, as is the case here, in particular showing sparse measures with abrupt fluctuations as in Ridgecrest; 2) when the ongoing slip is gradually increasing away from the hypocenter [see Hutchison et al. (2020)]. This is because the empirical relation between earthquake slip, rupture length, and gradient in fault structural maturity relies on the envelope shape of the along-fault slip distribution and the generic asymmetry of the earthquake slip profiles [see Manighetti et al. (2005)]. Therefore, in the cases where slip fluctuations are too large, or the major slip drop occurs at the end of the rupture growth, the model is unable to recover the envelope shape of the slip distribution. To overcome the problem of slip fluctuations (in the presence of multiple large asperities), dense and accurate slip data are needed. To overcome the problem of the few earthquake cases where slip gradually increasing away from the hypocenter (those cases are fairly rare), in future work, we may incorporate the overall maturity of the source faults: the earthquake slip-length curves have indeed an amplitude that decreases with the overall maturity of the ruptured fault (Manighetti et al., 2007). These amplitude relations will provide slip maximums and force tighter constraints on upper slip bounds of the evolving slip curves, especially for these very asymmetric earthquake profiles. Even though our approach over-predicts the final length of the Ridgecrest and Wenchuan earthquakes at specific stages of their growth, it does predict their magnitude well, from fairly early stages of the rupture growth. In playback, these early large magnitudes indicate that these earthquakes will end up being large, even during the initial stages of the rupture.
For the earthquakes shown here (Kumamoto, Ridgecrest, Wenchuan) the magnitudes computed by the FinDer algorithms converge faster and reach values closer to the cataloged magnitudes than compared to those computed directly from PGD. FinDerS and FinDerS+ benefit from real-time GNSS data streams, but could also use seismic data only. This study has been a preliminary work to understand the basic utility of two new FinDer-based algorithms, but further tests are needed to better constrain the capabilities and limitations of these new EEW algorithms. Further work is also needed to improve our capacity to estimate ongoing slip in real-time. The accuracy of slip estimation is critical to make FinDerS and FinDerS+ efficient. Furthermore, larger sets of earthquakes need to be analyzed, including subduction earthquakes for which information about slip is especially critical in a tsunami context, and rupture length of vital importance to warn the populations along the coastline.
Data Availability Statement
The original contributions presented in the study are included in the article/Supplementary Material, further inquiries can be directed to the corresponding author.
Author Contributions
MB: gave idea and guided research, computed FinDer models, wrote manuscript; AH: conducted analysis, co-developed FinDerS(+) algorithm, wrote manuscript; IM: provided fault background/interpretation, wrote manuscript, leads the project in which this work was done; FM: helped with discussions and writing manuscript; JL: provided the strong ground motion records of the Wenchuan earthquake, assisted in analysis of Wenchuan earthquake; JC: helped with discussions and writing manuscript.
Funding
This project is funded by the ANR Grant FAULTS_R_GEMS #ANR-17-CE31-0008.
Conflict of Interest
The authors declare that the research was conducted in the absence of any commercial or financial relationships that could be construed as a potential conflict of interest.
Publisher’s Note
All claims expressed in this article are solely those of the authors and do not necessarily represent those of their affiliated organizations, or those of the publisher, the editors and the reviewers. Any product that may be evaluated in this article, or claim that may be made by its manufacturer, is not guaranteed or endorsed by the publisher.
Acknowledgments
This material is based on services provided by UNAVCO, Inc., the National Research Institute for Earth Science and Disaster Resilience (NIED), the GEONET Global Positioning System, the China Strong MotionNetworks Center (CSMNC), and the Southern California Earthquake Data Center (SCEDC) and Southern California Seismic Network (SCSN). The SCEDC and SCSN are funded through U.S. Geological Survey Grant G10AP00091.
Supplementary Material
The Supplementary Material for this article can be found online at: https://www.frontiersin.org/articles/10.3389/feart.2021.685879/full#supplementary-material
References
Aagaard, B. T., Hall, J. F., and Heaton, T. H. (2004). Effects of Fault Dip and Slip Rake Angles on Near-Source Ground Motions: Why Rupture Directivity Was Minimal in the 1999 Chi-Chi, Taiwan, Earthquake. Bull. Seismological Soc. America 94, 155–170. doi:10.1785/0120030053
Allen, R. M., Gasparini, P., Kamigaichi, O., and Bose, M. (2009). The Status of Earthquake Early Warning Around the World: An Introductory Overview. Seismological Res. Lett. 80, 682–693. doi:10.1785/gssrl.80.5.682
Allen, R. M., and Melgar, D. (2019). Earthquake Early Warning: Advances, Scientific Challenges, and Societal Needs. Annu. Rev. Earth Planet. Sci. 47, 361–388. doi:10.1146/annurev-earth-053018-060457
Barnhart, W. D., Hayes, G. P., and Gold, R. D. (2019). The July 2019 Ridgecrest, California, Earthquake Sequence: Kinematics of Slip and Stressing in Cross‐Fault Ruptures. Geophys. Res. Lett. 46, 11859–11867. doi:10.1029/2019gl084741
Behr, Y., Clinton, J., Kästli, P., Cauzzi, C., Racine, R., and Meier, M.-A. (2015). Anatomy of an Earthquake Early Warning (EEW) Alert: Predicting Time Delays for an End-To-End EEW System. Seismological Res. Lett. 86, 830–840. doi:10.1785/0220140179
Blaser, L., Krüger, F., Ohrnberger, M., and Scherbaum, F. (2010). Scaling Relations of Earthquake Source Parameter Estimates with Special Focus on Subduction Environment. Bull. Seismological Soc. America 100, 2914–2926. doi:10.1785/0120100111
Bock, Y., Melgar, D., and Crowell, B. W. (2011). Real-time strong-motion Broadband Displacements from Collocated GPS and Accelerometers. Bull. Seismological Soc. America 101, 2904–2925. doi:10.1785/0120110007
Böse, M., Felizardo, C., and Heaton, T. H. (2015). Finite-Fault Rupture Detector (FinDer): Going Real-Time in CalifornianShakeAlertWarning System. Seismological Res. Lett. 86, 1692–1704. doi:10.1785/0220150154
Böse, M., Heaton, T., and Hauksson, E. (2012a). Rapid Estimation of Earthquake Source and Ground-Motion Parameters for Earthquake Early Warning Using Data from a Single Three-Component Broadband or strong-motion Sensor. Bull. Seismological Soc. America 102, 738–750. doi:10.1785/0120110152
Böse, M., Heaton, T. H., and Hauksson, E. (2012b). Real-time Finite Fault Rupture Detector (FinDer) for Large Earthquakes. Geophys. J. Int. 191, 803–812. doi:10.1111/j.1365-246x.2012.05657.x
Böse, M., and Heaton, T. H. (2010). Probabilistic Prediction of Rupture Length, Slip and Seismic Ground Motions for an Ongoing Rupture: Implications for Early Warning for Large Earthquakes. Geophys. J. Int. 183, 1014–1030. doi:10.1111/j.1365-246x.2010.04774.x
Böse, M., Heaton, T., and Hudnut, K. (2013). Combining Real-Time Seismic and GPS Data for Earthquake Early Warning. AGU Fall Meet. Abstr. 2013, G51B–G05.
Böse, M., Smith, D. E., Felizardo, C., Meier, M.-A., Heaton, T. H., and Clinton, J. F. (2018). FinDer v.2: Improved Real-Time Ground-Motion Predictions for M2-M9 with Seismic Finite-Source Characterization. Geophys. J. Int. 212, 725–742. doi:10.1093/gji/ggx430
Chen, Y., and Booth, D. C. (2011). The Wenchuan Earthquake of 2008: Anatomy of a Disaster. Springer Science & Business Media.
Chung, A. I., Henson, I., and Allen, R. M. (2019). Optimizing Earthquake Early Warning Performance: ElarmS‐3. Seismological Res. Lett. 90, 727–743. doi:10.1785/0220180192
Chung, A. I., Meier, M.-A., Andrews, J., Böse, M., Crowell, B. W., McGuire, J. J., et al. (2020). Shakealert Earthquake Early Warning System Performance during the 2019 Ridgecrest Earthquake Sequence. Bull. Seismological Soc. America 110, 1904–1923. doi:10.1785/0120200032
Clinton, J., Zollo, A., Marmureanu, A., Zulfikar, C., and Parolai, S. (2016). State-of-the Art and Future of Earthquake Early Warning in the European Region. Bull. Earthquake Eng. 14, 2441–2458. doi:10.1007/s10518-016-9922-7
Colombelli, S., Zollo, A., Festa, G., and Picozzi, M. (2014). Evidence for a Difference in Rupture Initiation between Small and Large Earthquakes. Nat. Commun. 5, 3958. doi:10.1038/ncomms4958
Crowell, B. W., Schmidt, D. A., Bodin, P., Vidale, J. E., Gomberg, J., Renate Hartog, J., et al. (2016). Demonstration of the Cascadia G‐FAST Geodetic Earthquake Early Warning System for the Nisqually, Washington, Earthquake. Seismological Res. Lett. 87, 930–943. doi:10.1785/0220150255
Cua, G., Fischer, M., Heaton, T., and Wiemer, S. (2009). Real-time Performance of the Virtual Seismologist Earthquake Early Warning Algorithm in Southern California. Seismological Res. Lett. 80, 740–747. doi:10.1785/gssrl.80.5.740
Cua, G., and Heaton, T. H. (2009). Characterizing Average Properties of Southern California Ground Motion Amplitudes and Envelopes.
Dahmen, N., Hohensinn, R., and Clinton, J. (2020). Comparison and Combination of GNSS and Strong-Motion Observations: A Case Study of the 2016 Mw 7.0 Kumamoto Earthquake. Bull. Seismological Soc. America 110, 2647–2660. doi:10.1785/0120200135
Denolle, M. A. (2019). Energetic Onset of Earthquakes. Geophys. Res. Lett. 46, 2458–2466. doi:10.1029/2018gl080687
Emore, G. L., Haase, J. S., Choi, K., Larson, K. M., and Yamagiwa, A. (2007). Recovering Seismic Displacements through Combined Use of 1-Hz GPS and strong-motion Accelerometers. Bull. Seismological Soc. America 97, 357–378. doi:10.1785/0120060153
Given, D. D., Allen, R. M., Baltay, A. S., Bodin, P., Cochran, E. S., Creager, K., et al. (2018). Revised Technical Implementation Plan for the ShakeAlert System–An Earthquake Early Warning System for the West Coast of the United States. U.S. Geological Survey Open-File Report 2018–1155 [Supersedes USGS Open-File Report 2014–1097], 42. doi:10.3133/ofr20181155
Goldberg, D. E., Melgar, D., Bock, Y., and Allen, R. M. (2018). Geodetic Observations of Weak Determinism in Rupture Evolution of Large Earthquakes. J. Geophys. Res. Solid Earth 123, 9950–9962. doi:10.1029/2018jb015962
Hanks, T. C., and Kanamori, H. (1979). A Moment Magnitude Scale. J. Geophys. Res. 84, 2348–2350. doi:10.1029/jb084ib05p02348
Hodgkinson, K. M., Mencin, D. J., Feaux, K., Sievers, C., and Mattioli, G. S. (2020). Evaluation of Earthquake Magnitude Estimation and Event Detection Thresholds for Real-Time GNSS Networks: Examples from Recent Events Captured by the Network of the Americas. Seismological Res. Lett. 91, 1628–1645. doi:10.1785/0220190269
Hudnut, K. W., Brooks, B. A., Scharer, K., Hernandez, J. L., Dawson, T. E., Oskin, M. E., et al. (2020). Airborne Lidar and Electro-Optical Imagery along Surface Ruptures of the 2019 Ridgecrest Earthquake Sequence, Southern California. Seismological Res. Lett. 91, 2096–2107. doi:10.1785/0220190338
Hutchison, A. A., Böse, M., and Manighetti, I. (2020). Improving Early Estimates of Large Earthquake’s Final Fault Lengths and Magnitudes Leveraging Source Fault Structural Maturity Information. Geophys. Res. Lett. 47, e2020GL087539. doi:10.1029/2020gl087539
Kobayashi, H., Koketsu, K., and Miyake, H. (2017). Rupture Processes of the 2016 Kumamoto Earthquake Sequence: Causes for Extreme Ground Motions. Geophys. Res. Lett. 44, 6002–6010. doi:10.1002/2017gl073857
Kodera, Y., Saitou, J., Hayashimoto, N., Adachi, S., Morimoto, M., Nishimae, Y., et al. (2016). Earthquake Early Warning for the 2016 Kumamoto Earthquake: Performance Evaluation of the Current System and the Next-Generation Methods of the Japan Meteorological Agency. Earth, Planets and Space 68, 1–14. doi:10.1186/s40623-016-0567-1
Kodera, Y., Yamada, Y., Hirano, K., Tamaribuchi, K., Adachi, S., Hayashimoto, N., et al. (2018). The Propagation of Local Undamped Motion (PLUM) Method: A Simple and Robust Seismic Wavefield Estimation Approach for Earthquake Early Warning. Bull. Seismological Soc. America 108, 983–1003. doi:10.1785/0120170085
Leonard, M. (2014). Self-consistent Earthquake Fault-Scaling Relations: Update and Extension to Stable continental Strike-Slip Faults. Bull. Seismological Soc. America 104, 2953–2965. doi:10.1785/0120140087
Li, J., Böse, M., Wyss, M., Wald, D. J., Hutchison, A., Clinton, J. F., et al. (2020). Estimating Rupture Dimensions of Three Major Earthquakes in Sichuan, China, for Early Warning and Rapid Loss Estimates. Bull. Seismological Soc. America 110, 920–936. doi:10.1785/0120190117
Manighetti, I., Campillo, M., Bouley, S., and Cotton, F. (2007). Earthquake Scaling, Fault Segmentation, and Structural Maturity. Earth Planet. Sci. Lett. 253, 429–438. doi:10.1016/j.epsl.2006.11.004
Manighetti, I., Campillo, M., Sammis, C., Mai, P., and King, G. (2005). Evidence for Self-Similar, Triangular Slip Distributions on Earthquakes: Implications for Earthquake and Fault Mechanics. J. Geophys. Res. Solid Earth 110. doi:10.1029/2004jb003174
Manighetti, I., King, G. C. P., Gaudemer, Y., Scholz, C. H., and Doubre, C. (2001). Slip Accumulation and Lateral Propagation of Active normal Faults in Afar. J. Geophys. Res. 106, 13667–13696. doi:10.1029/2000jb900471
Mattioli, G. S., Phillips, D. A., Hodgkinson, K. M., Walls, C., Mencin, D. J., Bartel, B. A., et al. (2020). The GAGE Data and Field Response to the 2019 Ridgecrest Earthquake Sequence. Seismological Res. Lett. 91, 2075–2086. doi:10.1785/0220190283
Meier, M.-A., Ampuero, J. P., and Heaton, T. H. (2017). The Hidden Simplicity of Subduction Megathrust Earthquakes. Science 357, 1277–1281. doi:10.1126/science.aan5643
Melgar, D., Crowell, B. W., Geng, J., Allen, R. M., Bock, Y., Riquelme, S., et al. (2015). Earthquake Magnitude Calculation without Saturation from the Scaling of Peak Ground Displacement. Geophys. Res. Lett. 42, 5197–5205. doi:10.1002/2015gl064278
Melgar, D., and Hayes, G. P. (2019). Characterizing Large Earthquakes before Rupture Is Complete. Sci. Adv. 5, eaav2032. doi:10.1126/sciadv.aav2032
Milliner, C., Bürgmann, R., Inbal, A., Wang, T., and Liang, C. (2020). Resolving the Kinematics and Moment Release of Early Afterslip within the First Hours Following the 2016 MW 7.1 Kumamoto Earthquake: Implications for the Shallow Slip Deficit and Frictional Behavior of Aseismic Creep. J. Geophys. Res. Solid Earth 125, e2019JB018928. doi:10.1029/2019jb018928
Milliner, C., and Donnellan, A. (2020). Using Daily Observations from Planet Labs Satellite Imagery to Separate the Surface Deformation between the 4 July Mw 6.4 Foreshock and 5 July Mw 7.1 Mainshock during the 2019 Ridgecrest Earthquake Sequence. Seismological Res. Lett. 91, 1986–1997. doi:10.1785/0220190271
Perrin, C., Manighetti, I., Ampuero, J.-P., Cappa, F., and Gaudemer, Y. (2016a). Location of Largest Earthquake Slip and Fast Rupture Controlled by Along-Strike Change in Fault Structural Maturity Due to Fault Growth. J. Geophys. Res. Solid Earth 121, 3666–3685. doi:10.1002/2015jb012671
Perrin, C., Manighetti, I., and Gaudemer, Y. (2016b). Off-fault Tip Splay Networks: A Genetic and Generic Property of Faults Indicative of Their Long-Term Propagation. Comptes Rendus Geosci. 348, 52–60. doi:10.1016/j.crte.2015.05.002
Radiguet, M., Cotton, F., Manighetti, I., Campillo, M., and Douglas, J. (2009). Dependency of Near-Field Ground Motions on the Structural Maturity of the Ruptured Faults. Bull. Seismological Soc. America 99, 2572–2581. doi:10.1785/0120080340
Ruhl, C. J., Melgar, D., Geng, J., Goldberg, D. E., Crowell, B. W., Allen, R. M., et al. (2019). A Global Database of Strong‐Motion Displacement GNSS Recordings and an Example Application to PGD Scaling. Seismological Res. Lett. 90, 271–279. doi:10.1785/0220180177
Satriano, C., Elia, L., Martino, C., Lancieri, M., Zollo, A., and Iannaccone, G. (2011). PRESTo, the Earthquake Early Warning System for Southern Italy: Concepts, Capabilities and Future Perspectives. Soil Dyn. Earthquake Eng. 31, 137–153. doi:10.1016/j.soildyn.2010.06.008
Scott, C. P., Arrowsmith, J. R., Nissen, E., Lajoie, L., Maruyama, T., and Chiba, T. (2018). The M 7 2016 Kumamoto, Japan, Earthquake: 3‐D Deformation along the Fault and within the Damage Zone Constrained from Differential Lidar Topography. J. Geophys. Res. Solid Earth 123, 6138–6155. doi:10.1029/2018jb015581
Shen, Z.-K., Sun, J., Zhang, P., Wan, Y., Wang, M., Bürgmann, R., et al. (2009). Slip Maxima at Fault Junctions and Rupturing of Barriers during the 2008 Wenchuan Earthquake. Nat. Geosci 2, 718–724. doi:10.1038/ngeo636
Shirahama, Y., Yoshimi, M., Awata, Y., Maruyama, T., Azuma, T., Miyashita, Y., et al. (2016). Characteristics of the Surface Ruptures Associated with the 2016 Kumamoto Earthquake Sequence, central Kyushu, Japan. Earth, Planets and Space 68, 1–12. doi:10.1186/s40623-016-0559-1
Somei, K., Miyakoshi, K., Yoshida, K., Kurahashi, S., and Irikura, K. (2020). Near-Source Strong Pulses During Two Large MJMA 6.5 and MJMA 7.3 Events in the 2016 Kumamoto, Japan, Earthquakes. Pure Appl. Geophys., 177. doi:10.1007/s00024-019-02095-6
Stubailo, I., Alvarez, M., Biasi, G., Bhadha, R., and Hauksson, E. (2021). Latency of Waveform Data Delivery from the Southern California Seismic Network during the 2019 Ridgecrest Earthquake Sequence and its Effect on ShakeAlert. Seismological Soc. America 92, 170–186. doi:10.1785/0220200211
Uchide, T., Horikawa, H., Nakai, M., Matsushita, R., Shigematsu, N., Ando, R., et al. (2016). The 2016 Kumamoto–Oita Earthquake Sequence: Aftershock Seismicity gap and Dynamic Triggering in Volcanic Areas. Earth, Planets and Space 68, 1–10. doi:10.1186/s40623-016-0556-4
Wang, K., and Bürgmann, R. (2020). Co- and Early Postseismic Deformation Due to the 2019 Ridgecrest Earthquake Sequence Constrained by Sentinel-1 and COSMO-SkyMed SAR Data. Seismological Res. Lett. 91, 1998–2009. doi:10.1785/0220190299
Wells, D. L., and Coppersmith, K. J. (1994). New Empirical Relationships Among Magnitude, Rupture Length, Rupture Width, Rupture Area, and Surface Displacement. Bull. seismological Soc. America 84, 974–1002.
Wesnousky, S. G. (1988). Seismological and Structural Evolution of Strike-Slip Faults. Nature 335, 340–343. doi:10.1038/335340a0
Wu, Y.-M., Yen, H.-Y., Zhao, L., Huang, B.-S., and Liang, W.-T. (2006). Magnitude Determination Using Initial P Waves: A Single-Station Approach. Geophys. Res. Lett. 33. doi:10.1029/2005gl025395
Keywords: earthquake early warning, seismology, earthquake, natural Hazard, earthquake magnitude, fault properties, fault maturity, rupture determinism
Citation: Böse M, Hutchison AA, Manighetti I, Li J, Massin F and Clinton JF (2021) FinDerS(+): Real-Time Earthquake Slip Profiles and Magnitudes Estimated from Backprojected Displacement with Consideration of Fault Source Maturity Gradient. Front. Earth Sci. 9:685879. doi: 10.3389/feart.2021.685879
Received: 26 March 2021; Accepted: 02 July 2021;
Published: 04 August 2021.
Edited by:
Joanna Faure Walker, University College London, United KingdomReviewed by:
Yuki Kodera, Japan Meteorological Agency, JapanFrancesco Iezzi, University of Studies G. d’Annunzio Chieti and Pescara, Italy
Copyright © 2021 Böse, Hutchison, Manighetti, Li, Massin and Clinton. This is an open-access article distributed under the terms of the Creative Commons Attribution License (CC BY). The use, distribution or reproduction in other forums is permitted, provided the original author(s) and the copyright owner(s) are credited and that the original publication in this journal is cited, in accordance with accepted academic practice. No use, distribution or reproduction is permitted which does not comply with these terms.
*Correspondence: Maren Böse, bWJvZXNlQHNlZC5ldGh6LmNo