 Zhong Tian
 Hao Yang
- State Key Laboratory of Hydraulics and Mountain River Engineering, Sichuan University, Chengdu, China
Dam-breaking accidents in tailings ponds may result in loss of tailings, damage to the downstream bridges and houses, flooding of farmland and roads, hazards to the local environment, and even loss of property and lives. Therefore, research on dam breaks in tailings reservoirs and prediction of subsequent impacts are of great significance. This paper describes theoretical and numerical analyses of the retrogressive erosion model and calculations of the sand bed surface profile and sediment transport rate following tailings dam break events. The calculation results show that the degrading rate of the bed surface in the reservoir area reaches a maximum when the breach is formed and then rapidly decreases to a stable value. Farther away from the breach, the peak degrading rate of the bed surface is lower. The time of the peak tailings outflow rate is related to the formation of the breach. A larger breach has a shorter formation time and a greater peak flow.
1 Introduction
Tailings ponds are used to store tailings or other industrial waste residues produced in metal or non-metallic mines after ore separation. Such ponds are typically formed by constructing dams at valley mouths. Tailings ponds are man-made sources of hazard with high potential energy. The breaks of tailings dams would cause loss of natural resources, pollution of rivers, land and the surrounding environment, and threat to the lives and property of local residents.
According to the statistics released by the Internation Commission on Large Dams (ICOLD), there have been more than 200 accidents related to the failure of tailings ponds in the past century (Jeyapalan, 1982; Campbell and Fitterman, 2000; Davies and Martin, 2000). In 1985, the failure of the tailings dam at the Stava fluorite mine in Italy resulted in 268 fatalities and 20 injuries (Luino and Graff, 2012). In 1995, the accident in Omai, Guyana caused 900 deaths due to the contamination of drinking water by cyanide (Beebe, 2001). The heavy rain and snowmelt in January 2000 caused the Baia Mare tailings dam accident in Romania, killing a large number of fish in the Tisza River and poisoning the drinking water of 2 million people in Hungary (László, 2006). In 2015, following the collapse of the tailings dam in Mariana, Brazil, the urban area and the residents of Balalonga were exposed to toxic sludge, creating Brazil’s worst environmental disaster (Vormittag et al., 2021). On January 25, 2019, the tailings dam of the Corregordo Fejo iron mine (Brumadinho, Minas Gerais, southern Brazil) ruptured, causing 270 deaths (11 of which are officially missing) and releasing 12,106 m3 of tailings to the environment. The tailings reached the neighboring Para Opeba River, where they threatened the drinking water security of the densely populated areas (Parente et al., 2021).
There have been a relatively small number of studies on the prediction of tailings dam break. Most existing researches focused on dam stability analysis, seismic liquefaction and resistance, environmental pollution control, etc.
In terms of model tests, Souza Jr and Teixeira used a physical model to study the volume of tailings released by ponds containing different tailing materials and for various breach shapes (Souza and Teixeira, 2019). Jing et al. pointed out that the hydrodynamic characteristics of the debris flow caused by tailings dam failures were affected by the particle size, bulk density, geometry of the reservoir, and the surface roughness (Jing et al., 2019). Based on the principle of similarity, Wu and Qin built a physical model of the Vadogo tailings pond and studied the optimization of the tailings dam maintenance and protection, to reduce the scale of the dam break, the discharged flow rate and flow velocity, and the downstream inundation area, thereby mitigating the destructive impact of dam break events (Wu and Qin, 2018). Jing et al. used physical modeling to study the dam displacement, saturation line, stresses, and fracture processes of upstream tailings dams during floods in the past 100 years, thus deepening our understanding of the dam failure regimes (Jing et al., 2012).
In terms of numerical simulation studies, Rico et al. used existing data of historic tailings dam failure records to establish simplified relationships between the geometric parameters of tailings ponds (such as dam height and tailings volume) and the hydraulic characteristics of the dam break floods (Rico et al., 2008). Jiang et al. established a two-dimensional seepage stability analysis model for tailings dams using the geotechnical analysis software SEEP/W, and they conducted dynamic simulations of the dam-breaking process with consideration of the seepage forces on the earth below the seepage line (Jiang, 2020). Petkovsek et al. established a tailings dam break model EMBREA-MUD to calculate the water and tailings outflow and the growth of the breach through a two-fluid method (Petkovsek et al., 2021). Hu et al. used FLOW-3D to simulate and analyze the effects of correlation coefficient on the discharge velocity following tailings dam breaks (Hu et al., 2021). Based on the previous experimental and numerical modeling of tailings dam cutoff models, Wang et al. selected key characteristic parameters and used the uncertainty measurement theory to set an assessment standard of the hazard levels for tailings-dam-break disasters (Wang et al., 2021).
Dam break downstream a tailings pond involves repeat scouring, destabilization, and a collapse processes. Prediction of such events involves knowledge of hydraulics, soil mechanics, sediment kinematics, and other disciplines. The complex coupling of the relevant physical processes makes comprehensive research of the problem difficult. Experimental research on dam breaks is limited by the facility conditions and budget, especially for those tailings ponds with large dams heights and storage capacities. Although the limitation of experimental research leaves considerable possibilities for numerical simulation, the existing numerical studies are mostly limited to instantaneous dam break, while most dam failures are caused by the gradual scouring on the dam body after overtopping and the associated instability and collapse, which have rarely been studied. Based on the incremental nature of the tailings dam-breaking process and its gradual upstream development, this paper applies the basic theory of retrogressive erosion to the study of tailings dam breaks in an attempt to determine the evolution processes of the bed profiles and the sand flow rates at the breach.
2 Methods
2.1 Fundamentals
Dam-breaking sand flow is a special continuous medium that lies somewhere between “a fluid” and “being discrete”. The flow motions follow the Bingham flow model, and so the isotropic stress state and its corresponding volume deformation are not considered in our calculations. The flows can be described by the continuity equation and momentum equation that are similar to fluid flows.
The overtopping and breaking processes of tailings dams can be summarized as follows: 1) the upstream inflow raises the water level in the reservoir and overflows the dam crest, taking away the loose tailings sand from the downstream dam slope and creating small erosion gullies; 2) the gullies grow under the continuous erosion of the overtopping flow, leading to local instabilities and collapses of the dam slope, the falling material continues to be carried away by the water flow, and the gullies become deeper and wider; 3) as the erosion time increases, the gullies continue to expand and extend to the upstream end of the dam; and 4) as the elevation of the breach bottom decreases, the elevation of the bed surface gradually decreases until an equilibrium state is reached.
The characteristics of retrogressive erosion include the following. Firstly, the base level of erosion decreases with the sudden drop of the upstream water level. Secondly, erosion develops from downstream to upstream, and the erosion intensity decreases with increasing distance. The amount of sediment scoured is related to the time of scouring, the sand flow rate, and the drop in water level (Jianyuan, 1999). Therefore, dam overtopping and breaking are continuously developing processes from downstream to upstream, constituting a typical retrogressive scouring process. Tracing the source of the scouring indicates that the scouring develops upstream in the form of “local drop” that concentrates the energy dissipation of water flow and strengthens the sand-carrying capacity (Zhang, 1993). Therefore, it is appropriate to use the bed load sediment transport equation and sediment continuity equation to describe the overtopping and breaking process of tailings dams.
2.2 Mathematical Formulation
2.2.1 Bed Load Transport Equation
For sediment transport driven by water flow, assuming a constant water flow rate (i.e., q does not change), and ignoring the change in kinetic energy, the reduction of the water’s potential energy is used to overcome the flow resistance and transport the sediment downstream. The energy balance equation can be written as (Peng and Niu, 1987):
where
or:
where
2.2.2 Sediment Continuity Equation
114 The continuity equation of sediment for a bed formation by water flow is (Peng and Chang, 1981):
where
Substituting Eq. 5 into Eq. 4 yields the diffusion equation:
where
2.2.3 Unit-Width Sand Flow Rate at Thebreach
For ordinary reservoirs, given the relationship between the water level and time, the flow discharge at the breach can be obtained from the storage-level relationship curve. The break of tailings dams is different, as the sand flow process line at the breach cannot be obtained from the relationship curve between the storage capacity and tailings elevation. This is because, during tailings dam break, the sand flow in the reservoir area does not hold the horizontal consistency, with great unevenness in the changes of bed elevation at the near and far ends. The tailings elevation in the upstream area far from the breach changes slower than that closer to the breach. This results in the characteristic “low front and high back” appearance of the bed elevation in the reservoir area.
For this reason, we use the method of integration to approximate the sand transport rate and the sand flow per unit width. That is, in the short time period
At
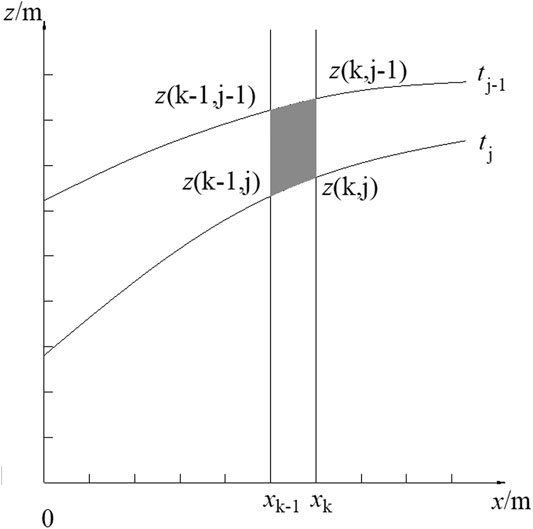
FIGURE 1. Sketch of calculation of unit-width sand transport rate and unit-width sand flow rate at the breach.
The average unit-width sand flow rate in the period of (
2.2.4 Definite Solution Conditions
1) Initial conditions: at
2) Downstream boundary condition (at the breach):
3) Upstream boundary condition (or water and sand inflow conditions from the far end of the reservoir): based on Eq. 3 for the sediment transport rate:
Thereby,
That is, the sediment transport rate
Equations 11 and 8 are the basic equations for the evolution of bed surface profile and unit-width sand flow rate. Given the initial and boundary conditions, numerical discrete solutions can be obtained.
2.3 Calculation Method Verification
Consider an real-case example in which the median particle size of the siltation in the reservoir is 0.286 mm, the upstream inflow rate is 1.10 m3/s, the reservoir sand bed slope is 0.0016, the sand bed slope at the upstream end of the erosion section is 0.009, and the descent at upstream side of the dam is 3.0 m (Peng and Zhang, 1985). The sand bed slope of the reservoir area is the ratio of the tailings elevation difference between the far-end of the reservoir and the dam site at the initial moment over the length of the reservoir, which is used to set the initial conditions for the tailings elevation based on the measured values. The slope at the upstream end of the erosion section is the slope of the outer bed at the initial moment, which equals the slope of the water surface at a constant flow rate entering the reservoir. It is used to set the upstream boundary conditions for solving the equation.
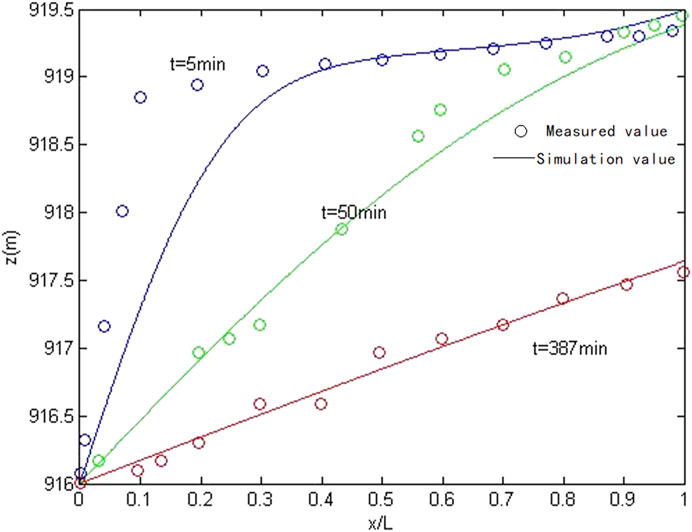
FIGURE 2. Calculation method verification results.
The comparison shows that the calculated results are overall consistent with the measured data, thus the proposed method satisfies the requirement for engineering calculations.
3 Case Study
3.1 Project Overview and Calculation Domain Conceptualization
We consider a tailings pond located in Fumin County, Yunnan Province, China (Wang, 2011). The design capacity of the mineral processing plant is 18,000 tons/day, the tailings production rate is 98.6%, the solid particle density in the tailings is 2.7 t/m3, and the average dry bulk density is 1.3 t/m3. The annual tailings discharge is 4.5 million m3. The tailings dam body is composed of an initial dam and an accumulation dam. The initial dam is a rockfill dam with a height of 40 m and an effective storage capacity of 2.85 million m3. The main dam crest is 224 m long and 5 m wide; the accumulation dam is constructed using the upstream damming method. Starting from the main dam at the valley mouth; the outer slope of the dam is 1:4, and the total dam height is 130 m. The final effective storage capacity of the tailings pond is 108.9 million m3. The tailings pond is rated as a second-class tailings pond. Downstream of the tailings reservoir there is a gully about 7.5 km long, followed by a 90° turn away from the dam site. The bank slopes on the two sides of the gully are of different angles. According to the field observation data, the site geometry can be simplified into a 2D model considering the large width-to-depth ratio of the reservoir area, as shown in Figure 3. The total length of the reservoir area is 2,250 m (1,500 m + 750 m), the height is 150 m, the width of the reservoir area is 1,400 m, and the width of the dam site is 260 m.
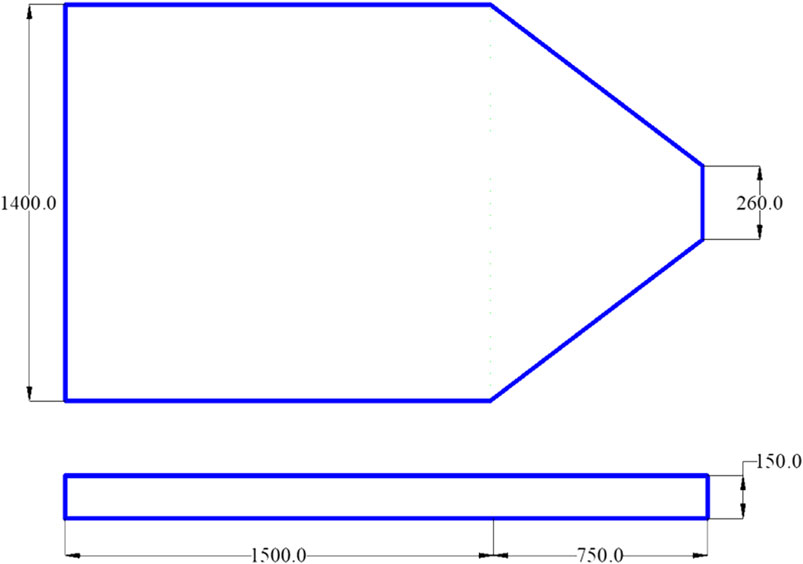
FIGURE 3. Conceptualized map of the reservoir area (A) Plan view; (B) longitudinal Cross-sectional side view (unit: m).
3.2 Calculation Parameters
According to the hydrological data, the upstream unit-width inflow rate is 5.0 m2/s, the sand bed slope of the reservoir area
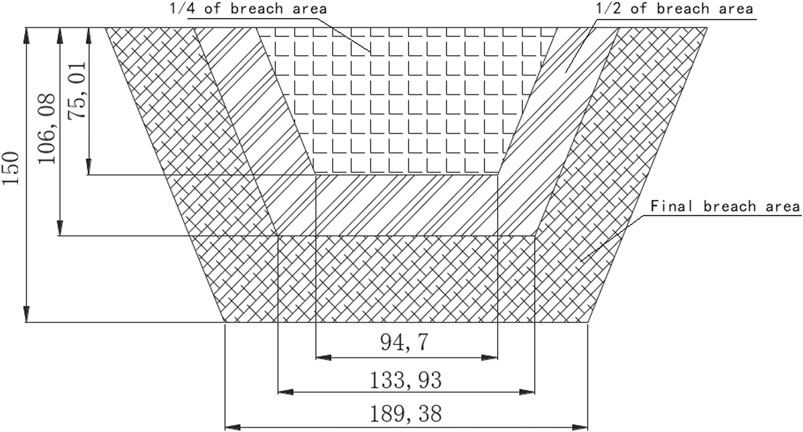
FIGURE 4. Schematic diagram of the final collapse shape at different dam break stages.
Wang selected three sets of tailings samples, and tested the specific gravity, density, water content, and other parameters. The average values of these parameters are presented in Table 1 (Wang and Zhang, 2012).

TABLE 1. Physical parameters of tailings.
3.3 Calculation Results and Analysis
3.3.1 Changes of Bed Surface in Reservoir Area
Assuming that the dam body is completely broken within 5 min, the width of the bottom of the breach is 189.3 m, the height of the remaining dam is 0 m, and the total area of the breach is 37,788 m2. Figure 5 shows the change in bed elevation with time at different locations. Figure 6 shows the elevation profile shapes of the bed surface at different times.
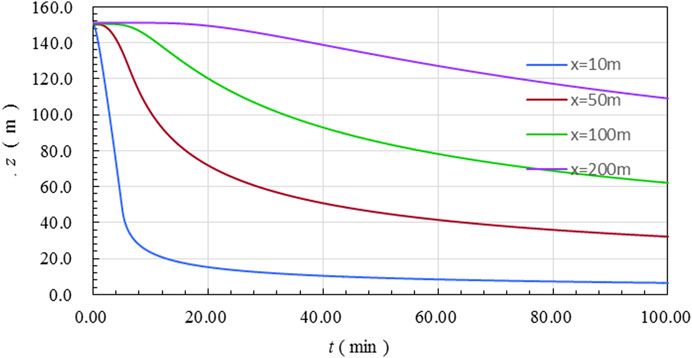
FIGURE 5. Variation of bed elevation with time at different locations in the reservoir area.
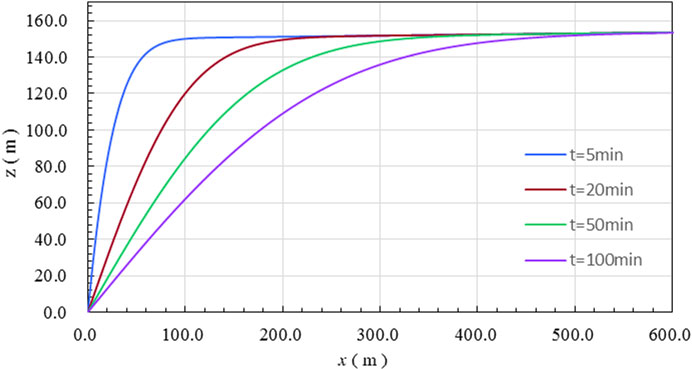
FIGURE 6. Variation of bed elevation along distance from the dam site at different dam break times.
In the area close to the breach (i.e.,
When the dam break lasts for
3.3.2 Change Process of Unit-Width Sand Flow Rate at the Breach
During different dam breaking stages as shown in Figure 4, the flow rate at the breach decreases as the area of breach decreases. The sand flow rate reaches a maximum at a complete dam break, and then decreases rapidly before gradually reaching a stable value, as shown in Figure 7.
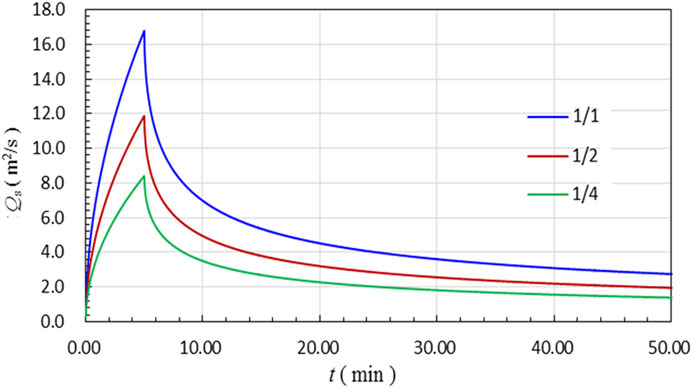
FIGURE 7. Variation in sand flow rate
4 Conclusion
Dam break events caused by flood overtopping are commonly encountered in tailings ponds. Compared to the literature in the relevant field, this paper has discussed the retrogressive erosion process in the upstream reservoir area during the tailings dam breaking for the first time. The basic theory of retrogressive erosion has been applied to the dam-break calculations of tailings reservoirs, and the changes in the bed surface profile shape in the reservoir area have been analyzed. Using a piecewise integral method, the sand discharge after the dam breaks and the sand transport rate have both been established as functions of time and location. The calculation results show that the degrading rate of the reservoir bed reaches a maximum when the breach is formed, and then rapidly decreases to a stable value. Farther away from the breach, the peak degrading rate of the bed surface is lower. The time of the peak tailings outflow rate is basically related to the formation of the breach. A larger breach has a shorter formation time and a greater peak flow.
Compared with articles in this field in international journals, this article uses the traceability scouring equation to solve the bed elevation change of the tailings pond and obtains the sand discharge and the sand transport rate for the first time, which is innovative and practical.
The calculation equations have been fully verified in other fields. Compared with other equations for solving the elevation change of the bed surface of the dam-breaking tailings reservoir, this diffusion equation is simple and easy to solve, with clear physical meaning. The results of this paper provide a reference for future studies of dam failures in tailings reservoirs.
Data Availability Statement
The original contributions presented in the study are included in the article/Supplementary Material, further inquiries can be directed to the corresponding author.
Author Contributions
ZT is the creator and person in charge of the article, ZT is responsible for formula derivation, HY is responsible for document collection and paper format modification, DC and WW write codes and calculations.
Conflict of Interest
The authors declare that the research was conducted in the absence of any commercial or financial relationships that could be construed as a potential conflict of interest.
References
Beebe, R. R. (2001). “Process Considerations before and after Failure of the Omai Tailings Dam,” in Symposium on Cyanide - Social, Industrial and Economic Aspects, Held at the Annual Meeting of TMS. Editors C. Young, and L. Twidwell, 3–10.
Campbell, D. L., and Fitterman, D. V. (2000). “Geoelectrical Methods for Investigating Mine Dumps,” in Proceedings from the Fifth International Conference on Acid Rock Drainage, 1513–1523.
Davies, M. P., and Martin, T. E. (2000). “Upstream Constructed Tailings Dams: A Review of the Basics,” in Proceedings of the Seventh International Conference on Tailings and Mine Waste, 3–15.
Hu, J., Na, C., and Wang, Y. (2021). “Study on Discharge Velocity of Tailings Mortar in Dam Break Based on Flow-3d,” in IOP Conference Series: Earth and Environmental Science, Dec 11–13, 2020 (United Kingdom:IOP Publishing), 643. doi:10.1088/1755-1315/643/1/012052
Jeyapalan, J. K. (1982). “Dam-break Studies for Mine Tailings Impoundments,” in Proceedings of the Fifth Symposium on Uranium Mill Tailings Management, 39–53.
Jiang, S. (2020). Simulation Method for Performing Dam Break Process Caused by Seepage Failure of Tailings Reservoir Dam Structure, Involves Obtaining Information of Inundation Range of Dam-Breaking and Flow Velocity and Flow Rate of Discharged Tailings (China: CN111931275-A).
Jianyuan, Z. (1999). Specification for Sediment Design of Hydropower and Water Conservancy Project (China: DL/T 5089-1999r).
Jing, X., Chen, Y., Xie, D., Williams, D. J., Wu, S., Wang, W., et al. (2019). The Effect of Grain Size on the Hydrodynamics of Mudflow Surge from a Tailings Dam-Break. Appl. Sci. 9, 2474. doi:10.3390/app9122474
Jing, X. F., Zhang, W. Z., and Chen, Y. L. (2012). “Collapse Evolvement Analysis of Upstream Tailings Dam in Flood Situation,” in Advances in Hydrology and Hydraulic Engineering, Parts 1 and 2. Editors C. Jiang, and Z. Yang, 212–213. doi:10.4028/www.scientific.net/amm.212-213.759
László, F. (2006). “Lessons Learned from the Cyanide and Heavy Metal Accidental Water Pollution in the Tisa River basin in the Year 2000,” in Management of Intentional and Accidental Water Pollution. Editors Dura, and Simeonova, 43–50. doi:10.1007/1-4020-4800-9_4
Luino, F., and De Graff, J. V. (2012). The Stava Mudflow of 19 July 1985 (Northern italy): a Disaster that Effective Regulation Might Have Prevented. Nat. Hazards Earth Syst. Sci. 12, 1029–1044. doi:10.5194/nhess-12-1029-2012
Parente, C. E. T., Lino, A. S., Carvalho, G. O., Pizzochero, A. C., Azevedo-Silva, C. E., Freitas, M. O., et al. (2021). First Year after the Brumadinho Tailings' Dam Collapse: Spatial and Seasonal Variation of Trace Elements in Sediments, Fishes and Macrophytes from the Paraopeba River, Brazil. Environ. Res. 193, 110526. doi:10.1016/j.envres.2020.110526
Peng, R., and Chang, D. (1981). Formulas for Calculating Headward Erosion on a Bed Load delta. J. Sediment. Res. 01. doi:10.16239/j.cnki.0468-155x.1981.01.002
Peng, R., and Niu, J. (1987). Numerical Calculation of Load Traceability and Erosion. J. Sediment. Res. 03. doi:10.16239/j.cnki.0468-155x.1987.03.007
Peng, R., and Zhang, Z. (1985). Control and Utilization of Reservoir Headward Erosin. SHUILI XUEBAO 01, 10–22. doi:10.13243/j.cnki.slxb.1985.01.002
Petkovšek, G., Hassan, M. A. A. M., Lumbroso, D., and Roca Collell, M. (2021). A Two-Fluid Simulation of Tailings Dam Breaching. Mine Water Environ. 40, 151–165. doi:10.1007/s10230-020-00717-3
Rico, M., Benito, G., and Díez-Herrero, A. (2008). Floods from Tailings Dam Failures. J. Hazard. Mater. 154, 79–87. doi:10.1016/j.jhazmat.2007.09.110
Souza, T. F., and Teixeira, S. H. C. (2019). Simulation of Tailings Release in Dam Break Scenarios Using Physical Models. Rem, Int. Eng. J. 72, 385–393. doi:10.1590/0370-44672018720098
Vormittag, E., Saldiva, P., Anastacio, A., and Barbosa, F. (2021). High Levels of Metals/metalloids in Blood and Urine of Residents Living in the Area Affected by the Dam Failing in Barra Longa, District, Brazil: A Preliminary Human Biomonitoring Study. Environ. Toxicol. Pharmacol. 83, 103566. doi:10.1016/j.etap.2020.103566
Wang, G., Tian, S., Hu, B., Chen, J., and Kong, X. (2021). Regional hazard Degree Evaluation and Prediction for Disaster Induced by Discharged Tailings Flow from Dam Failure. Geotech Geol. Eng. 39, 2051–2063. doi:10.1007/s10706-020-01606-w
Wang, M. (2011). A Thesis Submitted to Chongqing University in Partial Fulfillment of the Requirement for the Degree of Master of Engineering. China: Chongqing University.
Wang, Y., and Zhang, J. (2012). Prediction and Analysis of Dam-Break Debris Flow in Tailing Pond Based on Similar Test. China Saf. Sci. J. 22. doi:10.16265/j.cnki.issn1003-3033.2012.12.003
Wu, T., and Qin, J. (2018). Experimental Study of a Tailings Impoundment Dam Failure Due to Overtopping. Mine Water Environ. 37, 272–280. doi:10.1007/s10230-018-0529-x
Keywords: tailings pond, dam break, retrogressive erosion, sediment transport rate, numerical simulation
Citation: Tian Z, Yang H, Wang W and Cao D (2021) Numerical Analysis of Sand Bed Degrading and Sediment Transport Rate Under Tailings Dam Break. Front. Earth Sci. 9:686277. doi: 10.3389/feart.2021.686277
Received: 26 March 2021; Accepted: 01 June 2021;
Published: 14 July 2021.
Edited by:
Jie Dou, China University of Geosciences Wuhan, ChinaReviewed by:
Zheng-yi Feng, National Chung Hsing University, TaiwanDongri Song, Institute of Mountain Hazards and Environment, Chinese Academy of Sciences (CAS), China
Copyright © 2021 Tian, Yang, Wang and Cao. This is an open-access article distributed under the terms of the Creative Commons Attribution License (CC BY). The use, distribution or reproduction in other forums is permitted, provided the original author(s) and the copyright owner(s) are credited and that the original publication in this journal is cited, in accordance with accepted academic practice. No use, distribution or reproduction is permitted which does not comply with these terms.
*Correspondence: Wei Wang, d2FuZ3dlaUBzY3UuZWR1LmNu