 Fuchang Zhong
 Rong Xiang
 Lanlan Zhang1,3*
 Meixun Zhao
 Liping Zhou
- 1Key Laboratory of Ocean and Marginal Sea Geology, South China Sea Institute of Oceanology, Innovation Academy of South China Sea Ecology and Environmental Engineering, Chinese Academy of Sciences, Guangzhou, China
- 2College of Earth and Planetary Sciences, University of Chinese Academy of Sciences, Beijing, China
- 3Southern Marine Science and Engineering Guangdong Laboratory, Guangzhou, China
- 4Frontiers Science Center for Deep Ocean Multispheres and Earth System, and Key Laboratory of Marine Chemistry Theory and Technology, Ministry of Education, Ocean University of China, Qingdao, China
- 5MOE Key Laboratory for Earth Surface Process, College of Urban and Environmental Sciences, Peking University, Beijing, China
The spatial distribution patterns of central Yellow Sea Mud (CYSM) thicknesses and their temporal evolution during the Holocene are here updated using data from 10 new cores, in combination with the previously-published data for 64 cores from this area. Of these 74 cores, 15 exhibit clear AMS 14C dating constraints. Three subareas of mud deposition can be delineated using analyses of spatiotemporal mud thickness distributions and the variations between these. A depocenter subarea, with mud thicknesses >4 m, lies in the northwestern part of the CYSM; the mean sedimentation rate (SR) is relatively high in this subarea, with two high SR stages occurring at ∼6.1–5.4 ka and ∼4–2.5 ka. An adjacent subarea surrounds the depocenter subarea; this subarea has mud thicknesses between 2 and 4 m, and a high mid-Holocene SR which evinces a gradually decreasing trend after 5 ka. A distal periphery subarea lies in the eastern part of the CYSM, with mud thicknesses between 0.5 and −2 m, and a low mean SR that has been generally stable over the last 7 ka. Our results indicate that both sedimentary sources and hydrological dynamics played important roles in the formation of CYSM. The Yellow River may be the principal sedimentary source for CYSM, as mud thickness decreases gradually from northwest to southeast. Different mud subareas appear to be affected by different hydrological dynamics: in the depocenter subarea, oceanic current fronts seem to play an important role in mud deposition, while in the adjacent subarea and the distal periphery subarea, weak tidal currents appear to be the dominant depositional control. The generally decreasing trend in the SR of the adjacent subarea indicate that the East Asian winter monsoon (EAWM) potentially controlled changes in CYSM sedimentary sources after 7 ka.
Introduction
Large, fine-grained sedimentary deposits can be found on many continental shelves around the world (Wang Y. et al., 2014; Zhou et al., 2015), mainly related to the transportation of large quantities of sediments discharged to the oceans by rivers (Walsh and Nittrouer, 2009). These deposits provide a rich source of information about terrestrial sediment supplies, marine hydrodynamic processes and paleoenvironmental changes, and have thus attracted much research (Lesueur and Tastet, 1994; Lesueur et al., 1996). Mud patches also exist on the East China Shelf Seas, including six large, entrenched mud belts in the central Bohai Sea, the northern Yellow Sea, the southern Yellow Sea, the southeastern Yellow Sea (the Huksan Mud Belt), the northern East China Sea and the inner continental shelf off the Zhejiang–Fujian coast (Li G. et al., 2014). The central Yellow Sea Mud (CYSM) belt, located on the southern Yellow Sea shelf, is the largest muddy patch of these six mud belts. The mud deposits found in the CYSM zone have not only preserved indispensable information about paleoclimatic and paleoenvironmental change, but can also provide a precious record of the complex ocean circulation changes that occurred in the CYSM zone’s adjacent areas during the Holocene (Hu et al., 2018).
The CYSM zone has widely been researched by Chinese, Korean and other scholars since the 1980s (Shi et al., 2003a). Most of these studies have focused on the reconstruction of paleoceanographic and paleoenvironmental changes during the Holocene. Based on the major faunal transition described by the A. beccarii-dominated assemblage being replaced by an A. ketienziensis-dominated assemblage in Core CC02, Kim and Kucera (2000) suggested that a modern-day type of oceanic circulation was established in the Yellow Sea during the 8.47-6.63 ka period. However, pointing to a major transition in benthic foraminifera from an A. aomoriensis-dominated assemblage to an A. ketienziensis-dominated assemblage, Xiang et al. (2008) suggested that the establishment of a modern-day type of oceanic circulation in the Yellow Sea may have occurred at ∼6-5 ka. In addition, Wang et al. (2020) identified a stable, shallow-sea, depositional stage after 5.6 ka using grain size and changes in foraminiferal compositions. These inconsistent times for the onset of a modern-day type of oceanic circulation would suggest that the paleooceanographic and paleoenvironmental changes that occurred in the Yellow Sea remain open to debate. One of the possible reasons for such inconsistent dating results may be that previous studies often discussed the evolution of paleoenvironmental changes for the whole mud belt, or even the whole southern Yellow Sea, using data from only one or two cores.
Muddy deposits in the East China seas are often believed to relate to a kind of low-energy, weakly-dynamic shelf environment (Shen et al., 1996; Shi et al., 2002; Shi et al., 2003b; Shi et al., 2012). Early studies proposed that the formation of the CYSM zone was related to a cyclonic gyre (Hu, 1984), which was controlled both by the outflow of the Yellow Sea coast current (YSCC) and the inflow of the Yellow Sea warm current (YSWC) (Hu, 1994; Su and Weng, 1994). However, using increasing quantities of data from a greater number of hydrologic surveys, studies have shown that the axis of the YSWC is on the western side of the Yellow Sea Trough (Lin et al., 2011; Hwang et al., 2014; Tak et al., 2016; Lie et al., 2019), thereby challenging the arguments in favor of a cyclonic circulation in the southern Yellow Sea. More numerical simulation studies have suggested that the presence of a weak tidal current is responsible for the low-energy environment, and consequently for the fine, clayey sedimentary deposits which characterize the CYSM zone (Dong et al., 1989; Gao et al., 1996; Zhu and Chang, 2000; Dong et al., 2011; Gao et al., 2016a). Recent studies have proposed that oceanic current fronts have played an important role in the deposition of fine sediments i.e., that the blocking effect of a shear front may serve as a suspended sediment trap and thereby cause sedimentary deposition (Gao et al., 2016b); other studies have also emphasized the role played by cross-front sediment transportation in the formation of CYSM (Zhang et al., 2016; Shi et al., 2019). The mechanisms behind the formation of the CYSM zone therefore remain both controversial and unclear. Detailed information on the spatiotemporal evolution of depositional processes in the CYSM zone during the Holocene clarifies the nature of these formation mechanisms, as well as provide a better understanding of the paleooceanographic and paleoenvironmental changes that have occurred in this region.
In recent 14 years, the spatial distribution of CYSM was uncovered using seismic shallow profile data analysis (Yang and Liu, 2007; Gao et al., 2016a). One North-South, and seven East-West, sub-bottom profiles suggested that CYSM is generally thick in the north and west, and thin in the south and east (Gao et al., 2016a). However, these seismic shallow profile data need to be confirmed by sedimentary facies or grain-size data extracted from sediment cores. Some studies have tried to use the depth of the sedimentary mud layer, calculated using sediment core grain size data, to directly reconstruct the spatial distribution of CYSM thicknesses (Wang F. F. et al., 2014; Wang Y. et al., 2014), though their results may be limited by the number of published cores (30 cores in (Wang F. F. et al., 2014) and 11 cores in (Wang Y. et al., 2014) used in these studies. In addition, spatiotemporal evolutionary studies of the CYSM in this region remain scarce.
In this study, we present data from 10 new cores in the CYSM zone, and compile, reorganize and comprehensively analyze the data and information from almost all the currently available sediment core archives from the southern Yellow Sea (Table 1; Figure 1). The spatial distributions of mud thicknesses and the temporal changes in the sedimentation rate (SR) of the CYSM zone since 7 ka are also presented in detail. The main objective of this study was to provide a more comprehensive understanding of the spatiotemporal evolution of the depositional processes behind the accumulation of CYSM during the Holocene, and its possible implications for sedimentary sources and formation mechanisms.

TABLE 1. Sediment cores and paleoenvironmental reconstructions used in this study.
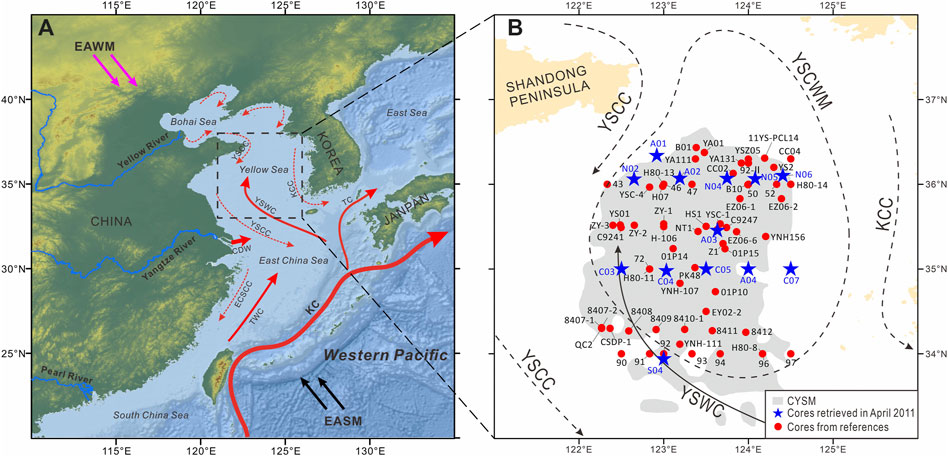
FIGURE 1. Modern oceanographic setting and locations of cores. (A) Schematic bathymetry and oceanic circulation (winter) of the East China Sea. (B) Schematic chart of regional circulation of the Southern Yellow Sea and the geographic locations of sediment cores discussed in this study. Blue stars and red dots indicate cores retrieved in April 2011 and cores taken from references, respectively (Table 1). The Central Yellow Sea Mud (CYSM) zone modified from (Li G. et al., 2014) and (Yang et al., 2018). The oceanic circulation was revised after (Su and Yuan, 2005) and (Kim and Kennett, 1998). KC, Kuroshio Current; YSWC, Yellow Sea Warm Current; TWC, Taiwan Warm Current; TWC, Tsushima Warm Current; YSCC, Yellow Sea Coastal Current; KCC, Korea Coast Current; ECSCC, East China Sea Coastal Current; CDW, Changjiang (Yangtze River) Diluted Water; YSCWM, Yellow Sea Cold Water Mass.
Materials and Methodology
Sampling and Compilation
In April 2011, a series of sediment cores were retrieved from the CYSM zone by R/V Dong-Fang-Hong 2, a vessel affiliated with the Ocean University of China. The aim was to study Holocene paleoenvironmetal changes in the Yellow Sea (Figures 1, 2; Table 1). Of these cores, age models have already been published for cores N02, A02, and A03 (Zhong et al., 2018; Jia et al., 2019; Wu et al., 2019). Another 10 sediment cores (A01, A04, C03, C04, C05, C07, N04, N05, N06, and S04) are presented in this study for the first time, with cores N04, N05, and C04 being well-dated (Table 2). Most of these cores consist of light-gray, slightly laminated, sandy muds in their lower parts, with their upper parts characterized by dark-gray, homogeneous silts to muds (Figure 2).
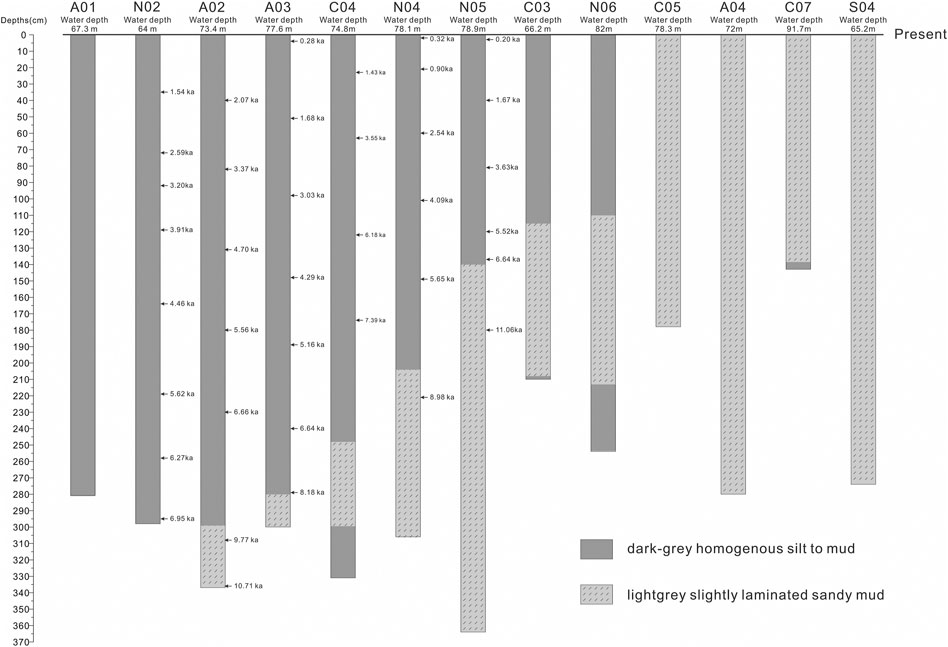
FIGURE 2. Sediment cores retrieved from the CYSM zone in April 2011. The age models of cores N02, A02, and A03 have already been published (Zhong et al., 2018; Jia et al., 2019; Wu et al., 2019). Sediment cores A01, A04, C03, C04, C05, C07, N04, N05, N06, and S04 were first used in this study; cores A01, N04, N05, C04 are well-dated (Table 2).
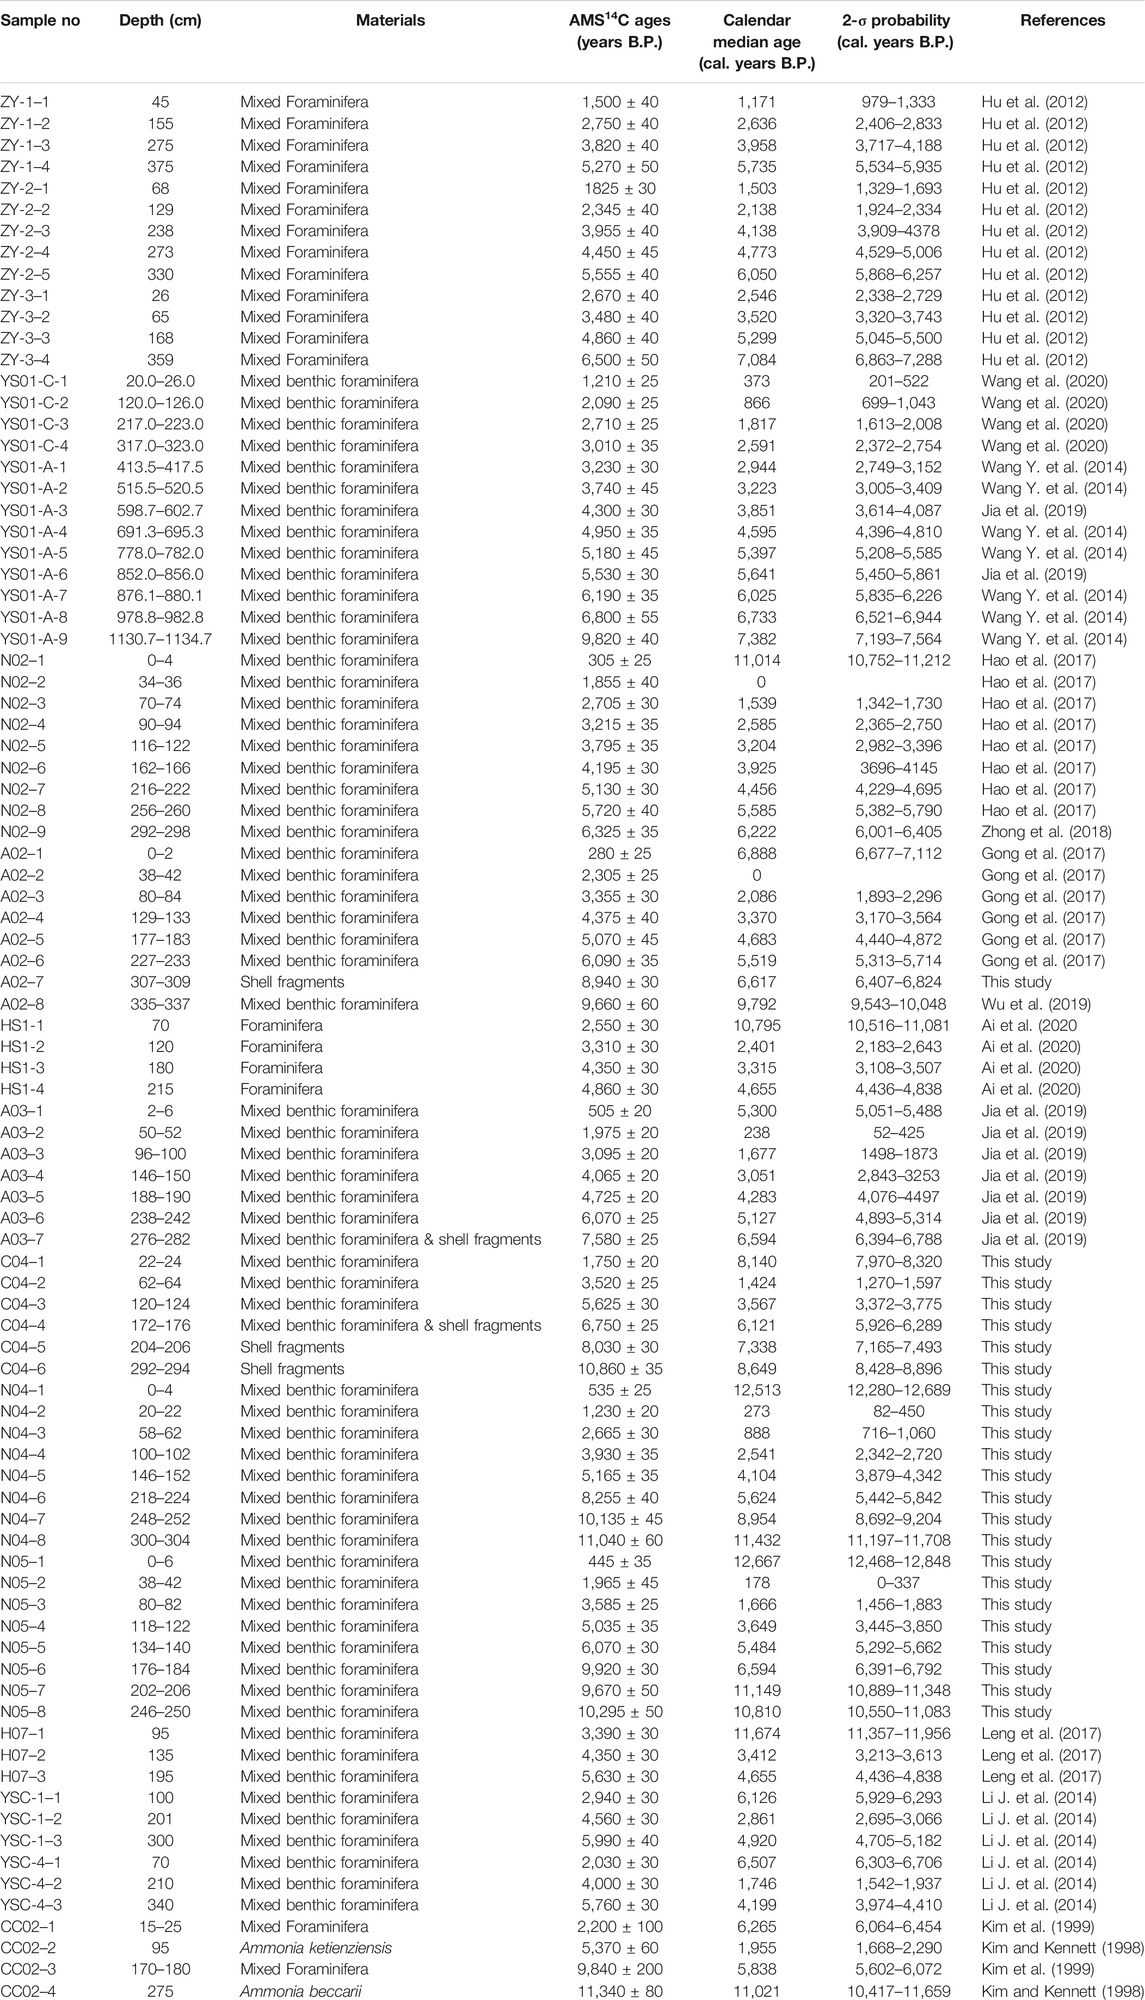
TABLE 2. AMS 14C age data and calibrated age data for cores used in this study, with re-calibrated age data for cores from references. Calendar ages were performed by the CALIB 8.2 program (Stuiver et al., 2021) and the Marine20 calibration curve (Heaton et al., 2020).
Over the past 6 decades, many sediment core datasets from the southern Yellow Sea have been published as part of particular geological surveys and/or paleoceanographic research. A great many more sediment cores with well-dated age models have now been described in publications, especially over the last ten years (Table 2); this has allowed a more reliable analysis of the spatiotemporal evolution of CYSM. This study compiled these sedimentary datasets in order to produce detailed records of the spatial distribution of mud thicknesses and temporal changes in SRs in the CYSM zone. For the cores without age constraints, we assumed that any mud sediments were deposited after the mid-Holocene sea level highstand.
Chronology
Mixed benthic foraminifera from cores N04, N05, and C04 were picked for accelerator mass spectrometry (AMC) 14C dating at the Beta Analysis Company (United States) and Dating Laboratory at Peking University (Beijing, China). The results are shown in Table 2. The radioactive half-life of 14C, used in the dating, was 5,568 years. Dating errors were less than ±164 years within a 1σ interval, using the AMS 14C method. All dates from these cores and other references (Table 2) were calibrated or re-calibrated to calendar ages using the CALIB 8.2 program (Stuiver et al., 2021) and the Marine20 calibration curve (Heaton et al., 2020), with a correction factor of Delta R = −276 ± 52 years. The Delta R value is the mean of three data points which have been recalculated from Marine20 (Heaton et al., 2020): one from Qingdao (Southon et al., 2002) and the other two from the Korean Peninsula (Kong and Lee, 2005). All ages are given as calendar ages.
Definition of Mud Thickness
We collated information from almost all the core datasets currently available from the CYSM zone with that from 10 new cores, producing a dataset for 74 cores in total. Most records used Shepard’s classification method for detrital sediments (Shepard, 1954) to classify surficial sediments and correlate grain-size gradations with their corresponding dynamic sedimentary environment (Zhang et al., 2016). However, when Wang et al. (2008) analyzed 500 surface sediment grain sizes in the western part of the southern Yellow Sea, they suggested that compared with the pure descriptive classification of Shepard classification, the three-endmember classification of Folk (Folk et al., 1970) is not equivalent and has obvious dynamic significance. Its application in the Yellow Sea muddy area is obviously better than that of Shepard classification (Wang et al., 2008). Thus, in this study, for cores with grain size or coarse fraction (> 63 μm percentage i.e., percentage of sand content) datasets, we classified core sediments using Folk’s classification method (part of sand content less than 10% is defined as mud deposit) to identify the thickness of any mud deposits. For cores without grain size or coarse fraction datasets, we used information about lithology obtained from the original text to comprehensively determine the thickness of any mud deposits (Supplementary Material 1), with an estimated error of <± 0.1 m.
Kriging Interpolation
The Kriging interpolative method, an optimal spatial interpolation technique (Gandhi and Sarkar, 2016), is a widely-used geostatistical method (Lorkowski, 2021; Gao et al., 2021; Meng, 2021; Hurtado et al., 2021) for creating smooth surfaces by interpolating the value of the quantity of interest between points at which it has been measured, based on the distance between those points (MacKenzie et al., 2018). The determination of the interpolated value is not carried out by some arbitrary algorithm, but takes into account the statistical characteristics of the phenomenon. These characteristics are derived from the available observations by inspecting the correlation of values with respect to the spatial, temporal or spatial-temporal distance of the observations (Lorkowski, 2021). In order to reconstruct the spatial distribution characteristics of muds deposited during the Holocene in the CYSM zone, we utilized Surfer 17.0 software to analyze the mud deposit thickness data (Table 1) of each station using the Kriging technique.
Results
Spatial Distribution of Mud Thicknesses in the CYSM Zone
The spatial distribution of mud thicknesses was reconstructed by collating the mud thickness datasets derived from 74 CYSM zone cores. Results indicated that Holocene mud in the CYSM zone is mainly located within the 34.5–36.5°N and 122–124.5°E region (Figure 3), where water depths are principally between 50 m and 80 m. This mud distribution range would appear to be generally consistent with the surface mud distribution described by Li (2005). The thickest mud deposits lie in the western and northwestern parts of the CYSM, where mud thickness is ∼11 m (Core YS01), rapidly decreasing to <4 m in the ZY2 and ZY3 cores nearby. This area of the depocenter, with mud thicknesses of > 4 m, is roughly located within the 35.5–36°N and 122.3–122.9°E region. Away from the depocenter, mud thickness gradually thins toward the outer margins of the CYSM zone. Along the 122.8°N, 35.8°E transect, the gradual thinning of mud thickness is especially marked to the south and east, respectively (Figure 3). The mud is thicker in the western and northwestern parts of the CYSM zone, gradually thinning from west to east, and from north to south.
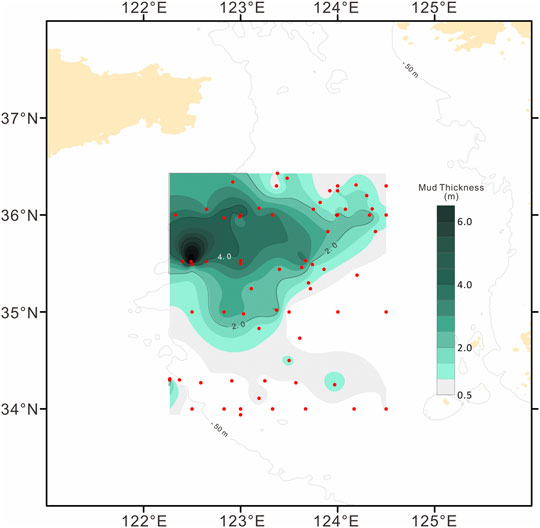
FIGURE 3. Isopach map of mud thicknesses in the CYSM zone since 7 ka.
Spatiotemporal Variations in SRs in the CYSM Zone
A relatively precise reconstruction of spatiotemporal variations in the SR requires reliable SR calculations, which in turn depend on high precision data and age control points. In this study, to better constrain SRs during this period, 15 sediment cores with at least three post-7 ka dating points, when sea levels reached their Holocene highstand, were chosen for SR calculation. The reconstructed results for spatiotemporal SR variations are presented in Figure 4.
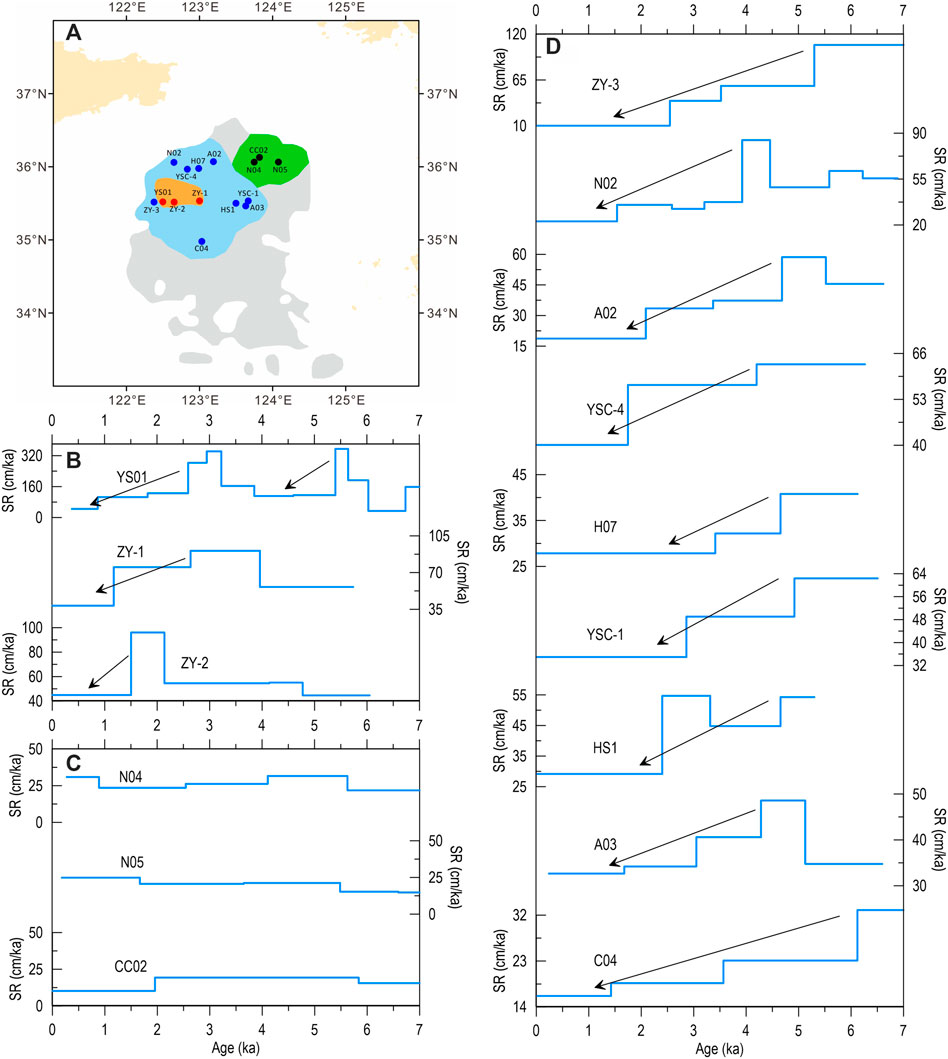
FIGURE 4. (A) Schematic diagram of the spatial distribution of Holocene mud sedimentary rates [SR; orange area: the depocenter subarea; light blue toroid polygon: the adjacent subarea; green area: the peripheral subarea; gray area: the CYSM zone, modified from (Li G. et al., 2014) and (Yang et al., 2018)]; (B–D)14C stratigraphy of 15 cores in the CYSM zone [YS01 (Jia et al., 2019; Wang Y. et al., 2014; Wang et al., 2020, ZY-1 (Hu et al., 2012), ZY-2 (Hu et al., 2012), ZY-3 (Hu et al., 2012), N02 (Hao et al., 2017; Zhong et al., 2018), A02 (Gong et al., 2017; Wu et al., 2019; this study), YSC-4 (Li J. et al., 2014), H07 (Leng et al., 2017), YSC-1 (Li J. et al., 2014), HS1 (Ai et al., 2020), A03 (Jia et al., 2019), C04 (this study)].
From Figure 4, we can see clear regional differences in the spatiotemporal variations in SRs in the CYSM zone since 7 ka (Figure 4). Having calculated the mean SRs and SR variabilities for different periods, we roughly divided the CYSM zone into three subareas: a depocenter subarea; an adjacent subarea; and a distal peripheral subarea (Figure 4A). These three subareas appear to be generally consistent with mud thickness variations (Figure 3).
The depocenter subarea is located in the northwestern part of the CYSM. This subarea is characterized by thick mud deposits, and therefore high SRs. Core YS01 has the highest SR in the CYSM zone, with a mean SR of 131 cm/ka for the last 7 ka. For cores ZY1 and ZY2, the mean SR for the past 7 ka is ∼50–80 cm/ka. The most notable characteristic of the temporal changes in the SRs of Core YS01 is the two markedly high SR stages at ∼6.1–5.4 ka and ∼4–2.5 ka, alternating with three relatively low SR stages at ∼6.8–6.1 ka, ∼5.4–4 ka and ∼2.5–0 ka (Figure 4B). Cores ZY1 and ZY2 show no evidence of high SRs at ∼6.1–5.4 ka, possibly due to a lack of age constraint points at that time; however, the two cores do show relatively high SRs between 4 and −2 ka, roughly consistent with those of Core YS01 (Figure 4B).
The adjacent subarea approximately surrounds the depocenter subarea. Most of this subarea lies to the north, east and south of the depocenter subarea. Mud thicknesses in this subarea are usually between 2 and 4 m, clearly thinner than those of the depocenter subarea. The adjacent subarea includes cores ZY3, N02, A02, YSC-4, H07, YSC-1, HS1, A03, and C04 (Figure 4A). Mean SRs for this subarea are ∼30–50 cm/ka for the past 7 ka, clearly lower than in the depocenter subarea. Temporally, this subarea shows a consistent trend in all nine cores, with relatively high SRs during the mid-Holocene, followed by a gradually decreasing trend in SRs after 5 ka (Figure 4D). Reductions in SRs to the west and north are more marked than to the east and south (Figure 4D).
The distal peripheral subarea is located approximately on the eastern and southern margin of the CYSM zone. Mud thicknesses in this subarea are usually between 0.5 and 2 m, meaning that this is the thinnest subarea of the CYSM zone (Figure 3). Mean SRs for this subarea since 7 ka are <30 cm/ka (Figure 4C), clearly lower than for the other two subareas. Temporal changes in this subarea’s SRs were only identified from three cores: CC02; N04; and N05. These latter three cores lie in the northeastern part of the CYSM zone, and record consistently low, and generally stable, SRs during the last 7 ka.
Discussion
Implications for Sedimentary Provenance
The provenance of any sediment source and its evolution has a major impact on mud belt formation. Although many studies have suggested that the sedimentary provenance of CYSM might be “multi-sourced deposits”, mainly from the Yellow River, Yangtze River and, less significantly, the rivers of the Korean Peninsula (e.g., Li J. et al., 2014; Wang Y. et al., 2014; Hu et al., 2018; Koo et al., 2018), the relative contributions made by these different sources remain debatable. For example, there is no consensus on whether the Yangtze River or the Yellow River has been the main source of CYSM during the Holocene.
In this study, the general characteristics of mud thickness distributions and spatial changes in CYSM SRs (Figures 3, 4A) may support the views that the Yellow River is the principal sedimentary provenance for CYSM, explaining why mud thickness gradually decreased from the northwest toward the south and east.
Some studies have suggested that the Yangtze River maybe the dominant sedimentary source of CYSM, and that the YSWC is the main driving force behind any sedimentary transport (Gao et al., 2016a). If this were true, then any Holocene mud deposits should be thick in the south and gradually thin northwards. It is inconsistent with the mud thickness reconstruction shown in Figure 3. Maximum mud thicknesses occur in the western and northwestern parts of the CYSM zone (Figure 3), adjacent to the Shandong Peninsula’s omega-shaped (“Ω”) mud wedge, formed mainly by longshore-transported sediments from the Yellow River Delta (Yang and Liu, 2007). This may indicate that the CYSM zone bears a close relation with this Shandong Peninsula mud wedge in terms of its sedimentary provenance.
In addition, if the YSWC were indeed the main CYSM sedimentary transport mechanism, then greater quantities of finer-grained sediment would be expected to be deposited during periods experiencing a strong YSWC. YSWC intensity is closely related to the Kuroshio Current (KC) in the Okinawa Trough. KC intensity was reconstructed using the sediment mercury (Hg) enrichment factor obtained for the Okinawa Trough; this evinced a weakening intensity between 5.0 and −3.0 ka and a strengthening intensity between ∼6.2 and −5.0 ka, and over the last 3.0 ka (Lim et al., 2017). Marine micropaleontologic proxies for changes in the KC intensity also suggest an enhanced KC intensity during the late Holocene (Jian et al., 2000; Figure 5A). This may indicate a strengthened YSWC during the late Holocene. Another study from the Yellow Sea further supports the presence of a strengthened YSWC over the last 2 ka, based on the UK37 sea surface temperature (SST) proxy interpolated from Core ZY2 (Wang et al., 2011) (Figure 5B). Therefore, in tandem with enhanced YSWC intensity during the late Holocene, SR changes in cores from the CYSM zone would be expected to show higher SR values than before. However, from our reconstruction, the late Holocene appears to have been characterized by generally low SRs in the CYSM zone (Figure 5). This is not consistent with the YSWC being the major transport pathway for CYSM sediments (Wang Y. et al., 2014); the YSWC would appear to have exerted a more notable influence on nutrient transport than suspended sediment content (Wei et al., 2020).
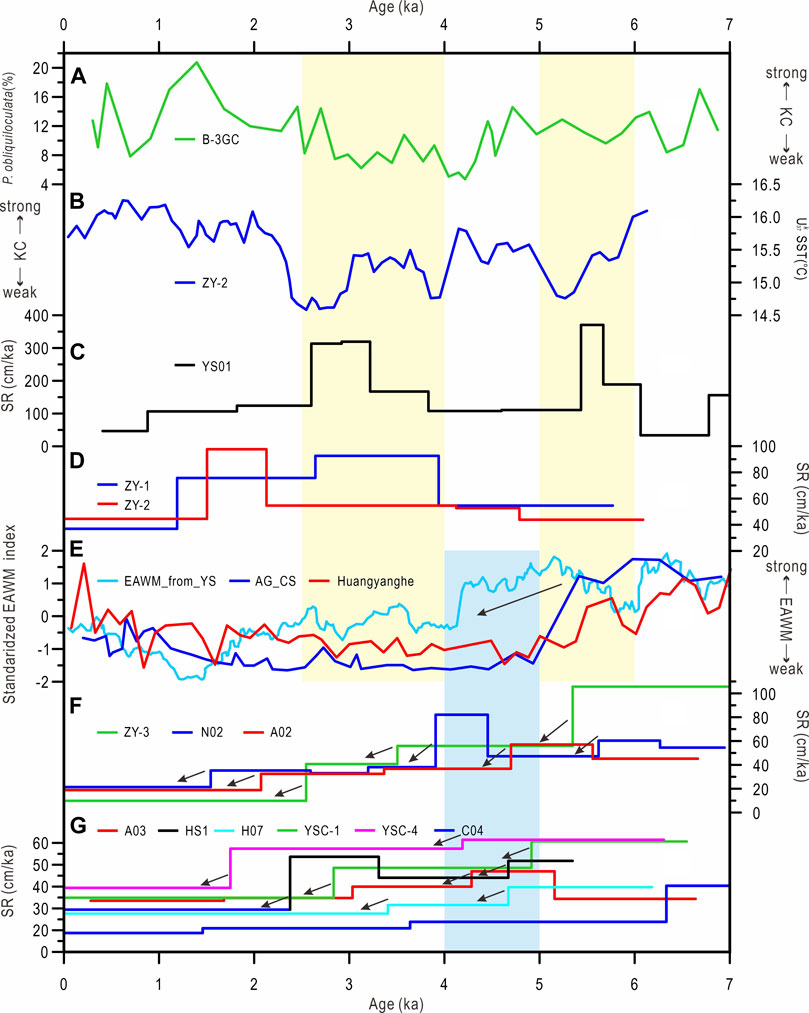
FIGURE 5. (A) Kuroshio Current (KC) intensity indicated by Pulleniatina obliquiloculata percentages in Core B-3GC from the Okinawa Trough (Jian et al., 2000); (B) Published SST record from sediment core ZY2 in the central Yellow Sea (Wang et al., 2011); (C) Sedimentary rate of Core YS01 (Wang Y. et al., 2014; Jia et al., 2019; Wang et al., 2020); (D) Sedimentary rates for cores ZY-1 and ZY-2 (Hu et al., 2012); (E) EAWM intensity inferred from the sensitive grain size loadings of cores ZY-2 and ZY-3 from the southern Yellow Sea (Hu et al., 2012), the ratio of the relative abundances of diatomaceous species Aulacoseira granulate to Cyclotella stelligera (AG/CS) (Wang L. et al., 2012), the components of the 20–159 μm fraction from the loess/paleosol sequence of the Huangyanghe Section (Li and Morrill, 2014); (F) Sedimentary rates of cores ZY-3 (Hu et al., 2012), N02 (Hao et al., 2017; Zhong et al., 2018) and A02 (Gong et al., 2017; Wu et al., 2019; this study); (G) Sedimentary rates of cores A03 (Jia et al., 2019), HS1 (Ai et al., 2020), H07 (Leng et al., 2017), C04 (this study), YSC-1 (Li J. et al., 2014) and YSC-4 (Li J. et al., 2014).
Implications for Changes in Regional Hydrologic Dynamics
The transport and deposition of sediments are principally affected by the sedimentary source and the depositional environment (Stein, 1990; Li et al., 1999). However, low-energy, weakly-dynamic environments may be caused by different hydrologic dynamics (as proposed in the introduction to this paper), such as low tidal currents (Gao et al., 1996; Dong et al., 1989; Zhu and Chang, 2000; Dong et al., 2011; Gao et al., 2016a) and oceanic current fronts (Gao et al., 2016b). The general distribution of mud thicknesses (Figure 3) and the spatiotemporal variations in SRs (Figure 4) may indicate that no single hydrologic dynamic can be wholly responsible for the formation of the CYSM zone. Different hydrologic dynamics are likely to dominate different subareas of the CYSM zone. The approximate boundaries of the reconstructed distribution of CYSM (Figure 3) appear similar to the range in weakly tidal speeds in this region (Liu et al., 2019; Figure 6), suggesting weak tidal currents have played an important role in the formation of this mud belt.
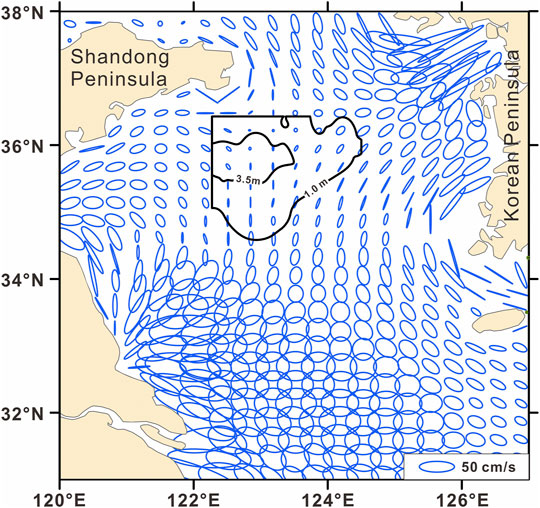
FIGURE 6. Overlap of southern Yellow Sea tidal ecliptics (Liu et al., 2019) with Holocene mud thicknesses in the CYSM zone (bold black contours).
In the depocenter subarea of the CYSM zone, especially thick mud deposits would suggest a rapid sedimentation rate, clearly different from other subareas of the CYSM zone. We would propose that this is because the depocenter subarea has largely been influenced by oceanic current front deposition. Usually, suspended particles on the continental shelf along China’s eastern coast can be characterized by a distinct macro-transport “summer deposit and winter transport” pattern i.e., suspended particles are commonly deposited on the inner shelf during the summer half-year, and transported to the outer shelf during the winter half-year (Yang et al., 1992; Guo et al., 1999). In winter, a southward YSCC and a northward YSWC in the southern Yellow Sea (Su and Yuan, 2005) causes a reverse-flow shear front, known here as the Shandong Peninsula Front (SPF), when the two current systems meet (Wang F. et al., 2012; Gao et al., 2016b) (Figure 7). Most of coarser-grained sediments, transported southward by wind-driven longshore currents, have been blocked by the “hydrodynamic barrier” i.e., the SPF, forming a “Ω”-shaped slope near the eastern coast of the Shandong Peninsula during the Holocene (Yang and Liu, 2007). From Figure 7, we can see that the depocenter subarea of the CYSM zone correlates well with the SPF, suggesting that this subarea of mud deposition has been dominated by the influence of oceanic current fronts. In the shear zone, most of these fine-grained sediments appear to have been rapidly deposited where there is a low-current zone with flow speeds <0.2 m s−1 (Gao et al., 2016b). The main driving force behind the winter shear fronts appears to be the circulation system, which may be modulated by the relative variations in the YSWC and the YSCC (Shi et al., 2019).
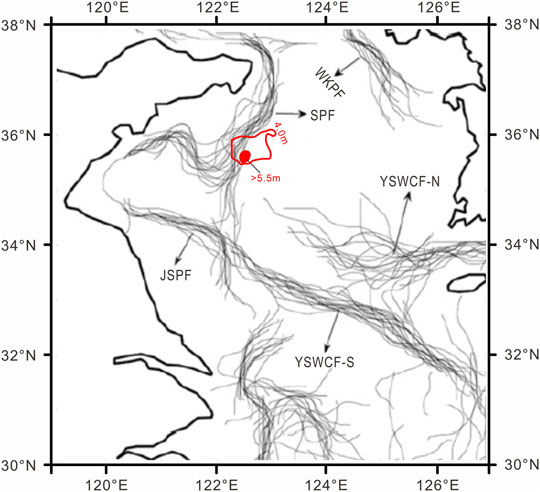
FIGURE 7. Central frontal lines in February for an 18 year period (1985–2002) (Wang F. et al., 2012), and the thickest mud patch since 7 ka (red area and contour). SPF: Shandong Peninsula Front, JSPF: Jiangsu Coastal Front, WKCF: Western Korean Coastal Front, YSWCF-N: Yellow Sea Warm Current Front-North, YSWCF-S: Yellow Sea Warm Current Front-South.
Changes in the SR in the depocenter subarea also appear to correspond with the intensity of changes in the YSWC, an important factor influencing variations in the SPF. This would further support the hypothesis that oceanic current fronts play an important role in the deposition of muds in the depocenter subarea. An extremely low SR occurred in the depocenter subarea during the ∼7-6 ka, ∼5.4-4 ka and ∼2.5-0 ka periods (Figure 5C). During these periods, the relatively high percentage of P. obliquiloculata present (Jian et al., 2000; Figure 5A) and high SSTs in the southern Yellow Sea (Wang et al., 2011; Figure 5B) would imply that the YSWC had become relatively strong. We would speculate that the relatively intense YSWC may have led to a stronger shear front, which may in turn have reduced the area of the low-current zone and decreased deposition rates in the depocenter. In comparison, a relatively less intense YSWC could have led to a weakened shear front during the ∼6-5.4 ka and ∼4-2.5 ka periods, which may have led to an increase in the area of the low-current zone and generated extremely high SRs in the depocenter.
The adjacent subarea of the CYSM zone accounts for almost half of the total area of the mud belt. SRs in this subarea are clearly lower than in the depocenter subarea, but higher than in the distal peripheral subarea. The dominant hydrologic dynamic of this subarea appears to be the existence of a weak tidal current, which would trap any sediment upon its arrival in the subarea. As a result of the cross-front transportation process and the YSCC, a large number of terrestrial fine-grained sediments would still be able to cross the hydrodynamic barrier of the SPF and successfully reach the CYSM (Zhang et al., 2016). Due to the strong trapping ability of the central weak tidal zone, SRs would be most likely controlled by the sediment source input, which in turn would be closely affected by the EAWM. Recent studies of Holocene EAWM variations have suggested a strengthened EAWM during the mid-Holocene, and a generally less intense EAWM after 5 ka (Hu et al., 2012; Li and Morrill, 2014; Wang L. et al., 2012; Tian and Jiang, 2018; Figure 5E). Over the last 7 ka, high SRs in the CYSM zone appear to correspond well with a strong EAWM during the 7-5 ka period; low CYSM SRs seem consistent with a weakened EAWM since 5 ka (Figures 5F,G). This may be because the enhanced EAWM could have resulted in an increased sediment carrying capacity of the YSCC, thereby generating high sediment flux into the southern Yellow Sea, and vice versa. Therefore, the sediment flux of the adjacent subarea of the CYSM zone may have been strongly influenced by the sediment carrying capacity of wind-driven longshore currents, which in their turn would have been chiefly governed by the EAWM. This would further support the hypothesis that the Yellow River has been the dominant source of the CYSM zone.
The distal peripheral subarea is located in the northeastern part of the CYSM zone, far from the source sediments transported by the YSCC. The dominant hydrologic dynamic of this subarea appears to be the presence of a weak tidal current, which would trap the suspended sediments remaining in the water as they continue to spread eastward and southward under the control of weak tidal currents (Dong et al., 2011; Gao et al., 2016a). Weak tidal current environment is conducive to sediment accumulation, while the low sedimentation rate in this environment should be closely related to the sediment supply. The sediments transported to this subarea would most probably be less sensitive to changes in the Holocene climate and oceanic circulations, explaining why this subarea has been characterized by a relatively stable SR since 7 ka (Figure 4C). We would speculate that the southernmost and easternmost parts of the CYSM zone also belong to this distal peripheral subarea, though this hypothesis requires further research.
Conclusion
A synthesized study of the spatiotemporal evolution of the depositional processes occurring within the CYSM zone was conducted by compiling, reorganizing and comprehensively analyzing datasets from the 64 published core archives available, and subsequently adding records from 10 new cores first used in this study. The distribution of different Holocene mud thicknesses and the spatiotemporal variations in SRs in the CYSM zone were reconstructed, based on these compiled datasets. We further discussed the possible implications for any sedimentary provenance, as well as the possible mechanisms behind the formation of this mud belt. We drew the following conclusions:
1. Holocene mud in the CYSM zone is mainly located within the 34.5–36.5°N, 122–124.5°E region. The mud is thicker in the western and northwestern parts of the CYSM zone, gradually thinning from west to east, and from north to south.
2. Temporal variations in CYSM SRs can be roughly divided into three subareas: a depocenter subarea in the northwestern part of the CYSM zone, characterized by high SRs, with two especially high SR periods at ∼6.1-5.4 ka and ∼4-2.5 ka; an adjacent subarea roughly encircling the depocenter subarea, and accounting for almost half of the total CYSM area, with a general decreasing SR from the mid-Holocene to the late Holocene; and a distal peripheral subarea in the northeastern part of the CYSM zone, characterized by low and stable SRs since 7 ka.
3. The Yellow River appears to be the chief sedimentary source, as indicated by the general distributional characteristics of mud thicknesses and temporal changes in CYSM SRs. Sediment flux to the CYSM shows a general decreasing trend after 7 ka, closely modulated by the EAWM, which in turns influenced the sediment-carrying capacity of the YSCC longshore current.
4. Different subareas of the CYSM zone were affected by different hydrologic dynamics. The sedimentary process was mainly controlled by the oceanic current front of the SPF in the depocenter subarea; the YSWC appears to be an important factor influencing SPF variability, with a strengthened YSWC leading to a strong shear front and low depositional efficiency, and vice versa. In the adjacent subarea and the distal periphery subarea, weak tidal current environment is conducive to sediment accumulation, while the low sedimentation rate in this environment should be closely related to the sediment supply. The distance from the sedimentary source has also influenced the sedimentary depositional patterns observed in the CYSM zone.
This is just a preliminary study on regional hydrologic dynamics of the CYSM depositional processes during the mid-late Holocene. Therefore, further study, such as investigation by model simulation, is needed in the future to confirm the dynamic mechanism.
Data Availability Statement
The original contributions presented in the study are included in the article/Supplementary Material, further inquiries can be directed to the corresponding author.
Author Contributions
MZ provided the materials, LZ and RX finished the chronology determination, YY and FZ finished the particle size determination, RX, LZ, FZ, and YY have participated in the discussion and writing of the manuscript together. All authors contributed to the article and approved the submitted version.
Funding
This study was jointly supported by the National Natural Science Foundation of China (Grant Nos. 41476040, 41876063, 41876056, and 41630966), the Key Special Project for Introduced Talents Team of the Southern Marine Science and Engineering Laboratory in Guangdong (Guangzhou) (Grant No. GML2019ZD0206), and the Innovative Development Fund Project of the Innovation Academy of the South China Sea Ecology and Environmental Engineering Institute, Chinese Academy of Sciences (Grant No. ISEE2018PY02).
Conflict of Interest
The authors declare that the research was conducted in the absence of any commercial or financial relationships that could be construed as a potential conflict of interest.
Acknowledgments
We should like to thank all the participants and crew members of the 2011 spring cruise undertaken by the research vessel Dongfanghong 2 for their invaluable assistance in core sampling.
Supplementary Material
The Supplementary Material for this article can be found online at: https://www.frontiersin.org/articles/10.3389/feart.2021.687344/full#supplementary-material
References
Ai, L., Han, Z., Wu, X., Saito, Y., and Wang, H. (2020). Geochemical and Grain-Sized Implications for Provenance Variations of the Central Yellow Sea Muddy Area since the Middle Holocene. J. Ocean Univ. China. 19, 577–588. doi:10.1007/s11802-020-4211-0
Alexander, C. R., Demaster, D. J., and Nittrouer, C. A. (1991). Sediment Accumulation in a Modern Epicontinental-Shelf Setting: The Yellow Sea. Mar. Geology. 98, 51–72. doi:10.1016/0025-3227(91)90035-3
Badejo, A. O., Choi, B. H., Cho, H. G., Yi, H. I., and Shin, K. H. (2014). A Paleoenvironmental Reconstruction of the Last 15 000 Cal Yr BP via Yellow Sea Sediments Using Biomarkers and Isotopic Composition of Organic Matter. Clim. Past Discuss. 10, 1527–1565. doi:10.5194/cpd-10-1527-2014
Badejo, A. O., Choi, B.-H., Cho, H.-G., Yi, H.-I., and Shin, K.-H. (2016). Environmental Change in Yellow Sea during the Last Deglaciation to the Early Holocene (15,000-8,000 BP). Quat. Int. 392, 112–124. doi:10.1016/j.quaint.2015.07.060
Chen, Z., Shi, X., Wang, X., Xin, C., Kong, F., and Yi, H. (2003). Geocheimical changes in Core B10 in the southern Huanghai Sea and implications for variations in paleoenvironment and paleoclimate. Acta Oceanol. Sin.1, 69–77.
Chough, S. K., Lee, H. J., Chun, S. S., and Shinn, Y. J. (2004). Depositional Processes of Late Quaternary Sediments in the Yellow Sea: a Review. Geosci. J. 8, 211–264. doi:10.1007/bf02910197
Dong, L. X., Guan, W. B., Chen, Q., Li, X. H., Liu, X. H., and Zeng, X. M. (2011). Sediment Transport in the Yellow Sea and East China Sea. Estuarine, Coastal Shelf Sci. 93, 248–258. doi:10.1016/j.ecss.2011.04.003
Dong, L. X., Su, J. L., and Wang, K. S. (1989). Tidal Current Field and its Relationship with Sediment Transport in the Yellow Sea and Bohai Sea. Acta Oceanologica Sinica 11, 102–114.
Folk, R. L., Andrews, P. B., and Lewis, D. W. (1970). Detrital Sedimentary Rock Classification and Nomenclature for Use in New Zealand. New Zealand J. Geology. Geophys. 13, 937–968. doi:10.1080/00288306.1970.10418211
Fu, M., Li, Z., Xu, X., and Shi, X. (2003). Sporopollen Analysis of Core B10 in the Southern Yellow Sea and the Reflected Characteristics of Climate Changes. Chin.Sci.Bull. 48, 42–48. doi:10.1007/bf02900939
Gandhi, S. M., and Sarkar, B. C. (2016). Geostatistical Resource/Reserve Estimation. Essentials Mineral. Exploration Eval., 289–308. doi:10.1016/b978-0-12-805329-4.00019-3
Gao, F., Qiao, L., and Li, G. (2016a). Modelling the Dispersal and Depositional Processes of the Suspended Sediment in the central South Yellow Sea during the winter. Geol. J. 51, 35–48. doi:10.1002/gj.2827
Gao, F., Qiao, L., and Li, G. (2016b). Winter Meso-Scale Shear Front in the Yellow Sea and its Sedimentary Effects. J. Ocean Univ. China. 15, 50–56. doi:10.1007/s11802-016-2668-7
Gao, H., Shi, J., Cheng, H., Zhang, Y., and Zhang, Y. (2021). The Impact of Long- and Short-Term Exposure to Different Ambient Air Pollutants on Cognitive Function in China. Environ. Int. 151, 106416. doi:10.1016/j.envint.2021.106416
Gao, S., Park, Y. A., Zhao, Y. Y., and Qin, Y. S. (1996). Transport and Resuspension of fine-grained Sediments over the southeastern Yellow Sea. In Proceedings of the Korea-China International Seminar on Holocene and Late Pleistocene Environments in the Yellow Sea Basin. Seoul: Seoul National University, 83–98.
Ge, S., Shi, X., Zhu, R., Liu, Y., Yin, P., and Liu, L. (2006). Magnetostratigraphy of Borehole EY02-2 in the Southern Yellow Sea and its Paleoenvironmental Significance. Sci. Bull. 51, 855–865. doi:10.1007/s11434-006-0855-4
Gong, F., Hao, T., Liu, Y., Liu, X., Zhang, D., Zhang, X., et al. (2017). Evidence for Paleoclimate Changes from Lignin Records of Sediment Core A02 in the Southern Yellow Sea since ∼ 9.5 Cal. Kyr B.P. Palaeogeogr. Palaeoclimatol. Palaeoecol. 479, 173–184. doi:10.1016/j.palaeo.2017.05.014
Guo, Z., Yang, Z., Lei, K., Qu, Y., and Fan, D. (1999). Seasonal Variation of the Sedimentary Dynamic Processes for the Mud Area in the Northern East China Sea. J. Ocean Univ. Qingdao. 29, 507–513. 10.1007/BF02837510
Han, Z., Ai, L., Chen, X., Wang, C., Liu, H., and Sun, Y. (2016). Geochemical Characteristics of Sediments and Provenance of B01 Core in Northwest Margin of South Yellow Sea Mud Area. Periodical Ocean Univ. China 46, 82–91. doi:10.16441/j.cnki.hdxb.20150250
Hao, T., Liu, X., Ogg, J., Liang, Z., Xiang, R., Zhang, X., et al. (2017). Intensified Episodes of East Asian Winter Monsoon during the Middle through Late Holocene Driven by North Atlantic Cooling Events: High-Resolution Lignin Records from the South Yellow Sea, China. Earth Planet. Sci. Lett. 479, 144–155. doi:10.1016/j.epsl.2017.09.031
Heaton, T. J., Köhler, P., Butzin, M., Bard, E., Reimer, R. W., Austin, W. E. N., et al. (2020). Marine20-The Marine Radiocarbon Age Calibration Curve (0-55,000 Cal BP). Radiocarbon. 62 (4), 779–820. doi:10.1017/rdc.2020.68
Hu, B., Li, J., Zhao, J., Yan, H., Zou, L., Bai, F., et al. (2018). Sr-Nd Isotopic Geochemistry of Holocene Sediments from the South Yellow Sea: Implications for Provenance and Monsoon Variability. Chem. Geology. 479, 102–112. doi:10.1016/j.chemgeo.2017.12.033
Hu, B., Yang, Z., Zhao, M., Saito, Y., Fan, D., and Wang, L. (2012). Grain Size Records Reveal Variability of the East Asian Winter Monsoon since the Middle Holocene in the Central Yellow Sea Mud Area, China. Sci. China Earth Sci. 55, 1656–1668. doi:10.1007/s11430-012-4447-7
Hu, D. (1984). Upwelling and Sedimentation Dynamics. Chin. J. Oceanology Limnology. 2, 12–19. doi:10.1007/BF02888388
Hu, D. (1994). “Some Striking Features of Circulation in Huanghai Sea and East China Sea,” in Oceanology of China Scas. Editors D. Zhou, Y. B. Liang, and C. K. Zeng (Dordrecht: Kluwer Academic Publishers), 27–38.
Hurtado, S. I., Zaninelli, P. G., Agosta, E. A., and Ricetti, L. (2021). Infilling Methods for Monthly Precipitation Records with Poor Station Network Density in Subtropical Argentina. Atmos. Res. 254, 105482. doi:10.1016/j.atmosres.2021.105482
Hwang, J. H., Van, S. P., Choi, B.-J., Chang, Y. S., and Kim, Y. H. (2014). The Physical Processes in the Yellow Sea. Ocean Coastal Management 102, 449–457. doi:10.1016/j.ocecoaman.2014.03.026
Jia, Y., Li, D.-W., Yu, M., Zhao, X., Xiang, R., Li, G., et al. (2019). High- and Low-Latitude Forcing on the South Yellow Sea Surface Water Temperature Variations during the Holocene. Glob. Planet. Change. 182, 103025. doi:10.1016/j.gloplacha.2019.103025
Jian, Z., Wang, P., Saito, Y., Wang, J., Pflaumann, U., Oba, T., et al. (2000). Holocene Variability of the Kuroshio Current in the Okinawa Trough, Northwestern Pacific Ocean. Earth Planet. Sci. Lett. 184, 305–319. doi:10.1016/s0012-821x(00)00321-6
Jiang, F., Zhou, X., Li, A., and Li, T. (2009). Quantitatively Distinguishing Sediments from the Yangtze River and the Yellow River Using δ EuN-ΣREEs Plot. Sci. China Ser. D-earth Sci. 52, 232–241. doi:10.1007/s11430-009-0018-y
Kim, D., Park, B. K., and Shin, I. C. (1999). Paleoenvironmental Changes of the Yellow Sea during the Late Quaternary. Geo-Marine Lett. 18, 189–194. doi:10.1007/s003670050067
Kim, J.-M., and Kennett, J. P. (1998). Paleoenvironmental Changes Associated with the Holocene marine Transgression, Yellow Sea (Hwanghae). Mar. Micropaleontology 34, 71–89. doi:10.1016/s0377-8398(98)00004-8
Kim, J.-M., and Kucera, M. (2000). Benthic Foraminifer Record of Environmental Changes in the Yellow Sea (Hwanghae) during the Last 15,000 Years. Quat. Sci. Rev. 19, 1067–1085. doi:10.1016/s0277-3791(99)00086-4
Kong, G. S., and Lee, C. W. (2005). Marine Reservoir Corrections (ΔR) for Southern Coastal Waters of Korea. J. Korean Soc. Oceanography 10, 124–128.
Koo, H., Lee, Y., Kim, S., and Cho, H. (2018). Clay mineral Distribution and Provenance in Surface Sediments of Central Yellow Sea Mud. Geosci. J. 22, 989–1000. doi:10.1007/s12303-018-0019-y
Lan, X., and Shen, S. (2000). Geochemical Characteristics of Sediment Cores from the Central South Yellow Sea. Mar. Geology. Quat. Geology. 20, 33–38. doi:10.16562/j.cnki.0256-1492.2000.02.006
Lan, X., and Shen, S. (2002). Geochemical Characteristics of Rare Earth Elements of Sediment Cores from the Central South Yellow Sea. Mar. Sci. Bull. 21, 46–53.
Lan, X., Zhang, X., Zhao, G., and Zhang, Z. (2009). Distributions of Rare Earth Elements in Sediments from Core NT1 of the South Yellow Sea and Their Provenance Discrimination. Geochimica. 38, 123–132. doi:10.19700/j.0379-1726.2009.02.003
Leng, C., Yuan, H., Xu, C., Hao, Y., and Zhao, G. (2017). Applications of Logarithm Ratio Transformation to Extraction of the Sensitive Grain Size of East Asian Winter Monsoon by the Method of Factor Analysis: A Case Study of Core H07 from the Central Mud Area of the South Yellow Sea. Mar. Geology. Quat. Geology. 37, 151–160.
Lesueur, P., and Tastet, J. P. (1994). Facies, Internal Structures and Sequences of Modern Gironde-Derived Muds on the Aquitaine Inner Shelf, France. Mar. Geology. 120, 267–290. doi:10.1016/0025-3227(94)90062-0
Lesueur, P., Tastet, J. P., and Marambat, L. (1996). Shelf Mud fields Formation within Historical Times: Examples from Offshore the Gironde Estuary, France. Continental Shelf Res. 16, 1849–1870. doi:10.1016/0278-4343(96)00013-1
Li, A. C., Chen, L. R., and Shen, S. X. (1991). Sulfur Isotopic Study of the Authigenic Pyrite in the Downcore H-106 of the Southern Yellow Sea. Chin. Sci. Bull., 928–930. doi:10.1360/csb1991-36-12-928
Li, G. X. (2005). A Study on the Genesis of the Submarine Sedimentary Environment in the East China Sea Area. Beijing: Science Press.
Li, G., Li, P., Liu, Y., Qiao, L., Ma, Y., Xu, J., et al. (2014). Sedimentary System Response to the Global Sea Level Change in the East China Seas since the Last Glacial Maximum. Earth-Science Rev. 139, 390–405. doi:10.1016/j.earscirev.2014.09.007
Li, J., Hu, B., Wei, H., Zhao, J., Zou, L., Bai, F., et al. (2014). Provenance Variations in the Holocene Deposits from the Southern Yellow Sea: Clay Mineralogy Evidence. Continental Shelf Res. 90, 41–51. doi:10.1016/j.csr.2014.05.001
Li, P., Wang, Y. J., and Liu, Z. X. (1999). Chronostratigraphy and Sedimentation Rate of Okinawa Trough. Sci. China Ser. D: Earth Sci. 29, 50–55.
Li, Y., and Morrill, C. (2014). A Holocene East Asian winter Monsoon Record at the Southern Edge of the Gobi Desert and its Comparison with a Transient Simulation. Clim. Dyn. 45, 1219–1234. doi:10.1007/s00382-014-2372-5
Lie, H. J., Oh, K. H., Cho, C. H., and Moon, J. H. (2019). Wintertime Large Temperature Inversions in the Yellow Sea Associated with the Cheju and Yellow Sea Warm Currents. J. Geophys. Res. Oceans. 124, 4856–4874. doi:10.1029/2019jc015180
Lim, D., Kim, J., Xu, Z., Jeong, K., and Jung, H. (2017). New Evidence for Kuroshio Inflow and deepwater Circulation in the Okinawa Trough, East China Sea: Sedimentary Mercury Variations over the Last 20 Kyr. Paleoceanography. 32, 571–579. doi:10.1002/2017pa003116
Lim, D., Xu, Z., Choi, J., Li, T., and Kim, S. (2015). Holocene Changes in Detrital Sediment Supply to the Eastern Part of the central Yellow Sea and Their Forcing Mechanisms. J. Asian Earth Sci. 105, 18–31. doi:10.1016/j.jseaes.2015.03.032
Lin, X., Yang, J., Guo, J., Zhang, Z., Yin, Y., Song, X., et al. (2011). An Asymmetric Upwind Flow, Yellow Sea Warm Current: 1. New Observations in the Western Yellow Sea. J. Geophys. Res. 116. doi:10.1029/2010jc006513
Liu, J., Liu, Q., Zhang, X., Liu, J., Wu, Z., Mei, X., et al. (2016). Magnetostratigraphy of a Long Quaternary Sediment Core in the South Yellow Sea. Quat. Sci. Rev. 144, 1–15. doi:10.1016/j.quascirev.2016.05.025
Liu, J., Wang, H., Li, S., and Jin, X. (2004). Postglacial Transgressive Sedimentary Records of Muddy Sedimentary Areas in the North of the South Yellow Sea. Mar. Geology. Quat. Geology. 24, 1–10. doi:10.16562/j.cnki.0256-1492.2004.03.001
Liu, K., Sun, J., Guo, C., Yang, Y., Yu, W., and Wei, Z. (2019). Seasonal and Spatial Variations of the M 2 Internal Tide in the Yellow Sea. J. Geophys. Res. Oceans. 124, 1115–1138. doi:10.1029/2018jc014819
Liu, M., Wu, S., and Wang, Y. (1987). Late Quaternary Sediments in the Yellow Sea. Beijing: Ocean Press
Lorkowski, P. (2021). “Spatio-Temporal Interpolation: Kriging,” in Monitoring Continuous Phenomena: Background, Methods and Solutions. Editor P. Lorkowski (New York: CRC Press), 37–50. doi:10.1201/9780429440960-3
Mackenzie, D. I., Nichols, J. D., Royle, J. A., Pollock, K. H., Bailey, L. L., and Hines, J. E. (2018). Extensions to Basic Approaches. Occupancy Estimation Model., 243–311. doi:10.1016/b978-0-12-407197-1.00008-9
Meng, G., Han, Y., and Wang, S. (1998). Paleoclimate Events and Environment Evolution of the Shelf Area in the South Yellow Sea during the Past 15ka. Oceanologia et limnologia sinica 29, 297–305.
Meng, J. (2021). Raster Data Projection Transformation Based-On Kriging Interpolation Approximate Grid Algorithm. Alexandria Eng. J. 60 (2), 2013–2019. doi:10.1016/j.aej.2020.12.006
Pi, Z., Li, T., and Nan, Q. (2016). Environmental Changes since Mid Holocene Revealed by Core Z1 in the South Yellow Sea and Their Response to East Asian Monsoon. Mar. Geology. Front. 32, 1–10. doi:10.16028/j.1009-2722.2016.07001
Shen, S. X., Li, A. C., and Wei, Y. (1996). Low Energy Environment of the central South Yellow Sea. Oceanologia Et Limnologia Sinica. 27, 518–523.
Shepard, F. P. (1954). Nomenclature Based on sand-silt-clay Ratios. J. Sediment. Res. 24, 151–158. doi:10.1306/d426971a-2b26-11d7-8648000102c1865d
Shi, X., Chen, C. F., Liu, Y. G., Ren, H., and Wang, H. Y. (2002). Trend Analysis of Sediment Grain Size and Sedimentary Pro- Cess in the central South Yellow Sea. Chin. Sci Bull. 47, 1202–1207. doi:10.1360/02tb9269
Shi, X., Liu, Y., Chen, Z., Wei, J., Ge, S., Wang, K., et al. (2012). “Origin, Transport Processes and Distribution Pattern of Modern Sediments in the Yellow Sea,” in Sediments, Morphology and Sedimentary Processes on Continental Shelves: Advances in Technologies, Research, and Applications. Editors M. Z. Li, C. R. Sherwood, and P. R. Hill (Chichester: John Wiley and Sons, Ltd), 29
Shi, X., Shen, S., Yi, H.-i., Chen, Z., and Meng, Y. (2003a). Modern Sedimentary Environments and Dynamic Depositional Systems in the Southern Yellow Sea. Chin.Sci.Bull. 48, 1–7. doi:10.1007/bf02900933
Shi, X., Shen, S., Yi, H.-i., Chen, Z., and Meng, Y. (2003b). Modern Sedimentary Environments and Dynamic Depositional Systems in the Southern Yellow Sea. Chin.Sci.Bull. 48, 1–7. doi:10.1007/bf02900933
Shi, Y., Gao, J. H., Sheng, H., Du, J., Jia, J. J., Wang, Y. P., et al. (2019). Cross‐Front Sediment Transport Induced by Quick Oscillation of the Yellow Sea Warm Current: Evidence from the Sedimentary Record. Geophys. Res. Lett. 46, 226–234. doi:10.1029/2018gl080751
Shinn, Y. J., Chough, S. K., Kim, J. W., Lee, S. H., Woo, J., Jin, J. H., et al. (2004). High‐Resolution Seismic Reflection Studies of Late Quaternary Sediments in the Eastern Yellow Sea. in Continent‐Ocean Interactions within East Asian Marginal Seas, AGU. 10.1029/149GM10
Southon, J., Kashgarian, M., Fontugne, M., Metivier, B., and W-S Yim, W. (2002). Marine Reservoir Corrections for the Indian Ocean and Southeast Asia. Radiocarbon. 44, 167–180. doi:10.1017/s0033822200064778
Stein, R. (1990). Organic Carbon Content/sedimentation Rate Relationship and its Paleoenvironmental Significance for marine Sediments. Geo-Marine Lett. 10, 37–44. doi:10.1007/bf02431020
Stuiver, M., Reimer, P. J., and Reimer, R. W. (2021). CALIB 8.2 [WWW program]. Available at: http://calib.org (Accessed April 24, 2021).
Su, Y. S., and Weng, X. C. (1994). “Water Masses in China Seas,” in Oceanology of China Seas. Editors D. Zhou, Y. B. Liang, and C. K. Zeng (Dordrecht: Springer), 3–16.
Tak, Y. J., Cho, Y. K., Seo, G. H., and Choi, B. J. (2016). Evolution of Wind‐driven Flows in the Y Ellow S Ea during winter. J. Geophys. Res. Oceans. 121, 1970–1983. doi:10.1002/2016jc011622
Tian, Z., and Jiang, D. (2018). Strengthening of the East Asian winter Monsoon during the Mid-holocene. The Holocene. 28 (9), 1443–1451. doi:10.1177/0959683618777076
Walsh, J. P., and Nittrouer, C. A. (2009). Understanding fine-grained River-Sediment Dispersal on continental Margins. Mar. Geology. 263, 34–45. doi:10.1016/j.margeo.2009.03.016
Wang, H., Li, G., Zhang, Y., Liu, Y., Liu, D., Ding, D., et al. (2020). Evolution of Palaeoenvironment of the South Yellow Sea Since the Last Deglaciation. J. Ocean Univ. China 4, 827–836. doi:10.1007/s11802-020-4213-y
Wang, K., Wang, Y., Xu, J., Zhang, Y., and Jiang, H. (1987). Comprehensive and Systematic Spores, Pollen and Algae Research in the Yellow Sea. Beijing: Ocean Press
Wang, F., Liu, C., and Meng, Q. (2012). Effect of the Yellow Sea Warm Current Fronts on the Westward Shift of the Yellow Sea Warm Tongue in winter. Continental Shelf Res. 45, 98–107. doi:10.1016/j.csr.2012.06.005
Wang, L., Li, J., Lu, H., Gu, Z., Rioual, P., Hao, Q., et al. (2012). The East Asian winter Monsoon over the Last 15,000 Years: its Links to High-Latitudes and Tropical Climate Systems and Complex Correlation to the Summer Monsoon. Quat. Sci. Rev. 32, 131–142. doi:10.1016/j.quascirev.2011.11.003
Wang, F. F., Liu, J., Qiu, J. D., Liu, X. G., and Mei, X. (2014). Thickness Variation and Provenance of Mid-holocene Mud Sediments in the Central and Western South Yellow Sea. Mar. Geology. Quat. Geology. 34, 1–11.
Wang, Y., Li, G., Zhang, W., and Dong, P. (2014). Sedimentary Environment and Formation Mechanism of the Mud deposit in the central South Yellow Sea during the Past 40kyr. Mar. Geology. 347, 123–135. doi:10.1016/j.margeo.2013.11.008
Wang, L. (2014). Sediment Record of Paleoenvironment of the central Mud of the South Yellow Sea and its Response to the East Asian Monsoon during the Holocene. Doctor: Ocean University of China
Wang, L., Yang, Z., Zhang, R., Fan, D., Zhao, M., and Hu, B. (2011). Sea Surface Temperature Records of Core ZY2 from the central Mud Area in the South Yellow Sea during Last 6200 Years and Related Effect of the Yellow Sea Warm Current. Chin. Sci. Bull. 56, 1588–1595. doi:10.1007/s11434-011-4442-y
Wang, Z. B., He, Q. X., Yang, S. Y., Lan, X. H., and Zhang, Z. X. (2008). Comparison and Application of Shepard' S and Folk's Classifications to the Subsurface Mapping in the South Yellow Sea. Mar. Geology. Quat. Geology. 28, 1–8. doi:10.16562/j.cnki.0256-1492.2008.01.003
Wei, Q., Wang, B., Fu, M., Sun, J., Yao, Q., Xin, M., et al. (2020). Spatiotemporal Variability of Physical-Biogeochemical Processes and Intrinsic Correlations in the Semi-enclosed South Yellow Sea. Acta Oceanol. Sin. 39 (10), 11–26. doi:10.1007/s13131-020-1656-3
Wu, P., Xiao, X., Tao, S., Yang, Z., Zhang, H., Li, L., et al. (2016). Biomarker Evidence for Changes in Terrestrial Organic Matter Input into the Yellow Sea Mud Area during the Holocene. Sci. China Earth Sci. 59, 1216–1224. doi:10.1007/s11430-016-5283-y
Wu, X., Xing, L., Jiang, Y., Zhang, X., Xiang, R., and Zhou, L. (2019). High-resolution Reconstruction of Sedimentary Organic Matter Variability during the Holocene in the Mud Area of the Yellow Sea Using Multiple Organic Geochemical Proxies. Quat. Int. 503, 178–188. doi:10.1016/j.quaint.2018.10.012
Xiang, R., Yang, Z., Saito, Y., Fan, D., Chen, M., Guo, Z., et al. (2008). Paleoenvironmental Changes during the Last 8400 Years in the Southern Yellow Sea: Benthic Foraminiferal and Stable Isotopic Evidence. Mar. Micropaleontology. 67, 104–119. doi:10.1016/j.marmicro.2007.11.002
Yang, J., Li, G., Liu, Y., Dada, O. A., Zhao, M., Ma, Y., et al. (2018). Evolution of Sedimentary Mode since Pleistocene in the central South Yellow Sea, China, Based on Seismic Stratigraphy Analysis. Quat. Int. 482, 157–170. doi:10.1016/j.quaint.2018.03.018
Yang, S., and Youn, J.-S. (2007). Geochemical Compositions and Provenance Discrimination of the central South Yellow Sea Sediments. Mar. Geology. 243, 229–241. doi:10.1016/j.margeo.2007.05.001
Yang, Z. (1993). A Research on Quaternary Orbital Events and Nonorbital Events in the South Yellow Sea. Mar. Geology. Quat. Geology. 13 (3), 25–34.
Yang, Z. S., Guo, Z. G., Wang, Z. X., Xu, J. P., and Gao, W. B. (1992). The Macro Pattern of Suspended Particulate Matter Transport to the Eastern Open Ocean on the Yellow and East China Sea Shelf. Acta Oceanologica Sinica. 14, 81–90.
Yang, Z. S., and Liu, J. P. (2007). A Unique Yellow River-Derived Distal Subaqueous delta in the Yellow Sea. Mar. Geology. 240, 169–176. doi:10.1016/j.margeo.2007.02.008
Zhang, X., Ji, Y., Yang, Z., Wang, Z., Liu, D., and Jia, P. (2016). End Member Inversion of Surface Sediment Grain Size in the South Yellow Sea and its Implications for Dynamic Sedimentary Environments. Sci. China Earth Sci. 59, 258–267. doi:10.1007/s11430-015-5165-8
Zheng, G. (1989). The Stratigraphic Correlation of the Quaternary Stratotype in the South Yellow Sea. Beijing: Science Press. Beijing: Ocean Press.
Zhong, F., Xiang, R., Yang, Y., and Zhao, M. (2018). Evolution of the Southern Yellow Sea Cold Water Mass during the Last 7 Kyr from Benthic Foraminiferal Evidence. Sci. China Earth Sci. 61, 1406–1418. doi:10.1007/s11430-017-9193-6
Zhou, C., Dong, P., and Li, G. (2015). Hydrodynamic Processes and Their Impacts on the Mud deposit in the Southern Yellow Sea. Mar. Geology. 360, 1–16. doi:10.1016/j.margeo.2014.11.012
Keywords: sedimentation rate, spatiotemporal evolution, Holocene, mud thickness, central yellow sea mud
Citation: Zhong F, Xiang R, Zhang L, Yang Y, Zhao M and Zhou L (2021) A Synthesized Study of the Spatiotemporal Evolution of Central Yellow Sea Mud Depositional Processes During the Holocene. Front. Earth Sci. 9:687344. doi: 10.3389/feart.2021.687344
Received: 29 March 2021; Accepted: 14 May 2021;
Published: 28 May 2021.
Edited by:
David K. Wright, University of Oslo, NorwayReviewed by:
Zhiping Tian, Institute of Atmospheric Physics (CAS), ChinaYu LI, Lanzhou University, China
Anchun Li, Institute of Oceanology, Chinese Academy of Sciences (CAS), China
Copyright © 2021 Zhong, Xiang, Zhang, Yang, Zhao and Zhou. This is an open-access article distributed under the terms of the Creative Commons Attribution License (CC BY). The use, distribution or reproduction in other forums is permitted, provided the original author(s) and the copyright owner(s) are credited and that the original publication in this journal is cited, in accordance with accepted academic practice. No use, distribution or reproduction is permitted which does not comply with these terms.
*Correspondence: Rong Xiang, cnhpYW5nQHNjc2lvLmFjLmNu; Lanlan Zhang, bGFubGFuemhhbmdAc2NzaW8uYWMuY24=