 Natalya Zeinalova
 Alik Ismail-Zadeh
 Oleg Melnik
 Igor Tsepelev
 Vyacheslav Zobin
- 1Karlsruhe Institute of Technology, Institute of Applied Geosciences, Karlsruhe, Germany
- 2Institute of Earthquake Prediction Theory and Mathematical Geophysics, Russian Academy of Sciences, Moscow, Russia
- 3Lomonosov Moscow State University, Institute of Mechanics, Moscow, Russia
- 4N.N. Krasovskii Institute of Mathematics and Mechanics, Ural Branch of the Russian Academy of Sciences, Yekaterinburg, Russia
- 5Centro Universitario de Estudios Vulcanológicos, Universidad de Colima, Colima, Mexico
Magma extrusion, lava dome growth, collapse of domes, and associated pyroclastic flow hazards are among important volcanological studies. In this paper, we analyze the influence of the magma viscosity and discharge rates on the lava dome morphology at Volcán de Colima in Mexico during a long dome-building episode lasting from early 2007 to fall 2009 without explosive dome destruction. Camera images of the lava dome growth together with recorded volumes of the erupted lava have been used to constrain numerical modeling and hence to match the history of the dome growth by nudging model forecasts to observations. Our viscosity model incorporates crystal growth kinetics and depends on the characteristic time of crystal content growth (or CCGT) and the crystal-free magma viscosity. Initially, we analyze how this viscosity, CCGT, and the rate of lava extrusion influence the morphology of the growing dome. Several model scenarios of lava dome growth are then considered depending on the crater geometry, the conduit location, the effective viscosity of dome carapace, and the extrusion rates. These rates are determined either empirically by optimizing the fit between the morphological shape of modeled domes and that of the observed dome or from the recorded lava dome volumes. The maximum height of the modeled lava dome and its horizontal extent are in a good agreement with observations in the case of the empirically-derived extrusion rates. It is shown that the topography of the crater at Volcán de Colima is likely to be inclined toward the west. The viscosity of the modeled lava dome (∼1012 Pa s) is in a good agreement with the effective viscosity estimated experimentally from lavas of Volcán de Colima. Due to the interplay between the lava extrusion and the gravity forces, the dome reaches a height threshold, and after that a horizontal gravity spreading starts to play an essential role in the lava dome evolution. The model forecasts that the dome carapace of higher viscosity (∼1014 Pa s) influences the dome growth and its morphology during long dome-building episodes by retarding horizontal advancement and developing steep-sided eastern edge of the dome at the volcano. The developed model can be used in assessments of future effusive eruptions and lava dome growth at Volcán de Colima or elsewhere. History matching modeling of lava dome growth sheds a light on dynamic processes inside the dome and may assist in assessing stress state in the dome carapace and in forecasting the dome failures.
Introduction
Lava domes grow by the extrusion of viscous magma from a volcanic conduit (e.g., Calder et al., 2015). The lavas of dome-building volcanoes have low average eruption rates and high viscosities that are commonly associated with high groundmass crystallinity and, consequently, substantial yield strength (Lavallée et al., 2008; Lavallée et al., 2008; Sheldrake et al., 2016). Nonlinear dynamics of lava dome growth is caused by crystallization and outgassing of the highly viscous lava in the volcanic conduit (Melnik and Sparks, 1999). Through the intermittent buildup of gas pressure, growing domes can often experience episodes of explosive activity (e.g., Voight and Elsworth, 2000; Heap et al., 2019).
The morphology of lava domes is controlled by the magma rheology, the crater topography, the ascent dynamics, and the mechanism of dome growth (e.g., Fink and Griffiths, 1998; Tsepelev et al., 2020). Domes may reach heights of several hundred meters, and they may grow rapidly for some days or slowly and steadily for months to years. Dome growth in the crater may alternate between endogenous to exogenous styles. Endogenous growth refers to the enlargement of a lava dome due to expansion caused by intrusion of new magma. Exogenous growth refers to dome enlargement as a result of magma forcing its way through a preexisting lava dome carapace to the surface or flowing directly from the vent and forming discrete lobes of lava that pile on top of, or adjacent to, each other (Calder et al., 2002; Watts et al., 2002; Harris et al., 2003; Simmons et al., 2005; Calder et al., 2015; Rhodes et al., 2018; Harnett et al., 2019).
Numerical models of lava dome growth clarify how the rheological properties of magma within a lava dome influence morphological features of the dome and what are the effects of crystal content, temperature, pressure, and the discharge rate on the morphology (Hale and Wadge, 2003; Husain et al., 2014; Harnett et al., 2018; Tsepelev et al., 2020). Numerical modeling of lava dome growth allows reconstructing the process of filling of the crater with magma and estimating the lava viscosity, the characteristic time of crystal content growth, and the extrusion rate (Tsepelev et al., 2020; Starodubtseva et al., 2021). This modeling requires information about the dynamics of lava dome growth collected during monitoring of the eruption. Here, we present a quantitative modeling study of the 2007-2009 endogenous stage of lava dome growth at Volcán de Colima, México, based on data collected by the University of Colima during the monitoring of the dome growth process. The goal of this study is to understand how the viscosity of magma/lava, the lava discharge rate, the conduit location, and the topography of the crater influence the dome morphology at Volcán de Colima. Compared to other numerical models of dome growth at this volcano, which are characterized by a rapid dome building (e.g., Walter et al., 2019), this modeling study deals with a slow dome-building process without explosive dome destruction.
Volcán De Colima and its Lava Dome Growth During 2007-2011
The andesitic 3860-m-high stratovolcano Volcán de Colima is the most active volcano in Mexico (Luhr and Carmichael, 1990). It is located in the western part of the Trans-Mexican Volcanic Belt (Figure 1A), and together with the Pleistocene volcano Nevado de Colima, they form the Colima Volcanic Complex. The recent dome-building eruption at Volcán de Colima began in November 1998 and was preceded by five swarms of volcano-tectonic earthquakes recorded from November 1997. The earthquake swarms indicated the pathway used by juvenile magma to ascend into the shallow magma storage zone, which is located at depths between 4 and 12 km beneath the crater (Zobin et al., 2002). This batch of magma fed seven lava dome-building episodes occurring during the 1998-2017 eruptions. The duration of the growth of lava domes varied from 14 days (rapid growth) to 33 months (slow growth) (Zobin and Tellez, 2019). In this paper we present the results of the numerical study of the long lava dome-building episode during 2007–2009, which is characterized by an uninterrupted dome extrusion. This removes complications associated with lava dome destruction by explosions or collapses, which are difficult to incorporate in a single mathematical/numerical model, and permits to analyze a dome extrusion evolving over several years.
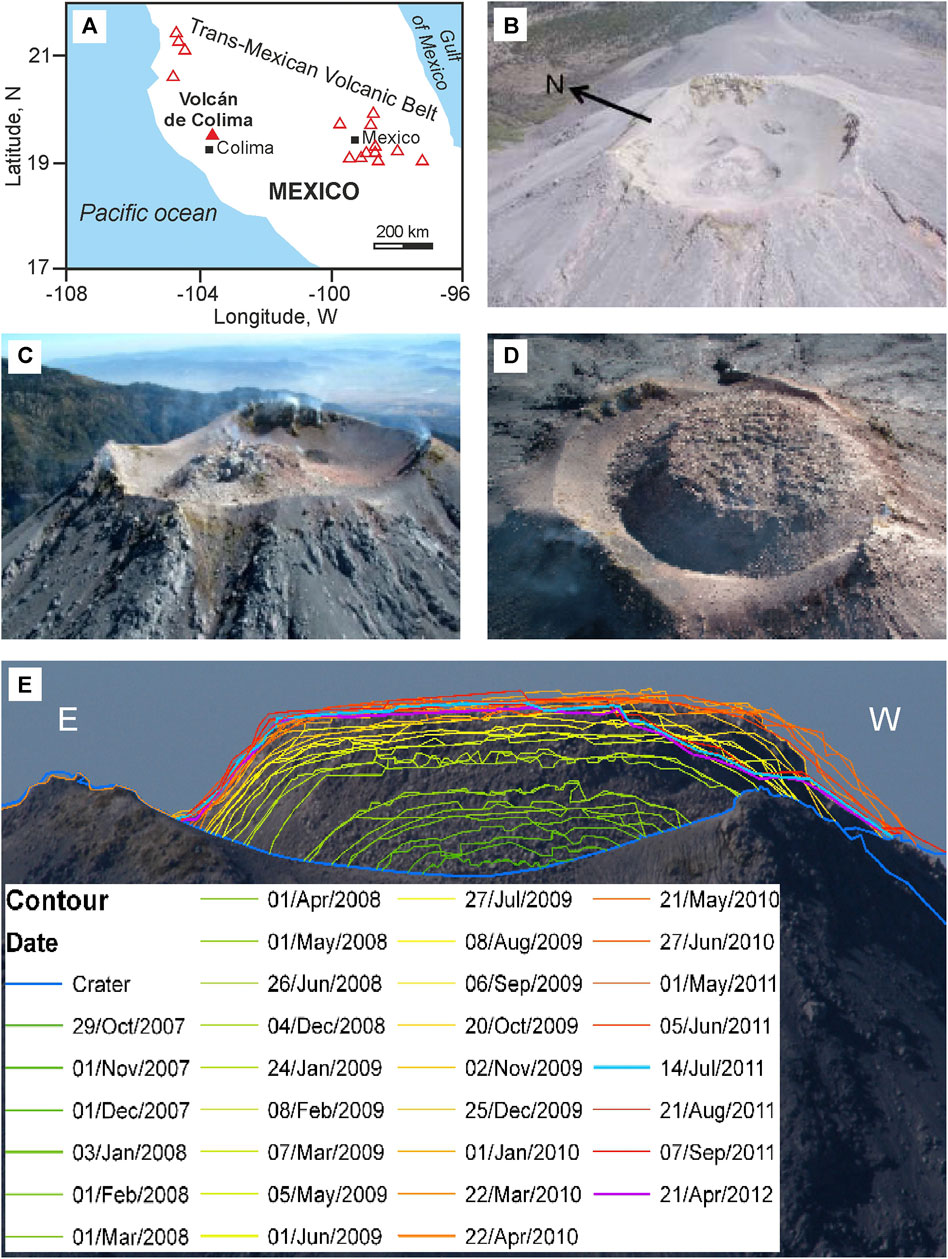
FIGURE 1. Lava dome growth at Volcán de Colima during 2007–2011. (A) Position of Volcán de Colima within the Trans-Mexican Volcanic Belt. Active volcanoes are shown with triangles; cities are shown with squares. (B–D) Photos of the growing lava dome at Volcán de Colima taken looking toward the northeast on (B) February 1, 2007, (C) March 8, 2008 and (D) November 25, 2009 (courtesy: Jalisco Civil Protection). (E) The contours of growing lava dome along the E-W profile of the crater of Volcán de Colima for 2007 to 2012 (after Bretón-González et al., 2013, with permission of Nova Science Publishers).
The photos in Figures 1B–D illustrate the lava dome growth within the crater during 2007–2009. The appearance of a new lava dome was observed at the beginning of February 2007 (Figure 1B; Zobin et al., 2017). As shown in Figure 1D, the crater was filled by a lava dome by the end of November 2009. In February 2010, the initially endogenous process of the dome growth was accompanied by exogenous growth of a small lobe of lava within the western sector of the crater of the volcano. The simultaneous endogenous and exogenous growth of the dome continued until June 2011 (Zobin et al., 2017). Video monitoring of lava dome growth during 2007–2011, as well as photos taken with a camera located at a distance of about 5,700 m from the center of the lava dome (Bretón-González et al., 2013), allowed for outlining the morphology of the growing dome in detail (Figure 1E).
Dome growth was monitored by photogrammetry tools (aerial photos) and by the related seismic recording (Zobin et al., 2017). Visual inspection of aerial photos was used to calculate the volume of the lava dome (Figure 2A), and the average discharge rates were then estimated (Figure 2B). The average discharge rate until the beginning of 2009 was about 0.02 m3 s−1. By March 2009, lava dome volume reached about 1,400,000 m3, filling roughly 80% of the total crater. In fall 2009, the dome reached the western rim of the crater as shown in Figure 1D (Zobin et al., 2017).
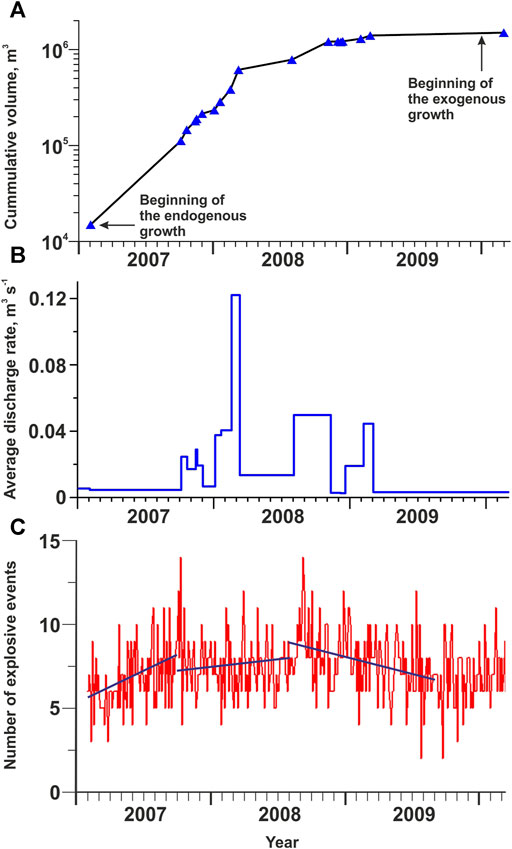
FIGURE 2. The cumulative volume of the growing lava dome (A), average discharge rate (B), and the number of explosive events (C), where the maximum likelihood regression lines (blue) present variations in the number of explosions. Source data: Zobin et al. (2015; 2017).
Figure 2C shows the temporal variations in the number of seismic signals generated by small gas-and-ash explosions (Zobin et al., 2015). Appearance of explosive events may serve as an indicator of magma degassing during the lava dome growth. Three periods of the degassing process can be distinguished. During February-September 2007, the number of explosions sharply increased demonstrating the activation of degassing at the initial stage of the lava dome growth. Then, during the ongoing stage of endogenous growth of the dome between October 2007 and January 2009, the level of degassing stayed at rather high level. Later the level of degassing continuously decreased up to the end of the lava dome growth in June 2011 (Zobin et al., 2017). The maximum likelihood regression lines shown in Figure 2C illustrate the tendency in the variation of the number of explosions during three periods of lava dome growth.
Statement of the Problem and Model Setup
Geometry
A two-dimensional model geometry presented in Figure 3A approximates the observed geometry of the crater rim of Volcán de Colima across the E-W profile (Figure 1E) with an assumption that the lava dome base is located 20 m below the central part of the visible crater’s rim (Bretón-González et al., 2013). Although the crater geometry varies in numerical experiments, the following parameters of the model domain remain the same: the width of the crater is 257 m, the width and the depth of the conduit are 14.5 and 30 m, respectively (Zobin et al., 2015). In model domain
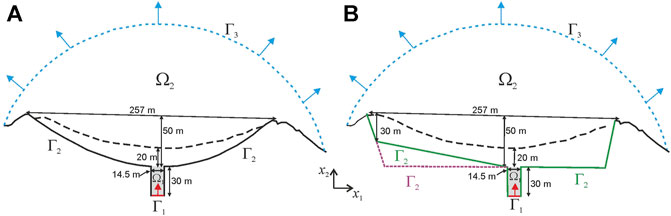
FIGURE 3. (A) The sketch of the model domain
Governing Equations With the Initial and Boundary Conditions
A lava dome growth is described mathematically by the Navier-Stokes equations (Eq. 1) with the initial condition u(t = 0, x) = u0, the continuity equation (Eq. 2), and the advection equation (Eq. 3) for the interface between the air and the lava:
where
At the initial time, the sub-domain
The following conditions are imposed on the model boundary
Lava Viscosity
Degassing-induced (i.e., temperature independent) crystallization is the main driving force in the bulk viscosity increase in conduits and lava domes compared to the cooling-induced viscosity increases of the melt and crystallization (e.g., Chevrel et al., 2013; Tsepelev et al., 2020). Meanwhile, a cooling-induced increase in the viscosity of the dome carapace becomes important during long episodes of lava dome growth. Hence, although the lava dome rheology is more complex, we assume here that the lava viscosity
where
The volume fraction of crystals
with the initial condition for the volume fraction of crystals
Methods
We consider the problem of lava dome viscosity determination from observations of the dome morphology (e.g., the observed height and horizontal extent of the dome). The relevant mathematical problem belongs to the class of inverse problems. There are several methods to solve the problem, that is, to determine the distribution of lava dome viscosity from relevant observations. One of the methods is based on optimization using data assimilation techniques, and helps solving the inverse problem (and determining the viscosity) by organizing an iteration process to minimize the difference between the model solution and observations (e.g., Ismail-Zadeh et al., 2016; Korotkii et al., 2016). This method involves an analytical derivation of the optimization (adjoint) problem, and hence it is restricted to simple cases. Another method is based on the use of image processing and machine learning to determine the viscosity of a lava dome by analyzing images of the observed and modeled morphological shapes of the dome at each time of lava dome growth (Starodubtseva et al., 2021). An inverse problem can be replaced by the direct problem conjugated with the inverse problem, and the direct problem can be solved by varying model parameters and fitting observations. Although this method is simpler than the previous two approaches, it requires a significant number of numerical experiments to fit the observations. In this work we use the latter method, namely, we solve numerically Eqs 1–5 with the relevant initial and boundary conditions and vary the model parameters to get the best fit to the height and width of the lava dome during its growth.
To solve this problem numerically, we employ the Ansys Fluent software, where the finite volume method is used to solve numerical models on multiprocessor computers. The software is based on the volume of fluid (VOF) method (Hirt and Nichols, 1981) allowing for computationally inexpensive treatment of a moving interface between two fluid phases, e.g., the lava and the air. The cells containing the interface between the lava and air have
Numerical Results
We have performed a number of numerical experiments, and the experiments with relevant values of model parameters are listed in Table 1.
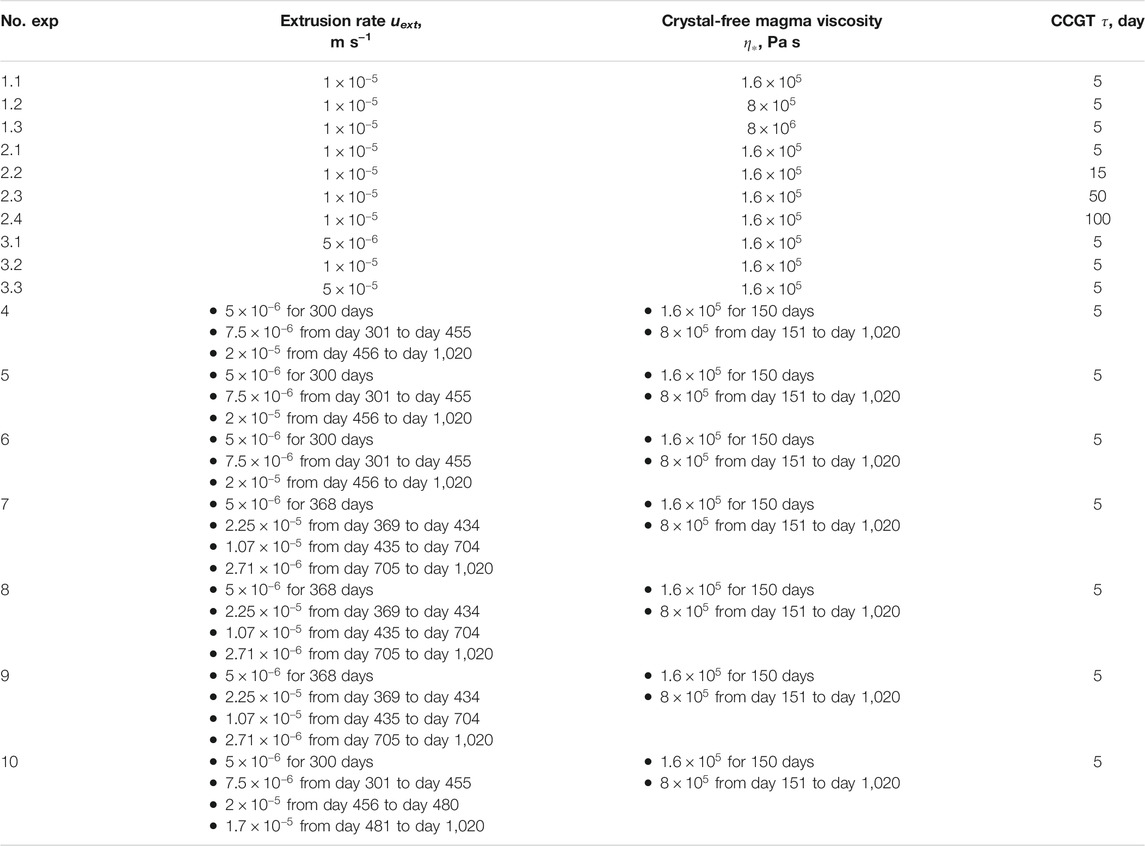
TABLE 1. Numerical experiments and their model parameters.
Sensitivity Analysis
We develop initially a series of numerical experiments of lava dome growth varying the model parameters to understand how each of them influences the morphological shape of the lava dome (e.g., its height and width). Particularly, we have performed a sensitivity analysis with respect to the crystal-free magma viscosity
Experiments 1: We study the influence of the crystal-free magma viscosity
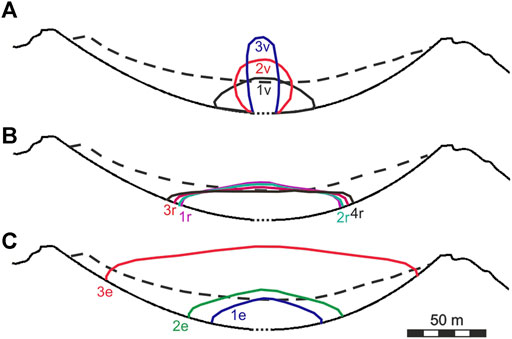
FIGURE 4. Lava dome growth in experiments 1-3. The dashed line presents the crater’s rim. (A) Black curve 1v (exp. 1.1), red curve 2v (exp. 1.2), and blue curve 3v (exp. 1.3) present the morphological shape at the time t = 70 days for the crystal-free magma viscosity
Experiments 2: These experiments explore the influence of CCGT on the morphology of lava domes. The crystal-free magma viscosity is prescribed to be
Experiments 3: These numerical experiments explore the influence of the lava extrusion rate on the dome morphology. Figure 4C illustrates the morphological shapes of lava domes at various effusion rates. The higher the rate the larger the dome as it accommodates the larger volume of the extruded lava.
Lava Dome Morphology
Based on the sensitivity analysis, we have constrained the model parameters to get a better fit between the observed and modeled heights of the lava dome at Volcán de Colima. We present here the results of three numerical experiments, which are consistent with the observations on the dome growth from February 1, 2007 to October 20, 2009. The model parameters are listed in Table 1; the model experiments differ from each other by their geometry.
In these model experiments, the lava extrusion rate uext is obtained empirically from the analysis of the lava dome images at different times and from the results of the sensitivity analysis with respect to varying rates of extrusion (experiments 3) This empirical approach is supported theoretically (see Eq. A4 in Appendix A2; we note that the calculated values of the rate are in close vicinity to the rates obtained empirically). To match the observed and modeled heights of the lava dome, the following extrusion rates uext have been assigned (see Figure 5):
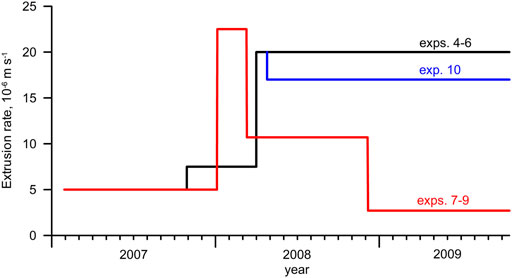
FIGURE 5. Model extrusion rate in experiments 4-10.
The crystal-free magma viscosity is assumed to be
Experiment 4: The morphological shapes of the modeled lava dome are presented in Figures 6A,D. The results show that the extruded lava develops a dome structure, which fills the volcano crater (Figure 6A). Due to the interplay between the extrusion rate and the lava viscosity, the dome grows up and advances horizontally. While dome dynamics is dominated by vertical growth for at least 480 days, a horizontal advancement becomes dominant later due to gravitational spreading of the erupted lava.
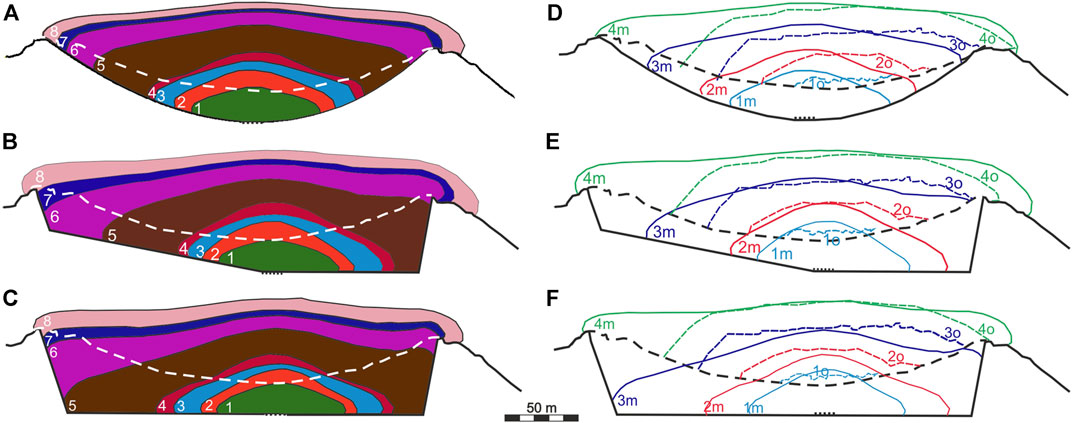
FIGURE 6. Lava dome growth in experiment 4 (A and D), 5 (B and E), and 6 (C and F). (A–C) The dome morphology at day 150 (the curve marked by 1), 300 (2), 434 (3), 480 (4), 700 (5), 852 (6), 912 (7), and 1,020 (8). The white dashed line is the crater’s rim. (D–F) Comparison of the morphological shapes of the modeled (curves with index m) and observed (dashed curves with index o; see Figure 1E) lava domes at day 300, November 1, 2007 (cyan curves); day 480, May 1, 2008 (red curves); day 704, December 4, 2008 (blue curves); and day 1,020, October 20, 2009 (green curves). The black dashed line is the crater’s rim. The black bold line presents the base of the crater, and the black dotted line is the top of the conduit.
The maximum heights of the modeled and observed lava domes show a good agreement (Figures 6D, 7). Meanwhile, the morphological shapes of both domes do not fit each other well on the left side of the model domain (or in the eastern part of the crater). Although the photo of the dome initiation in February 2007 (Figure 1B) shows that it started to build nearly in the center of the crater, with time the extruded lava seems to have been moving toward the west (Figure 1D). This westward slope in the dome building could be due to the location of the lava vent, which is likely to be opened closer to the western side of the crater, and/or due to a westward inclination of the crater topography promoting the lava advancement in the direction. Moreover, it was proposed that the upper part of the conduit at Volcán de Colima may be bending westward close to the surface (Lavallée et al., 2012; Salzer et al., 2014). To test the hypotheses, we have modified the geometry of the crater and performed two other experiments.
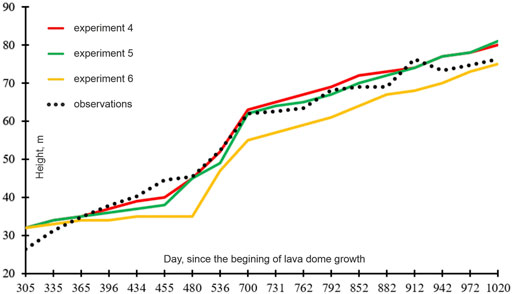
FIGURE 7. Comparison of the maximum heights of the lava dome at Volcán de Colima (Bretón-González et al., 2013) with those of the modeled domes.
Experiment 5: This experiment differs from exp. 4 by the geometry of the computational domain (Figure 3B). The topography of the crater is assumed to be flat on its right side and inclined on its left side. The location of the conduit is shifted to the right of the model domain (to the west) by the size of the conduit’s diameter (14.5 m). The model parameters are the same as in exp. 4.
Figures 6B,E illustrates the model dome evolution in exp. 5. Since initiation of the lava dome growth, the dome moves easily toward the west (to the right side of the model domain) because of the slope of the crater’s topography on the left side of the model domain. Once the lava reaches the western border of the crater, the dome builds up in the west and extends horizontally to the east (Figure 6B). At the later stage of the dome growth, the morphological shapes of the domes in experiments 4 and 5 show similarity.
Figure 6E shows that the morphological shapes of the observed and modeled lava domes fit well enough at least until May 1, 2008 (day 480), and the maximum heights of both domes are close to each other (see also Figure 7). Although the shapes of both domes on the western part of the crater converge better in exp. 5 compared to exp. 4, there are still discrepancies between the shapes on the eastern side of the crater, namely, the eastern side of the observed dome is steeper than that of the modeled dome. More complex geometry of the crater on its eastern side as well as an increasing viscosity, as the lava fully solidifies at the edges, could explain the observed morphology of the dome.
Experiment 6: In this experiment, the crater base is flat (Figure 3B), and the conduit is shifted (by 14.5 m) toward the west compared to the geometry of the crater in the case of exp. 4. The model parameters are the same as in exp. 4. Figures 6C,F illustrates the modeled dome evolution in this experiment. The flat topography of the model crater promotes the lava dome to advance in both direction (to the west and to the east), although the lava reaches the western side of the crater faster than its eastern side due to the location of the conduit in the model (Figure 6C). The morphological shapes of the modeled and observed domes fit each other rather good at least until May 2008 (Figure 6F). However, later the maximum heights of the modeled lava dome are smaller than those of the observed lava dome. Comparing the maximum heights of the modeled domes, one can see that the dome heights in exps. 4 and 5 agree well with the observed data especially for the time interval from 480 to 704 days. Meanwhile, the heights of the modeled dome in exp. 6 do not match well those of the observed dome except the time closer to the end of 2009. As all parameters of the model in exps. 4-6 are the same except the model geometry, we consider that the best fit of the modeled dome height and width to the observations is achieved in exp. 5, where the crater floor is inclined westward on the left of the vent and the floor is horizontal on its right.
Lava Dome Viscosity
We illustrate here the distribution of the modeled crystal content, viscosity, and velocity for times of November 1, 2007, May 1, 2008, and April 1, 2009 in the case of experiments four to six. The crystal content within the model conduit and the lava dome is presented in Figure 8. A new magma enters the model conduit with the initial volume of the crystal content equal to 0.4, and it reaches almost its equilibrium value 0.83 at the surface near the vent, because the magma crystalizes rapidly at small extrusion rates and small CCGT. We note the magma viscosity remains finite at
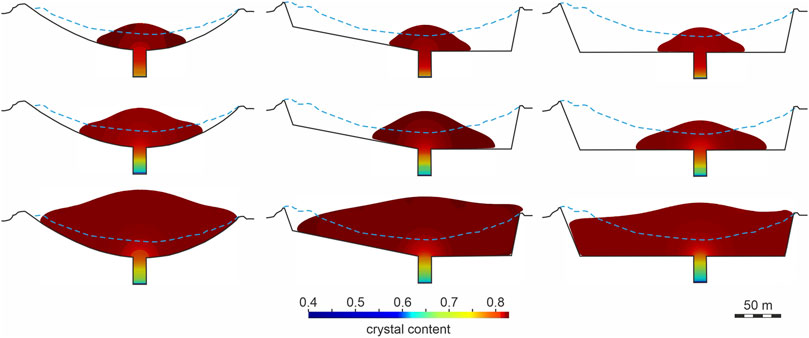
FIGURE 8. The modeled crystal content at times of 2007/11/01 (upper panels), 2008/05/01 (middle panels), and 2009/04/01 (lower panels) in experiments 4 (left column), 5 (middle column), and 6 (right column).
The viscosity distribution in the lava dome mimics the distribution of the crystal content (Figure 9). The lava dome viscosity reaches 1012 Pa s, while the viscosity of magma in the conduit varies from about 109.8 to about 1011.9 Pa s. For lavas from Volcán de Colima, Lavallée et al. (2008) estimated the melt viscosity and the effective viscosity to be 108.58 and 1011.28 Pa s, respectively, where the effective viscosity was calculated using the Einstein-Roscoe equation (Einstein, 1906; Roscoe, 1952). The viscosity obtained in the model is in a good agreement with the estimated effective viscosity of lavas from Volcán de Colima, although direct comparison between calculated and measured viscosities has some difficulties including strain localization, shear heating and other effects. For example, the apparent viscosity of lavas from Volcán de Colima estimated experimentally by Lavallee et al. (2008) is between about 109 and 109.4 Pa s at stress of 8 MPa. At small extrusion rates and the prolonged duration of the dome growth, the higher viscosity provides the lava dome to grow upward (see exp. 1), while the lower viscosity leads to a horizonal advancement of the lava dome and an insignificant vertical growth. The higher viscosity could be associated with magma degassing during the lava dome building and rapid crystallization as recorded by the increased seismic activity (Figure 2B) during 2007–2009. The velocity field shows higher flow rates in the conduit and near the vent oriented almost vertically, and the rates decay with the increase of the dome height.
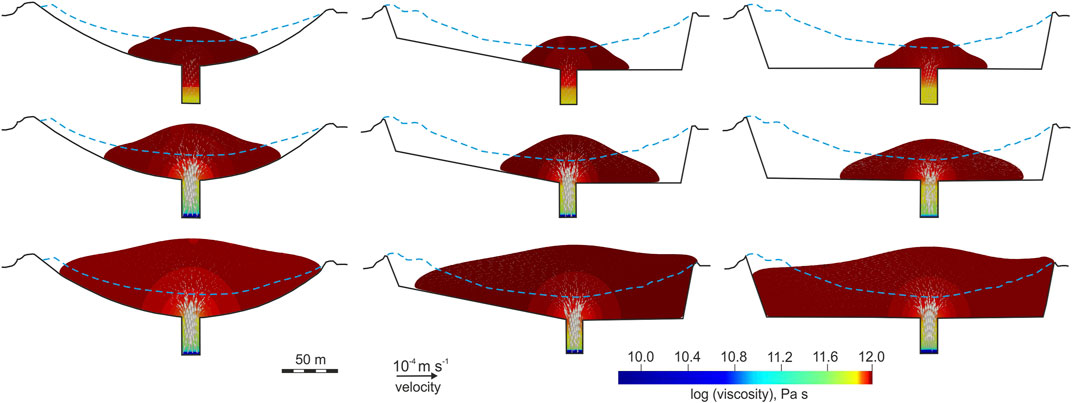
FIGURE 9. The modeled viscosity and velocity (arrows) at times of 2007/11/01 (upper panels), 2008/05/01 (middle panels), and 2009/04/01 (lower panels) in experiments 4 (left column), 5 (middle column), and 6 (right column).
Extrusion Rates
In the following experiments, we employ the extrusion rates calculated from the observed lava dome volumes and calculated discharge (effusion) rates using Eq. 5 in Appendix A2 (see also Figure 2B). In the experiments, the initial extrusion rate is
Initially the morphological shape and the maximum height of the lava domes in experiments 7–9 (Figure 10) follow closely those in experiments 4–6, respectively, as the initial extrusion rate is the same in both sets of the experiments (Table 1; Figure 5). However, the subsequent evolution of the lava dome in experiments 7-9 differs from that in experiments 4–6 starting from day 368, and it is associated with the increase of the extrusion rate by a factor of about four in experiments 7–9. The decrease of the extrusion rate after day 434 results in the gravitational spreading of lava dome instead of its growth upward. The dome height reaches its maximum value at day 704 as after that the extrusion rate decreases by a factor of about 4, and the dome starts to advance horizontally. Unfortunately, the morphology of the modeled domes does not fit that of the observed dome, and the dome heights are low compared to the observations (Figure 10).
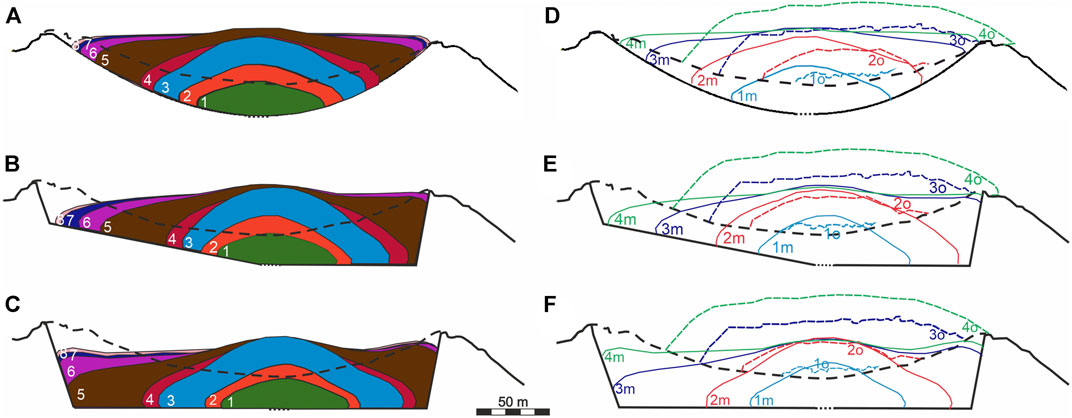
FIGURE 10. Lava dome growth in experiment 7 (A, D), 8 (B, E), and 9 (C, F). See Figure 6 for notations.
Lava Dome Carapace
Lava domes usually have a solid surface layer (carapace) but remain mobile and undergo deformation for days to months (Anderson and Fink, 1990). Iverson (1990) highlighted the importance of the thermal carapace in determining the morphology of domes. The role of the surface cooling and the carapace formation were analysed in laboratory and numerical experiments (e.g., Fink and Griffiths, 1998; Griffiths, 2000; Hale and Wadge, 2003; Hale et al., 2007; Hale, 2008; Husain et al., 2014, 2018, 2019; Harnett et al., 2018).
A thickness of the thermal boundary layer
To simulate a thermal carapace development during lava dome growth, our mathematical/numerical model should be supplemented by the heat equation, which would complicate the model and computations. Therefore, to keep the same numerical model, we modify the lava dome viscosity by introducing a higher viscous layer at the interface between the dome and its surrounding in order to simulate a dome carapace (see Appendix A1).
In experiment 10, we assume that the crater geometry and the model parameters are the same as in exp. 5, except for the extrusion rate. This numerical experiment starts at day 481 of the model dome growth as in exp. 5. A higher viscosity carapace of ∼6 m thick is introduced in the model at day 481 simultaneously with a decrease of the extrusion rate by 15% compared to the rate in exp. 5 (see Figure 5). This decrease in the extrusion rate has been introduced to reduce the volume of erupted lava and to better fit the observed morphological shapes.
Figure 11 presents several stages of the dome growth in exp. 10. The dome morphology differs significantly compared to that in exp. 5 (Figure 11A). Particularly, 1) the dome develops a steep flank on its left side, which fits observations at Volcán de Colima rather well, and 2) the advancement of lava dome at its left side is retarded by about 50 m for 334 days, compared to dome advancement in exp. 5. Meanwhile, the dome heights in both experiments (Figure 11B) are in a good agreement with the observations. The modeled viscosity and velocity in the lava dome are presented in Figure 12 together with the images of the dome at Volcán de Colima for three stages of its growth. It is seen that exp. 10 provides much better fit between the model and observations.
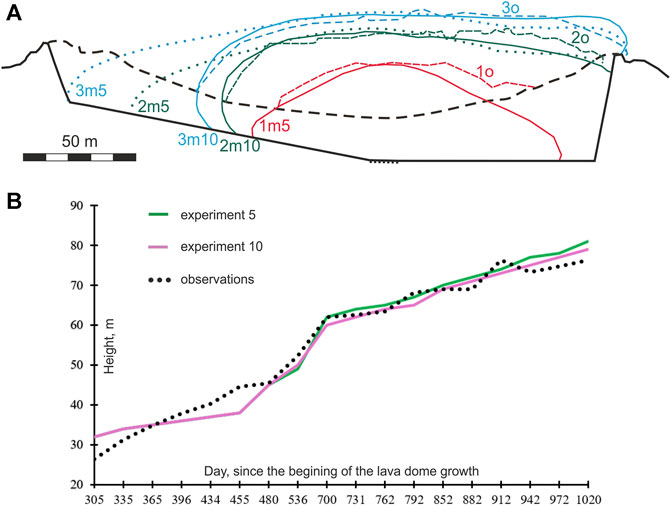
FIGURE 11. Lava dome growth in experiment 10. (A) Comparison of the morphological shapes of the modeled dome in exp. 10 (solid curves with index m10) with that in exp. 5 (dotted curves with index m5) and with observed lava domes (dashed curves with index o) on (1) May 1, 2008 (red curves), (2) December 4, 2008 (green curves), and (3) April 1, 2009 (blue curves). The black dashed line is the crater’s rim. The black bold line presents the base of the crater, and the black dotted line is the top of the conduit. (B) Comparison of the maximum heights at the center of the lava dome at Volcán de Colima (Bretón-González et al., 2013) with those of the modeled dome in exp. 10 (purple curve) and in exp. 5 (green curve).
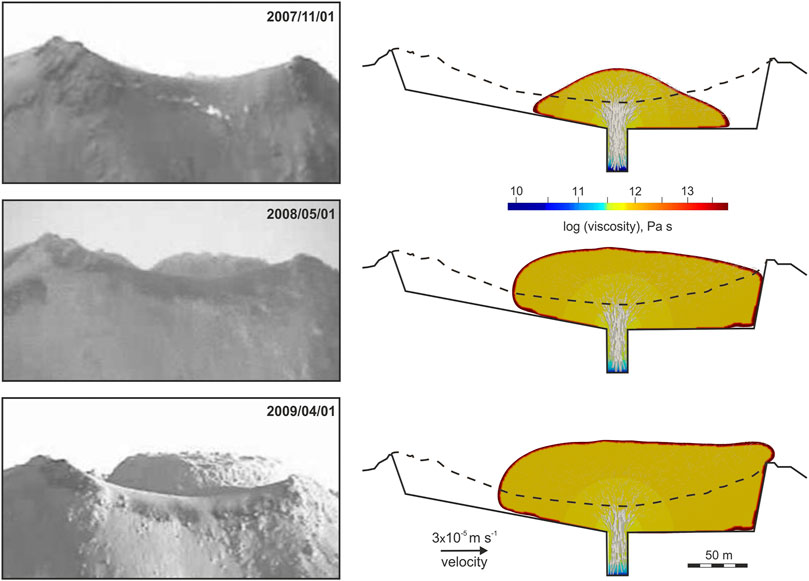
FIGURE 12. The lava dome morphology at Volcán de Colima (left panels; images from Bretón-González et al., 2013) and the modeled viscosity and velocity (arrows) in exp. 10 (right column) at times of 2007/11/01 (upper panels), 2008/05/01 (middle panels), and 2009/04/01 (lower panels).
Discussion and Conclusion
Model Outcomes
We have presented a plausible numerical model for lava dome growth at Volcán de Colima during the long dome-building episode lasting from early 2007 to fall 2009 without explosive dome destruction. This numerical study has allowed for estimating the influence of the model geometry (the crater topography and the conduit’s location), extrusion rates, and a high-viscous carapace on the morphology of the lava dome. Three geometries of the crater have been explored with the different locations of the vent, and it has been shown that the crater topography is likely to be inclined toward the west as shown in experiments 5 and 10.
The numerical results show that the extrusion rates calculated empirically from 2-D images of the morphological shapes of the lava dome at different times lead to a better fit between the observed and modeled shapes. The best fit provides the reduced extrusion rates as shown in exp. 10; the extrusion rates calculated using the erupted lava dome volumes yield to underestimation of the maximum height of the observed lava dome. As a lava advancement within the dome depends on the surface topography of the crater as well as the conduit geometry, two-dimensional (2-D) models cannot capture complexity of the three-dimensional (3-D) lava dome growth.
The developed model has shown that high viscosity of the dome is required to maintain a vertical growth. As the viscosity depends on the volume fraction of crystals in our model, and the latter depends on CCGT, the crystal content grows rapidly in the uppermost conduit at low discharge rates (Figure 2B), and lava becomes highly viscous. The modeled lava viscosity within the dome core varies from 109.8 to 1012 Pa s and is consistent with the viscosity measurements of lavas from Volcán de Colima. Viscosity changes can influence growth rates of domes at Volcán de Colima (Yokoyama, 2005; Lavallee et al., 2012).
Using recorded dataset from Volcán de Colima we have shown that solidification and rheological stiffening within a lava dome are controlled in part by cooling and degassing-induced crystallization. While the crystallization due to degassing is a dominant process in dome-building eruptions (e.g., Melnik and Sparks, 1999), especially during short dome-building episodes (e.g., Tsepelev et al., 2020), the model forecasts indicate that a high-viscous carapace significantly influences the dome growth process during long lava dome-building episodes. A carapace of higher viscosity (about 1014 Pa s) prevents a rapid dome advancement to the east and promotes the development of a steep slope on the dome’s eastern side.
Cooling influences the lava viscosity at the interface between the dome and its surrounding making the dome carapace more viscous and promoting a development of lobe-shaped lava dome (Watts et al., 2002; Tsepelev et al., 2020). In the cases of short episodes of lava dome growth, the thermal carapace of the lava dome is not thick enough to present significant resistance to lava dome horizontal advancement (e.g., Bourgouin et al., 2007; Tsepelev et al., 2020). The dome carapace becomes thicker in the case of radiative and convective heat transfer at the lava/air interface (Tsepelev et al., 2019) or in the cases of long dome-building episodes, as shown in this work. Further studies related to the influence of temperature on the viscosity of the carapace during long lava dome-building episodes can refine the current results.
Model Limitations
The numerical model is unlikely to represent exact dynamics of lava dome growth due to the complexity of magmatic processes at depths and unknowns such as degassing, initial crystal volume content, and viscosity. Any model comes with its simplifications (e.g., less complex viscosity, and 2-D or axisymmetric instead of 3-D geometry) and assumptions (e.g., temperature-independent density and viscosity, and no density change due to crystallization). For example, difficulties related to 3-D data-driven numerical modeling (e.g., data assimilation, inversions, and computational cost) are also associated with data issues. Several techniques for volcano monitoring are available to collect and use data on lava dome growth, for example, video recording (Bretón-Gonzalez et al., 2013), infrared camera imaging (Stevenson and Varley, 2008), terrestrial photogrammetry (James and Varley, 2012), and satellite radar observations (e.g., Salzer et al., 2014; Walter et al., 2019). Meanwhile, it is still challenging to determine precise 3-D morphological changes during dome growth, especially when the data come from the records using a single video (photo) camera as 2-D images have a limited information related to a 3-D object. Other challenging issues are related to the determination of the detailed crater geometry prior a new dome starts to evolve, and the location and geometry of the uppermost conduit (e.g., Pinel et al., 2011).
The problem of a search for the best fit between the morphological shapes of observed and modeled lava domes tuning the parameters of the lava viscosity belongs to the class of inverse problems. The solution to the inverse problem can be non-unique; for example, different discharge rates and different CCGT can produce similar lava dome shapes (Starodubtseva et al., 2021). As for the discharge rate, it can be determined from observations, and, therefore, this rate can be considered as a known characteristic of the lava dome dynamics constraining the model. In our numerical modeling the optimization of the misfit between the modeled and observed morphologies has been based on tuning CCGT, extrusion rates, and the crystal-free magma viscosity at the times of available observations.
Matching the timing of lava dome growth at Volcán de Colima to its morphology is challenging, because the estimation of the volume of the erupted lava is restricted to analysis of camera images and hence uncertain; the existing 3-D temporal coverage of the extrusion process is not complete; the location of the vent is not precisely documented; and the determination of the extrusion rate in 2-D models is complicated. Therefore, with more observations 3-D numerical models of lava domes should provide additional information on lava dome growth and their eventual collapse.
Model Applications
The developed model in this work and similar models can be used to analyze future effusive eruptions and lava dome growth at Volcán de Colima or elsewhere after proper calibration based on history matching of dome growth by nudging model forecasts to observations (i.e., minimizing misfits between the modeled and observed morphological shapes of domes). The model can be used to assess a stress localization in the dome carapace and its potential failure, which may lead to pyroclastic flow hazards.
In the future, every potentially hazardous volcanic eruption should be accompanied by its virtual numerical model that is constantly tuned by a history matching procedure and gives short- and long-term forecasts of the eruption dynamics and associated hazards. This will require increasing the accuracy of monitoring techniques and considerable investment in geophysical studies of volcanic systems.
Data Availability Statement
The data supporting the conclusions of this article will be made available by the authors, without undue reservation.
Author Contributions
AI-Z, OM, and VZ contributed to the conceptualization of the paper. VZ provided data on the dome growth and also an insight into the development of the dome at Volcán de Colima during 2007-2009. NZ processed the data, developed a numerical model, and performed all model experiments. AIZ supervised the study, and assisted NZ in numerical modeling and data processing. IT contributed to the numerical statement of the problem, data processing, and the development of numerical codes. All authors contributed to the interpretation of numerical results. AIZ and NZ performed writing–original draft preparation and figures. All co-authors performed writing–review and editing.
Conflict of Interest
The authors declare that the research was conducted in the absence of any commercial or financial relationships that could be construed as a potential conflict of interest.
Publisher’s Note
All claims expressed in this article are solely those of the authors and do not necessarily represent those of their affiliated organizations, or those of the publisher, the editors and the reviewers. Any product that may be evaluated in this article, or claim that may be made by its manufacturer, is not guaranteed or endorsed by the publisher.
Acknowledgments
This is a contribution to the research project funded by the Russian Science Foundation’s grant (project RSF 19-17-00027). NZ thanks also Deutsche Forschungsgemeinschaft (project DFG IS203/14-1) for support. We are grateful to Frank Schilling for providing helpful insight into physical properties of lavas. Also, we are thankful to Valerio Acocella, Shanaka de Silva, and two reviewers for careful reviews of the initial manuscript and constructive comments.
References
Anderson, S. W., and Fink, J. H. (1990). “The Development and Distribution of Surface Textures at the Mount St. Helens Dome,” in Lava Flows and Domes; Emplacement Mechanisms and Hazard Implications. Editor J. H. Fink (New York: Springer), 25–46. doi:10.1007/978-3-642-74379-5_2
Bourgouin, L., Mühlhaus, H.-B., Jane Hale, A., and Arsac, A. (2007). Studying the Influence of a Solid Shell on Lava Dome Growth and Evolution Using the Level Set Method. Geophys. J. Int. 170, 1431–1438. doi:10.1111/j.1365-246x.2007.03471.x
Bretón-Gonzalez, M., Campos, A., Leon, Z., Plascencia, I., and Ramírez, J. (2013). “The 2007-2012 lava dome growth in the crater of Volcán de Colima, México, derived from video monitoring system,” in Complex Monitoring of Volcanic Activity. Editor V. M. Zobin (New York: Nova Science Publishers, Inc.), 153–169.
Calder, E. S., Lavallée, Y., Kendrick, J. E., and Bernstein, M. (2015). “Lava Dome Eruptions,” in Encyclopedia of Volcanoes. Editors H. Sigurdsson, B. Houghton, H. Rymer, J. Stix, and S. McNutt. 2nd edn. (San Diego: Academic Press), 343–362. doi:10.1016/b978-0-12-385938-9.00018-3
Calder, E. S., Luckett, R., Sparks, R. S. J., and Voight, B. (2002). Mechanisms of Lava Dome Instability and Generation of Rockfalls and Pyroclastic Flows at Soufrière Hills Volcano, Montserrat. Geol. Soc. Lond. Mem. 21, 173–190. doi:10.1144/GSL.MEM.2002.021.01.08
Cashman, K. V. (2020). Crystal Size Distribution (CSD) Analysis of Volcanic Samples: Advances and Challenges. Front. Earth Sci. 8, 291. doi:10.3389/feart.2020.00291
Chevrel, M. O., Platz, T., Hauber, E., Baratoux, D., Lavallée, Y., and Dingwell, D. B. (2013). Lava Flow Rheology: A Comparison of Morphological and Petrological Methods. Earth Planet. Sci. Lett. 384, 109–120. doi:10.1016/j.epsl.2013.09.022
Christensen, U. R. (1992). An Eulerian Technique for Thermomechanical Modeling of Lithospheric Extension. J. Geophys. Res. 97, 2015–2036. doi:10.1029/91jb02642
Costa, A., Caricchi, L., and Bagdassarov, N. (2009). A Model for the Rheology of Particle-Bearing Suspensions and Partially Molten Rocks. Geochem. Geophys. Geosyst. 10 (3), a–n. doi:10.1029/2008GC002138
Einstein, A. (1906). Eine neue Bestimmung der Moleküldimensionen. Ann. Phys. 324, 289–306. doi:10.1002/andp.19063240204
Fink, J. H., and Griffiths, R. W. (1998). Morphology, Eruption Rates, and Rheology of Lava Domes: Insights from Laboratory Models. J. Geophys. Res. 103, 527–545. doi:10.1029/97jb02838
Griffiths, R. W. (2000). The Dynamics of Lava Flows. Annu. Rev. Fluid Mech. 32, 477–518. doi:10.1146/annurev.fluid.32.1.477
Hale, A. J., Bourgouin, L., and Mühlhaus, H. B. (2007). Using the Level Set Method to Model Endogenous Lava Dome Growth. J. Geophys. Res. 112, B03213. doi:10.1029/2006jb004445
Hale, A. J. (2008). Lava Dome Growth and Evolution with an Independently Deformable Talus. Geophys. J. Int. 174, 391–417. doi:10.1111/j.1365-246x.2008.03806.x
Hale, A. J., and Wadge, G. (2003). Numerical Modelling of the Growth Dynamics of a Simple Silicic Lava Dome. Geophys. Res. Lett. 30 (19). doi:10.1029/2003GL018182
Harnett, C. E., Thomas, M. E., Calder, E. S., Ebmeier, S. K., Telford, A., Murphy, W., et al. (2019). Presentation and Analysis of a Worldwide Database for Lava Dome Collapse Events: the Global Archive of Dome Instabilities (GLADIS). Bull. Volcanol. 81, 16. doi:10.1007/s00445-019-1276-y
Harnett, C. E., Thomas, M. E., Purvance, M. D., Neuberg, J., and Neuberg, J. (2018). Using a Discrete Element Approach to Model Lava Dome Emplacement and Collapse. J. Volcanology Geothermal Res. 359, 68–77. doi:10.1016/j.jvolgeores.2018.06.017
Harris, A. J., Rose, W. I., and Flynn, L. P. (2003). Temporal Trends in Lava Dome Extrusion at Santiaguito 1922-2000. Bull. Volcanol. 65, 77–89. doi:10.1007/s00445-002-0243-0
Heap, M. J., Troll, V. R., Kushnir, A. R. L., Gilg, H. A., Collinson, A. S. D., Deegan, F. M., et al. (2019). Hydrothermal Alteration of Andesitic Lava Domes Can lead to Explosive Volcanic Behaviour. Nat. Commun. 10, 5063. doi:10.1038/s41467-019-13102-8
Hess, K.-U., and Dingwell, D. B. (1996). Viscosities of Hydrous Leucogranitic Melts: a Non-arrhenian Model. Am. Mineral. 81, 1297–1300.
Hirt, C. W., and Nichols, B. D. (1981). Volume of Fluid (VOF) Method for the Dynamics of Free Boundaries. J. Comput. Phys. 39 (1), 201–225. doi:10.1016/0021-9991(81)90145-5
Husain, T., Elsworth, D., Voight, B., Mattioli, G., and Jansma, P. (2018). Influence of Conduit Flow Mechanics on Magma Rheology and the Growth Style of Lava Domes. Geophys. J. Int. 213, 1768–1784. doi:10.1093/gji/ggy073
Husain, T., Elsworth, D., Voight, B., Mattioli, G., and Jansma, P. (2019). Morphologic Variation of an Evolving Dome Controlled by the Extrusion of Finite Yield Strength Magma. J. Volcanology Geothermal Res. 370, 51–64. doi:10.1016/j.jvolgeores.2019.01.010
Husain, T., Elsworth, D., Voight, B., Mattioli, G. S., and Jansma, P. (2014). Influence of Extrusion Rate and Magma Rheology on the Growth of Lava Domes: Insights from Particle-Dynamics Modelling. J. Volcanol. Geotherm. Res. 285, 110–117. doi:10.1016/j.jvolgeores.2014.08.013
Ismail-Zadeh, A., Korotkii, A., and Tsepelev, I. (2016). Data-driven Numerical Modeling in Geodynamics: Methods and Applications. Heidelberg: Springer.
Ismail-Zadeh, A., and Tackley, P. (2010). Computational Methods for Geodynamics. Cambridge: Cambridge University Press.
Iverson, R. M. (1990). “Lava Domes Modeled as Brittle Shells that Enclose Pressurized Magma, with Application to Mount St. Helens,” in Lava Flows and Domes; Emplacement Mechanisms and Hazard Implications. Editor J. H. Fink (New York: Springer), 47–69. doi:10.1007/978-3-642-74379-5_3
James, M. R., and Varley, N. (2012). Identification of structural controls in an active lava dome with high resolution DEMs: Volcán de Colima, Mexico. Geophys. Res. Lett. 39 (22), a–n. doi:10.1029/2012GL054245
Jeffrey, D. J., and Acrivos, A. (1976). The Rheological Properties of Suspensions of Rigid Particles. Aiche J. 22, 417–432. doi:10.1002/aic.690220303
Korotkii, A., Kovtunov, D., Ismail-Zadeh, A., Tsepelev, I., and Melnik, O. (2016). Quantitative Reconstruction of thermal and Dynamic Characteristics of Lava Flow from Surface thermal Measurements. Geophys. J. Int. 205, 1767–1779. doi:10.1093/gji/ggw117
Lavallée, Y., Meredith, P. G., Dingwell, D. B., Hess, K.-U., Wassermann, J., Cordonnier, B., et al. (2008). Seismogenic Lavas and Explosive Eruption Forecasting. Nature 453, 507–510. doi:10.1038/nature06980
Lavallée, Y., Varley, N. R., Alatorre-Ibargüengoitia, M. A., Hess, K.-U., Kueppers, U., Mueller, S., et al. (2012). Magmatic architecture of dome-building eruptions at Volcán de Colima, Mexico. Bull. Volcanol. 74 (1), 249–260. doi:10.1007/s00445-011-0518-4
Lejeune, A.-M., and Richet, P. (1995). Rheology of crystal-bearing Silicate Melts: An Experimental Study at High Viscosities. J. Geophys. Res. 100, 4215–4229. doi:10.1029/94jb02985
Luhr, J. F., and Carmichael, I. S. E. (1990). Petrological Monitoring of Cyclical Eruptive Activity at Volcán Colima, Mexico. J. Volcanology Geothermal Res. 42, 235–260. doi:10.1016/0377-0273(90)90002-w
Mardles, E. W. J. (1940). Viscosity of Suspensions and the Einstein Equation. Nature 145, 970. doi:10.1038/145970a0
Melnik, O., and Sparks, R. S. J. (2005). Controls on Conduit Magma Flow Dynamics during Lava Dome Building Eruptions. J. Geophys. Res. 110 (B2), B02209–B02231. doi:10.1029/2004jb003183
Melnik, O., and Sparks, R. S. J. (1999). Nonlinear Dynamics of Lava Dome Extrusion. Nature 402, 37–41. doi:10.1038/46950
Naimark, B. M., Ismail-Zadeh, A. T., and Jacoby, W. R. (1998). Numerical Approach to Problems of Gravitational Instability of Geostructures with Advected Material Boundaries. Geophys. J. Int. 134, 473–483. doi:10.1111/j.1365-246x.1998.tb07140.x
Naimark, B. M., and Ismail-Zadeh, A. T. (1995). Numerical Models of a Subsidence Mechanism in Intracratonic Basins: Application to North American Basins. Geophys. J. Int. 123, 149–160. doi:10.1111/j.1365-246x.1995.tb06667.x
Patankar, S. V., and Spalding, D. B. (1972). A Calculation Procedure for Heat, Mass and Momentum Transfer in Three-Dimensional Parabolic Flows. Int. J. Heat Mass Transfer 15, 1787–1806. doi:10.1016/0017-9310(72)90054-3
Pinel, V., Hooper, A., de la Cruz-Reyna, S., Reyes-Davila, G., Doin, M. P., and Bascou, P. (2011). The Challenging Retrieval of the Displacement Field from InSAR Data for Andesitic Stratovolcanoes; Case Study of Popocatepetl and Colima Volcano, Mexico. J. Volcanol. Geotherm. Res. 200 (1–2), 49–61. doi:10.1016/j.jvolgeores.2010.12.002
Rhodes, E., Kennedy, B. M., Lavallée, Y., Hornby, A., Edwards, M., and Chigna, G. (2018). Textural Insights into the Evolving Lava Dome Cycles at Santiaguito Lava Dome, Guatemala. Front. Earth Sci. 6, 30. doi:10.3389/feart.2018.00030
Riker, J., Cashman, K., Rust, A., and Blundy, J. (2015). Experimental Constraints on Plagioclase Crystallization during H2O- and H2O-CO2- Saturated Magma Decompression. J. Petrol. 56, 1966–1998. doi:10.1093/petrology/egv059
Roscoe, R. (1952). The Viscosity of Suspensions of Rigid Spheres. Br. J. Appl. Phys. 3, 267–269. doi:10.1088/0508-3443/3/8/306
Salzer, J. T., Nikkhoo, M., Walter, T. R., Sudhaus, H., Reyes-Dã¡vila, G., Bretón, M., et al. (2014). Satellite radar data reveal short-term pre-explosive displacements and a complex conduit system at Volcán de Colima, Mexico. Front. Earth Sci. 2, 12. doi:10.3389/feart.2014.00012
Sheldrake, T. E., Sparks, R. S. J., Cashman, K. V., Wadge, G., and Aspinall, W. P. (2016). Similarities and Differences in the Historical Records of Lava Dome-Building Volcanoes: Implications for Understanding Magmatic Processes and Eruption Forecasting. Earth-Science Rev. 160, 240–263. doi:10.1016/j.earscirev.2016.07.013
Simmons, J., Elsworth, D., and Voight, B. (2005). Classification and Idealized Limit-Equilibrium Analyses of Dome Collapses at Soufrière Hills Volcano, Montserrat, during Growth of the First Lava Dome: November 1995-March 1998. J. Volcanology Geothermal Res. 139, 241–258. doi:10.1016/j.jvolgeores.2004.08.009
Smith, R. B. (1975). Unified Theory of the Onset of Folding, Boudinage, and Mullion Structure. Geol. Soc. America Bull. 86, 1601–1609. doi:10.1130/0016-7606(1975)86<1601:utotoo>2.0.co;2
Starodubtseva, Y. V., Starodubtsev, I. S., Ismail-Zadeh, A. T., Tsepelev, I. A., Melnik, O. E., and Korotkii, A. I. (2021). A Method for Magma Viscosity Assessment by Lava Dome Morphology. J. Volcanolog. Seismol. 15 (3), 159–168. doi:10.1134/S0742046321030064
Stevenson, J. A., and Varley, N. (2008). Fumarole monitoring with a handheld infrared camera: Volcán de Colima, Mexico, 2006-2007. J. Volcanology Geothermal Res. 177 (4), 911–924. doi:10.1016/j.jvolgeores.2008.07.003
Tsepelev, I., Ismail-Zadeh, A., and Melnik, O. (2020). Lava Dome Morphology Inferred from Numerical Modelling. Geophys. J. Inter. 223 (3), 1597–1609. doi:10.1093/gji/ggaa395
Tsepelev, I., Ismail-Zadeh, A., Starodubtseva, Y., Korotkii, A., and Melnik, O. (2019). Crust Development Inferred from Numerical Models of La V a Flow and its Surface Thermal Measurements. Ann. Geophys. 61 (2), VO226. doi:10.4401/ag-7745
Voight, B., and Elsworth, D. (2000). Instability and Collapse of Hazardous Gas-Pressurized Lava Domes. Geophys. Res. Lett. 27 (1), 1–4. doi:10.1029/1999gl008389
Walter, T. R., Harnett, C. E., Varley, N., Bracamontes, D. V., Salzer, J., Zorn, E. U., et al. (2019). Imaging the 2013 explosive crater excavation and new dome formation at Volcán de Colima with TerraSAR-X, time-lapse cameras and modelling. J. Volcanology Geothermal Res. 369, 224–237. doi:10.1016/j.jvolgeores.2018.11.016
Watts, R. B., Herd, R. A., Sparks, R. S. J., and Young, S. R. (2002). Growth Patterns and Emplacement of the Andesitic Lava Dome at Soufrière Hills Volcano, Montserrat. Geol. Soc. Lond. Mem. 21, 115–152. doi:10.1144/gsl.mem.2002.021.01.06
Yokoyama, I. (2005). Growth Rates of Lava Domes with Respect to Viscosity of Magmas. Ann. Geophys. 48 (6), 957–971. doi:10.4401/ag-3246
Zobin, V. M., Arámbula, R., Bretón, M., Reyes, G., Plascencia, I., Navarro, C., et al. (2015). Dynamics of the January 2013-June 2014 explosive-effusive episode in the eruption of Volcán de Colima, México: insights from seismic and video monitoring. Bull. Volcanol. 77, 31. doi:10.1007/s00445-015-0917-z
Zobin, V. M., Luhr, J. F., Taran, Y. A., Bretón, M., Cortés, A., De La Cruz-Reyna, S., et al. (2002). Overview of the 1997-2000 activity of Volcán de Colima, México. J. Volcanology Geothermal Res. 117, 1–19. doi:10.1016/S0377-0273(02)00232-9
Zobin, V. M., Tellez, A., Aguilar, J. E., and Cruz, K. G. (2017). Seismic signals of rockfalls as indicators of the origin of lava fragments emplaced during the 2010 endogenous and exogenous growth in the crater of Volcán de Colima, México. Bull. Volcanol 79, 47. doi:10.1007/s00445-017-1130-z
Appendix
A1 Numerical Approach
The numerical solver uses an implicit scheme of integration for the governing equations (Eqs. 1–5) with the relevant boundary and initial conditions. The model domain is discretized by about 54,000 hexahedral cells. The pressure is discretized by the second-order staggered scheme PRESTO! (e.g., Peyret, 1996). To approximate the Laplacian, we use the numerical scheme of the second-order accuracy, and the monotonic schemes are used to discretize convective terms in the equations (e.g., Ismail-Zadeh and Tackley, 2010). The pressure-velocity coupling is handled by the SIMPLE method (Patankar and Spalding, 1972), where the relaxation parameters are chosen to be 0.015 and 0.3 for the velocity and pressure, respectively. We assign 0.5 to the relaxation parameter for the function
The problem of magma extrusion and lava dome growth involves the interface between the lava and the air. Numerical schemes usually produce errors, originating from discontinuities of physical parameters at the interface (e.g., the density and viscosity), and related smearing of the parameters along the interface. To minimize such errors and smearing, special numerical methods have been developed: the methods are rather simple for the case of discontinuous density (e.g., Christensen, 1992; Naimark and Ismail-Zadeh, 1995), but more difficult for the case of discontinuous viscosity (e.g., Naimark et al., 1998). In this modeling the viscosity jump at the lava-air interface is significant (many orders of the magnitude), and this generates indeed smearing at the interface. To reduce the smearing, a finer mesh can be introduced around the interface.
At the initial time t = 0 the conduit (sub-domain
To simulate numerically the development of a highly viscous dome carapace due to cooling, a ‘thermal boundary layer’ is introduced at the interface between the lava dome and its surrounding. This allows to avoid introducing and solving the heat equation, and hence do not complicate the existing model. In experiment 10, the viscosity of the boundary layer is assumed to be by a factor of 200 higher than the viscosity of the dome core. The thickness of the layer is about 5-6 computational cells adjacent perpendicularly to the interface, and each cell is of about 1 m thick. Figure A1 presents the model carapace.
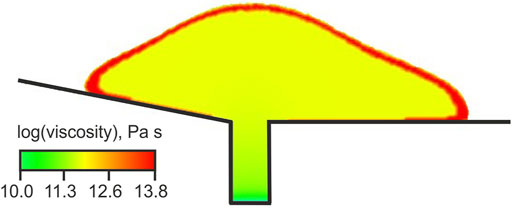
FIGURE A1. A layer (red) of the higher viscosity introduced in numerical experiment 10 to simulate a dome carapace.
A2 Determination of the Model Extrusion Rates Using the Extruded Lava Volume Data
Since January 2007 a slow endogenous growth of the lava dome continued until the end of 2009. Figure 2 presents the values of the lava dome volume and the discharge rates Udis (m3 s−1) for the time intervals, where the data on the dome lava volumes have been available (Figure 2A). When solving numerically 2-D models of the lava extrusion, difficulties arise with the calculation of the model extrusion rate, which will correspond to the observed effusion rate. Below we derive the formulas for conversion of the observed discharge rate
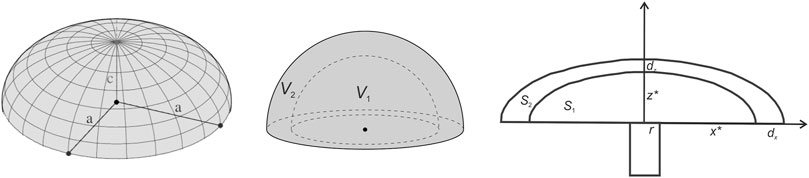
FIGURE A2. Geometry of the half-spheroid (left and central panels) and the 2-D cross-section of the half-spheroid (right panel).
We approximate a lava dome shape by a half-spheroid with the equal a- and b-semi-axis (a = b) and height c (Figure A2). In Figure A2, r is the radius of the conduit, z* is the height of the lava dome, r + x* is the radius of the lava dome, dx and dz are the increments of the radius and height of the lava dome for the time t2 - t1, respectively. We calculate the difference between the volume V2 of the outer half spheroid (the volume of lava at time t2) and the volume V1 of the inner half-spheroid (the volume of lava at time t1). This difference will characterize the volume of the lava extruded for time interval t2 - t1.
The volume of the extruded lava for time interval t2-t1 can be found using the discharge rate as
Considering the 2-D case study, we calculate the difference between the area of the cross-section through the center of the outer half spheroid S2 at time t2 and the area of the cross-section through the center of the inner half-spheroid S1 at time t1. This difference will characterize the area of the lava, which was extruded during time interval t2 - t1:
The lava area extruded for time interval t2-t1 equals to
Inserting (t2 - t1) from Eq. (A2) into Eq. (A4) we can get the conversion formula from the observed discharge rate to the model extrusion rate:
The parameters x*, z*, dx, and dz are accessed from the images of the 2-D morphological shapes of the growing lava dome (see Figure 1E; Bretón-González et al., 2013). The extrusion rate
Keywords: Volcán de Colima, lava dome, morphology, viscosity, numerical analysis
Citation: Zeinalova N, Ismail-Zadeh A, Melnik O, Tsepelev I and Zobin V (2021) Lava Dome Morphology and Viscosity Inferred From Data-Driven Numerical Modeling of Dome Growth at Volcán de Colima, Mexico During 2007-2009. Front. Earth Sci. 9:735914. doi: 10.3389/feart.2021.735914
Received: 03 July 2021; Accepted: 28 October 2021;
Published: 25 November 2021.
Edited by:
Shanaka L. de Silva, Oregon State University, United StatesReviewed by:
Brett Carr, United States Geological Survey, United StatesLuca Caricchi, Université de Genève, Switzerland
Copyright © 2021 Zeinalova, Ismail-Zadeh, Melnik, Tsepelev and Zobin. This is an open-access article distributed under the terms of the Creative Commons Attribution License (CC BY). The use, distribution or reproduction in other forums is permitted, provided the original author(s) and the copyright owner(s) are credited and that the original publication in this journal is cited, in accordance with accepted academic practice. No use, distribution or reproduction is permitted which does not comply with these terms.
*Correspondence: Alik Ismail-Zadeh, YWxpay5pc21haWwtemFkZWhAa2l0LmVkdQ==