 Xiang Luo
 Xiujuan Wang2
 Zhonghu Wu
- 1Xi’an Shiyou University, School of Petroleum Engineering, Xi’an, China
- 2Geological Research Institute of No. 9 Oil Production Plant, Changqing Oilfield, CNPC, Xi’an, China
- 3College of Civil Engineering, Guizhou University, Guiyang, China
- 4Xi’an Shiyou University, School of Earth Science and Engineering, Xi’an, China
When studying the influence of nonlinear seepage on the water flooding development of ultra-low permeability reservoirs, it is difficult to accurately characterize the nonlinear seepage state of ultra-low permeability reservoirs using conventional reservoir numerical simulation methods. A large number of field development and tests in the oil fields show that there are indeed starting pressure gradients and stress sensitivity effects in ultra-low permeability sandstone reservoirs. In this study, taking the tight sandstone of the Chang 6 Member in the Yanchang Formation as an example, the rock displacement vector was utilized to equivalently characterize the stress-sensitive effect of the reservoir based on a novel numerical simulation software tNavigator. Furthermore, the starting pressure gradient and the feasibility of a new stress-sensitive equivalent characterization method were verified combining the poroelastic media physics equations. In addition, we systematically studied the impact of stress-sensitive effects on oil well productivity under the influence of starting pressure gradient and considering petrophysical properties. The results show that the existence of the starting pressure gradient can improve the stress sensitivity of the matrix reservoir. Considering the starting pressure gradient, when the rock shear modulus is 14.29 GPa, the cumulative oil production decreases by 4.1%; when the rock shear modulus is 11.36 GPa, the cumulative oil production decreases by 11.2%. Finally, a numerical simulation was conducted with Block B in the Zhouwan-Wugucheng area, and the model can accurately predict the reservoir stress sensitivity based on the starting pressure gradient. When both the starting pressure gradient and stress sensitivity are considered, the crude oil recovery degree of the target layer decreases by 11.7%; when only the starting pressure gradient is considered, the crude oil recovery degree decreases by 8.8%; and when only the stress sensitivity is considered, the crude oil recovery degree decreases by 0.5%.
1 Introduction
In recent years, the proportion of ultra-low permeability tight sandstone reserves in China’s newly-added proven oil-in-place reserves has reached 60% (Meng and Li., 2013; Chen et al., 2019; Qian et al., 2021). Tight sandstone oil and gas has become the main energy field in the future utilization and exploitation of oil and gas resources (Kuuskraa., 1996; Lu and Wang., 1999; Ruan., 2002). Therefore, the efficient development of ultra-low permeability sandstone reservoirs is of great significance to the sustainable development of oil industry (Hansbo., 1960; Geng et al., 2017; Gao., 2021; Wu et al., 2021). Non-Darcy seepage problems are often involved in actual reservoir development (Francesconi., 1995; Shi et al., 1999; Wang et al., 1999; Dong et al., 2015; Zhao et al., 2021). If the fluids seep very slowly, they do not satisfy Darcy’s law.
Previous studies have systematically studied the effect of stress sensitivity on rock porosity and permeability (Hu et al., 2006; Jiao et al., 2011; Xu et al., 2021; Xue et al., 2021). These studies showed that with the increase of effective stress, rock porosity and permeability decreased to varying degrees (Mitchell, 1967; Von E and Tunn, 1995; Lei et al., 2007; Tian, 2014). Moreover, there are several studies showing that the initial displacement pressure required for oil flow increases as the permeability becomes effective (Liu et al., 2001; Cai et al., 2017; Li et al., 2020; Mahmud et al., 2020; Li and Li., 2021).
At present, existing commercial softwares cannot effectively simulate stress-sensitive effects in low-permeability reservoirs by setting the minimum pressure for fluid percolation (Todd., 2016; Maksim., 2019; Wu et al., 2020). The limitation of fluid flow simulation technology is that it cannot accurately characterize the non-Darcy flow state of low permeability reservoirs (Lv et al., 2002; Hong et al., 2020; Zheng et al., 2020). Fluid-structure interaction is currently recognized worldwide as an equivalent characterization method for stress-sensitive effects (Xu et al., 2014; Wang et al., 2016; He et al., 2020; Guo et al., 2021; Hower and Groppo., 2021; Mohammed et al., 2021). Most of the current commercial numerical simulation software only considers the pressure sensitivity of permeability and porosity, and does not consider the rock physical parameters (elastic modulus, Poisson’s ratio, etc.) under high temperature and pressure conditions (Shang., 2004; Song., 2012; Wang et al., 2012; Ren et al., 2020; Chen et al., 2021). In this study, taking the tight sandstone of the Chang 6 Member in the Yanchang Formation as an example, the rock displacement vector was utilized to equivalently characterize the stress-sensitive effect of the reservoir based on a novel numerical simulation software tNavigator. It can introduce rock mechanics parameters into the simulation of ultra-low permeability sandstone reservoir. In addition, a new generation of numerical simulator, the calculation kernel is optimized, the parallel computing efficiency and acceleration ratio are improved. The GPU was used to accelerate the calculation, which significantly reduces the time cost of numerical simulation. By applying this technology to actual oil reservoirs, the non-Darcy flow conditions of low permeability reservoirs can be simulated more accurately.
2 Materials and Methods
2.1 Geological Background and Reservoir
The Triassic strata in the Ordos Basin have experienced complex evolutionary stages of lake basin expansion and eventual shrinkage and extinction. The study area is located in the Zhouwan-Wugucheng area (Figure 1), where tight sandstone reservoirs are developed in the Lower Triassic Yanchang Formation. Moreover, the main reservoir is the Chang 6 Member. The Chang 6 Member belongs to the delta front subfacies deposition, and the underwater distributary channel, channel flanks and inter-distributary bay microfacies are developed.
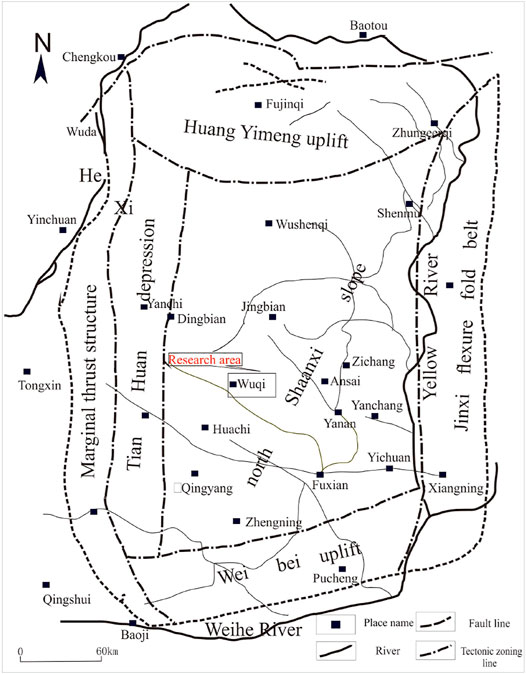
FIGURE 1. Regional overview of the study area.
The experimental procedure of casting thin section: low viscosity epoxy resin impregnated with pigment, casting agent and dyeing agent are injected into the pores of rock under certain temperature and pressure, and the linear epoxy resin is crosslinked into huge molecules with network structure by curing reaction to form hard solid epoxy resin. Then the cast thin sections are made by sticking and grinding procedures. According to the identification results of thin sections and SEM (scanning electron microscope) of 107 sandstone samples taken from 27 wells, the pore types of Chang 6 reservoirs in the study area mainly include intergranular pores, feldspar dissolved pores, and detrital dissolved pores. Intergranular pores are the main type of pores, followed by feldspar dissolved pores, and detrital dissolved and intercrystalline pores are locally visible. The shapes of these pores are mostly triangular and quadrilateral, and the pores are mostly connected by narrow and short throats (Figure 2). Affected by the stress-sensitivity effect, the radius of some narrow and short throats will gradually decrease during the waterflooding development process.
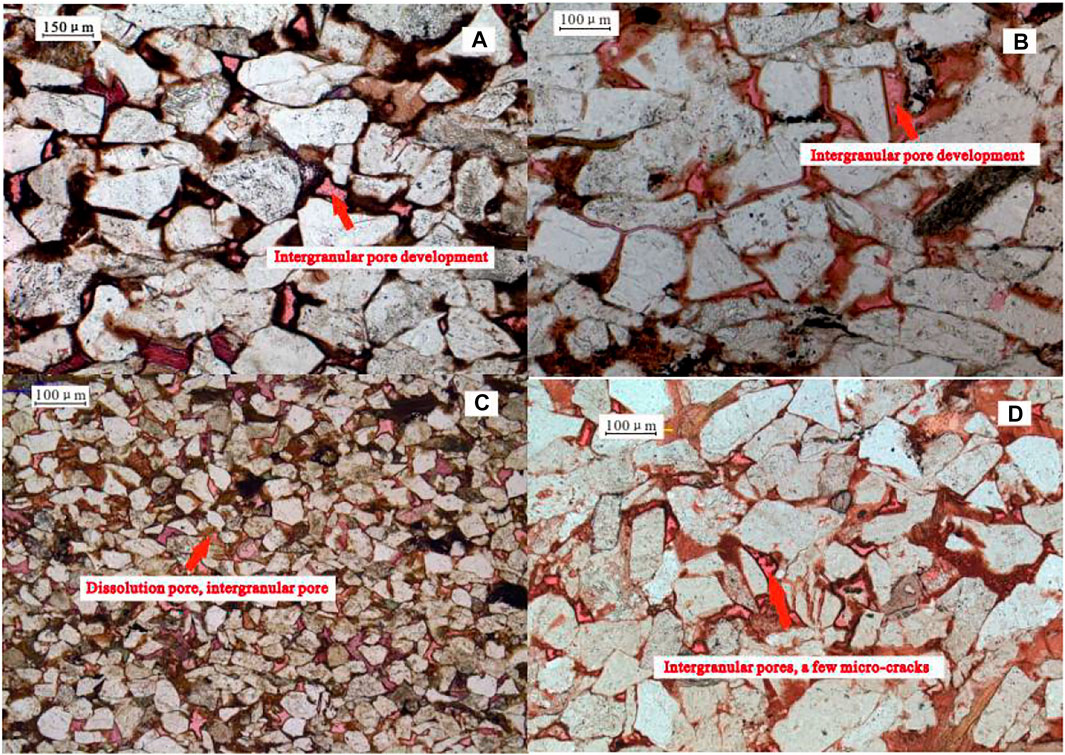
FIGURE 2. Identification of typical sandstone thin sections of the Chang 6 reservoir in the Zhouwan-Wugucheng area. (A) Well B282, Chang 6 Member, 1852.75 m, isolated intergranular pores are developed; (B) Well B516, Chang 6 Member, 1785.94 m, intergranular pores are well-developed; (C) Well B513, Chang 6 Member, 1825.42 m, dissolution and intergranular pores; (D) Well B286, Chang 6 Member, 1773.97 m, intergranular pores and micro-cracks are developed.
In the study, the profile of the Chang 6 Member shows that the subaqueous distributary channel has well continuity and long extension distance in the SW-NE direction, and multi-staged superposed channels are developed. In the NW-SE direction, the underwater distributary channel is cut by interdistributary bay and has poor sand body continuity (Figure 3).
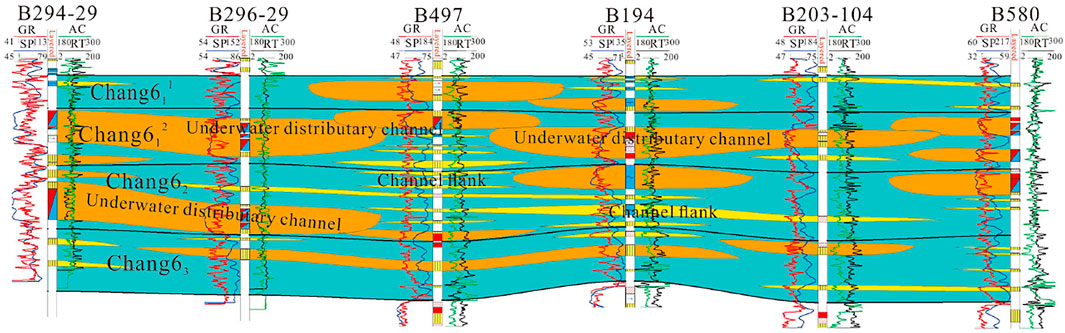
FIGURE 3. Profile of sedimentary microfacies in the Chang6 Member in the study area (SW-NE direction).
2.2 Equivalent Simulation of Starting Pressure Gradient
2.2.1 Equivalent Simulation of Starting Pressure Gradient
The simulation of the starting pressure gradient in the ECLIPSE Software is based on the equilibrium partitions to achieve the minimum pressure setting for fluid percolation between adjacent partitions (Wu et al., 2017). If we set a separate partition for each grid, it will result in a huge number of partitions, the software cannot obtain results through normal operations, and the computational workload is also huge (Xiong et al., 2009; Wang et al., 2020; Yang et al., 2021). However, the tNavigator Software can assign the grids in the work area through the keywords PTHRESHI, PTHRESHJ, and PTHRESHK, and then calibrate the starting pressure gradients in the three directions of I, J, and K. This method can be used to study the variation law of the production index in the work area under different starting pressure gradients (Yang et al., 2010).
The starting pressure gradient of the target layer of the work area measured by the experiment is 0.04 MPa/m, the grid size of the work area is 100 × 80 × 30, and the total number of grids is 240,000. In addition, the starting pressure gradient in the I, J, and K directions between grids in the work area is 0.04 MPa/m, and the keywords are PTHRESHI 240000*0.04, PTHRESHJ 240000*0.04, and PTHRESHK 240000*0.04, respectively.
2.2.2 Optimization of Starting Pressure Gradient
The tNavigator Software can realize the setting of different starting pressure gradients in the I, J and K directions of each grid in the work area according to the reservoir properties and the keyword ARITHMETIC. This technology can restore the seepage states of the fluids inside the reservoir as realistically as possible, thereby greatly improving the simulation accuracy. Figure 4 shows the relationship between the permeability under the condition of the starting pressure gradient and the threshold pressure gradient of the Chang 6 reservoir in the Zhouwan-Wugucheng area obtained from the core experiments. We can get D = 0.0608 K−1.1522. The keywords are:
ARITHMETIC PTHRESHI = 0.0608*PERMX−1.1522;
ARITHMETIC PTHRESHJ = 0.0608*PERMY−1.1522;
ARITHMETIC PTHRESHK = 0.0608*PERMZ−1.1522.
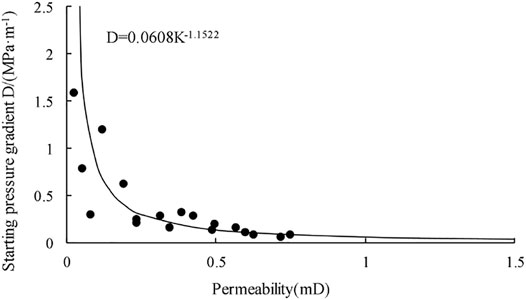
FIGURE 4. Relationship between permeability and starting pressure gradient of the Chang 6 reservoir in Block (B).
Notes: PERMX, PERMY and PERMZ are the permeability in x, y and z directions, respectively. The ARITHMETIC PTHRESHI, the ARITHMETIC PTHRESHJ, and the ARITHMETIC PTHRESHK are the starting pressure gradient values in the x, y, and z directions, respectively.
Furthermore the pressure differential flow method was adopted in the experiment. The basic principle is: after different displacement pressure differences are stabilized, the flow rate of fluid through the core is measured, the relationship between flow rate and pressure gradient is drawn, and the starting pressure gradient is calculated by regression curve (Table 1).
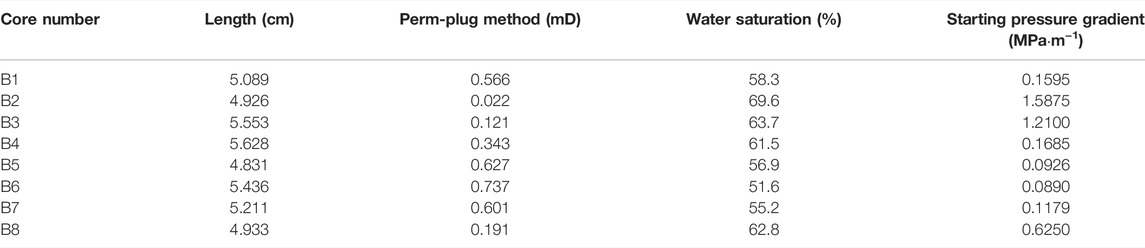
TABLE 1. Oil phase starting pressure gradient under different water saturations.
The starting pressure gradient values for each grid in three dimensions can be obtained, based on the different permeability assignments on each grid throughout the model.
2.3 Equivalent Simulation of Stress-Sensitive Effects
Subsurface porous media rocks are composed of rock particles and pore fluids. During the development stage of the reservoir, the compression of the rock will generate compound stress, which will lead to the deformation and displacement of the rock skeleton (Figure 5). When the pore fluid migrates with the rock skeleton, relative seepage will also occur (Wang et al., 2019).
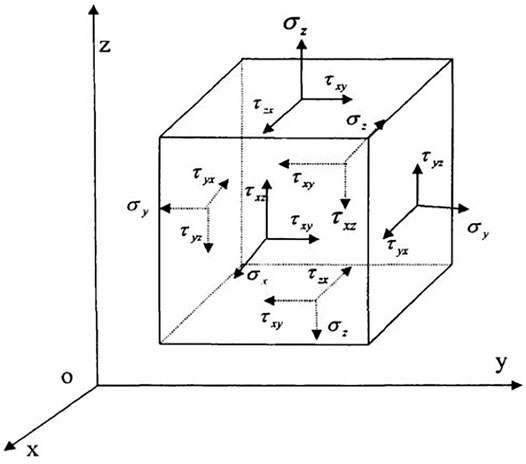
FIGURE 5. Schematic diagram of forces acting on a rock element (Dai., 2006). Notes: σx, σy, σz are normal stresses in x, y, and z directions; τxy and τyx are shear stresses on x and y planes; τxz, τzx are shear stresses on x and z planes; τyz and τzy are shear stresses on y and z planes.
As shown in Figure 5, the reservoir rock can be equivalently regarded as a single hexahedral unit. (Dai., 2006; Ewing et al., 1980; Feng et al., 2018). The opposite sides of the regular hexahedral elements are parallel to each other. And, along the x, y, and z axes, the lengths of each side of the hexahedral unit correspond to dx, dy, and dz, respectively. The nine components on the reservoir rock are shown in Eq. 1. Moreover, the size of the nine components is not only related to the direction of the coordinate axis, but also to the force of the point. The stress state at a certain point inside the rock can be represented in the form of a matrix:
Chen and Ewing., 1999 used the elastic physical equation of porous media is used to describe the relationship between the effective stress and strain of rock, and its general expression is:
Where {σeff} is the stress vector of the rock skeleton, m; {ε} is the strain vector of the rock skeleton, m.
For isotropic elastic media, the generalized Hooke’s law satisfies:
Where Eh and Ev are the elastic moduli of the rock skeleton in the horizontal and vertical directions, respectively, GPa; Gh and Gv are the horizontal and vertical shear moduli of the rock skeleton, GPa, respectively; μhh and μhv are the Poisson’s ratios in the horizontal and vertical directions, respectively; μhv is the Poisson’s ratio of the horizontal deformation caused by the stress in the vertical direction; τeff is the effective shear stress, MPa.
Equation 3 regards the rock skeleton as a plane isotropic medium (homogeneous rock), with Eh = Ev = E, μhv = μhh = μvh = μ, Gh = Gv = G.
Then the physical equation is:
This physical equation can be written in matrix form:
Where [De] is the elastic matrix:
Of which:
Where E, μ, G, Es, and λ are the elastic modulus, Poisson’s ratio, shear modulus, compressive modulus and Lame constant of the homogeneous rock skeleton, respectively.
It can be seen from Eq. 4 that in the development stage of low-permeability reservoirs, the effective stress on the formation rock in the x, y, and z directions remains unchanged when the same pressure drop is maintained. With the increase of rock elastic modulus E and Poisson’s ratio μ, the displacement vectors of rock unit body in x, y and z directions decrease.
In the stress-sensitive simulation based on tNavigator Software, it is necessary to consider the influence of the stress-sensitive effect on the oil well productivity and the swept range of the water injection well. By introducing the elastic modulus E and Poisson’s ratio μ of the rock, the one-way coupling method is used to couple the stress sensitivity and geomechanics to equivalently characterize the rock displacement vectors. This method can be used to analyze the production variation law of different lithologic reservoirs, and visually present the variation of rock displacement vectors on each grid.
3 Results
3.1 Parameter Settings
The numerical simulation model is established with reference to the reservoir and fluid properties and development status of the Chang 6 Member of Block B in the study area. The basic parameters of the mechanism model are as follows:
(1) Grid number, NX = NY = 90, NZ = 5;
(2) Geometric size of the model, 900 m × 900 m × 50 m;
(3) Permeability, Kx = Ky = 0.5 mD, Kz = 0.05 mD;
(4) Porosity: 12%;
(5) Top depth: 1,950 m;
(6) Formation pressure: 28.9 MPa;
(7) Edge and bottom water are not considered;
(8) The oil-water relative permeability curves under different oil-water viscosity ratios were measured by the steady-state method. The relative permeability curves of oil and water are shown in Figure 6. The Chang 6 reservoir in the study area is a high water-saturated reservoir with low porosity and low permeability. The larger the reservoir porosity, the better the petrophysical properties and the higher the water saturation. In addition, the Chang 6 Member reservoir has strong heterogeneity, complex pore structures, and large two-phase seepage disturbance. Due to the large capillary resistance and weak seepage capacity, the irreducible water saturation of the Chang 6 reservoir is high.
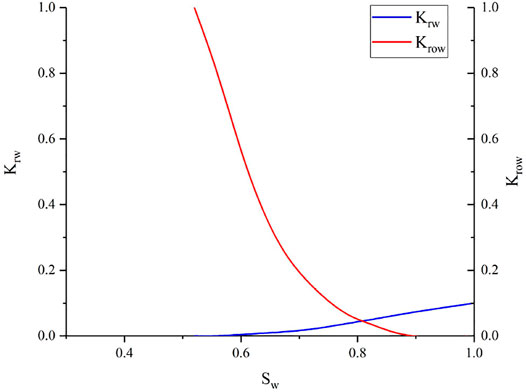
FIGURE 6. Relative permeability curves of oil-water two-phase.
3.2 Equivalent Method Validation
The seepage velocity expression of the quasi-start pressure gradient model is:
Where v is the seepage velocity, m/s; K is the reservoir matrix permeability, mD; μ is the crude oil viscosity, mPa s; c is the pseudo starting pressure gradient, MPa/m; Δp is the pressure difference between the two ends of the grid at distance L, MPa.
According to the theory of limit well spacing, Douglas et al. (1983) used the pressure gradient out of the maximum flowable distance should be greater than the starting pressure gradient. The pressure difference Δp satisfies:
For a reservoir with a matrix permeability of 1 mD, when the production pressure difference is 4.5 MPa, the maximum production range when the starting pressure gradient is considered is 100 m. Furthermore, the limit production range predicted by the model set by this method is also 100 m. Thus, the accuracy of this method is verified. When the starting pressure gradient is not considered, the production range predicted by the model is more than 300 m, which has a large error (Figure 7).
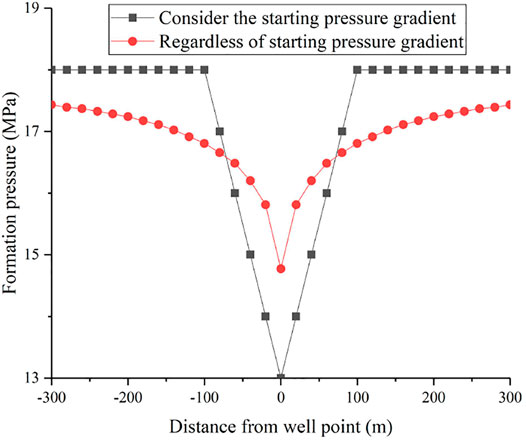
FIGURE 7. Variation characteristics of formation pressure around wellbore.
Rock mechanics parameter experiment: a solid cylindrical specimen with the same height and diameter is subjected to a relative compressive linear load in the diameter direction to fracture along the plane controlled by the load. Then, the tensile strength of the rock is obtained according to the elastic theory. In this study, a total of 8 standard cores were used to verify the effect of rock brittleness on reservoir stress sensitivity. Through rock mechanics experiments, the Poisson’s ratio and mineral composition of eight groups of samples were measured (Table 2).
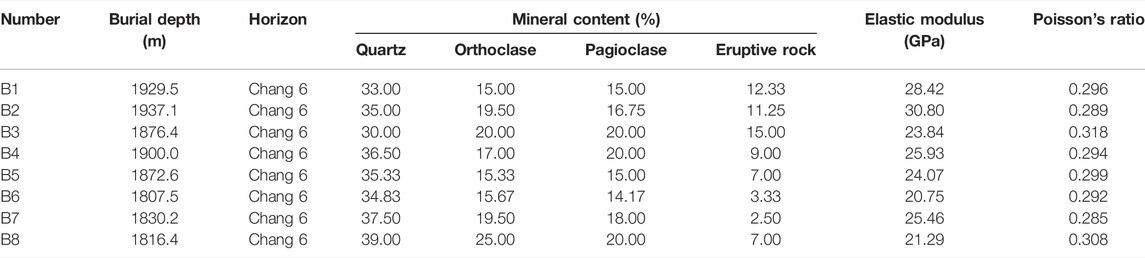
TABLE 2. Test results of mineral composition and rock mechanical parameters.
It can be seen from Table 2 that the elastic moduli of the rock samples are distributed in the range of 20.75–30.80 GPa, and the Poisson’s ratio is distributed in the range of 0.285–0.318. The internal components of the tight sandstone in the target layer are mainly quartz, potassium feldspar, plagioclase and eruptive rocks.
The strain characteristics of matrix reservoirs can be analyzed according to the stress-deformation method of the fluid-solid dual medium model (Wu et al., 2014). Then, the changes of permeability and porosity caused by rock mass deformation are:
Among them, φmi and kmi are the original porosity and permeability, respectively.
The mean effective stress is:
The existence of stress-sensitive effect makes oil well production decrease (Liu., 2014). The formula for calculating the oil recovery index considering the stress-sensitive effect is:
Among them, Jo is the oil production index, m3 day−1 MPa−1; h is the effective reservoir thickness, m; Bo is the coefficient of crude oil formation volume; re is the oil supply radius, m; rw is the wellbore radius, m; kmi is the original permeability, mD.
The relationship between the production pressure difference and the change in permeability is:
Where α is the stress sensitivity coefficient.
Affected by stress sensitivity, the reservoir matrix undergoes elastic deformation as the production pressure difference increases. Compared with the conventional stress-sensitive equivalent characterization method, it can be seen that the oil recovery index obtained by the method used in this study is closer to the actual data, and the model accuracy is significantly improved (Figure 8). It is also known from Eqs 10 and 13 that when the permeability change value is constant, the production pressure difference is negatively correlated with the average effective stress.
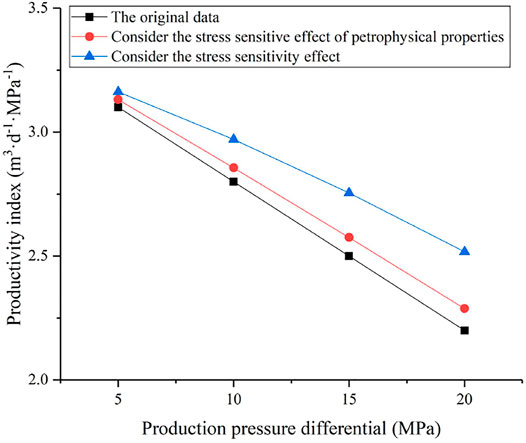
FIGURE 8. Relationship between production pressure difference and oil recovery index.
4 Discussion
In this study, we established two numerical simulation models: a homogeneous and a heterogeneous permeability model, and they both adopted a diamond-shaped inverse nine-spot well pattern. The influence of stress-sensitive effects on the productivity of ultra-low permeability reservoirs has been systematically studied, taking into account the starting pressure gradient. The rock is sensitive to stress, and the larger the elastic modulus value E, the smaller the deformation of the rock under stress. Poisson’s ratio expresses the ratio of the strain ε1 in the vertical direction to that in the loading direction. Within the elastic deformation of the rock, μ is a coefficient that measures the lateral strain capacity of the rock. Therefore, under the same elastic modulus of rock, the larger the Poisson’s ratio, the weaker the stress-sensitive effect of the rock.
4.1 Effects of Stress Sensitivity on Reservoir Development
In this study, a shear modulus G = E/[2(1+μ)] was introduced. The value ranges of elastic modulus and Poisson’s ratio of different types of sandstone are shown in Table 3. The shear modulus is used to characterize the stiffness of the rock in the numerical model. The larger the shear modulus value, the smaller the deformation of the rock during compression or tension. The results of rock mechanics parameters are shown in Table 4.
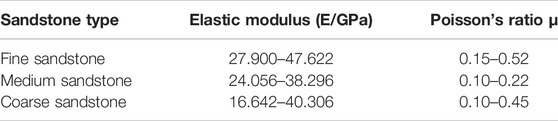
TABLE 3. Young’s modulus and Poisson’s ratio of different types of sandstones.

TABLE 4. The results of mechanical parameters in the Chang 6 reservoir.
Under different shear modulus conditions (Figure 9), the reservoir stress sensitivity is weaker when the starting pressure gradient is not considered. Affected by the starting pressure gradient, the reservoir stress sensitivity is strong, and the production range of the oil well is reduced. In addition, the formation pressure changes sharply during constant liquid production, the rock displacement vector increases, the matrix permeability decreases, and the difference in cumulative oil production increases as well.
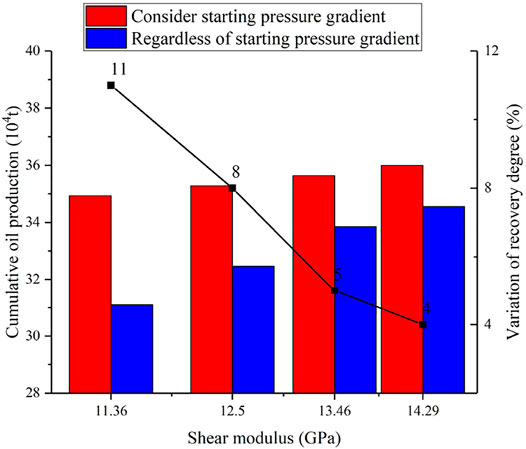
FIGURE 9. Cumulative oil production under different shear modulus conditions.
Figure 10 different degrees of starting pressure gradient exist in the development process of ultra-low permeability oil and gas fields. Therefore, the increase of rock shear modulus G is accompanied by the change of bottom hole pressure. The rock displacement vector and variation range near the wellbore of the oil wells are reduced, which has a strong impact on the productivity of ultra-low permeability reservoirs with starting pressure gradients. It can be seen from Figure 9 that when the rock shear modulus is 14.29 GPa, the cumulative oil production decreases by 4.1%; when the rock shear modulus is 11.36 GPa, the cumulative oil production decreases by 11.2%.
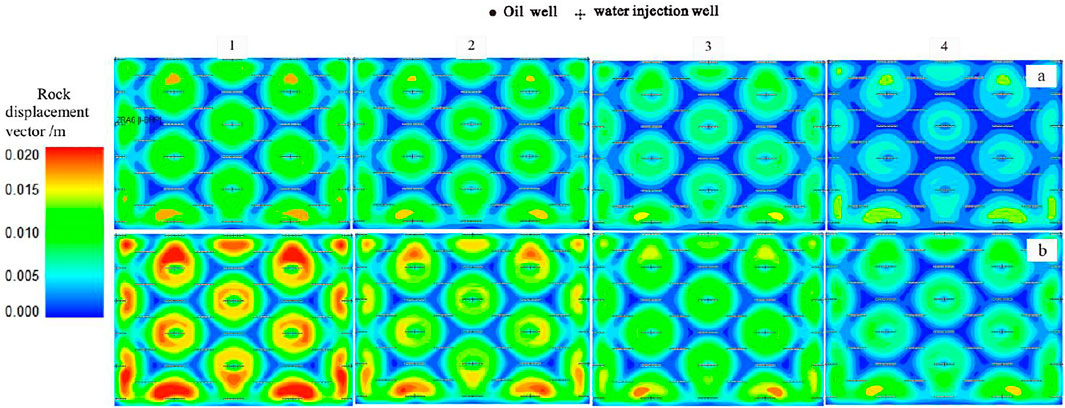
FIGURE 10. Rock displacement vector diagrams based on different shear modulous values considering starting pressure gradient: (A) Pressure gradient is not considered, (B) Starting pressure gradient is considered.
4.2 Case Analysis
The main producing layer of the Chang 6 reservoir in the study area is Chang 61, the reservoir is buried at a depth of 1,950 m, the average reservoir thickness is 28.2 m, and the original formation pressure is 28.9 MPa. In addition, the Chang 6 reservoir has an average porosity of 11.1%, an average permeability of 0.59 mD, and a crude oil density of 0.8225 g/cm3. The model contains four layers from top to bottom: chang 611 (model layer 1), chang 612 (model layer 2), chang 62 (model layer 3–4), chang 63 (model layer 5–6). Figure 11 is the planar distribution of the three-dimensional porosity of the target layer.
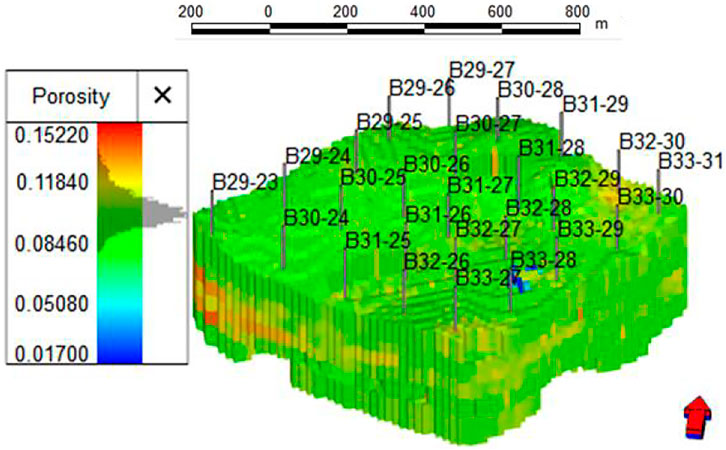
FIGURE 11. Schematic diagram of geological model of the target layer in the study area.
Figures 12–14 show the comparisons of daily oil production, water cut and recovery degree of the non-Darcy seepage model equivalently characterized by the method in this study under the condition of diamond reverse nine-spot well pattern. When the two factors of stress sensitivity and starting pressure gradient are not considered, the recovery degree of the target layer is 35.0%. When only stress sensitivity is considered, the pressure of the well group remains relatively stable in the early stage of development; however, as the development period increases, the pressure drop of the well group begins to become significant, which in turn leads to a decrease in reservoir permeability. Furthermore, the daily oil production of the oil well gradually decreased, and the recovery degree was 34.8%. Usually, it is affected by differences in oil and water viscosity, when only the starting pressure gradient is considered, it is difficult for crude oil to break through its own seepage resistance. However, the impact of the starting pressure gradient on the formation water is relatively small, and the water cut rises rapidly, resulting in water channeling. At this time, the production capacity of oil wells declined, and the recovery rate of daily oil production was only 31.9%. When both factors are considered, the reservoir stress sensitivity effect is strong due to the influence of the starting pressure gradient. In addition, the rock displacement vectors in the plane increase, and the permeability decreases greatly. At this time, the daily oil production of the oil well decreased significantly, and the recovery degree was 30.9%. Therefore, comparing the results of different factors, when only the starting pressure gradient is considered, the recovery degree of the target layer decreases by 8.8%; when only the stress-sensitive effect is considered, the recovery degree of the target layer decreases by 0.5%; when both factors are considered, the recovery degree of the target layer decreases by 11.7%.
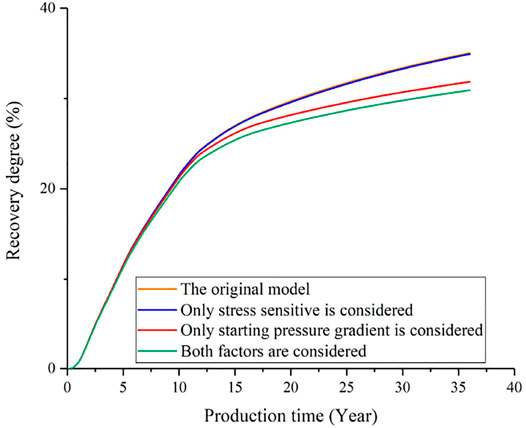
FIGURE 12. Recovery degree of the Chang 6 reservoir considering different stress factors.
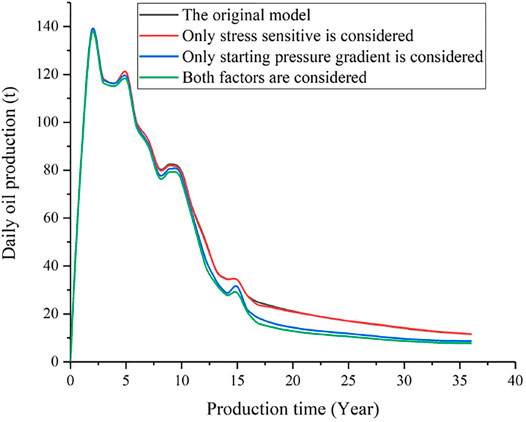
FIGURE 13. Daily oil production of the Chang 6 reservoir considering different factors.
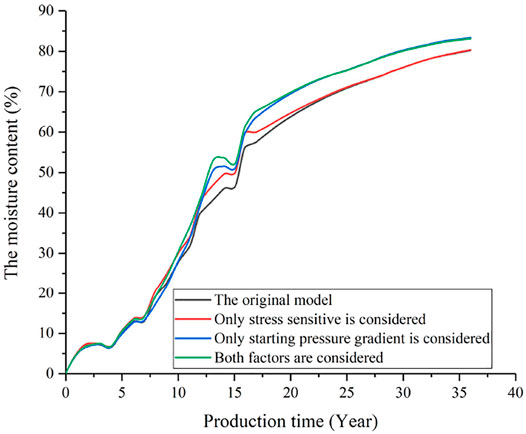
FIGURE 14. Water cut curves of the Chang 6 reservoir considering different factors.
Comparing Figures 15A,B, it can be seen that when both factors are considered, due to the influence of the starting pressure gradient, the crude oil in the reservoir cannot break through its own seepage resistance, and the pressure variation range near the wellbore of some oil wells expands. Furthermore, it leads to an increase in the swept range of the variation of the reservoir rock displacement vector, and the target layer exhibits relatively strong stress sensitivity.
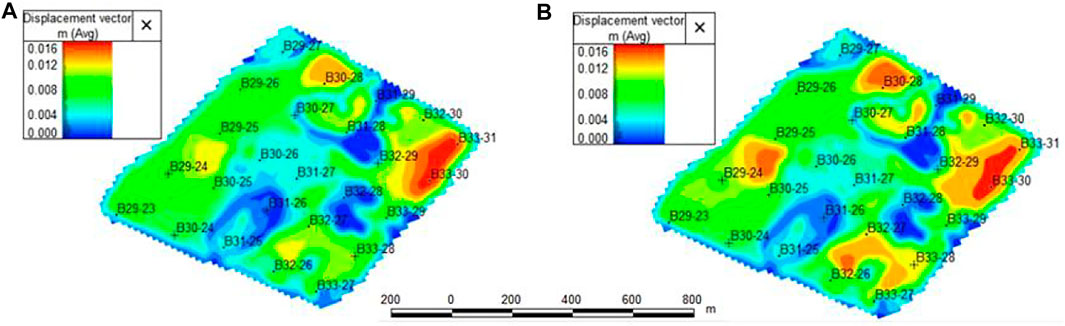
FIGURE 15. Plane distribution of displacement vector of the target layer in the study area: (A) Only stress sensitive is considered, (B) Both starting pressure gradients and stress-sensitive effects are considered.
Based on this study, it can be seen that in the development process of ultra-low permeability sandstone reservoirs, the simulation results have higher accuracy when the stress-sensitive effects considering rock properties and starting pressure gradients are introduced. However, in low-permeability sandstone reservoirs, the influence of natural fractures is usually taken into account, which is a current research difficulty in reservoir numerical simulation. The method in this study can also be applied to the numerical simulation study of ultra-low permeability sandstone reservoirs considering natural fractures.
5 Conclusion
(1) For ultra-low permeability sandstone reservoirs, the elastic modulus and Poisson’s ratio of rock are used to equivalently characterize the stress-sensitive effect in this study, and a new method for equivalently characterizing stress-sensitivity in numerical simulation is proposed. Through verification, the calculation results of this model are consistent with the actual situation.
(2) When the starting pressure gradient is considered, with the increase of the shear modulus of the rock, the deformation resistance of the rock increases, the reservoir stress sensitivity decreases, and the cumulative oil production increases. Considering the starting pressure gradient, when the rock shear modulus is 14.29 GPa, the cumulative oil production decreases by 4.1%; when the rock shear modulus is 11.36 GPa, the cumulative oil production decreases by 11.2%.
(3) A numerical simulation was conducted with Block B in the Zhouwan-Wugucheng area as an example. The model can accurately predict the reservoir stress sensitivity based on the starting pressure gradient. When both the starting pressure gradient and stress sensitivity are considered, the crude oil recovery degree of the target layer decreases by 11.7%; when only the starting pressure gradient is considered, the crude oil recovery degree decreases by 8.8%; and when only the stress sensitivity is considered, the crude oil recovery degree decreases 0.5%.
Data Availability Statement
The original contributions presented in the study are included in the article/Supplementary Material, further inquiries can be directed to the corresponding authors.
Author Contributions
XL is responsible for the idea and writing of this paper and XW, ZW, TH, XQ, FY and CT are responsible for the data interpretation.
Conflict of Interest
XW, TH and FY were employed by the Geological Research Institute of No. 9 Oil Production Plant, Changqing Oilfield, CNPC.
The remaining authors declare that the research was conducted in the absence of any commercial or financial relationships that could be construed as a potential conflict of interest.
Publisher’s Note
All claims expressed in this article are solely those of the authors and do not necessarily represent those of their affiliated organizations, or those of the publisher, the editors and the reviewers. Any product that may be evaluated in this article, or claim that may be made by its manufacturer, is not guaranteed or endorsed by the publisher.
References
Cai, J., W., Wei, X., Hu, R, Liu., and Wang, J. (2017). Fractal Characterization of Dynamic Fracture Network Extension in Porous media. Fractals 25 (02). 1750023. doi:10.1142/s0218348x17500232
Chen, G. B., Li, T., Yang, L., Zhang, G. H., Li, J. W., and Dong, H. J. (2021). Mechanical Properties and Failure Mechanism of Combined Bodies with Different Coal-Rock Ratios and Combinations. J. Mining Strata Control. Eng. 3 (2), 023522. doi:10.13532/j.jmsce.cn10-1638/td.20210108.001
Chen, Z., and Ewing, R. (1999). Mathematical Analysis for Reservoir Models. SIAM J. Math. Anal. 30 (2), 431–453. doi:10.1137/s0036141097319152
Chen, Z., Liao, X., Yu, W., and Sepehrnoori, K. (2019). Pressure-Transient Behaviors of Wells in Fractured Reservoirs with Natural- and Hydraulic-Fracture Networks. SPE J. 24 (01), 375–394. doi:10.2118/194013-pa
Dai, P. (2006). Experiment and Numerical Simulation of Low Permeability Stress Sensitive Reservoir. Chengdu. Southwest Petroleum University, 70–73.
Dong, L. F., Yue, X. A., Xu, X., Su, Q., and Song, W. X. (2015). Experimental Study on Stress Sensitivity of Reservoirs with Different Permeability. Geol. Sci. Technol. Inf. 34 (06), 155–158. doi:10.1021/acsomega.1c00259
Douglas, J. J., Ewing, R. E., and Wheeler, M. F. (1983). The Approximation of the Pressure by a Mixed Method in the Simulation of Miscible Displacement. RAIRO. Anal. Numér. 17 (1), 17–33. doi:10.1051/m2an/1983170100171
Ewing, R. E., and Wheeler, M. F. (1980). Galerkin Methods for Miscible Displacement Problems in Porous media. SIAM J. Numer. Anal. 17 (3), 351–365. doi:10.1137/0717029
Feng, Y. L., Liu, Y. T., and Ding, Z. P. (2018). Deformation Characteristics and Dynamic Permeability Model of a Group of Parallel Fractures. Fault-block oil & gas field 25 (6), 736–741. doi:10.6056/dkyqt201806010
Francesconi, A. (1995). Sand Body Geometry and Permeability Areal Distribution in Fluvial Sandstones Reservoir. AAPG Bull. 79 (8), 199512. doi:10.1306/8d2b273b-171e-11d7-8645000102c1865d
Gao, F. Q. (2021). Influence of Hydraulic Fracturing of strong Roof on Mining-Induced Stress Insight from Numerical Simulation. J. Mining Strata Control. Eng. 3 (2), 023032. doi:10.13532/j.jmsce.cn10-1638/td.20210329.001
Geng, Y., Tang, D., Xu, H., Tao, S., Tang, S., Ma, L., et al. (20172017). Experimental Study on Permeability Stress Sensitivity of Reconstituted Granular Coal with Different Lithotypes. Fuel 202, 12–22. doi:10.1016/j.fuel.2017.03.093
Guo, L. L., Zhou, D. W., Zhang, D. M., and Zhou, B. H. (2021). Deformation and Failure of Surrounding Rock of a Roadway Subjected to Mining-Induced Stresses. J. Mining Strata Control. Eng. 3 (2), 023038. doi:10.13532/j.jmsce.cn10-1638/td.20200727.001
Hansbo, S. (1990). Consolidation of clay, Eith Special Reference to Influence of Vertical Sanddrains. Swedish Geotech. Inst. Proc. 18, 41.
He, X., Zhang, P., He, G., Gao, Y., Liu, M., Zhang, Y., et al. (2020). Evaluation of Sweet Spots and Horizontal-Well-Design Technology for Shale Gas in the basin-margin Transition Zone of southeastern Chongqing, SW China. Energ. Geosci., 1(3–4), 134–146. doi:10.1016/j.engeos.2020.06.004
Hong, D., Cao, J., Wu, T., Dang, S., Hu, W., and Yao, S., (2020). Authigenic clay Minerals and Calcite Dissolution Influence Reservoir Quality in Tight Sandstones: Insights from the central Junggar Basin, NW China. Energ. Geosci., 1(1–2), 8–19. doi:10.1016/j.engeos.2020.03.001
Hower, J. C., and Groppo, J. G., (2021). Rare Earth-Bearing Particles in Fly Ash Carbons: Examples from the Combustion of Eastern Kentucky Coals, Energ. Geosci., 2(2), 90–98. doi:10.1016/j.engeos.2020.09.003
Hu, Z. M., Ba, Z. B., and Xiong, W. (2006). Analysis of Micro-pore Structure in Low Permeability Reservoirs. J. A Pet. Inst. 30 (3), 51–53. doi:10.3969/j.issn.2095-4107.2006.03.016
Jiao, C. Y., He, S. L., and Xie, Q. (2011). An Experimental Study on Stress-dependent Sensitivity of Ultra-low Permeability sandstone Reservoirs. Acta Pet. Sin 32 (3), 489–494. doi:10.7623/syxb201103018
Lei, Q., Xiong, W., Yuang, J., Cui, Y., and Wu, Y. S. (2007). Analysis of Stress Sensitivity and its Influence on Oil Production from Tight Reservoirs. Lexington: Eastern Regional Meeting, 34–36.
Li, L., and Li, S. J. (2021). Evolution Rule of Overlying Strata Structure in Repeat Mining of Shallow Close Distance Seams Based on Schwarz Alternating Procedure. Journal of Mining and Strata Control. Engineering 3 (2), 023515. doi:10.13532/j.jmsce.cn10-1638/td.20210225.001
Li, Y., Zhou, D.-H., Wang, W.-H., Jiang, T.-X., and Xue, Z.-J., (2020). Development of Unconventional Gas and Technologies Adopted in China, Energ. Geosci., 1(1–2), 55–68. doi:10.1016/j.engeos.2020.04.004
Liu, J. J., Liu, X. G., and Zeng, L. F. (2001). Dynamic Simulation of Permeability Change in Low Permeability Fractured Reservoir. J. liaoning Tech. Univ. (natural science) 20 (4), 543–545. doi:10.3969/j.issn.1008-0562.2001.04.058
Liu, S. D. (2014). Analysis of Productivity Factors Affecting Low Permeability Stress Sensitive Reservoir. Sci. Tech. Enterprise (10), 287–288. doi:10.13751/j.cnki.kjyqy.2014.10.269
Lu, J. F., and Wang, D. (1999). Kemper. Intrinsic Permeability of clay as Affected Byclay-Water Interaction. Soil Sci. 88 (2), 83.
Lv, C. Y., Wang, J., and Sun, Z. G. (2002). An Experimental Study on Starting Pressure Gradient of Fluids Flow in Low Permeability Sandstone Porous Media. Pet. Exploration Dev. 29 (2), 86–89. doi:10.3321/j.issn:1000-0747.2002.02.023
Mahmud, H. B., Bin Muhammad Hisham, M. H., Mahmud, W. M., Leong, V. H., and Shafiq, M. U., (2020). Petrophysical Interpretations of Subsurface Stratigraphic Correlations, Baram Delta, Sarawak, Malaysia. Energ. Geosci., 1, (3–4), 100–114. doi:10.1016/j.engeos.2020.04.005
Maksim, E. (2019). Numerical Simulation of Multiphase Non-darcy Flows Generalized Approach. Calgary, Alberta, Canada: SPE, 199769. doi:10.2118/199769-STU
Meng, Z., and Li, G. (2013). Experimental Research on the Permeability of High-Rank Coal under a Varying Stress and its Influencing Factors. Eng. Geology. 162, 108–117. doi:10.1016/j.enggeo.2013.04.013
Mitchell, J. K. (1967). Younger. Abnormalities in Hydraulic Flow Throughfine-Grained Soils. ASTM Spech 417, 106–141.
Mohammed, B., Richard, H. W., Shettima, B., and Philip, S., (2021). Diagenesis and its Controls on Reservoir Quality of the Tambar Oil Field, Norwegian North Sea. Energ. Geosci., 2(1), 10–31. doi:10.1016/j.engeos.2020.07.002
Qian, G. B., Jiang, X. H., and Zhang, H. M. (2021). Numerical Simulation Study of Water Injection Development in an Extra-low Permeability Fractured Reservoir. Beijing, China: XG Oilfield, SPE, 64794. doi:10.2118/64794-MS
Ren, J. W., Wang, X. J., and Zhang, X. M. (2020). Refracturing and Fracture Parameters Optimization Simulation for Horizontal Well in Daqing Tight Oil Reservoir. Fault Z. Block Oil Gas Field 27 (5), 638–642. doi:10.6056/dkyqt202005018
Ruan, M., and Wang, L. G. (2002). Low-permeability Oilfield Development and Pressure-Sensitivity Effect. Acta Pet. Sin 23 (3), 73–76. doi:10.7623/syxb200203016
Shang, G. H. (2004). Study on Nonlinear Seepage Law of Low Permeability. Beijing: Institute of Seepage Fluid Mechanics, Chinese Academy of Sciences, 23–26.
Shi, L. J., Chen, J. G., and Jia, Z. Q. (1999). Low Non-darcy Percolation Characteristics of Single Phase Fluids in A Eastern Low Permeability Reservoirs. J. A Pet. Inst. 23 (2), 82. doi:10.3969/j.issn.2095-4107.1999.02.027
Song, C. T. (2012). Numerical Reservoir Simulation Considering Threshold Pressure Gradient and Stress Sensitive Phenomenon. Sci. Technol. Eng. 25 (12), 6319–6327. doi:10.3969/j.issn.1671-1815.2012.25.014
Tian, Y. (2014). Experimental Study on Stress Sensitivity of Naturally Fractured Reservoirs. Amsterdam: SPE Annual Technical Conference and Exhibition, 23–25.
Todd, M. R., O’Dell, P. M., and Hirasaki, G. J. (2016). Methods for Increased Accuracy in Numerical Reservoir Simulators. Soc. Pet. Eng. 3516 (6), 515–530.
Von E, W., and Tunn, W. L. M. (1995). The Flow of Fluids through Sandstones. Stategeol. Surv. 194, 1–17.
Wang, G. C., Li, L. K., and Wang, P. (2012). A New Method for Equivalent Simulation of Starting Pressure in Numerical Simulation Software. Sci. Technol. Eng. 12 (1), 165–167. doi:10.3969/j.issn.1671-1815.2012.01.039
Wang, H., Shi, Z., Zhao, Q., Liu, D., Sun, S., Guo, W., et al. (2020). Stratigraphic Framework of the Wufeng-Longmaxi Shale in and Around the Sichuan Basin, China: Implications for Targeting Shale Gas. Energ. Geosci., 1(3–4), 124–133. doi:10.1016/j.engeos.2020.05.006
Wang, L., Yang, X. Y., Gong, P. Z., Zhang, J. T., and Zhang, B. (2019). Study on Stress Sensitivity of Middle-Deep Reservoirs in Bohai Sea: A Case Study of Kenli A Oilfield. Pet. Geology. Eng. 35 (03), 50–54. doi:10.3969/j.issn.1673-8217.2021.03.010
Wang, S., Ji, T., Tan, X. H., Wang, L., and Zhang, S. H. (2016). Permeability Limits of Advanced Water Injection Technology in Low Permeability Reservoirs. SPE-182431-MS, Paper Presented at the Asia Pacific Oil & Gas Conference and Exhibition, Perth, Australia. October 2016. 25–27. doi:10.2118/182431-ms
Wang, X., Thauvin, F., and Mohanty, K. K. (1999). Non-Darcy Flow through Anisotropic Porous media. Chem. Eng. Sci. 54, 1859–1869. doi:10.1016/s0009-2509(99)00018-4
Wu, D., Ju, B., Wu, S., Brantson, E. T., Fu, Y., and Lei, Z. (2017). Investigation of Productivity Decline in Inter-salt Argillaceous Dolomite Reservoir Due to Formation Damage and Threshold Pressure Gradient: Laboratory, Mathematical Modeling and Application. Energy Exploration & Exploitation 35 (1), 33–53. doi:10.1177/0144598716684308
Wu, H. Q., Peng, X. L., and Zhu, S. Y. (2021). Economic Decision of Shale Reservoir Based on Numerical Simulation and Integration of Reservoir Development and Management. Pet. Reservoir Eval. Dev. 11 (3), 404–413. doi:10.13809/j.cnki.cn32-1825/te.2021.03.016
Wu, J. L., Liu, Y. T., and Luo, J. (2014). Numerical Simulation of Fluid-Structure Interaction in Fractured Stress-Sensitive Reservoir. Chin. J. Comput. Phys. 31 (04), 455–464. doi:10.3969/j.issn.1001-246X.2014.04.011
Wu, Y. Z., Wang, Y., and Ma, D. (2020). Reservoir Simulation of Waterflooding under the Influence of Dynamic Fractures for Tight Oil Reservoir. Sci. Tech. Eng. 20 (27), 11059–11066. doi:10.3969/j.issn.1671-1815.2020.27.012
Xiong, W., Lei, Q., and Liu, X. G. (2009). Pseudo Threshold Pressure Gradient to Flow for Low-Permeability Reservoirs. Pet. Explor 36 (2), 232–235. doi:10.3321/j.issn:1000-0747.2009.02.015
Xu, J. C., Jiang, R. Z., Xie, L. S., Wang, R. H., and Shan, L. J. (2021). Non-Darcy Flow Numerical Simulation for Low-Permeability Reservoirs SPE, 154890.
Xu, T., Huang, H. L., Xiu, D. Y., Kang, H. J., and Sun, H. T. (2014). A New Method for Stress Sensitivity Evaluation of Low Permeability Reservoirs. Spec. oil gas reservoirs 21 (06), 126–129. doi:10.3969/j.issn.10066535.2014.06.031
Xue, F., Liu, X. X., and Wang, T. Z. (2021). Research on Anchoring Effect of Jointed Rock Mass Based on 3D Printing and Digital Speckle Technology. J. Mining Strata Control. Eng. 3 (2), 023013. doi:10.13532/j.jmsce.cn10-1638/td.20201020.001
Yang, X. F., Lei, Q. H., and Wang, R. F. (2021). Comparative Analysis of Start-Up Pressure Gradient of Tight Oil Reservoir in Ordos Basin. Chin. J. Geophys. 36 (1), 310–317. doi:10.6038/pg2021DD0412
Yang, Z. M., Yu, R. Z., and Su, Z. X. (2010). Numerical Simulation of Nonlinear Seepage Flow in Ultra-low Permeability Reservoir. Pet. exploration Dev. 37 (1), 94–98. doi:10.7623/syxb201102017
Zhao, K. K., Jiang, P. F., Feng, Y. J., Sun, X. D., Cheng, L. X., and Zheng, J. W. (2021). Investigation of the Characteristics of Hydraulic Fracture Initiation by Using Maximum Tangential Stress Criterion. J. Mining Strata Control. Eng. 3 (2), 023520. doi:10.13532/j.jmsce.cn10-1638/td.20201217.001
Keywords: starting pressure gradient, stress sensitivity, equivalent characterization, ultra-low permeability reservoir, numerical simulation
Citation: Luo X, Wang X, Wu Z, He T, Qiu X, Yuan F and Tan C (2022) Study on Stress Sensitivity of Ultra-Low Permeability Sandstone Reservoir Considering Starting Pressure Gradient. Front. Earth Sci. 10:890084. doi: 10.3389/feart.2022.890084
Received: 05 March 2022; Accepted: 01 April 2022;
Published: 19 April 2022.
Edited by:
Wenlong Ding, China University of Geosciences, ChinaReviewed by:
Peng Dai, Chinese Academy of Geological Science, ChinaChong Zhang, Chengdu University of Technology, China
Copyright © 2022 Luo, Wang, Wu, He, Qiu, Yuan and Tan. This is an open-access article distributed under the terms of the Creative Commons Attribution License (CC BY). The use, distribution or reproduction in other forums is permitted, provided the original author(s) and the copyright owner(s) are credited and that the original publication in this journal is cited, in accordance with accepted academic practice. No use, distribution or reproduction is permitted which does not comply with these terms.
*Correspondence: Zhonghu Wu, d3V6aG9uZ2h1Z3p1QDE2My5jb20=; Chengqian Tan, MTA5ODM2NDgxMEBxcS5jb20=