 Xiaoli Xia
 Jinzhong Min3
- 1Jiangsu Key Laboratory of Environmental Engineering, Jiangsu Provincial Academy of Environmental Science, Nanjing, China
- 2College of Tourism, Resources and Environment, Zaozhuang University, Zaozhuang, China
- 3Key Laboratory of Meteorological Disaster of Ministry of Education (KLME), Nanjing University of Information Science & Technology, Nanjing, China
Aerosols are the main components of air pollutants, which are closely related to haze, dust storm and air pollution. In this study, an aerosol data assimilation system was developed using Gridpoint Statistical Interpolation (GSI) system to assimilate the Aerosol Optical Depth (AOD) observations from FY4 and Himawari-8 for the first time and applied in the heavy dust case over east Asia in March 2018. Three parallel experiments assimilated AOD from FY4, Himawari-8 and both the FY4 and Himawari-8 respectively and a control experiment which did not employ DA were performed. The hourly aerosol analyses and forecasts are compared with the assimilated FY-4 AOD, Himawari-8 AOD and independent AOD from Aerosol Robotic Network (AERONET). The results showed that all forms of DA experiments improved a low Bias and the RMSE reduced about 20%. The aerosol data assimilation with observations from both the FY-4 and Himawari-8 satellites substantially improved aerosol analyses and subsequent forecasts with more abundant aerosol observation information, especially over the northwest of China. This study indicates that the new generation geostationary meteorological satellites have potential to dramatically contribute to air quality forecasting.
1 Introduction
With rapid economic growth and accelerated urbanization, subsequent air pollution is becoming increasingly serious (Zhao et al., 2020). Aerosols are the main components of air pollutants, are closely related to haze, dust storms, and air pollution, and are present in very small amounts in the composition of the earth’s atmosphere. However, atmospheric aerosols have a direct impact on climate, including the energy budget of atmospheric radiation, changes in the microscopic and macroscopic characteristics of clouds, and indirect effects of atmospheric chemical processes (Hansen et al., 1997; Koren et al., 2004; Rosenfeld et al., 2008; Wilcox, 2012). Not only can they worsen air quality and reduce visibility, but they can also have an impact on human health, the environment, and climate change (Tie et al., 2009; Chen et al., 2017; Sicard et al., 2017; Liu et al., 2018; Zhao et al., 2018).
With continuous progress in satellite detection technology, satellite remote sensing can play a vital role in the study of atmospheric aerosols. Satellite observation can partly make up for the deficiency of conventional observation. Many studies have found that data assimilation can improve the level of model prediction (e.g., Zhang and Reid, 2006; Shen et al., 2022; Xu et al., 2022). Meteorological satellites are usually classified as geostationary (in geosynchronous orbit) or polar-orbiting (in sun-synchronous orbit) according to their orbits (Zou et al., 2011; Xu et al., 2013; Yang et al., 2017; Wang et al., 2020). Polar orbit meteorological satellites orbit the earth’s polar regions at an altitude of about 1,000 km. They are low-orbit satellites with an operating period of approximately 115 min. Polar-orbit satellites can monitor the global atmosphere and provide high-resolution products. However, they can only observe the same area twice a day and thus may miss rapidly developing dust storms. Conversely, geostationary satellites are high-orbit satellites, with an operational height of at least 35,786 km. Geostationary satellites have a large monitoring range and high temporal resolution, which are necessary for monitoring the development of rapidly evolving weather systems (Stengel et al., 2009; Yumimoto, 2013; Shen and Min, 2015; Li and Zou, 2017; Yang et al., 2017; Xia et al., 2019a). Many studies have found that meteorological data from geostationary satellites play an increasingly significant role in many weather applications, including monitoring heavy rain, severe weather, typhoons, and air pollution as a result of the high temporal resolution (Stuhlmann et al., 2005; Schmit et al., 2008; Yu et al., 2009; Goodman et al., 2012; Greenwald et al., 2016; Min et al., 2017).
In recent years, geostationary satellite data have been increasingly applied to air pollution and have had a positive influence on aerosol prediction. Yumimoto et al. (2016), Dai et al. (2019), and Xia et al. (2019b) presented data assimilation experiments, including aerosol optical depth (AOD), from the Himawari-8 satellite. Their results showed that data assimilation with rapid-update Himawari-8 observations improves aerosol analyses better than polar satellite observations. Niu et al. (2008) used the three-dimensional variational method (3DVAR) to assimilate the dust retrieval from the Fengyun-2 satellite (FY-2C). The results found that the dust aerosol data assimilation system could effectively improve the short-term prediction of dust weather. Wang et al. (2004) and Lee et al. (2016) employed AOD from the Goddard Earth Observing System-8 (GEOS-8) and the Geostationary Ocean Color Imager (GOCI) into a data assimilation (DA) system to evaluate efficiency, obtaining some significantly positive results.
The Fengyun-4 satellite (FY-4), which was successfully launched on 11 December 2016, is a new generation of geostationary orbit meteorological satellites for quantitative application to China. FY-4 is the realization of the upgrading and technological leap forward of China's geostationary orbit (GEO) meteorological satellites, with an overall performance reaching an internationally advanced level. FY-4 carries an advanced geosynchronous radiation imager (AGRI), a geostationary interferometric infrared sounder (GIIRS), and a lightning mapping imager (LMI) that can provide full-disk images for 14 spectral bands, with a temporal resolution of 15-min intervals and a spatial resolution of 0.5–4.0 km (Zhang et al., 2015; Min et al., 2017; Wang et al., 2019). The Japanese Himawari-8, a next-generation GEO satellite, was successfully launched in October 2014. In comparison with conventional geostationary satellites, the advanced Himawari imager (AHI) carried by Himawari-8 can provide more frequent observations and more aerosol-detectable channels (Bessho et al., 2016; Zhuge et al., 2017; Wang et al., 2018). Both FY-4 and the Himawari-8 belong to a new generation of advanced meteorological weather satellites. The effect of the Himawari-8 aerosol data assimilation system has been reported as mentioned previously. However, in regions such as northwest China, where Himawari-8 has little data coverage, it is necessary to assimilate both FY-4 and Himawari-8 aerosol data and conduct full research and analysis to improve the capability of air quality prediction.
In this study, we constructed a rapid-update aerosol data assimilation system to assimilate both FY-4 and Himawari-8 aerosol observations. This study is the first attempt to assimilate both these satellites’ aerosol observations using Gridpoint Statistical Interpolation (GSI).
This study used the three-dimensional variational method (3DVAR) within a GSI system as a follow-up to the work of Liu et al. (2011), who assimilated the MODIS AOD observations with the GSI system; the impact of MODIS AOD data assimilation was demonstrated by its application to a dust storm of 17–24 March 2010 over East Asia. Yumimoto et al. (2016) showed the first application of AOD derived from Himawari-8 data to aerosol data assimilation that targeted transboundary pollutants and dust outflows over East Asia over 14–17 April 2011. Wang et al. (2012) presented a new method for the combined use of satellite-measured radiances and inverse modeling to spatially constrain the amount and location of dust emissions. The technique was illustrated by a case study in May 2008. As shown in the work of Peng et al. (2018), an ensemble Kalman filter data assimilation (DA) system was developed to improve air quality forecasts. This DA system was applied to simultaneously adjust the chemical initial conditions (ICs) during an extreme haze episode that occurred in early October 2014 over East Asia. Their results showed the positive impact of their assimilation approach on air quality prediction through its application to one dust event. In this study, the added value of assimilating AHI and AGRI aerosol data was applied to a severe dust case over East Asia in March 2018 to assess the effectiveness of analysis and prediction.
The remaining sections of this article are arranged as follows. The AOD data used in this study are introduced in the following section. Section 3 presents the dust storm case, the details of the aerosol DA system, the experimental design, and the background error covariance. The results are discussed in Section 4. The summary and discussion are given in Section 5.
2 Observation data
FY-4 was successfully launched on 11 December 2016 by the Satellite Meteorological Center of China Meteorological Agency. FY-4 has realized the upgrading and technological leap forward of China’s GEO meteorological satellites. It can provide geostationary images over a large area from 24.1°E to 174.7°W between 80.6°N and 80.6°S. FY-4 is equipped with four optical instruments: an advanced geosynchronous radiation imager (AGRI), a geostationary interferometric infrared sounder (GIIRS), a lightning mapping imager (LMI), and a Solar X-EUV Imaging Telescope (SXEIT). The highly improved AGRI onboard FY-4 has 14 spectral bands from visible to infrared and provides full-disk images with a temporal resolution of 15-min intervals and spatial resolutions of 1 km for nadir channels, 2 km for near-infrared channels, and 4 km for the rest of the infrared channels (Zhang et al., 2015; Min et al., 2017; Yang et al., 2017).
In this study, AOD observations from FY-4 were selected for the newly developed data assimilation system. The FY-4 AOD products are provided by the National Satellite Meteorological Center with 4 km resolution and were then refined to the same resolution as the initial grid of the model—25km. The total observation error for AOD was suggested by Zhang et al. (2008), in which observation errors were estimated to be the retrieval uncertainty attached to the FY-4A AOD products plus a standard deviation calculated as the representative error in the re-gridding. The assimilation time window is 1 h, and all the observation data in the assimilation time window are included in the assimilation system. Furthermore, only FY-4 AOD marked as the best quality control flag with values less than 2.5 could be assimilated, as suggested by Saide et al. (2014).
The latest version of the Himawari-8 AOD (Kikuchi et al., 2018; Yoshida, et al., 2018; Dai et al., 2019) was used for comparison in this study; it can be downloaded free from the internet (http://www.eorc.jaxa.jp/ptree/index.html) and was then processed to the same resolution as our model. Furthermore, the AErosol RObotic NETwork (AERONET) AOD observations were used for the validation; these are freely available at the website (http://aeronet.gsfc.nasa.gov/) (Holben et al., 1998). The locations of AERONET sites employed in this study are presented in Figure 1.
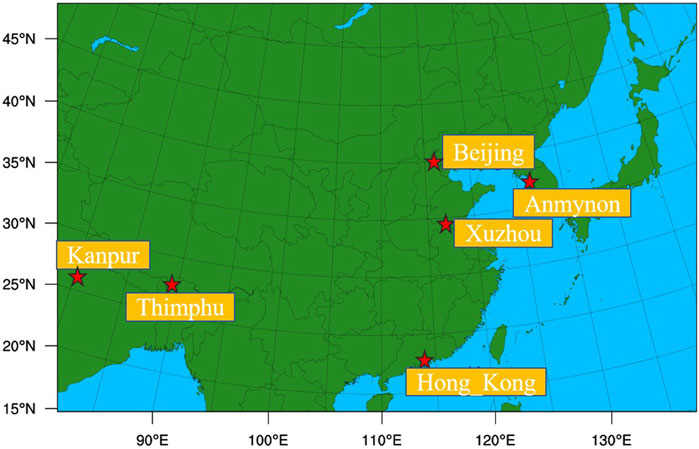
FIGURE 1. Experimental domain. Blue labeling indicates the locations of six AERONET sites used in this study.
3 Aerosol data assimilation system and experimental setup
3.1 The severe dust storm case
A dust storm affecting most regions of East Asia during 26–30 March 2018 was selected for this study. On 26 March 2018, a severe dust storm arrived in northeast Asia, with sand-blowing and flowing-dust weather appearing in central and eastern Inner Mongolia, northern Shanxi, central and northern Hebei, Beijing, Tianjin, and northeast China. The dust storm covered large regions, appeared in a concentrated time, and caused serious air pollution—visibility in the Beijing area was less than 400 m, accompanied by strong winds.
3.2 Aerosol data assimilation system
NCEP’s Gridpoint Statistical Interpolation (GSI) 3DVAR DA system—explained by Wu et al. (2002) and Kleist et al. (2009)—was expanded to assimilate FY-4A and Himawari-8 aerosol observations. The AOD observation operator was described by Liu et al. (2011). In this study, we added a new interface for the AOD observations from FY-4A and Himawari-8 to the GSI system as a follow-up to Liu et al. (2011) and Schwartz et al. (2012). Generally, the 3DVAR algorithm obtains an optimal analysis field by minimizing the deviation between the background and the observations. It constantly adjusts the weight ratio between the background and the observation by minimizing the given cost function so that the analysis field reaches optimal fit. The 3DVAR method is a problem of minimizing the cost function, and expression of the 3DVAR cost function J(x) could be expressed as follows (Lorenc, 1986; Ide et al., 1997; Chin, et al., 2000; Lorenc et al., 2000):
where x represents the n-dimensional analysis vector to minimize the cost function J(x),
In this study, the WRF-Chem model was selected for aerosol transport prediction. The gaseous chemical mechanism was produced by the Goddard Chemistry Aerosol Radiation and Transport (GOCART) aerosol scheme (Ginoux et al., 2001; Chin et al., 2002), which simulated 14 aerosol types, including sulfate, dust, organic carbon (OC) hydrophobic and hydrophilic, black carbon (BC), and sea salt. The static background error covariance (BEC) matrix of aerosol variables is constructed by using the National Meteorological Center (NMC) method (Parrish and Derber, 2002). At present, this method is widely used for statistical analysis of model background error covariance. We took the differences of 24 and 12 h WRF-Chem forecasts of the aerosol species valid at the common time for 62 pairs valid from 25 February to 25 March 2018.
3.3 Model and experimental design
In this study, the WRF-Chem model was selected for aerosol transport prediction over the domain spanning east Asia (Figure 1) with a 25-km horizontal grid spacing. There were 250 × 160 grid points and 40 vertical levels. The top pressure was 50 hPa. The physical parameterizations were concluded in this study: the rapid radiative transfer model longwave radiation scheme (Mlawer et al., 1997), the Dudhia shortwave radiation scheme (Dudhia, 1989), the Mellor–Yamada–Janjic (MYJ) boundary layer scheme, the Noah land surface model, and the Yonsei University (YSU) planetary boundary layer scheme (Hong and Lim, 2006).
The data assimilation system to assimilate the FY-4A and Himawari-8 aerosol observations was constructed within the GSI. We designed four parallel experiments to assess the performance of the newly developed data assimilation system for this severe dust storm case of 26–30 March 2018 over East Asia. The WRF-Chem settings and physical parameterizations were uniform in all experiments and were the same as those introduced in the previous section. One experiment (CNT) did not employ any DA, while AOD DA was performed in the other three experiments. The other three experiments were all performed based on the GSI using the 3DVAR DA system, but they assimilated different satellite AOD observations: one assimilating FY-4A AOD (FY DA), another assimilating Himawari-8 AOD (Hima DA), and the last assimilating both FY-4A and Himawari-8 AOD (FY + Hima DA). As in Houtekamer et al. (2005), Pagowski et al. (2010), Schwartz et al. (2012), and Pang et al. (2018), the first 5 days’ aerosol forecast was used for spin-up, and then, the four experiments began with the same initial fields. In each experiment, a new aerosol forecast simulated by WRF-Chem was initialized at 1-h intervals from 00 UTC on 26 March to 12 UTC on 30 March 2018. For every initialization, the meteorological fields were updated by inserting the final reanalysis data (FNL) analysis into the research domain as a background in all experiments. For the three experiments that employed DA, the observations within each assimilation time window (±0.5) were assimilated. The 1-h prediction initiated by the previous periodic analysis was the background, and the analysis results were then updated hourly. Note that Himawari-8 AODs were only present during the daytime, for 11–12 h data available in East Asia (Yumimoto et al., 2016); therefore, the DA experiments only cycled during daylight hours when the aerosol data were available.
4 Results
In this section, the evaluations of aerosol analysis and prediction of all four experiments by comparing to AOD observations from FY-4, Himawari-8, and independent AERONET are presented.
4.1 Comparison to Himawari AOD and FY-4 AOD
The root-mean-square error (RMSE) and mean bias, as statistical indicators which were calculated from models and observations, were used to evaluate the effectiveness of the assimilation systems. Figure 2 presents the distribution of bias (Figures 2A, C, E) and RMSE (Figures 2B, D, E) of the simulation of AOD compared to the satellite observations in the FY (Figures 2A, B), Hima (Figures 2C, D), and FY + Hima DA systems (Figures 2E, F) over 26–30 March 2018. These statistics were employed to evaluate the effectiveness of the newly developed aerosol DA system. The X-axis represents the month and day in March 2018, and the Y-axis represents the value of averaged bias and RMSE. We also display the statistical analysis of the comparisons between simulation and observation AOD in the four experiments over 26–30 March 2018 in Tables 1, 2, 3, 4, and 5.
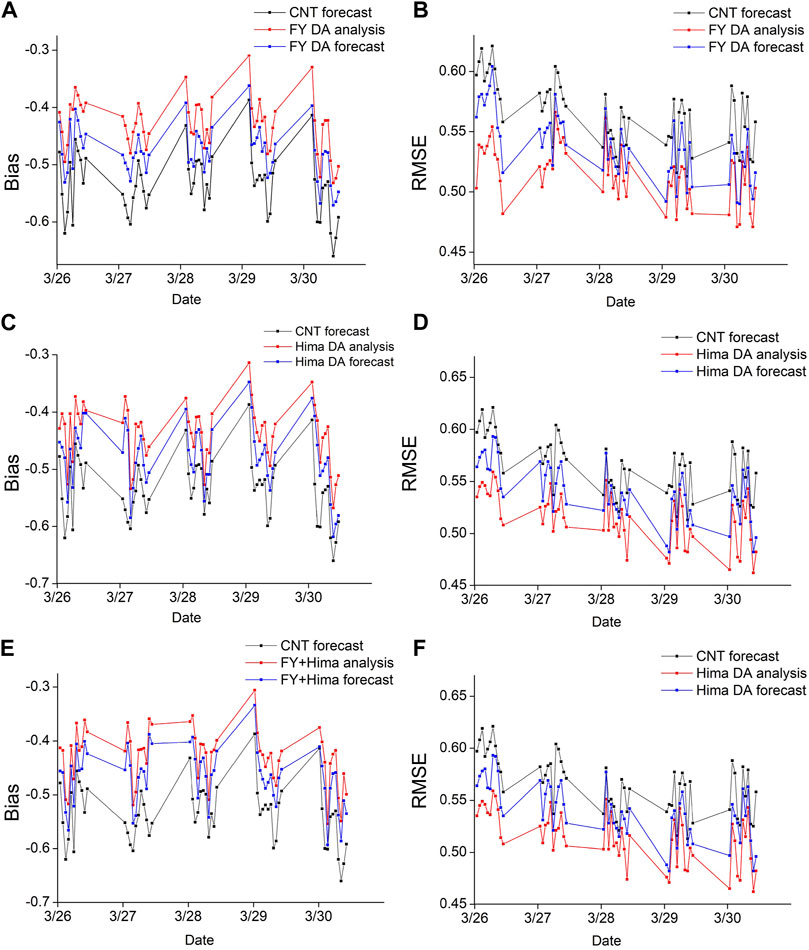
FIGURE 2. Time series of (A) bias in the FY DA system; (B) RMSE in the FY DA system; (C) bias in the Hima DA system; (D) RMSE in the Hima DA system; (E) bias in the FY + Hima DA system; (F) RMSE in the FY + Hima DA system during the period 26–30 March 2018.
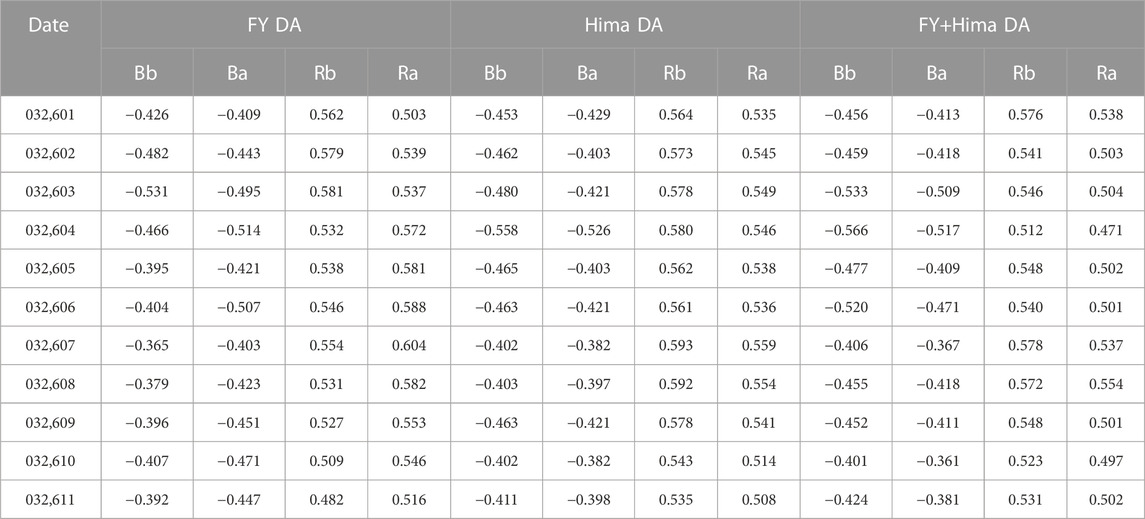
TABLE 1. Statistical analysis of the simulated and observed AOD in experiments 26 March 2018.
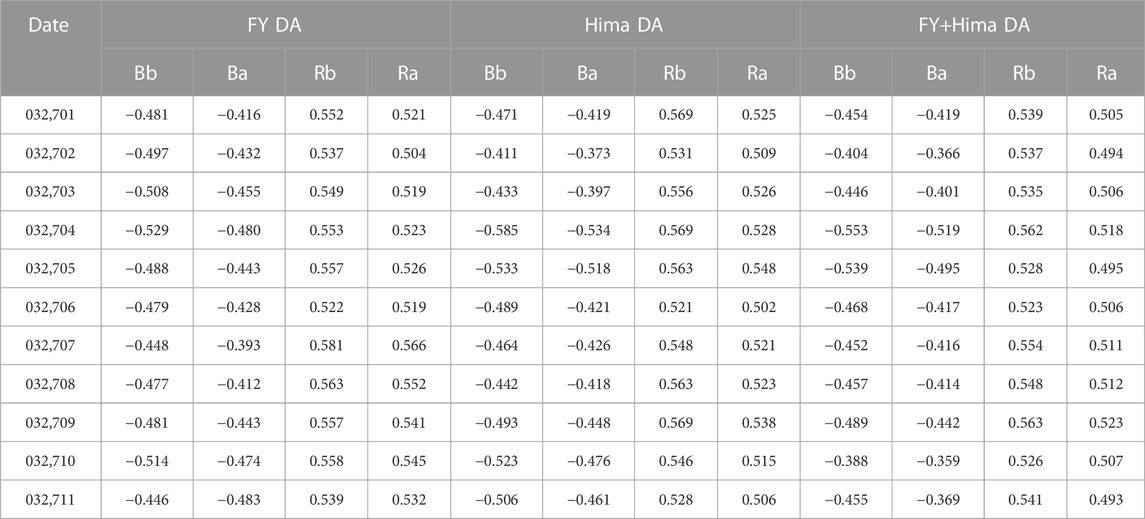
TABLE 2. Statistical analysis of simulated and observed AOD in experiments 27 March 2018.

TABLE 3. Statistical analysis of simulated and observed AOD in experiments 28 March 2018.

TABLE 4. Statistical analysis of simulated and observed AOD in experiments 29 March 2018.
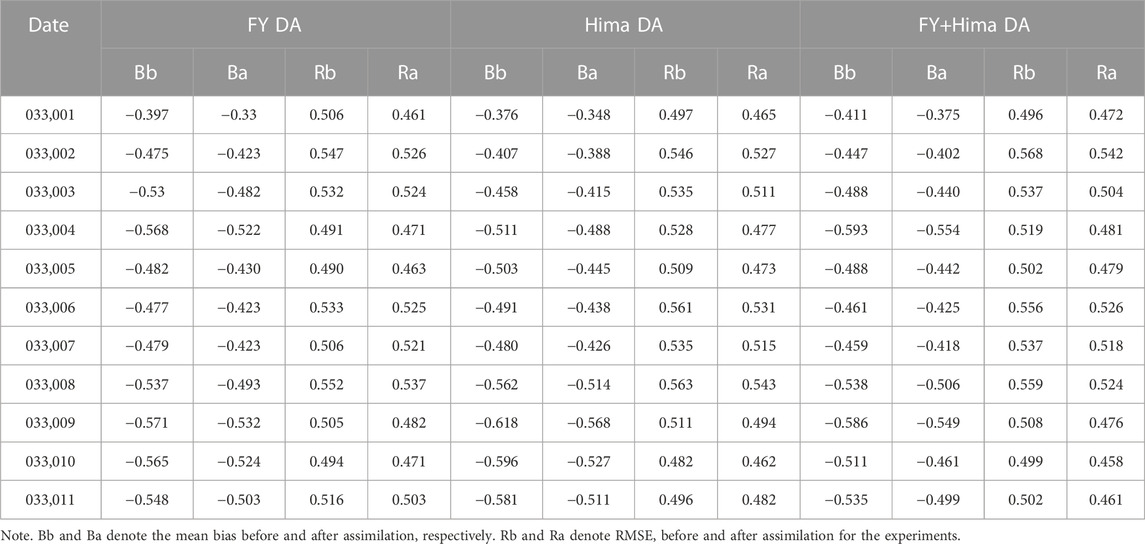
TABLE 5. Statistical analysis of simulated and observed AOD in experiments 30 March 2018.
Figure 2 and Tables 1–5 show the results from the four simulations performed. In general, after assimilating AOD, the analysis results are more consistent with the observed AOD than the background; the DA system has good calibration of aerosol simulation, with the bias and RMSE reduced by about 20% in all three DA experiments (Hong and Lim, 2006). The CNT experiment did not perform very well, and the AOD was underpredicted (biases of −0.4 to −0.6). After AOD DA, the model low bias and RMSE were dramatically reduced to near −0.1 and 0.2, respectively, indicating that the assimilation of the AOD observations is beneficial for adjusting the background field. It is interesting that the assimilation employing both FY-4 and Himawari-8 reduced more than the other three DA experiments. This may mainly be because more abundant observation information on the dust storm was involved, so the assimilation analysis field was better adjusted to the background field.
The analysis and forecast impacts were then separately compared with the assimilated FY-4 and Himawari-8 AODs, which can directly show the effects of different satellite aerosol data assimilation on model simulation results (Benedetti et al., 2009). In the FY4 DA experiment (Figure 3), the CNT experiment (Figure 3C) failed to simulate the pollution, whereas the DA analysis field successfully presented the pollution over southern China (Figure 3B); however, very few adjustments were provided around Beijing and northeast China—particularly due to a lack of observations. The CNT experiment captured the main features of the dust storm in southeastern China, but the value was greatly underestimated, and then, the DA analysis reduced the underestimation of the aerosol loadings. The results in AOD derived from the Himawari-8 data assimilation system are displayed in Figure 4. Like Figure 3, Himawari-8 AOD data assimilation improved the low bias, and the analysis field was more consistent with the observed AOD distribution than the background field, which also verified the assimilation impact. Furthermore, the analysis fields presented a more abundant dust storm over Inner Mongolia and northeast China. However, little dust information was provided for northwest China due to a lack of observation data. The AOD derived from FY-4 and Himawari-8 were then included in the last aerosol data assimilation. As shown in Figure 5, the simulation of the dust storm in the CNT experiment was inadequate and the DA simulation improved the AOD values, which were much closer to the satellite observations. The analysis field contained many details of the dust storm system, and the addition of observation data strengthened the distribution of large AOD values in Beijing, Inner Mongolia, and the northeast China region, and especially in northwest China, can make up for the underestimation of CNT.
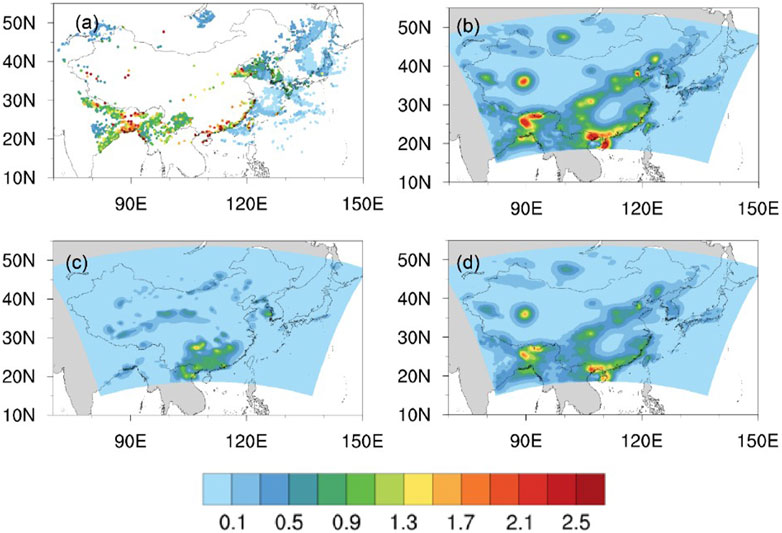
FIGURE 3. (A) Observations of 1-h DA windows from FY4; (B) distributions of simulated AOD based on DA background fields; (C) analysis fields; (D) 1-h forecast fields for the FY DA system, valid at 0600 UTC 26 March 2018.
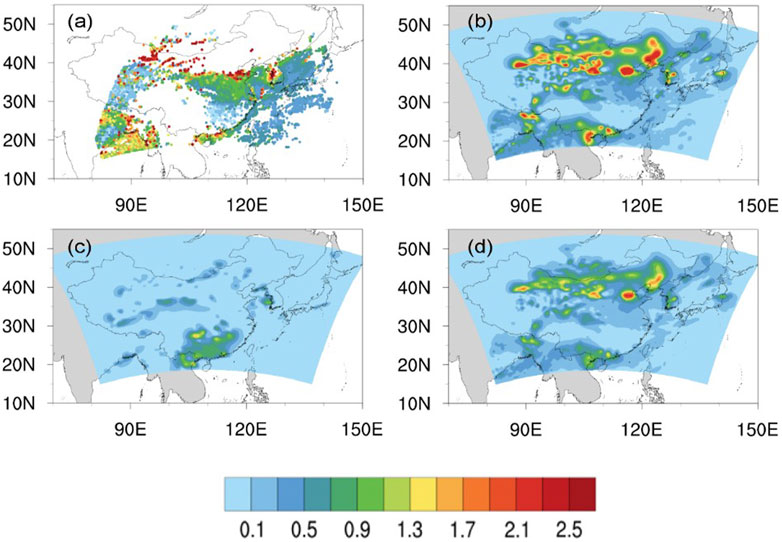
FIGURE 4. (A) Observations of 1-h DA windows from Himawari-8; (B) distributions of simulated AOD based on DA background fields; (C) analysis fields; (D) the 1-h forecast fields for the Hima DA system, valid at 0600 UTC 26 March 2018.
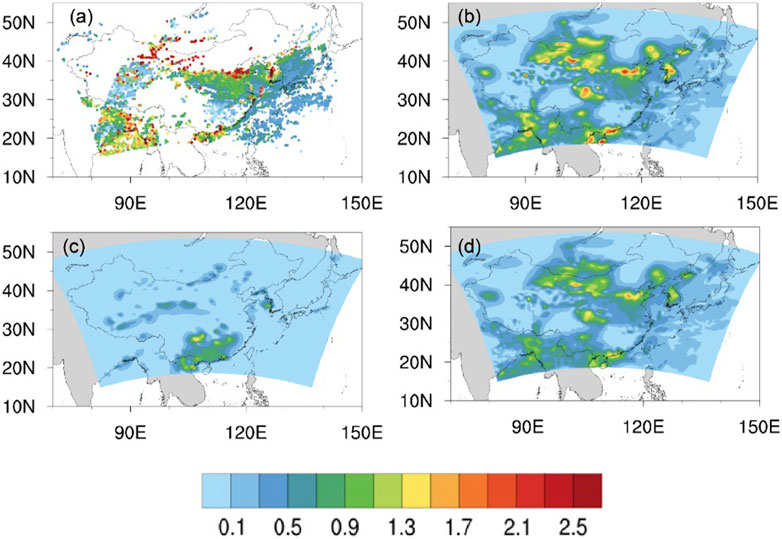
FIGURE 5. (A) Observations of 1-h DA windows; (B) distributions of simulated AOD based on DA background fields; (C) analysis fields; (D) 1-h forecast fields for the FY+Hima DA system, valid at 0600 UTC 26 March 2018.
In general, the results suggest that the newly rapid-update aerosol data assimilation system which assimilates both the FY-4 and Himawari-8 aerosol observations in this study can significantly improve the forecast field, especially in northwest China where Himawari-8 has little data coverage. Data assimilation complemented related aerosol information, which is more conducive to accurately describing the formation and development process of pollution events.
4.2 Comparison with AERONET AOD
AERONET is an aerosol monitoring network of hundreds of solar photometers around the world, organized by the US National Aeronautics and Space Administration (NASA) and France’s National Center for Scientific Research (CNRS) (Holben et al., 1998). The ground AOD data obtained from AERONET were used to assess the impact of the assimilation results. This plays an important role in the study of global and regional aerosol optical properties, environmental and radiation effects, validation and evaluation of satellite remote sensing, and numerical model products (Schutgens et al., 2012). In this section, AOD data retrieved by six AERONET sites (See Figure 1) that were affected by the dust storm were selected for comparison with the analysis fields in the four experiments. As shown in Figure 6, the dust storm from 26 March to 30 March 2018 was detected by AERONET at the Anmyon, Beijing, Hong_Kong, Kanpur, Thimphu, and Xuzhou sites. In general, AOD values were underestimated in the control experiment (black line), the data assimilation greatly adjusted the aerosol analysis field, and the intensity is more consistent with AERONET stations. At all sites, the improved effect of the AOD values in the analysis was obvious after assimilating, and the overall variation trend of AOD prediction is more consistent with the ground AERONET data (Figures 6A, C, E, F). However, at the Beijing site (Figure 6B), DA experiments sometimes led to underpredictions, such as on 28 March. Moreover, at the Kanpur site (Figure 6D), where observations were insufficient, all DA experiments always underestimated the AOD values. At the Anmyon and Beijing sites, the Hima DA experiment (blue line) was more prominent, in which the simulated AOD values were closer to AERONET observations than the FY-4 DA experiment (green line). The FY-4 DA experiment performed better than the Hima DA experiment over the Hong Kong and Kanpur sites, likely because of the different coverage of satellite observations. It is interesting to point out that the analysis results in the assimilation experiment involving FY4 and Himawari-8 can better reflect the variation trend of AOD in the dust storm. The AOD values from the FY + Hima DA experiment (purple line) usually performed better than observations in the other three experiments. During the middle of the dust storm period, AOD values at the Beijing and Thimphu sites did not capture the extreme event even with AOD DA, when the air pollution reached a high level and the observed AOD value exceeded 1.0. In general, the assimilation achieved improvements at all six sites and the results showed that aerosol data assimilation could significantly improve the accuracy of forecasting dust storm events.
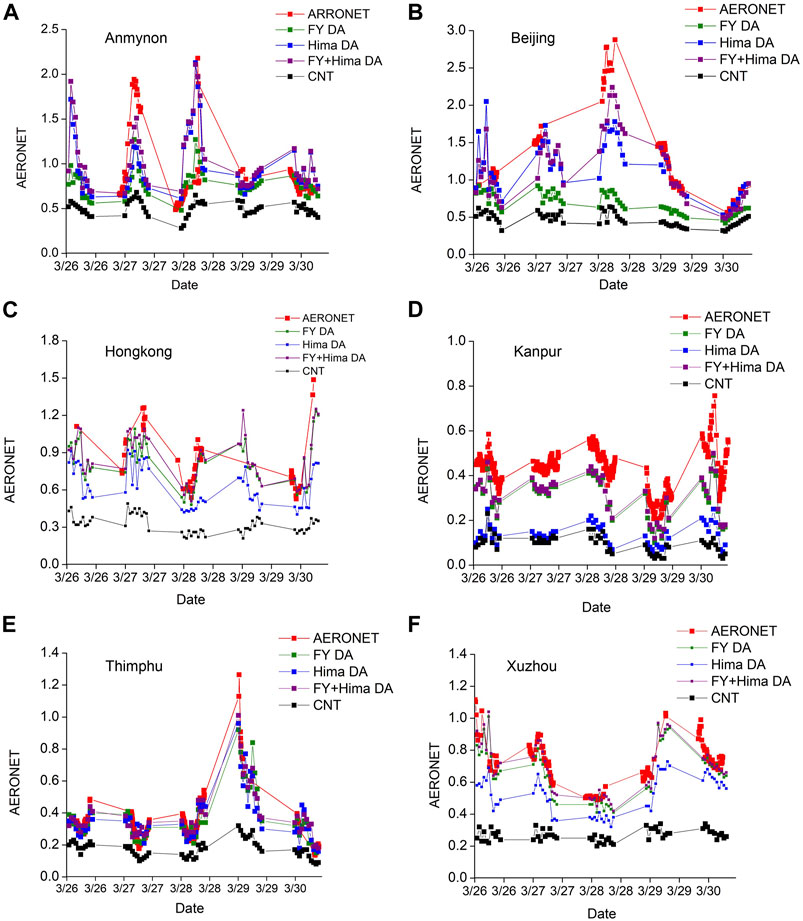
FIGURE 6. Comparisons between AERONET retrievals and modeled results in the four experiments 26–30 March 2018 at the AERONET sites of (A) Anmyon, (B) Beijing, (C) Hong_Kong, (D) Kanpur, (E) Thimphu, (F) Xuzhou, and (G) Xitun.
5 Summary and discussion
This study used a GSI-3DVAR data assimilation system to assimilate the hourly FY-4 and Himawari-8 AOD data. A dust storm in March 2018 was selected as an application to access the impact of the DA system. Three parallel experiments assimilated AOD from FY-4, Himawari-8, both FY-4 and Himawari-8, and a control experiment that did not employ DA. The results of analysis and forecasting were evaluated against AOD observations from FY-4, the Himawari-8 satellite, and the AERONET. In general, the experiment without data assimilation always underestimated the AOD values during the dust storm. All forms of DA experiments improved a low bias, and the RMSE was reduced by approximately 20%. Assimilation of satellite AOD data improved the initial field of the model obviously when compared with the control experiment and had an especially positive effect on the analysis and forecast fields. It is interesting to note that the assimilation employing both FY-4 and Himawari-8 provided the analysis field with more abundant aerosol observation information and a more accurate description of the model's initial field and had much better consistency with satellite observations than the other experiments. The comparison with AOD retrieved from AERONET also proved the ability of the newly developed data assimilation system to improve aerosol prediction.
These results show the potential improvement of air quality prediction systems through the assimilation of FY-4 and Himawari-8 AOD data, which indicates that the new generation geostationary meteorological satellites have the potential to greatly contribute to air quality forecasting. Further improvements could be made in the future by employing more advanced DA techniques and more accurate estimations of emissions. These will be further investigated in our future work.
Data availability statement
The original contributions presented in the study are included in the article/Supplementary material; further inquiries can be directed to the corresponding author.
Author contributions
Conceptualization, XX; Data curation, JM; Formal analysis, XX and JM; Investigation, XX; Methodology, XX; Project administration, JM; Resources, JM; Writing—original draft, XX; Writing—review and editing, SS; Review and Funding acquisition, XC. All authors have read and agreed to the published version of the manuscript.
Funding
This research was primarily funded by Jiangsu Funding Program for Excellent and Postdoctoral Talent and Open Research Fund of Jiangsu Province Key Laboratory of Environmental Engineering (ZZ2020003). Shandong Natural Science Foundation (ZR2021QD154).
Acknowledgments
The authors would like to thank the National Satellite Meteorological Center for sharing FY4A aerosol data. They also thank the reviewers for the constructive comments and suggestions that significantly improved our manuscript.
Conflict of interest
The authors declare that the research was conducted in the absence of any commercial or financial relationships that could be construed as a potential conflict of interest.
Publisher’s note
All claims expressed in this article are solely those of the authors and do not necessarily represent those of their affiliated organizations, or those of the publisher, the editors, and the reviewers. Any product that may be evaluated in this article, or claim that may be made by its manufacturer, is not guaranteed or endorsed by the publisher.
References
Benedetti, A., Morcrette, J. J., Boucher, O., Dethof, A., Engelen, R. J., Fisher, M., et al. (2009). Aerosol analysis and forecast in the European centre for medium-range weather forecasts integrated forecast system: 2. Data assimilation. J. Geophys. Res. 114, D13205. doi:10.1029/2008jd011115
Bessho, K., Date, K., Hayashi, M., Ikeda, A., Imai, T., Inoue, H., et al. (2016). An introduction to himawari-8/9— Japan’s new-generation geostationary meteorological satellites. J. Meteorological Soc. Jpn. Ser. II. 94 (2), 151–183. doi:10.2151/jmsj.2016-009
Chen, L., Shi, M. S., Gao, S., Li, S. H., Mao, J., Zhang, H., et al. (2017). Assessment of population exposure to PM2.5 for mortality in China and its public health benefit based on BenMAP. Environ. Pollut. 221, 311–317. doi:10.1016/j.envpol.2016.11.080
Chin, M., Ginoux, P., Kinne, S., Torres, O., Holben, B. N., Duncan, B. N., et al. (2002). Tropospheric aerosol optical thickness from the GOCART model and comparisons with satellite and sun photometer measurements. J. Atmos. Sci. 59, 461–483. doi:10.1175/1520-0469(2002)059<0461:taotft>2.0.co;2
Chin, M., Rood, R. B., Lin, S. J., Muller, J. F., and Thompson, A. M. (2000). Atmospheric sulfur cycle simulated in the global model GOCART: Model description and global properties. J. Geophys. Res. 105, 24671. doi:10.1029/2000jd900384
Dai, T., Cheng, Y., Suzuki, K., Goto, D., Kikuchi, M., Schutgens, N. A. J., et al. (2019). Hourly aerosol assimilation of himawari-8 AOT using the four-dimensional local ensemble transform kalman filter. J. Adv. Model. Earth Syst. 11, 680–711. doi:10.1029/2018ms001475
Dudhia, J. (1989). Numerical study of convection observed during the Winter Monsoon Experiment using a mesoscale two–dimensional model. J. Atmos. Sci. 46, 3077–3107. doi:10.1175/1520-0469(1989)046<3077:nsocod>2.0.co;2
Ginoux, P., Chin, M., Tegen, I., Prospero, J., Holben, B., Dubovik, O., et al. (2001). Sources and distributions of dust aerosols simulated with the GOCART model. J. Geophys. Res. 106 (225–20), 20255–20273. doi:10.1029/2000jd000053
Goodman, S. J., Gurka, J., DeMaria, M., Schmit, T. J., Mostek, A., Jedlovec, G., et al. (2012). The GOES-R proving ground: Accelerating user readiness for the next-generation geostationary environmental satellite system. Bull. Am. Meteorological Soc. 93 (7), 1029–1040. doi:10.1175/bams-d-11-00175.1
Greenwald, T. J., Pierce, R. B., Schaack, T., Otkin, J., Rogal, M., Bah, K., et al. (2016). Real-time simulation of the GOES-R ABI for user readiness and product evaluation. Bull. Amer. Meteor. Soc. 97, 245–261. doi:10.1175/bams-d-14-00007.1
Hansen, J., Sato, M., and Ruedy, R. (1997). Radiative forcing and climate response. J. Geophys. Res. Atmos. 102, 6831–6864. doi:10.1029/96jd03436
Holben, B. N., Eck, T. F., Slutsker, I., Tanré, D., Buis, J. P., Setzer, A., et al. (1998). AERONET—a federated instrument network and data archive for aerosol characterization. Remote Sens. Remote Sens. Environ. 66, 1–16. doi:10.1016/s0034-4257(98)00031-5
Hong, S. Y., and Lim, J. (2006). The WRF single-moment 6-class microphysics scheme (WSM6). J. Korean Meteor. Soc., 42, 129–151.
Houtekamer, P. L., Mitchell, H. L., Pellerin, G., Buehner, M., Charron, M., Spacek, L., et al. (2005). Atmospheric data assimilation with an ensemble kalman filter: Results with real observations. Mon. Weather Rev. 133, 604–620. doi:10.1175/mwr-2864.1
Ide, K., Courtier, P., Ghil, M., and Lorenc, A. (1997). Unified notation for data assimilation: Operational, sequential and variational (gtSpecial IssueltData assimilation in meteology and oceanography: Theory and practice). J. Meteorol. Soc. Jpn. 75, 181–189. doi:10.2151/jmsj1965.75.1b_181
Kikuchi, M., Murakami, H., Suzuki, K., Nagao, T. M., and Higurashi, A. (2018). Improved hourly estimates of aerosol optical thickness using spatiotemporal variability derived from Himawari-8 geostationary satellite. IEEE Trans. Geoscience Remote Sens. 56 (6), 3442–3455. doi:10.1109/tgrs.2018.2800060
Kleist, D. T., Parrish, D. F., Derber, J. C., Treadon, R., Wu, W. S., and Lord, S. (2009). Introduction of the GSI into the NCEP global data assimilation system. Weather Forecast 24, 1691–1705. doi:10.1175/2009waf2222201.1
Koren, I., Kaufman, Y. J., Remer, L. A., and Martins, J. V. (2004). Measurement of the effect of Amazon smoke on inhibition of cloud formation. Science 303, 1342. doi:10.1126/science.1089424
Lee, S., Song, C. H., Park, R. S., Park, M. E., Han, K. M., Kim, J., et al. (2016). GIST-PM-Asia v1: Development of a numerical system to improve particulate matter forecasts in South Korea using geostationary satellite-retrieved aerosol optical data over Northeast Asia. Geosci. Model Dev. 9 (1), 17–39. doi:10.5194/gmd-9-17-2016
Li, X., and Zou, X. (2017). Bias characterization of CrIS radiances at 399 selected channels with respect to NWP model simulations. Atmos. Res. 196, 164–181. doi:10.1016/j.atmosres.2017.06.007
Liu, H., Liu, S., Xue, B., Lv, Z. F., Meng, Z. H., Yang, X. F., et al. (2018). Ground-level ozone pollution and its health impacts in China. Atmos. Environ. 173, 223–230. doi:10.1016/j.atmosenv.2017.11.014
Liu, Z., Lin, H. C., Schwartz, C. S., Lee, Y. H., and Wang, T. (2011). Three-dimensional variational assimilation of MODIS aerosol optical depth: Implementation and application to a dust storm over East Asia. J. Geophys. Res. 116, D23206. doi:10.1029/2011jd016159
Lorenc, A. C. (1986). Analysis methods for numerical weather prediction. Q. J. R. Meteorol. Soc. 112, 1177–1194. doi:10.1002/qj.49711247414
Lorenc, A. C., Ballard, S. P., Bell, R. S., Ingleby, N. B., Andrews, P., Barke, D., et al. (2000). The Met. Office global three-dimensional variational data assimilation scheme. Q. J. R. Meteorol. Soc. 126, 2991–3012. doi:10.1002/qj.49712657002
Min, M., Wu, C. Q., Li, C., Liu, X., Xu, N., Wu, X., et al. (2017). Developing the science product algorithm testbed for Chinese next-generation geostationary meteorological satellites: Fengyun-4 series. J. Meteor. Res. 31, 708–719. doi:10.1007/s13351-017-6161-z
Mlawer, E. J., Taubman, S. J., Brown, P. D., Iacono, M. J., and Clough, S. A. (1997). Radiative transfer for inhomogeneous atmospheres: RRTM, a validated correlated–k model for the longwave. J. Geophys. Res. 102, 16663–16682. doi:10.1029/97jd00237
Niu, T., Gong, S. L., Zhu, G. F., Liu, H. L., Hu, X. Q., Zhou, C. H., et al. (2008). Data assimilation of dust aerosol observations for the CUACE/dust forecasting system. Atmos. Chem. Phys. 8, 3473–3482. doi:10.5194/acp-8-3473-2008
Pagowski, M., Grell, G. A., McKeen, S. A., Peckham, S. E., and Devenyi, D. (2010). Three-dimensional variational data assimilation of ozone and fine particulate matter observations: Some results using the weather research and forecasting-chemistry model and grid-point statistical interpolation. Q. J. R. Meteorol. Soc. 136, 2013–2024. doi:10.1002/qj.700
Pang, J., Liu, Z., Wang, X., Bresch, J., Ban, J., Chen, D., et al. (2018). Assimilating AOD retrievals from GOCI and VIIRS to forecast surface PM2.5 episodes over Eastern China. Atmos. Environ. 179, 288–304. doi:10.1016/j.atmosenv.2018.02.011
Parrish, D. F., and Derber, J. C. (1992). The National Meteorological Center’s spectral statistical interpolation analysis system. Mon. Weather Rev. 120, 1747–1763. doi:10.1175/1520-0493(1992)120<1747:tnmcss>2.0.co;2
Peng, Z., Lei, L., Liu, Z., Sun, J., Ding, A., Ban, J., et al. (2018). The impact of multi-species surface chemical observation assimilation on 552 air quality forecasts in China, Atmos. Chem. Phys. 18, 17387. doi:10.5194/acp-18-17387-2018
Rosenfeld, D., Lohmann, U., Raga, G. B., O’Dowd, C. D., Kulmala, M., Fuzzi, S., et al. (2008). Andreae, M.O. Flood or drought: How do aerosols affect precipitation? Science 321, 1309–1313. doi:10.1126/science.1160606
Saide, P. E., Kim, J., Song, C. H., Choi, M., Cheng, Y., and Carmichael, G. R. (2014). Assimilation of next generation geostationary aerosol optical depth retrievals to improve air quality simulations. Geophys. Res. Lett. 41, 9188–9196. doi:10.1002/2014gl062089
Schmit, T. J., Li, J., Li, J., Feltz, W. F., Gurka, J. J., Goldberg, M. D., et al. (2008). The GOES-R Advanced Baseline Imager and the continuation of current sounder products. J. Appl. Meteorology Climatol. 47 (10), 2696–2711. doi:10.1175/2008jamc1858.1
Schutgens, N., Nakata, M., and Nakajima, T. (2012). Estimating aerosol emissions by assimilating remote sensing observations into a global transport model. Remote Sens. 4 (11), 3528–3543. doi:10.3390/rs4113528
Schwartz, C. S., Liu, Z., Lin, H. C., and McKeen, S. A. (2012). Simultaneous three-dimensional variational assimilation of surface fine particulate matter and MODIS aerosol optical depth. J. Geophys. Res. 117, D13202. doi:10.1029/2011jd017383
Shen, F., and Min, J. (2015). Assimilating AMSU-a radiance data with the WRF hybrid En3DVAR system for track predictions of Typhoon Megi (2010). Adv. Atmos. Sci. 32 (9), 1231–1243. doi:10.1007/s00376-014-4239-4
Shen, F., Song, L., Li, H., He, Z., and Xu, D. (2022). Effects of different momentum control variables in radar data assimilation on the analysis and forecast of strong convective systems under the background of northeast cold vortex. Atmos. Res. 280, 106415. doi:10.1016/j.atmosres.2022.106415
Sicard, P., Anav, A., Marco, A. D., and Paoletti, E. (2017). Projected global ground-level ozone impacts on vegetation under different emission and climate scenarios. Atmos. Chem. Phys. 17, 12177–12196. doi:10.5194/acp-17-12177-2017
Stengel, M., Undén, P., Lindskog, M., Dahlgren, P., Gustafsson, N., and Bennartz, R. (2009). Assimilation of SEVIRI infrared radiances with HIRLAM 4D-Var. Q. J. R. Meteorological Soc. 135 (645), 2100–2109. doi:10.1002/qj.501
Stuhlmann, R., Rodriguez, A., Tjemkes, S., Grandell, J., Arriaga, A., Bezy, J. L., et al. (2005). Plans for EUMETSAT’s Third Generation Meteosat geostationary satellite programme. Adv. Space Res. 36, 975–981. doi:10.1016/j.asr.2005.03.091
Tie, X. X., Wu, D., and Brasseur, G. (2009). Lung cancer mortality and exposure to atmospheric aerosol particles in Guangzhou, China. Atmos. Environ. 43 (14), 2375–2377. doi:10.1016/j.atmosenv.2009.01.036
Wang, J., Nair, U. S., and Christopher, S. A. (2004). GOES-8 aerosol optical thickness assimilation in a mesoscale model: Online integration of aerosol radiative effects. J. Geophys. Res. 109, D23203. doi:10.1029/2004jd004827
Wang, J., Xu, X., Henze, D. K., Zeng, J., Ji, Q., Tsay, S., et al. (2012). Top-down estimate of dust emissions through integration of MODIS and MISR aerosol retrievals with the GEOS-Chem adjoint model. Geophys. Res. Lett. 39 (8), 8802. doi:10.1029/2012gl051136
Wang, J., Xu, Y., Yang, L., Wang, Q., Yuan, J., and Wang, Y. (2020). Data assimilation of high-resolution satellite rainfall product improves rainfall simulation associated with landfalling tropical cyclones in the yangtze river delta. Remote Sens. 12, 276. doi:10.3390/rs12020276
Wang, T., Luo, J., Liang, J., Wang, B., Tian, W., and Chen, X. (2019). Comparisons of AGRI/FY-4A cloud fraction and cloud top pressure with MODIS/terra measurements over East Asia. J. Meteorological Res. 33 (4), 705–719. doi:10.1007/s13351-019-8160-8
Wang, Y. B., Liu, Z. Q., Yang, S., Min, J. Z., Chen, L. Q., Chen, Y. D., et al. (2018). Added value of assimilating himawari-8 AHI water vapor radiances on analyses and forecasts for “7.19” severe storm over north China. J. Geophys. Res. Atmos. 123 (7), 3374–3394. doi:10.1002/2017jd027697
Wilcox, E. M. (2012). Direct and semi-direct radiative forcing of smoke aerosols over clouds. Atmos. Chem. Phys. 12, 139–149. doi:10.5194/acp-12-139-2012
Wu, W. S., Parrish, D. F., and Purser, R. J. (2002). Three-dimensional variational analysis with spatially inhomogeneous covariances. Mon. Weather Rev. 130, 2905–2916. doi:10.1175/1520-0493(2002)130<2905:tdvaws>2.0.co;2
Xia, X. L., Min, J. Z., Shen, F. F., Wang, Y. B., and Yang, C. (2019a). Aerosol data assimilation using data from Fengyun-3A and MODIS: Application to a dust storm over East Asia in 2011. Adv. Atmos. Sci. 36 (1), 1–14. doi:10.1007/s00376-018-8075-9
Xia, X., Min, J., Wang, Y., Shen, F., Yang, C., and Sun, Z. (2019b). Assimilating Himawari-8 AHI aerosol observations with a rapid-update data assimilation system. Atmos. Environ. 215, 116866. doi:10.1016/j.atmosenv.2019.116866
Xu, D., Liu, Z., Huang, X., Min, J., and Wang, H. (2013). Impact of assimilating IASI radiance observations on forecasts of two tropical cyclones. Meteorol. Atmos. Phys. 122 (1–2), 1–18. doi:10.1007/s00703-013-0276-2
Xu, D., Yang, G., Wu, Z., Shen, F., Li, H., and Zhai, D. (2022). Evaluate radar data assimilation in two momentum control variables and the effect on the forecast of southwest China vortex precipitation. Remote Sens. 14 (14), 3460. doi:10.3390/rs14143460
Yang, J., Zhang, Z., Wei, C., Lu, F., and Guo, Q. (2017). Introducing the new generation of Chinese geostationary weather satellites, Fengyun-4. Bull. Amer. Meteor. Soc. 98, 1637–1658. doi:10.1175/bams-d-16-0065.1
Yoshida, M., Kikuchi, M., Nagao, T. M., Murakami, H., Nomaki, T., and Higurashi, A. (2018). Common retrieval of aerosol properties for imaging satellite sensors. J. Meteorological Soc. Jpn. 96B (0), 193–209. doi:10.2151/jmsj.2018-039
Yu, Y. Y., Tarpley, D., Privette, J. L., Goldberg, M., Rama Varma Raja, M., Vinnikov, K., et al. (2009). Developing algorithm for operational GOES-R land surface temperature product. IEEE Trans. Geosci. Remote Sens. 47, 936–951. doi:10.1109/tgrs.2008.2006180
Yumimoto, K. (2013). Impacts of geostationary satellite measurements on CO forecasting: An observing system simulation experiment with GEOS-Chem/LETKF data assimilation system. Atmos. Environ. 74, 123–133. doi:10.1016/j.atmosenv.2013.03.032
Yumimoto, K., Kikuchi, N. M., Sekiyama, T. T., Murakami, H., Tanaka, T. Y., Ogi, A., et al. (2016). Aerosol data assimilation using data from Himawari-8, a next-generation geostationary meteorological satellite. Geophys. Res. Lett. 43, 5886–5894. doi:10.1002/2016gl069298
Zhang, J. L., Reid, J. S., Westphal, D. L., Baker, N. L., and Hyer, E. J. (2008). A system for operational aerosol optical depth data assimilation over global oceans. J. Geophys. Res. 113, D10208. doi:10.1029/2007jd009065
Zhang, J., and Reid, J. S. (2006). MODIS aerosol product analysis for data assimilation: Assessment of over-ocean level 2 aerosol optical thickness retrievals. J. Geophys. Res. 111, D22207. doi:10.1029/2005jd006898
Zhang, P., Guo, Q., Chen, B. Y., and Feng, X. (2015). The Chinese next-generation geostationary meteorological satellite FY-4 compared with the Japanese himawari-8/9 satellites. Adv. Meteorological Sci. Technol. 6 (1), 1–2016.
Zhao, H., Zheng, Y. F., and Li, C. (2018). Spatiotemporal distribution of PM2.5 and O3 and their interaction during the summer and winter seasons in Beijing, China. Sustainability 10 (12), 4519. doi:10.3390/su10124519
Zhao, H., Zheng, Y. F., Zhang, Y. X., and Wang, Z. S. (2020). Spatiotemporal distribution and population exposure of air pollution in Beijing-Tianjin-Hebei region. Acta Sci. Circumstantiae 40 (1), 1–12. doi:10.13671/j.hjkxxb.2019.0237
Zhuge, X., Zou, X., and Wang, Y. (2017). A fast cloud detection algorithm applicable to monitoring and nowcasting of daytime cloud systems. IEEE Trans. Geoscience Remote Sens. 55 (11), 6111–6119. doi:10.1109/tgrs.2017.2720664
Keywords: Fengyun-4A satellite, aerosol optical depth, geostationary meteorological satellites, data assimilation, Himawari-8
Citation: Xia X, Min J, Sun S and Chen X (2023) Simultaneous assimilation of Fengyun-4A and Himawari-8 aerosol optical depth retrieval to improve air quality simulations during one storm event over East Asia . Front. Earth Sci. 11:1057299. doi: 10.3389/feart.2023.1057299
Received: 29 September 2022; Accepted: 06 March 2023;
Published: 27 March 2023.
Edited by:
Yunheng Wang, University of Oklahoma, United StatesReviewed by:
Jean-Baptiste Renard, UMR7328 Laboratoire de physique et chimie de l’environnement et de l’Espace (LPC2E), FranceChang Liu, Guangdong Provincial Climate Center, China
Muyuan Li, China Meteorological Administration, China
Feng Hu, Chuzhou University, China
Copyright © 2023 Xia, Min, Sun and Chen. This is an open-access article distributed under the terms of the Creative Commons Attribution License (CC BY). The use, distribution or reproduction in other forums is permitted, provided the original author(s) and the copyright owner(s) are credited and that the original publication in this journal is cited, in accordance with accepted academic practice. No use, distribution or reproduction is permitted which does not comply with these terms.
*Correspondence: Xiaoli Xia, eGlheGlhb2xpMDUxQDE2My5jb20=