 Jun Hua
 Wenyu Gong
 Xinjian Shan
 Guohong Zhang
 Xiaogang Song
- State Key Laboratory of Earthquake Dynamics, Institute of Geology, Beijing, China
On 21 May 2021, an earthquake of moment magnitude (Mw) 7.4 occurred near Maduo county in Qinghai Province China. This is the first major earthquake that occurred in the interior of the Bayan Har block in the Tibetan Plateau over the past 70 decades. Focusing on this event, we conducted a study on three-dimensional (3D) coseismic displacement reconstruction and its tectonic implication. We acquired both Synthetic Aperture Radar (SAR) and optical imaging satellite imagery, including SAR images from Sentinel-1 and Advanced Land Observation Satellite-2 (ALOS-2) as well as the multi-spectrum images from the Sentinel-2 (S2) satellite. We applied the Interferometric SAR (InSAR) and pixel-offset tracking (POT) techniques to coseismic SAR data pairs and reconstructed two dimensional displacements. With the constructed displacement fields in multiple viewing directions, we resolved the 3D coseismic displacements (north-south, east-west, and up components) by integrating the regional strain model with variance components estimation (SM-VCE). We recommend using the standard deviation value at each grid cell, which can be calculated in the resampling, as the initial weight. Based on the resolved 3D coseismic displacements, we further estimated the dip angles for the two segments (F4 and F5) in the east of the rupture zone. The associated moment magnitude is about Mw7.4, which corresponds to the released energy of ∼
1 Introduction
On 21 May 2021, an earthquake of moment magnitude (Mw) 7.4 occurred near Maduo county in Qinghai Province China (Figure 1). The determined epicenter is located at 34.59°N, 98.34°E at a depth of ∼17 km according to the China Seismological Network (CSN, https://ceic.ac.cn/). This Mw 7.4 earthquake occurred inside the Bayan Har block (Figure 1), which is one of the most active regions with strong earthquakes (Mw
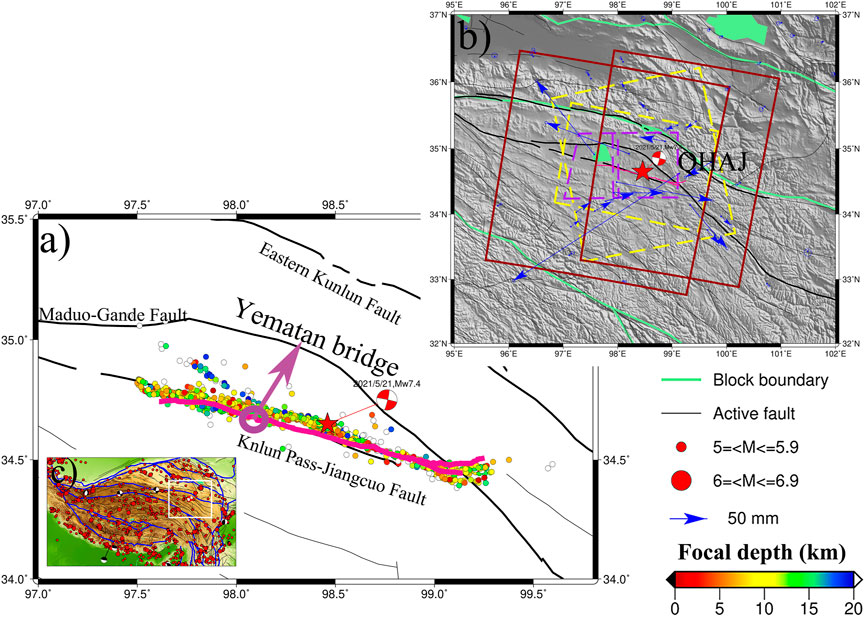
FIGURE 1. Tectonic setting of the 2021 Maduo earthquake. The red star denotes the epicenter location of the 2021 Maduo earthquake. Blue arrows in subplot (B) represent the coseismic horizontal GPS displacements (Wang et al., 2022). The pink line in (A) represents the surface rupture traces. In subplot (A), the black lines are active faults from Deng et al. (2003) and the colored points represent the focal depth from aftershocks of the Maduo earthquake (Wang et al., 2021). The red boxes in subplot (B) are the coverages of ALOS-2 SAR data. The yellow dashed boxes represent the coverages of ascending and descending Sentinel-1 acquisitions. The purple dash boxes are denoted as coverages of Sentinel-2 data. The white box in subplot (C) is the region as shown in subplot (B).
The overall length of the coseismic rupture zone is ∼148 km (Yuan et al., 2022). It is located to the southeast of the big bend of the Kunlun fault (Zhao et al., 2021), which is seismically active and outlines the northern boundary of Bayan Har Block (See Figure 1). In the past year, there have been several geophysical studies (e.g. He et al., 2021; Zhao et al., 2021; Jin and Fialko, 2021; Chen et al., 2022; Liu et al., 2022; Tong et al., 2022) and geological studies (e.g., Ren et al., 2022; Yuan et al., 2022) to determine and investigate the characteristics of the seismogenic fault of the Mw7.4 Maduo earthquake. The geological studies were mostly focused on mapping fault geometry and coseismic surface ruptures. For example, Yuan et al. (2022a) surveyed the horizontal and vertical displacements in the field and via Unmanned Aerial Vehicle (UAV) imageries. They suggested that coseismic vertical displacements were generally small compared with the strike-slip displacements, except at a ∼3 km zone to the west of the Yematan bridge (see Figure 1). According to the complex vertical displacement of surface ruptures, they also found a contrasting sense of fault dipping directions, especially in the west of the epicenter. Such complex geometry conditions are also supported by the study with relocated post-seismic sequences (Wang et al., 2022). Another feature worth noting is a ∼5 km secondary fault rupture strand parallel to the main rupture strand towards the east section of the coseismic rupture (Xu et al., 2021; Liu et al., 2022). This secondary fault merges towards the northwest on the main earthquake fault at around 99 E
In this study, we focused on the 3D coseismic displacement (north-south, east-west, and up components) reconstruction and its tectonic implication. The experiment employed both Sentinel-1 A/B (S1) and Advanced Land Observation Satellite-2 (ALOS-2) acquisitions and applied the Synthetic Aperture Radar Interferometry (InSAR) techniques, which are sensitive in estimating 3D earthquake location and magnitude (Lohman and Simons, 2005). Besides that, coseismic signals were retrieved via sub-pixel correlation from pre- and post-earthquake image pairs that were acquired by SAR and optical satellite sensors, respectively. The Sentinel-2 (S2) multi-band images are acquired in a view geometry differing from the side-looking SAR. It is therefore helpful in improving the constraint in 3D inversion (Zhang et al., 2017; Bacques et al., 2020; Lu et al., 2021). A strain model based on variance component estimation (SM-VCE) (Liu et al., 2019; Hu et al., 2021) was adopted in the reconstruction of 3D displacements. We also discovered the optimal weight scheme of the initial weight in SM-VCE to achieve robust and efficient 3D displacement estimations. Afterward, we further investigated the geometry and kinematic parameters of the seismogenic fault of the 2021 maduo earthquake based on the Okada model (Okada 1985) in an elastic half-space with the resolved 3D displacement field.
2 Dataset and methods
2.1 Data preparation
We acquired the S1 SAR imagery in both ascending and descending orbits, ALOS-2 SAR imagery in two adjacent descending orbits, and multi-band optical imagery acquired by the S2 satellite.
The acquisition dates of SAR coseismic pairs are listed in Table 1. The C-band S1 SAR imagery was acquired in Terrain Observation by Progressive Scans (TOPS) mode. The width of a standard swath is about 250 km. The L-band ALOS-2 SAR data has a longer wavelength of 23.6 cm, which is beneficial to resist decorrelation and measure displacements with a large gradient. The ALOS-2 ScanSAR mode imagery has a swath width of 350 km. The footprints of SAR and optical imagery are shown in Figure 1.

TABLE 1. Basic information of SAR data used herein.
S2 is a high-resolution multispectral satellite with a standard granule size of
Additionally, GPS coseismic measurements published by Wang et al. (2022) were also used in the rest of the studies for validating the reconstructed 3D displacement field. They processed GPS time series ranging from 18 May 2021 to 24 May 2021 and resolved coseismic displacement at 58 continuous sites, which are located within a ∼300 km radius of the epicenter. The GPS-derived coseismic displacement only has minor impacts from post-seismic deformation that are no more than 3 mm at the near-field sites (Wang et al., 2022). As shown in Figure 1, GPS site QHAJ shows a large horizontal displacement, which may be deteriorated by localized displacements (Jiang et al., 2022).
The Shuttle Radar Topographic Mission (SRTM) Digital Elevation Model (DEM) (Rodriguez et al., 2005) was used in the differential interferogram generation. We applied the 90 m SRTM DEM products to ALOS-2 pairs and 30 m SRTM DEM products to S1 pairs. This is because the reported spatial resolution of ALOS-2 ScanSAR data (∼60 m resolution; JAXA, 2012) is lower than that for the S1 dataset (∼22m; ESA, 2022b).
2.2 Extraction of 1D/2D displacement fields from multi-source remote sensing imagery
2.2.1 Sentinel-1 A/B pairs processing
We processed the S1 coseismic pairs in both ascending and descending orbits. Both differential InSAR and pixel offset tracking methods were applied to reconstruct the one-dimension (1D) displacement in Line-of-sight (LOS) direction as well as two-dimensional (2D) displacements in range/azimuth directions, respectively. In InSAR processes, the single look complex (SLC) SAR images were multi-looked by a factor of 10 in range and two in azimuth. The pixels with coherence (<0.6) were masked prior to the phase unwrapping. The Minimum Cost Flow algorithm (Werner and Wegm, 2002) was used to obtain a reliable unwrapped phase.
To conduct the pixel-offset tracking (POT) process (Michel et al., 1999), a window of 128
2.2.2 ALOS-2 pairs processing
We processed ALOS-2 coseismic pairs in two adjacent descending orbits. The bandwidth of acquired SLCs in ScanSAR mode is 28 MHz with a swath width of 350 km, which is large enough to cover the entire rupture fault with a single standard frame. ALOS-2 SAR images were multi-looked by a factor of eight in range and 30 in azimuth. We applied the standard differential interferogram generation approach (Rosen et al., 2000) to each sub-swath of the ScanSAR data to then mosaic them in the geographic coordinate. Note that we did not apply the POT approach to ALOS-2 pairs. This is because: (1) ALOS-2 SAR data is in the L band which has better capability to measure a large displacement; and (2) the ionospheric artifact can largely affect the azimuth displacement estimation in the POT method (Brcic et al., 2010; Meyer, 2011). We used the same InSAR process scheme as that applied to S1 pairs to resolve the unwrapped phase of ALOS-2 pairs. A second-order polynomial was then applied to unwrapped interferograms to model and mitigate the ionospheric artifact.
2.2.3 Sentinel-2 pairs processing
The L1C product of the S2 satellite is an orthoimage product that is geometrically refined. The Sentinel Application Platform (SNAP) developed by ESA was used to conduct the atmospheric correction of L1C. Afterward, we used MicMac software (Rosu et al., 2015; Galland et al., 2016; Rupnik et al., 2017) to conduct sub-pixel correlation and reconstruct the lateral displacement between the pre-earthquake and post-earthquake images of each individual band. The MicMac software is developed to compute the correlation of image pairs in the spatial domain by using a regularization algorithm (Rosu et al., 2015; Galland et al., 2016). The derived displacement fields for visible bands (B2, B3, and B4 bands) and near-fared band (B8) were then stacked to reduce the overall noise level. The outcome is a two Dimensional (2D) ground deformation field in both East-West (EW) and North-South (NS) directions, given the orthographic projection of S2 products. However, the NS component was not included in the rest of the 3D reconstruction. This is because of the existence of large residuals and orbital errors in the NS measurements.
To sum up, the SAR coseismic products are limited to range displacement and azimuth displacement in the satellite side-looking geometry. Additionally, SAR measurements are largely ambiguous with regard to NS movement (Wright et al., 2004). This is related to the sun-synchronous orbit of SAR satellites, which would cause further difficulties in resolving 3D displacement given these SAR data shared a similar side-looking geometry. Therefore, we included the displacement products derived from S2 images in this study. The S2 coseismic pairs captured the displacement in another viewing direction that can introduce an extra constraint in the estimation of the 3D coseismic field.
2.3 Reconstruction of 3D coseismic displacements
Based on the above-generated 1D/2D displacement fields, we can reconstruct the 3D field of the Mw 7.4 Maduo earthquake. To begin the reconstruction, we first sampled the 1D/2D field into the same geographic grid. Each input coseismic displacement field was resampled into a 0.01°
A strain model (SM) based 3D displacement reconstruction approach (Liu et al., 2018; Liu et al., 2019; Liu et al., 2022) was applied here. First of all, a design matrix (A) that connects observations in various viewing directions and unknown 3D displacement at each pixel was constructed. The mathematic expression of the inversion model at a single pixel is a simple linear equation that can be written as follows:
in which
From left to right,
Given the SAR/optical remote sensing reconstructed coseismic components are the projection of 3D deformation components into a certain direction, the design matrix A can be generated from the satellite-looking vector of each component. The geometry vectors of each input displacement field were calculated according to corresponding satellite orientation parameters (e.g., heading angle or/and incidence angle). The basic expression of A can be written as
in which
Afterward, we can further build the functional relationship between displacement observations and 3D surface displacements based on the SM model. The detailed steps of integrating a strain model can be found in Liu et al. (2018) and Liu et al. (2019). Because the SM method is constrained by adjacent points, it is necessary to determine an optimal window to properly determine participating pixels (Shen and Liu, 2020; Wang and Wright, 2012). Taking into consideration that a large window may result in smooth but unrealistic 3D estimation, therefore, we determined an optimal value of window size via a trade-off curve. It was generated between misfit with metric of root mean square errors (RMSE) and different window sizes. Additionally, we took the aforementioned standard deviation calculated during the uniform averaging of each individual grid cell as their initial weight. Given that the input coseismic displacements were measured from multiple sources and techniques, it is necessary to determine a realistic weight for different input observations. Hence, a variance component estimation (Liu et al., 2018) was added to the strain model, as was the so-called SM-VCE method. We conducted an iterative process to determine the relative weight among the eight input observations (Eq. 2). The correction value of each iteration was calculated from the variance component estimation. Based on our experience, the number of iterations is limited to 35 to achieve an efficient convergence.
Note that the SM-VCM method is based on the assumption that the displacements are continuous and smooth in the space. The Maduo earthquake was mainly a strike-slip event, and the two sides of the seismogenic fault were moved relatively in different directions. Thus, the assumption is invalid for pixels in the near field of the rupture zone. Therefore, it is necessary to guarantee that the deformation signals of pixels within a certain window are spatially continuous when we used these surrounding pixels to form a strain model. To solve this issue, we set up a polyline barrier based on geologically mapped rupture information (Yuan et al., 2022). For each window, we then excluded the pixel from the other side of the barrier prior to the inversion 3D inversion.
3 Results
3.1 3D surface displacements
Based on the strategy described in Section 2.1, the coseismic displacement fields in the LOS direction via InSAR are demonstrated in Figure 2. The InSAR-derived range displacement fields show a similar spatial pattern. Their maximum displacements are both within 1 m. This is mainly because S1 and ALOS-2 have similar viewing geometries. However, the C-band S1 interferograms were decorrelated in the zone to the east of the epicenter, especially in the ascending orbit (Figure 2A). This decorrelation is related to the large displacement, as this zone is where the maximum coseismic deformation occurred (Wang et al., 2022). Benefiting from the longer wavelength, the L-band ALOS-2 results have achieved better coherence in the near field.
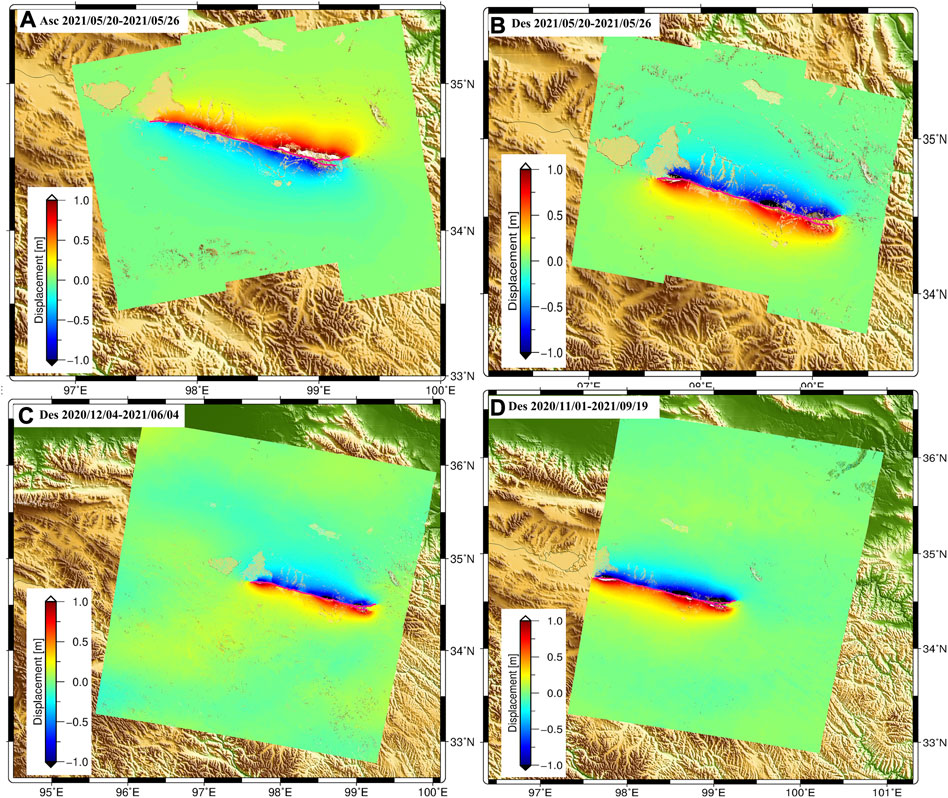
FIGURE 2. Satellite LOS displacement fields derived from ascending (A) and descending (B) of S1 data as well as track 41 (C) and track 42 (D) of ALOS-2 satellite in descending orbit.
The coseismic displacements derived from the POT method are shown in Figure 3. The overall POT estimated displacement in range direction has similar patterns to that estimated from InSAR. The west part of the coseismic deformation field shows larger displacements than that in the east. As mentioned above, POT can measure offsets even when the displacement gradient is large regardless of data wavelength. Therefore, the coseismic movement near the fault rupture zone has been fully resolved. However, the azimuth displacement derived via POT shows a high noise level for both ascending and descending orbits. The sun-synchronous orbit and side-looking viewing geometry of SAR satellites, thus limits their ability in measuring NS movement. Additionally, the NS movement is relatively minor for the Mw 7.4 Maduo earthquake (Yuan et al., 2022). Both of these factors contribute to the high noise level of POT azimuth products (Figures 3B,D), which were therefore excluded in the rest of the 3D inversion.
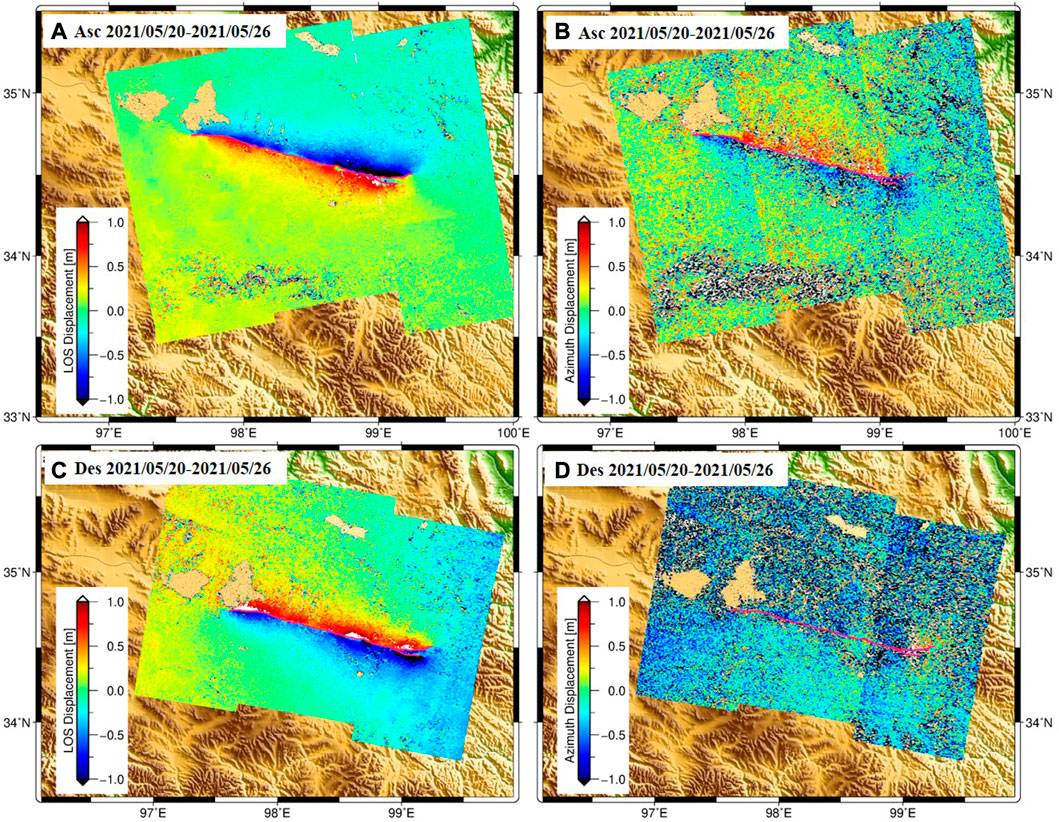
FIGURE 3. Range (A–C) and azimuth (B–D) displacement fields of Maduo earthquake calculated from the ascending and descending S1 pairs via POT approach.
The measured horizontal displacements from the multi-band optical remote sensing imagery are shown in Figure 4. The spatial pattern differs greatly from the range or LOS movement in Figure 2 and Figure 3, as NS displacements did not diminish towards the far field of the rupture zone (Figure 4A). This is likely because the displacements in the range direction are a combination of NS, EW, and UP components, while Figure 4B demonstrates only the NS component. Additionally, the spatial reference to EW movement in Figure 4 is also different from that of InSAR or POT. The measured coseismic displacement in the NS and EW directions range between ∼2 m. This is reasonable for movement in the NS direction. However, it is too large for that in the EW direction. We considered that the EW estimation with the S2 pair was likely impacted by large residual orbital errors.
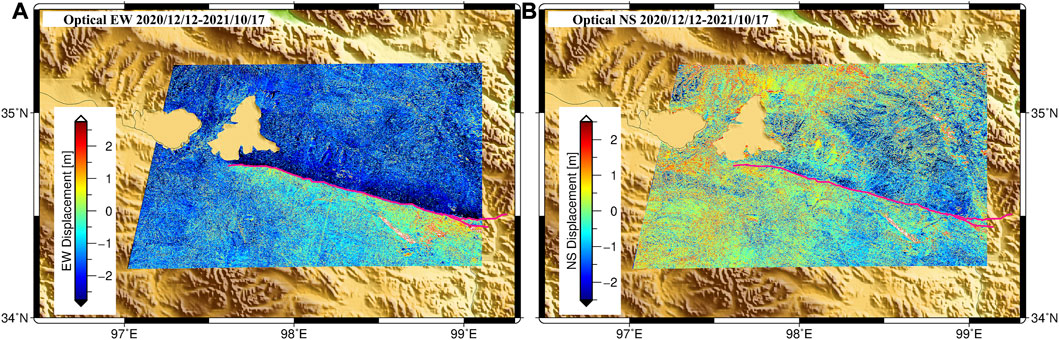
FIGURE 4. Horizontal coseismic displacements of Maduo earthquake based on MicMac software. (A) and (B) are the east-west and north-west components.
Finally, taking into consideration that the strike of the Maduo earthquake in the NW-SE direction is approximately perpendicular to the flight direction of the descending Sentinel-1 satellite, the azimuth displacement result from the descending S1 pairs shows large noises, so does the S2-derived NS displacement. Therefore, they were excluded in 3D inversion. Afterward, we conducted a joint estimation with the solution described in Section 2.3. Additionally, we tested the different sizes of windows (from ∼2 km to ∼14 km) in the SM-VCE inversion. As shown in Figure 5, the L curve was generated based on each tested window size and the associated global misfit. In the end, an optimal window of 2.5 km was determined and applied to solve the 3D displacement field.
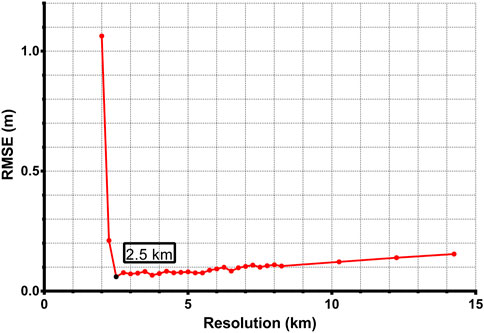
FIGURE 5. A trade-off curve between RMSE and window size in SM-VCE estimation.
The reconstructed 3D coseismic displacements are shown in Figure 6. Due to the limited spatial coverage of Sentinel-2 images, the resolved 3D displacements have a smaller spatial size that is nevertheless enough to cover approximately the entire rupture zone. Obviously, the ground surface movement of the 2021 Mw 7.4 Maduo earthquake is dominated by the EW displacements, which are in a range of -2m ∼ 2 m. The NS displacement is much smaller (ranging from -0.8m–0.8 m), which also seems not continuous from east to west of the rupture zone. The UP component is in about -0.5m–0.5 m that is mainly concentrated in the near field of the rupture zone. The existence of a vertical movement field implies that this earthquake is also associated with some minor dip-slip movement, especially in the east and west sections of the rupture zone, where the strike direction starts changing.
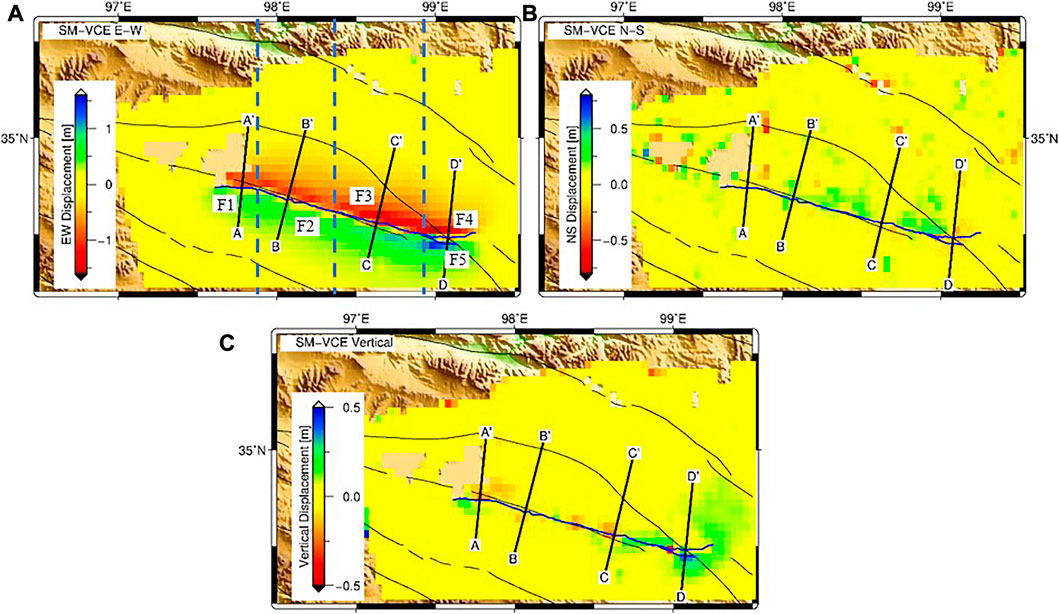
FIGURE 6. Derived 3D dimensional deformation fields of Maduo earthquake. (A–C) are the east-west, north-south and vertical components.
We plotted four profiles across the coseismic zone (Figure 6A). As shown in Figure 7, there is a fast decaying on both sides of the Jiangcuo fault, which is the suggested seismogenic fault of the Maduo earthquake (Wang et al., 2022). The largest EW displacement is captured at profile DD’. Additionally, also along profile DD’, there are two jumps in the UP component, which may be related to the eastern two branches of the rupture fault. The displacement signal for the UP component for these four profiles shows overall different patterns. It is likely because the dip angle varies from east to west as suggested by Yuan et al. (2022) and Wang et al. (2022).
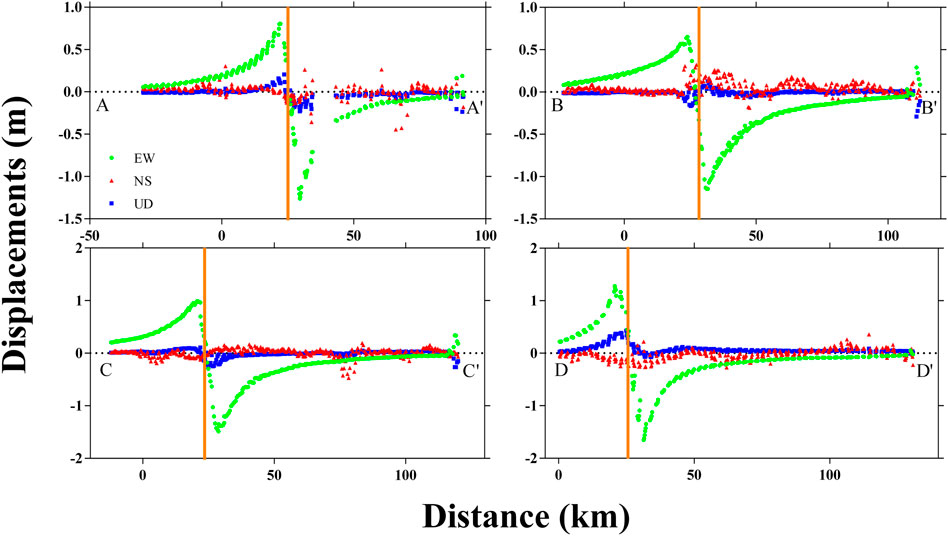
FIGURE 7. Cross section of 3D coseismic deformation fields. The EW (green circle), NS (red triangle), and UP (blue square) displacement components are corresponding to the four profiles. (A), (B), (C), and (D) are associated with profiles AA′, BB′, CC′, and DD′ respectively. The orange line represents the Jiangcuo fault.
3.2 Validation for 3D displacements
1) Validation with GPS
To validate the quality of reconstructed 3D displacement fields, we computed the difference between GPS-derived displacements (Wang et al., 2022) and above-derived 3D displacements. We determined pixels within a radius of 0.02° of each GPS station and averaged them to represent the SM-VCE-derived 3D displacement. We then further computed the RMSE of differences between SM-VCE and GPS measurements in three directions (Table 2). In the same table, we also listed the result from Liu et al. (2021), which reconstructed the 3D field with multi-source SAR imagery. The result indicates an improvement in the accuracy of the resolved NS and EW components. It indicates the advantages of adding displacement derived from S2 imagery and therefore highlights the importance of fusion SAR and optical products in 3D displacement reconstruction.
2) Validation with geological fieldwork
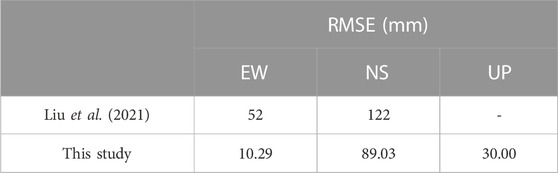
TABLE 2. RMSE of Maduo earthquake determined from different studies.
Yuan et al. (2022) surveyed horizontal displacement at a total of 68 sites in the field. In this study, we compared reconstructed displacements with their measurements from the geological study. We adopted the same strategy used above to select pixels around each measurement site, while we took the maximum value from the selected pixel for the comparison. The result can be visualized in Figure 8. The horizontal displacements derived by the SM-VCE method are consistent with that surveyed in a field within a range of 0.5 m. We found that the SM-VCE result shows an overall underestimation in the west section, while an overestimation in the east section compared with the in-field measurements. This is likely related to the variation in the width of the coseismic rupture zone. The presented study measured overall displacement across the entire rupture zone, while the infield measurement surveys were offset at a fixed location with limited crossing fault distance (e.g., a few or tens of meters). Another impact could be the post-seismic deformation, given that the temporal resolution of remote sensing data was limited by the revisiting time of satellites. Their products therefore may contain some level of post-earthquake displacements. As suggested by He et al. (2021), the west section hosts larger post-seismic deformation compared with the other part of the fault.
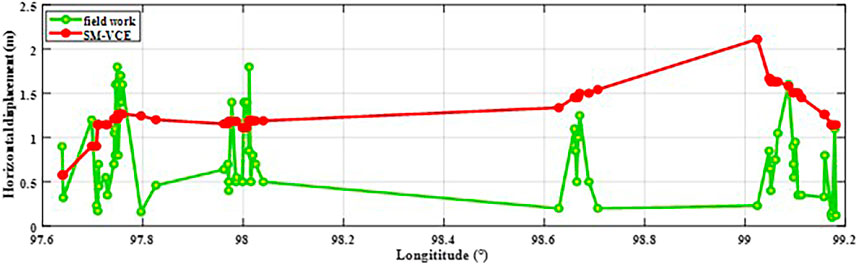
FIGURE 8. Comparison between the horizontal displacements based on SM-VCE method and infield measurement.
4 Discussion
4.1 Optimal weight scheme of SM-VCE
During the study, we also found a strong dependence on reconstructed 3D displacements and initial weight at each input pixel in SM-VCE estimation. We tested a case run using equal weight as the initial weight scheme for each grid pixel. The corresponding result is presented in Figure 9, showing that the quality is obviously compromised with the equal initial weight. Moreover, the processing time for solving 3D displacements was nearly doubled, and it encountered more difficulties in reaching convergence. Therefore, we want to emphasize the importance of determining the proper initial weight of each input pixel when using the SM-VCE method. In Section 2.2, the applied initial weight was calculated from the standard deviation in the uniform averaging, which is recommended here. While any other weighting schemes that can properly represent the quality of the input dataset would also be applicable.
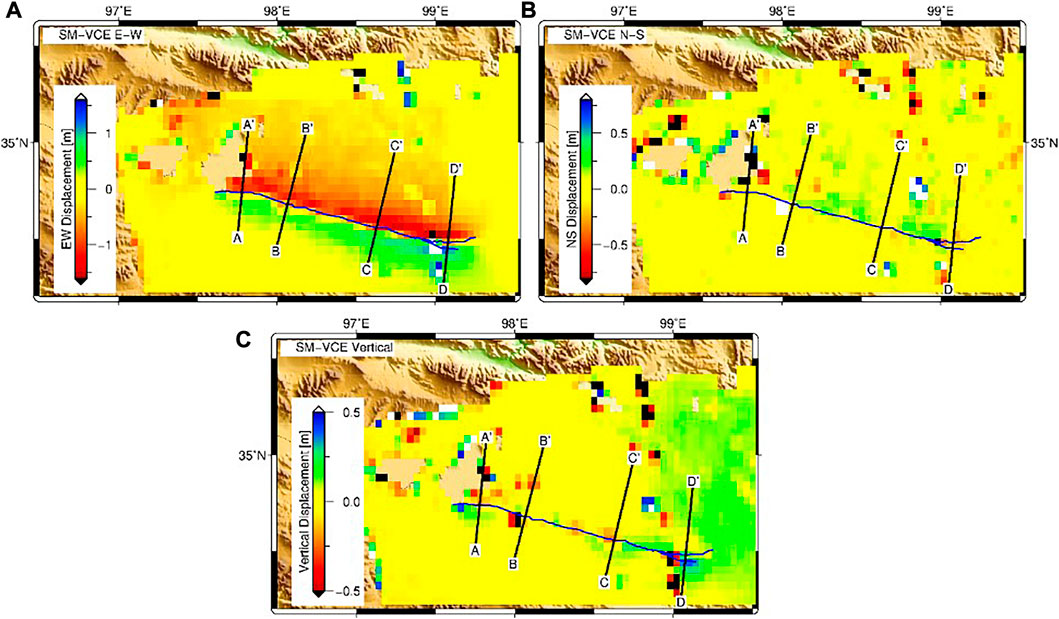
FIGURE 9. SM-VCE resolved 3D deformation of Maduo earthquake when using an equal initial weight of each input grid cell. (A–C) are the east-west, north-south and vertical components.
4.2 Coseismic slip distribution and structure of seismogenic fault
An elastic dislocation model (Okada 1985) with a Poisson’s ratio of 0.25 was used here to discover the kinematic parameters of seismogenic fault as well as the coseismic slip distribution. The steepest decent method was applied to solve the parameter estimation (Wang et al., 2013). The relocated aftershock catalog (ranging from 22 May 2021 to 30 May 2021) and fault trace of remote sensing images were employed to constrain the fault strike, and we, therefore, construct a fault model with five segments (see Figure 6A). The average strike of F1, F2, F3, F4, and F5 are 272°, 285°, 285°, 89°, and 118°, respectively. The top and bottom of the fault depth are set at a value of 0 and 20 km, respectively. The fault plane is discretized into patches with a size of 2 × 2 km. The rake angles of slip vectors are applied to vary from -45° to 45°. A quad-tree algorithm (Simons et al., 2002) was applied to sub-sample 3D displacements. The down-sampled final dataset consists of 7548 points.
The coseismic slip distribution of the Mw 7.4 Maduo earthquake constrained by the resolved 3D displacements is shown in Figure 11. Note that the dip angles of F1, F2, and F3 which are pre-defined according to the result published by Xu et al. (2021) are 75°, 70°, and 80° respectively. While the fault dip was estimated for the rest of the two segments (F4 and F5). We set up a search space for dip angles that ranges from 85° to 115° for F4 and 50°–115° for F5 with a step of 5°. By changing the dip angle from 0° to 180°, the dipping direction changes from North to South. The optimal dip was then determined by minimizing the global misfit. In the end, the resulting dip angle of F4 and F5 are 85° and 80° towards the south direction, respectively (see Figure 10). The correlation between the observed and modeled dataset reached ∼0.98.
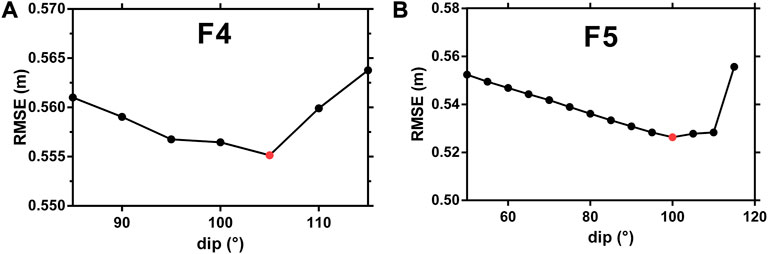
FIGURE 10. determination of optimal dip angle for segments F4 and F5.
The determined slip distribution is demonstrated in Figure 11. And the synthetic observation, simulation, and residual from the coseismic slip model inversion explains the rationality and reliability of the inversion result (Figure 12). The inversion result shows that the slip was mainly concentrated at a depth ≥15 km and the largest slip is approximately 6 m, which is located at the eastern section of the fault at a depth of 5 km. The moment magnitude obtained through inversion is about Mw 7.4 and the released energy is ∼
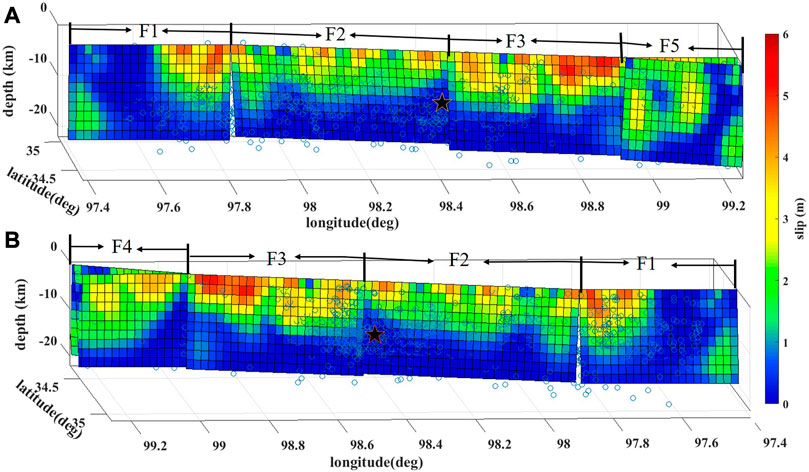
FIGURE 11. Fault-slip distribution of the Mw 7.4 mainshock. (A) is the front view of the slip distribution of two faults. (B) is the back view. The blue hollow is the result of relocated post-seismic sequence. Black stars represent the location of the hypocenter.
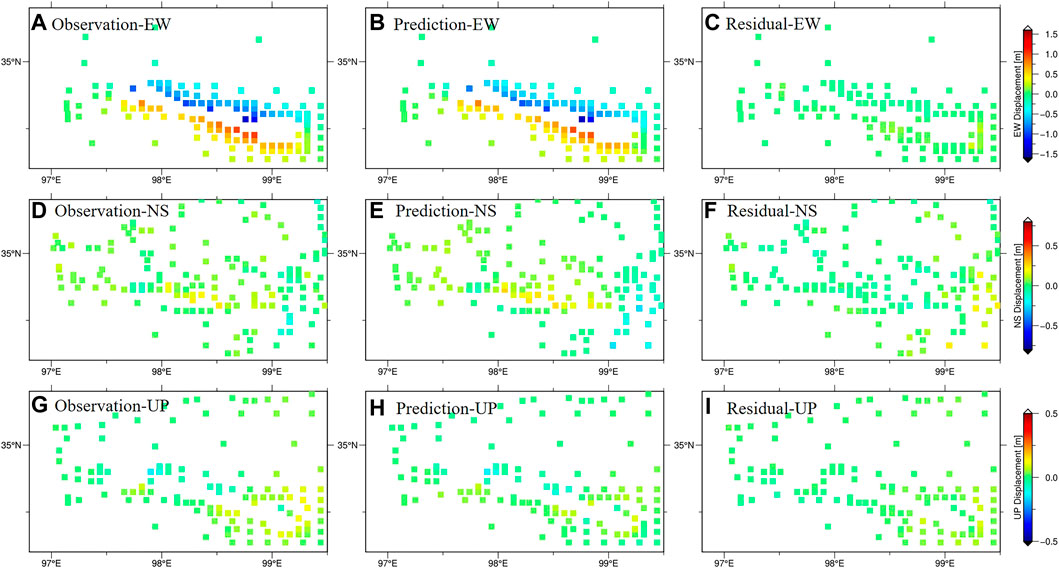
FIGURE 12. Synthetic observation, simulation, and residual from coseismic slip model inversion constrained by EW (A–C), NS (D–F) and UP (G–I) displacements.
We also plotted the geodetic strain field for the 2021 Maduo earthquake (Figure 13). As the associated strain parameters were simultaneously calculated in SM-VCE when resolved from 3D deformation. According to Figure 13, the maximum shear strain is located at a zone around
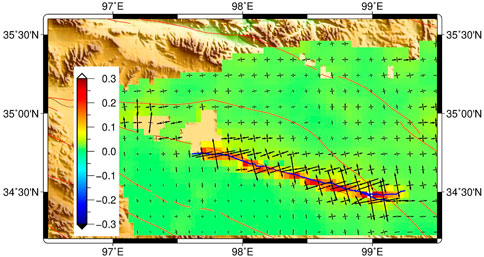
FIGURE 13. Maximum shear for the 2021 Maduo earthquake (Unit: ×
5 Conclusion
In this study, we focused on the 3D coseismic displacement reconstruction and its tectonic implication for Maduo Mw 7.4 earthquake. With derived displacement in range/offset directions from ALOS-2 and S1 pairs as well as NS direction from S2 pairs, we resolved the 3D coseismic displacement by using the SM-VCE method. We discovered the optimal weight scheme of the initial weight in SM-VCE to achieve robust and efficient 3D displacement estimations. We recommend using the standard deviation calculated in uniform averaging as the initial weight or other weighting schemes that can properly represent the quality of the input dataset. And adding displacement derived from S2 imagery can improve the accuracy of estimated NS and EW components. Based on the resolved 3D coseismic deformation fields, we further investigated the dip angles for the two segments (F4 and F5) to the east of the epicenter. The optimal dip angles were determined towards the south with values of 85° and 80° respectively. The moment magnitude obtained through inversion was about Mw7.4 corresponding to released energy of ∼
Data availability statement
The raw data supporting the conclusions of this article will be made available by the authors, without undue reservation.
Author contributions
All authors listed have made a substantial, direct, and intellectual contribution to the work and approved it for publication.
Funding
This work was supported by the National Key Research Development Program of China (Grant No. 2019YFC1509201).
Acknowledgments
We would like to thank Jihong Liu from Central South University in China for his helpful suggestions. The Sentinel Application Platform (SNAP) is a common architecture for all Sentinel Toolboxes and is distributed by ESA via the link https://earth.esa.int/eogateway/tools/snap. The Micmac software is open-source and developed by the Institute Geìographique National (IGN) in France, which could be downloaded via the link https://github.com/micmacIGN/Documentation. The Sentinel-1 A/B SAR data were provided by ESA via the distribution of the Alaska Satellite Facility (ASF) (https://search.asf.alaska.edu/). ALOS-2 PALSAR2 dataset was ordered via PASCO Corporation. And Generic Mapping Tools (GMT) were used for figure illustrations (https://gmt-china.org/).
Conflict of interest
The authors declare that the research was conducted in the absence of any commercial or financial relationships that could be construed as a potential conflict of interest.
Publisher’s note
All claims expressed in this article are solely those of the authors and do not necessarily represent those of their affiliated organizations, or those of the publisher, the editors and the reviewers. Any product that may be evaluated in this article, or claim that may be made by its manufacturer, is not guaranteed or endorsed by the publisher.
References
Bacques, G., de Michele, M., Foumelis, M., Raucoules, D., Lemoine, A., and Briole, P. (2020). Sentinel optical and SAR data highlights multi-segment faulting during the 2018 Palu-Sulawesi earthquake (Mw 7.5). Sci. Rep-Uk 10, 9103. doi:10.1038/s41598-020-66032-7
Brcic, R., Parizzi, A., Eineder, M., Bamler, R., and Meyer, F. (2010). “Estimation and compensation of ionospheric delay for SAR interferometry,” in Proceedings of the symposium at 2010 IEEE International Geoscience and Remote Sensing Symposium, Honolulu, HI, USA, 25-30 July 2010.
Chen, K., Avouac, J., Geng, J., Liang, C., Zhang, Z., Li, Z., et al. (2022). The 2021 Mw 7.4 madoi earthquake: An archetype bilateral slip-pulse rupture arrested at a splay fault. Geophys Res. Lett. 49, e2021G–e95243G. doi:10.1029/2021GL095243
Deng, Q., Zhang, P., Ran, Y., Yang, X., Min, W., and Chen, L. (2003). Active tectonics and earthquake activities in China. Earth Sci. Front. 10 (S1), 66–73.
Diao, G., Wang, X., Gao, G., Nie, X. H., and Feng, X. D. (2010). Tectonic block attribution of the wenchuan and yushu earthquakes distinguished by focal mechanism types. Chin. J. Geophys. 53, 849–854. doi:10.1002/cjg2.1554
ESA (2022a). Resolution and swath. Available at: https://sentinel.esa.int/web/sentinel/missions/sentinel-2/instrument-payload/resolution-and-swath.
Galland, O., Bertelsen, H. S., Guldstrand, F., Girod, L., Johannessen, R. F., Bjugger, F., et al. (2016). Application of open-source photogrammetric software MicMac for monitoring surface deformation in laboratory models. J. Geophys. Res. Solid Earth 121, 2852–2872. doi:10.1002/2015jb012564
Gan, J., Hu, J., Li, Z., Yang, C., Liu, J., Sun, Q., et al. (2018). Mapping three-dimensional co-seismic surface deformations associated with the 2015 MW7.2 Murghab earthquake based on InSAR and characteristics of crustal strain. Sci. China Earth Sci. 61, 1451–1466. doi:10.1007/s11430-017-9235-4
He, L., Feng, G., Wu, X., Lu, H., Xu, W., Wang, Y., et al. (2021). Coseismic and early postseismic slip models of the 2021 Mw 7.4 Maduo earthquake (Western China) estimated by space-based deodetic data. Geophys Res. Lett. 48, e2021G–e95860G.
Hu, J., Liu, J., Li, Z., Zhu, J., Wu, L., Sun, Q., et al. (2021). Estimating three-dimensional coseismic deformations with the SM-VCE method based on heterogeneous SAR observations: Selection of homogeneous points and analysis of observation combinations. Remote Sens. Environ. 255, 112298. doi:10.1016/j.rse.2021.112298
Jia, K., Zhou, S., Zhuang, J., and Jiang, C. (2021). Stress transfer along the western boundary of the bayan har block on the tibet plateau from the 2008 to 2020 yutian earthquake sequence in China. Geophys Res. Lett. 48, e2021G–e94125G. doi:10.1029/2021gl094125
Jiang, W., Xu, C., Li, Z., Wu, Y., Tan, K., Geng, J., et al. (2022). Using space observation techniques to study temporal and spatial characteristics of seismogenic process, occurrence and deformation of the Qinghai Madoi MW7.4 earthquake. Chin. J. Geophys. 65, 495–508.
Liu, J., Hu, J., Li, Z., Ma, Z., Wu, L., Jiang, W., et al. (2022). Complete three-dimensional coseismic displacements related to the 2021 Maduo earthquake in Qinghai Province, China from Sentinel-1 and ALOS-2 SAR images[J]. Sci. China Earth Sci.
Liu, J., Hu, J., Li, Z., Zhu, J. J., Sun, Q., and Gan, J. (2018). A method for measuring 3-D surface deformations with InSAR based on strain model and variance component estimation. IEEE Trans. Geoscience Remote Sens. 56, 239–250. doi:10.1109/tgrs.2017.2745576
Liu, J., Hu, J., Xu, W., Li, Z., Zhu, J., Ding, X., et al. (2019). Complete three-dimensional coseismic deformation field of the 2016 central tottori earthquake by integrating left- and right-looking InSAR observations with the improved SM-VCE method. J. Geophys. Res. Solid Earth 124, 12099–12115. doi:10.1029/2018jb017159
Liu, L., Li, Y., Zhu, L., and Ji, L. (2021). Influence of the 1947 Dari M7.7 earthquake on stress evolution along the boundary fault of the bayan har block: Insights from numerical simulation. Chin. J. Geophys. 64, 2221–2231.
Liu, X., Chen, Q., Yang, Y., Xu, Q., Zhao, J., Xu, L., et al. (2022). The 2021 Mw7.4 Maduo earthquake: Coseismic slip model, triggering effect of historical earthquakes and implications for adjacent fault rupture potential. J. Geodyn. 151, 101920. doi:10.1016/j.jog.2022.101920
Lohman, R. B., and Simons, M. (2005). Some thoughts on the use of InSAR data to constrain models of surface deformation: Noise structure and data downsampling. Geochem. Geophys. Geosystems 6. doi:10.1029/2004gc000841
Lu, C., Lin, Y., and Chuang, R. Y. (2021). Pixel offset fusion of SAR and optical images for 3-D coseismic surface deformation. Ieee Geosci. Remote S 18, 1049–1053. doi:10.1109/lgrs.2020.2991758
Meyer, F. J. (2011). Performance requirements for ionospheric correction of low-frequency SAR data. Ieee T Geosci. Remote 49, 3694–3702. doi:10.1109/tgrs.2011.2146786
Michel, R., Avouac, J., and Taboury, J. (1999). Measuring ground displacements from SAR amplitude images: Application to the Landers Earthquake. Geophys Res. Lett. 26, 875–878. doi:10.1029/1999gl900138
Okada, Y. (1985). Surface deformation due to shear and tensile faults in a half-space. B Seismol. Soc. Am. 75, 1135–1154. doi:10.1785/bssa0750041135
Ren, J., Xu, X., Zhang, G., Wang, Q., Zhang, Z., Gai, H., et al. (2022). Coseismic surface ruptures, slip distribution, and 3D seismogenic fault for the 2021 Mw 7.3 Maduo earthquake, central Tibetan Plateau, and its tectonic implications. Tectonophysics 827, 229275. doi:10.1016/j.tecto.2022.229275
Rodriguez, E., Morris, C. S., Belz, J. E., Chapin, E. C., Martin, J. M., Daffer, W., et al. (2005). An assessment of the SRTM topographic products. Technical Report JPLD-31639.
Rosen, P. A., Hensley, S., Joughin, I. R., Li, F., Madsen, S., Rodriguez, E., et al. (2000). Synthetic aperture radar interferometry. P Ieee 88, 333–382. doi:10.1109/5.838084
Rosu, A., Pierrot-Deseilligny, M., Delorme, A., Binet, R., and Klinger, Y. (2015). Measurement of ground displacement from optical satellite image correlation using the free open-source software MicMac. Isprs J. Photogramm. 100, 48–59. doi:10.1016/j.isprsjprs.2014.03.002
Rupnik, E., Daakir, M., and Pierrot Deseilligny, M. (2017). MicMac – a free, open-source solution for photogrammetry. Open geospatial data, Software and standards2: 14.Shen Z and Liu Z. 2020. Integration of GPS and InSAR data for resolving 3-dimensional crustal deformation. Earth Space Sci. 7, e1036E–e2019E.
Simons, M., Fialko, Y., and Rivera, L. (2002). Coseismic deformation from the 1999 Mw 7.1 hector mine, California, earthquake as inferred from InSAR and GPS observations. B Seismol. Soc. Am. 92, 1390–1402. doi:10.1785/0120000933
Song, X., Han, N., Shan, X., Wang, C., Zhang, Y., Yin, H., et al. (2019). Three-dimensional fault geometry and kinematics of the 2008 M 7.1 Yutian earthquake revealed by very-high resolution satellite stereo imagery. Remote Sens. Environ. 232, 111300. doi:10.1016/j.rse.2019.111300
Tong, X., Xu, X., and Chen, S. (2022). Coseismic slip model of the 2021 maduo earthquake, China from sentinel-1 InSAR observation. Remote Sens. 14, 436. doi:10.3390/rs14030436
Vallée, M., Landès, M., Shapiro, N. M., and Klinger, Y. (2008). The 14 November 2001 Kokoxili (Tibet) earthquake: High-frequency seismic radiation originating from the transitions between sub-Rayleigh and supershear rupture velocity regimes. J. Geophys. Res. Solid Earth 113, B07305. doi:10.1029/2007jb005520
Wang, H., and Wright, T. J. (2012). Satellite geodetic imaging reveals internal deformation of Western Tibet. Geophys Res. Lett. 39. doi:10.1029/2012gl051222
Wang, H., Xu, C., and Ge, L. (2007). Coseismic deformation and slip distribution of the 1997 7.5 Manyi, Tibet, earthquake from InSAR measurements. J. Geodyn. 44, 200–212. doi:10.1016/j.jog.2007.03.003
Wang, M., Wang, F., Jiang, X., Tian, J., Li, Y., Sun, J., et al. (2022). GPS determined coseismic slip of the 2021Mw7.4 Maduo, China, earthquake and its tectonic implication. Geophys J. Int. 228, 2048–2055. doi:10.1093/gji/ggab460
Wang, R., Diao, F., and Hoechner, A. (2013). “Sdm - a geodetic inversion code incorporating with layered crust structure and curved fault geometry,” in EGU General Assembly Conference Abstracts.
Wang, W., Fang, L., Wu, J., Tu, H., Chen, L., Lai, G., et al. (2021). Aftershock sequence relocation of the 2021 MS7.4 maduo earthquake, Qinghai, China. Sci. China Earth Sci. 64, 1371–1380. doi:10.1007/s11430-021-9803-3
Werner, C. L., and Wegm, U. (2002). “Processing strategies for phase unwrapping for InSAR applications,” in Proceedings of the 4th European Conference on Synthetic Aperture Radar.
Wright, T. J., Parsons, B. E., and Lu, Z. (2004). Toward mapping surface deformation in three dimensions using InSAR. Geophys Res. Lett. 31, L01607. doi:10.1029/2003gl018827
Wu, L., Lu, J., Mao, W., Hu, J., Zhou, Z., Li, Z., et al. (2022). Sectional fault-inclination-change based numerical simulation of tectonic stress evolution on the seismogenic fault of Maduo earthquake. Chin. J. Geophys. 65, 3844–3857. doi:10.6038/cjg2022P0988
Xu, L., Chen, Q., Zhao, J., Liu, X. W., Xu, Q., and Yang, Y. H. (2021). An integrated approach for mapping three-dimensional CoSeismic displacement fields from sentinel-1 TOPS data based on DInSAR, POT, MAI and BOI techniques: Application to the 2021 Mw 7.4 maduo earthquake. Remote Sens. 13, 4847. doi:10.3390/rs13234847
Yuan, Z., Li, T., Su, P., Sun, H., Ha, G., Guo, P., et al. (2022). Large surface-rupture gaps and low surface fault slip of the 2021 Mw 7.4 maduo earthquake along a low-activity strike-slip fault, Tibetan plateau. Geophys Res. Lett. 49, e2021G–e96874G. doi:10.1029/2021gl096874
Zhang, L., Wu, J., and Feng, S. (2017). Measuring the coseismic displacements of 2010 Ms7.1 yushu earthquake by using SAR and high resolution optical satellite images. ISPRS - Int. Archives Photogrammetry, Remote Sens. Spatial Inf. Sci. XLII-2/W7, 665–670. doi:10.5194/isprs-archives-xlii-2-w7-665-2017
Zhao, D., Qu, C., Chen, H., Shan, X., Song, X., and Gong, W. (2021). Tectonic and geometric control on fault kinematics of the 2021 Mw7.3 maduo (China) earthquake inferred from interseismic, coseismic, and postseismic InSAR observations. Geophys Res. Lett. 48, e2021G–e95417G. doi:10.1029/2021gl095417
Keywords: coseismic displacements, three-dimensional displacements, InSAR, pixel offset tracking, multi-source remote sensing
Citation: Hua J, Gong W, Shan X, Zhang G and Song X (2023) Three-dimensional coseismic displacements and slip distribution of the 2021 Mw 7.4 maduo earthquake: Synergy of SAR, InSAR and optical images. Front. Earth Sci. 11:1060044. doi: 10.3389/feart.2023.1060044
Received: 02 October 2022; Accepted: 13 February 2023;
Published: 02 March 2023.
Edited by:
Ziyadin Cakir, Istanbul Technical University, TürkiyeCopyright © 2023 Hua, Gong, Shan, Zhang and Song. This is an open-access article distributed under the terms of the Creative Commons Attribution License (CC BY). The use, distribution or reproduction in other forums is permitted, provided the original author(s) and the copyright owner(s) are credited and that the original publication in this journal is cited, in accordance with accepted academic practice. No use, distribution or reproduction is permitted which does not comply with these terms.
*Correspondence: Wenyu Gong, Z3dlbnl1QGllcy5hYy5jbg==; Xinjian Shan, eGpzaGFuQDE2My5jb20=