 Cláudia Reis
 A. Santos Nouri
 António Lopes
- 1University of Lisbon, Centre of Geographical Studies, Institute of Geography and Spatial Planning, Lisbon, Portugal
- 2Department of Interior Architecture and Environmental Design, Faculty of Art, Design and Architecture, Bilkent University, Bilkent, Türkiye
- 3Associated Laboratory Terra, Portugal
Extreme heat is a current and future issue on urban areas, with negative impacts on health and quality of life (increasing morbidity and mortality rates). This paper analyses day (12:00–15:00 h) and nighttime (00:00–03:00 h) thermo-physiological comfort (TC) conditions by Local Climate Zones (LCZ) in Lisbon during a particular Local Weather Type (LWT), very hot summer days. For this, 13 different microscale sample areas were chosen covering urban and non-urban land cover classes (LCZs 1–3, 4–6, 8, 9, A and B). Universal Thermal Climate Index (UTCI) and Mean Radiant Temperature (MRT) were modeled on SkyHelios software for 163 days between 2008 and 2014. Results show that during the day all urban LCZ samples depict the same average TC conditions (average UTCI of 34°C—strong heat stress) and densely wooded areas are 2°C cooler (average UTCI of 32°C—moderate heat stress). However, compact areas (LCZs 1–3) with low sky view factor and some vegetation (street trees) display lower percentages of area with higher thermo-physiological discomfort (TD) levels (83% with strong heat stress against 98% in LCZs 8 and 9 and 100% in LCZs 4–6). When considering the hottest days (air temperatures equal or above 35°C—75th percentile), the moderate heat stress class disappears in all samples and the very strong heat stress class appears only on urban areas, occupying between 12% and 16% on LCZs 1–3, 10%–22% on LCZs 4–6, 16%–22% on LCZs 8 and 9 on LCZ 9. During the nighttime period all samples show no thermal stress, favoring nocturnal physiological recovery. TC conditions in Lisbon are strongly influenced by solar radiation and wind, which explains the need to increase the shading area, preferably by trees, and to promote and preserve ventilation paths.
1 Introduction
Today, most urban areas are suffering from excessive heat stress conditions caused by, on one side, modifications of the surface’s energy balance with the impermeabilization of the ground and reduction of vegetation cover and, on the other side, the local impact of global climate change (Stewart and Oke, 2012; Fröhlich and Matzarakis, 2018; Nouri et al., 2018; Fröhlich and Matzarakis, 2020). In Lisbon’s Metropolitan Area (LMA), the average Urban Heat Island (UHI) intensity, characterized by higher (nocturnal) air temperature in the city compared to the surrounding countryside (Stewart and Oke, 2012), reaches 1.3°C on the hottest summer days and surpasses 2°C on 10% of days of this Local Weather Type (LWT—Reis et al., 2022a). Future climate projections show increases of 1.3°C to 3.2°C (RCPs 4.5 and 8.5, respectively) in average air temperatures, 1.5°C to 3.5°C in maximum temperatures, and 1.7°C to 3°C in minimum temperatures for the LMA by the end of this century (2071–2100), especially in the summer and autumn seasons (Lopes et al., 2018). Additionally, according to the authors in LMA the number of summer days (maximum air temperatures equal or above 25°C) will increase from almost a month (26.8 days—RCP 4.5) to almost 2 months (55.1 days—RCP 8.5), the really hot days (maximum air temperatures equal or above 35°C) from 7.3 (RCP 4.5) to 16.1 days (RCP 8.5), and the tropical nights (average minimum temperatures equal or above 20°C) from 10.8 days (RCP 4.5) to over a month (34 days—RCP 8.5). The frequency (from 2 to 2.6 events), intensity and duration (from 12 to 23.2 days) of heat waves will also increase significantly by 2071–2100 (Lopes et al., 2018). These scenarios will escalate the susceptibility and vulnerability to excessive heat events (Lopes et al., 2018).
Increasingly warmer urban atmospheres are accompanied by the reduction of thermo-physiological comfort (TC) conditions and, consequently, severe negative impacts on human health and wellbeing, with a significant increase in mortality/morbidity rates, especially among vulnerable groups like children, sick (previous chronic illnesses) and/or disabled individuals, workers and the elderly (Milošević et al., 2016; Huang et al., 2018; Huang et al., 2020). Iungman et al. (2023) estimated the mortality burden that could be attributed to UHI in 93 European cities. The investigation depicted 6,700 premature deaths due to this effect, which correspond to around 4%–33% of all summer deaths. Additionally, Kyaw et al. (2023) analyzed spatiotemporal changes in outdoor wet-bulb globe temperature (an heat stress indicator that includes the thermal, solar and convective heat transfers from ambient temperatures, humidity, solar radiation and wind speed -Spangler et al., 2022) between 1979 and 2021 on South Asia (Afghanistan, Bangladesh, Bhutan, India, Nepal, Pakistan and Sri Lanka), one of the most exposed regions to heat hazards. The authors concluded that every year 17 million people have been exposed excessive heat conditions.
TC can be defined as the achievement of thermal equilibrium at normal body temperature (37°C) by thermal balance (Choudhury et al., 2011; Rengasamy, 2011). In the past few decades, an array of indexes was developed to describe the effect of the urban thermal environment on the human body (Jendritzky et al., 2012; Matzarakis et al., 2016; Potcher et al., 2018). One of the most well-known indices is the Universal Thermal Climate Index or UTCI (Jendritzky et al., 2012), based on the heat balance of the human body (Matzarakis et al., 2016; Fröhlich et al., 2019; Fröhlich and Matzarakis, 2020). UTCI is usually calculated using meteorological data like air temperature, vapor pressure, wind speed and Mean Radiant Temperature (MRT) and represented in degrees Celsius (°C), which makes it easily understood as an indicator of thermal stress (Matzarakis et al., 1999; Matzarakis et al., 2016; Fröhlich and Matzarakis, 2018; Nouri et al., 2018; Fröhlich et al., 2019). MRT is the most important meteorological parameter for TC estimation, especially when it comes to outdoor urban spaces during sunny summer days. This parameter measures and synthesizes the thermal influence of all very complex short and longwave radiation fluxes that reach the human body (Fröhlich et al., 2019) and indicates how human beings experience radiation in their surrounding environment (Manavvi and Rajasekar, 2020). For that, MRT is defined as the temperature of a perfect black and equal surrounding environment, which leads to the same energy balance as the current environment (Fanger, 1973).
Until now, a significant amount of research has sought to contribute to environmental design and urban planning issues, especially to climate-sensitive outdoor design, by evaluating TC in different urban canyons and the influence of urban climate factors on the human body (Ketterer and Matzarakis, 2014; Huang et al., 2018; Huang et al., 2020). According to Rodríguez Algeciras et al. (2016), outdoor urban spaces are important for assessing the sustainability in cities. Thus, the assessment of outdoor TC conditions provides crucial information for urban planners in order to identify critical areas that need interventions on surface materials, building configuration and ventilation corridors, green spaces, anthropogenic heat emissions (transportation, air conditioning systems, industries, etc.) and urban morphology. In addition, TC assessment provides further information to standard UHI analyses, which only show and compare the distribution of air temperatures across different land uses within an urban area against its rural surroundings (Krüger et al., 2014).
The knowledge acquired by the TC modeling can only be valuable to urban planners and architects if local climate experts are capable of properly communicating these guidelines in measurable and objective terms, which implies a strong interdisciplinarity between urban climate research and urban planning and design (Oliveira et al., 2020b). That’s why a standard typification of Land Cover/Land Use classes according to their climatic response was recently created and has been adopted worldwide by the research community in urban climate-related studies (Oliveira et al., 2020b). Local Climate Zones (LCZ) are defined as regions of uniform surface cover, structure, material and human activity that span hundreds of meters to several kilometers in horizontal scale (Stewart and Oke, 2012; Oke et al., 2017). This climate-related classification can be applied in different fields of urban climatology like UHI studies, architecture, urban planning, ecology, weather forecasting, historical temperature analysis and climate modeling, especially TC research. Since the LCZ scheme is a global classification with a limited number of classes (17) which are defined by measurable physical properties of the urban environment, it has been considered suitable to access and portrait intra-urban TC differences (Geletič et al., 2018; Unger et al., 2018).
So far, several studies modelled TC by LCZ. For instance, Milošević et al. (2016) estimated Physiologically Equivalent Temperature (PET) by LCZs in Novi Sad (Serbia—with a Köppen Geiger classification of “Cfb,” according to Peel et al., 2007) during a heat wave period constrained only to 4 days (5–8 July 2014). Later, Geletič et al. (2018) calculated HUMIDEX (an heat index designed to quantify human heat exposure) by LCZs on Brno (Czech Republic - Köppen Geiger classification of “Cfb,” according to Peel et al., 2007), using the urban climate model MUKLIMO_3. On a larger scale, Unger et al. (2018) modeled PET on urban and non-urban LCZ classes in Szeged (Hungary—Köppen Geiger classification of “Cfb,” according to Peel et al., 2007) using a long term data series (2014–2017). Lau et al. (2019) calculated PET (questionary surveys and mobile measurements) on 8 different LCZs in Hong Kong (Köppen Geiger classification of “Cfa”, according to Peel et al., 2007), a subtropical high-density city. Later, Das et al. (2020) calculated UTCI and Temperature Humidity Index (THI) by LCZs in Sriniketan-Santiniketan Planning Area (West Bengal—Eastern India: Köppen Geiger classification of “Aw” or tropical savanna climate, according to Peel et al., 2007) based on surveys during 23 late spring/early summer days. Recently, Ren et al. (2022) modeled Predicted Mean Vote (PMV) by LCZs in Zhengzhou (China—Köppen Geiger classification of “Cfa,” according to Peel et al., 2007) using ENVI-met software but focused only on a specific day (7 July 2019). On the same country, Wu et al. (2022) evaluated UTCI in Shenzhen (same Köppen Geiger classification) using 65 weather stations covering 11 LCZ classes in order to analyze the temporal and spatial patterns of TC and its related factors. However, the authors also focused on a specific time period, 1st to 30 July 2020.
In Lisbon, the knowledge about bioclimatic conditions is limited to a handful of studies, with a couple mesoscale analysis and only two isolated urban blocks studied (microscale). On an early stage, Andrade (2003) analyzed interannual and seasonal variation of PET (between 1971 and 2000) at the city scale, according to different LWTs. At the microscale, the author focused only on an urban block located at north of Lisbon (Telheiras—a well ventilated spot by the N and NW prevailing winds). In 2005, Andrade and Vieira (2007) studied the microclimate patterns (including PET) within and around an average-sized urban green space (Gulbenkian’s garden). Later, Baltazar (2010) produced PET maps for Lisbon also according to LWT. Recently, Nouri (2018) focused on outdoor TC conditions during the summer of 2015 within on of Lisbon’s oldest civic spaces (Rossio), located at the city historic center, in order to propose public space design solutions based upon the square’s microclimatic risk factors.
Therefore, the purpose of this investigation is twofold:
• To analyze TC according to different land use/land cover classes in Lisbon under specific meteorological conditions associated to excessive thermal stress from heat and;
• To identify the LCZ(s) with the highest and lowest TC levels and in two different time periods, the daytime (Urban Cool Islands—UCI) and the nighttime period (positive and stable UHI).
2 Materials and methods
TC conditions in Lisbon were assessed at the microscale on urban blocks representative of urban and vegetated LCZ classes spread throughout the city (northern part, city center and east and west riverside area (Figure 1). UTCI and MRT were modeled on SkyHelios for over 1,300 h on very hot summer days between 2008 and 2014 and its outcomes were further processed on GIS systems (ArcGIS) and RStudio Team (2020).
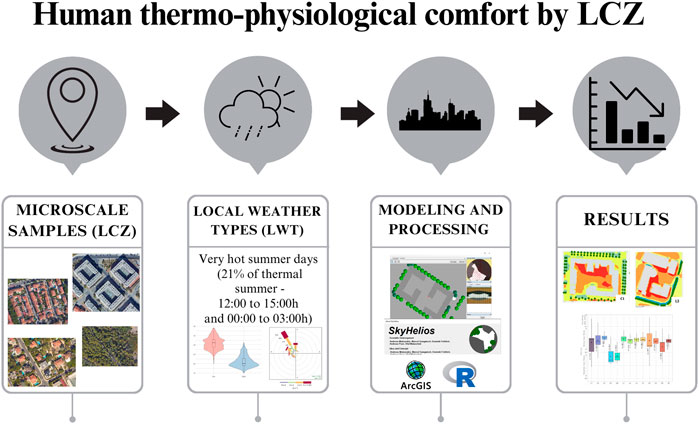
FIGURE 1. Human thermo-physiological comfort by Local Climate Zones in Lisbon: workflow.
2.1 Study area geographic location and local climate conditions
Lisbon (Portugal—Figure 2 ) is a Mediterranean city with a temperate climate (Köppen Geiger classification of “Csa,” according to Peel et al. (2007)), with dry and hot summers, moderate and rainy winters and a high interannual variability of the temperature and precipitation regimes.
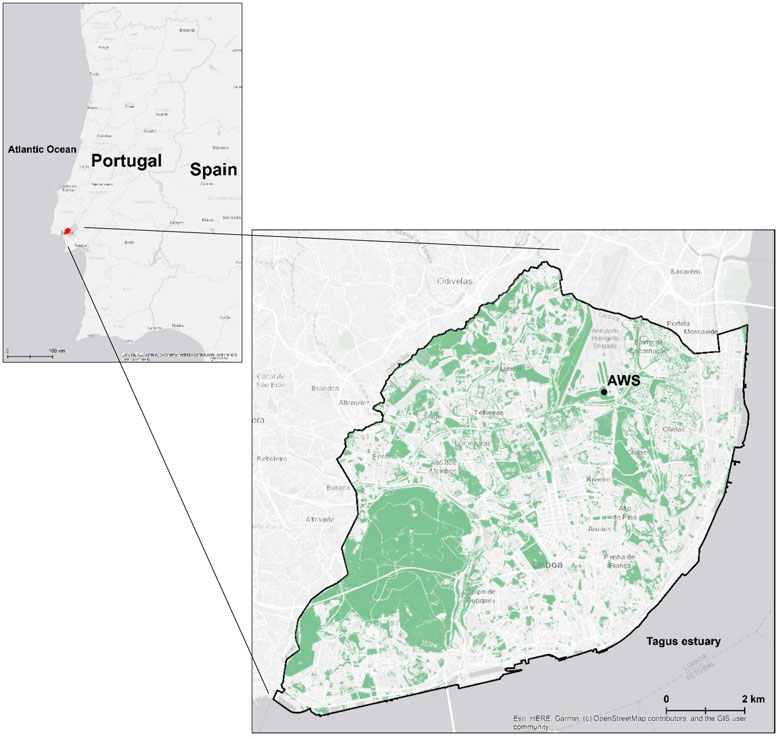
FIGURE 2. Geographical location of the study area (Lisbon). AWS –Lisbon’s Airport weather station. Data source: Lisbon city hall (https://geodados-cml.hub.arcgis.com/).
This urban area is located on the southwestern extremity of the European continent (38⁰ 43′N; 9⁰ 9′W), enclosed by the Tagus estuary at S and E and with the proximity to the Atlantic Ocean at W. Its unique topographic conditions include four main valleys on the southern part of the city and a plateau at the north, even though the maximum altitude only ranges between 160 m on the riverfront area, and 226 m at the Monsanto forest hill, considered the “green urban lung” on the western part of Lisbon (Andrade, 2003; Lopes, 2003). This relatively rugged topography, along with the recent and continuous urban sprawl to the N on the last decades often block the penetration of humid air masses coming from N and NW (Lopes et al., 2011).
Considering Lowry’s (1977) framework, the urban climate is a sum of three components: the regional (“background”), local and urban effects. Lisbon’s local weather conditions were recently synthesized into LWT by Reis et al. (2020); Reis et al. (2022a); Reis et al. (2022b). N and NW winds are quite frequent across seasons in Lisbon (average daily wind speeds ranging between 4 and 6 m/s), especially during summer, where all LWT show a dominance of these wind directions, with a high water vapor content (Lopes et al., 2011; Reis et al., 2020; Reis et al., 2022a). These winds are known as “Nortada”, and they increase in speed during the afternoon, cooling down the city and removing the air pollutants (Lopes et al., 2011). During summer all LWTs are generally characterized by higher temperatures (average diurnal temperatures above 21°C) and clear skies. Very dry air masses coming from E and NE occur mostly on autumn (23% of thermal autumn, between 9th October and 25th November) and winter (22% between 26th November and 3rd March) providing extreme cold weather conditions (possible cold spells), clear skies and the absence of precipitation (Reis et al., 2020; Reis et al., 2022a). Also on both seasons, rainy weather conditions are more frequent (10% on thermal autumn and 7% on thermal winter), with winds coming from W, SW and S at higher speeds, often above 7 m/s.
2.2 Land use/land cover portrayal and urban morphology parameters
Recently, the LCZ classification for LMA was updated by Oliveira et al. (2020a), Oliveira et al. (2020b). The authors created an alternative geographic information system (GIS)-based method and a corresponding toolbox to overcome the accuracy issues from the satellite-based classification method from World Urban Database and Access Portal Tools (WUDAPT). This reclassification method was based on two different Copernicus datasets: Urban Atlas and Corine Land Cover. The outputs of the procedure show that the Lisbon’s urban fabric is mostly a mid-rise continuum within municipal boundaries. The denser urban fabric (LCZs 1 to 3) occurs in Lisbon’s historic center and occupies 3% of its metropolitan region (21% of the city’s total area). These classes are characterized by high impermeabilization of the surface with a dense building coverage of different heights and little to no vegetation (Stewart and Oke, 2012). This core is surrounded by a discontinuous network of urban sprawl (LCZs 4 to 6), which occupies more than double of compact areas (6% of LMA and 13% of the Lisbon’s total area—Oliveira et al., 2020b). LCZs 4 to 6 comprise an open arrangement of buildings with different heights and a higher vegetation cover and pervious surfaces (Stewart and Oke, 2012). Additionally, large low-rise (LCZ 8) and sparsely built areas (LCZ 9) appear scattered throughout the LMA and occupy a small portion of this area (4 and 2%, respectively — Oliveira et al., 2020b). However, the LCZ 8 is dominant on 18% of the Lisbon’s city limits. Regarding the vegetation patterns, according to Oliveira et al. (2020b) the low plants class (LCZ D) prevails in LMA with 43% of the total area, followed by scattered trees (LCZ B) with 19% and dense trees (LCZ A), with 11%. Inside the Lisbon’s municipality boundaries, the Monsanto Forest Hill area is mainly covered by deciduous and coniferous dense trees (LCZ A), while deciduous scattered trees are distributed by the small and mid-size urban green spaces along with densely arborized streets (ex: Avenida da Liberdade). Lastly, the area covered by scattered coniferous trees in Lisbon is insignificant as well as the LCZ C (bush scrub—only 5% of LMA).
According to Oliveira et al. (2020b), higher mean values of morphological parameters like Volumetric Index (VI—ratio between the building volume and maximum volume of each pixel—Correia, 2019), Height/Width ratio (H/W—ratio between the height of the building and the width of the streets) and Z0 (aerodynamic roughness: height above the displacement plane at which the mean wind becomes zero when extrapolating the logarithmic wind speed profile downward through the surface layer—American Meteorological Society, 2019) are generaly found in more compact or high rise typologies (LCZs 1 to 4), as is the case of Lisbon. Additionally, H/W and Z0 show few spatial variations in this city, except for large public/green spaces or vacant lots (Oliveira et al., 2020b). The urban density parameter was calculated for Lisbon by Correia (2019), who quantified an array of current urban geometry indices relevant for the Lisbon’s UHI analysis. With a GIS system, Lisbon’s urban area was divided into 100 x 100 m cells and for the urban density calculation the height, surface area and volume of buildings were considered, as well as the width of the streets and the area exposed to the prevailing wind (Correia et al., 2015). The high urban density areas in Lisbon display a very high aerodynamic roughness and compacity, while moderate urban density areas have a lower aerodynamic roughness and a H/W ratio below 1. According to Correia (2019), most of Lisbon is composed of low urban density areas, with moderate roughness, low compacity and a low VI.
2.3 Thermo-physiological comfort assessment
2.3.1 Selection of sample areas by Local Climate Zones
For the TC assessment, 13 different sample areas located within Lisbon’s municipality boundaries were chosen based on the LCZ (Figure 3).
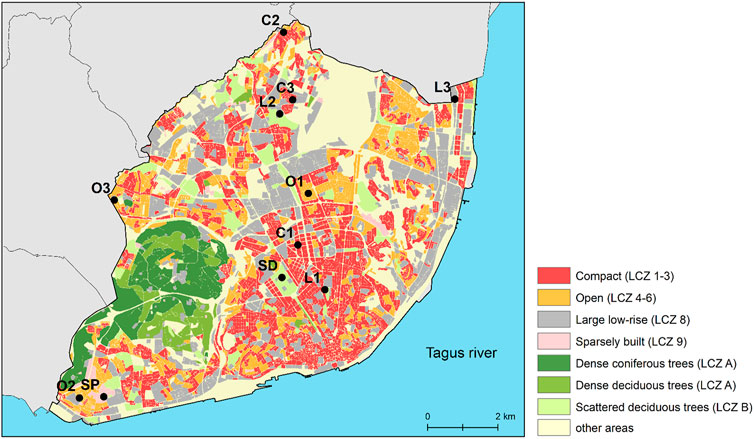
FIGURE 3. LCZ sample areas in Lisbon for TC modeling. LCZ territorial basis was updated by Oliveira et al. (2020a), Oliveira et al. (2020b). Description: Compact 1 (C1—Avenidas Novas); Compact 2 (C2—Ameixoeira); Compact 3 (C3—Lumiar); Open 1 (O1—Belém); Open 2 (O2—Anjos); Open 3 (O3—Lumiar); Large 1 (L1—Restelo); Large 2 (L2—Benfica); Large 3 (L3—Moscavide); Sparsely built (SP—Alvalade); Scattered trees deciduous (SD)—sample area of deciduous scattered trees (LCZ B) at city center (Avenida da Liberdade).
Samples areas DC (Dense Trees coniferous) and DD (Dense Trees deciduous) are not associated with a precise geographic location. Instead, they are representative of heavily wooded areas in Lisbon’s Monsanto Forest. Despite the fact that the dense mix buildings (LCZs 1 to 3) occurs mostly on the city historic center and LCZs 4 to 6 are located on the surroundings of this core, the spatial discontinuity of these classes is very high. So, the number of urban blocks that are classified as belonging totally to a specific LCZ is low. For this reason, LCZs 1 to 3 (compact mix-rise) were aggregated, as well as LCZs 4 to 6 (open mix-rise). According to Stewart and Oke (2012), the LCZ system is inherently generic and cannot capture the peculiarities of every urban and rural site because its view of the landscape is highly reductionist, and, like all classifications, its descriptive and explanatory powers are limited. Consequently, for each of these 2 LCZ groups and for LCZ 8 (large low-rise), three different sample areas were chosen (C1 to C3, O1 to O3 and L1 to L3). In addition, for LCZ 9 (sparsely built-up areas) only one sample was chosen since this class only accounts for about 1.1% of the city’s total area. Regarding the vegetation layers, for LCZ A (dense coniferous and dense deciduous trees) and B (scattered deciduous trees), 1 sample area per subclass was chosen (DC, DD and SD). For the LCZs with less than 1% of the Lisbon’s municipal area TC indices were not modeled (LCZ 10—heavy industry and LCZ B—scattered coniferous trees). Also, LCZs C (bush scrub) and D (low plants) were not considered in this investigation due to lack of a detailed cartography about the distribution of these vegetation layers (counting of specimens, species) in Lisbon.
Figure 4 displays the urban canyons selected for TC modeling, described as follows (see Supplementary Tables S1–S3 with the details about geographic coordinates, altitude and several urban geometry indicators):
• C1: a compact urban canyon (NW-SE) located on the city center (Avenidas Novas) at 86 m of altitude; significant portion of vegetation;
• C2: compact urban canyon (NW-SE) located in the northernmost area of Lisbon (Ameixoeira), at 128 m of altitude, with less vegetation cover than C1;
• C3: compact urban canyon (NE-SW) at north of Lisbon, immediately south of C2, at 113 m of altitude; little area dedicated to vegetation, like C2, and mainly lawns;
• O1: urban canyon (NW-SE) situated in the north city center, at north of C1 sample area (84 m of altitude); significant vegetated area (mainly trees);
• O2: urban block (NW-SE) located on the western part of Lisbon, near the riverfront area, at 17 m of altitude; significant vegetated area (lawns and trees on residential private gardens);
• O3: urban canyon (NW-SE) located on the western part of Lisbon, at north of Monsanto Forest Hill (81 m altitude); significant vegetated area (lawns and trees on residential private gardens);
• L1: urban block (NE-SW) located at city core, near the Lisbon’s historic center, at 77 m altitude; lower vegetated area (several trees) than L1 and L3;
• L2: urban block (NW-SE) located near C3 sample area, at north of Lisbon (108 m altitude); vegetation around the blocks, especially lawns and several trees;
• L3: urban block (N-S) located on the east side of Lisbon (Moscavide) near the Tagus estuary, at altitude; significant proportion of trees on the adjacent streets and few lawns;
• SP: urban canyon (NW-SE) located on the vicinity of O2 sample area, at 30 m of altitude; residential area (single family houses) with fewer and more dispersed buildings, a significant number of trees and a few lawns;
• SD: this portion of Eduardo VII urban park (NW-SE) is located in the center of Lisbon (97 m altitude), near the street with the highest car traffic and, consequently, the highest atmospheric pollution levels on the city (Avenida da Liberdade); large areas covered by lawns and a few trees aligned on the sides;
• DC and DD: these samples represent a portion of Monsanto Forest Hill, with dense tree-type vegetation (coniferous and deciduous species) and no buildings.
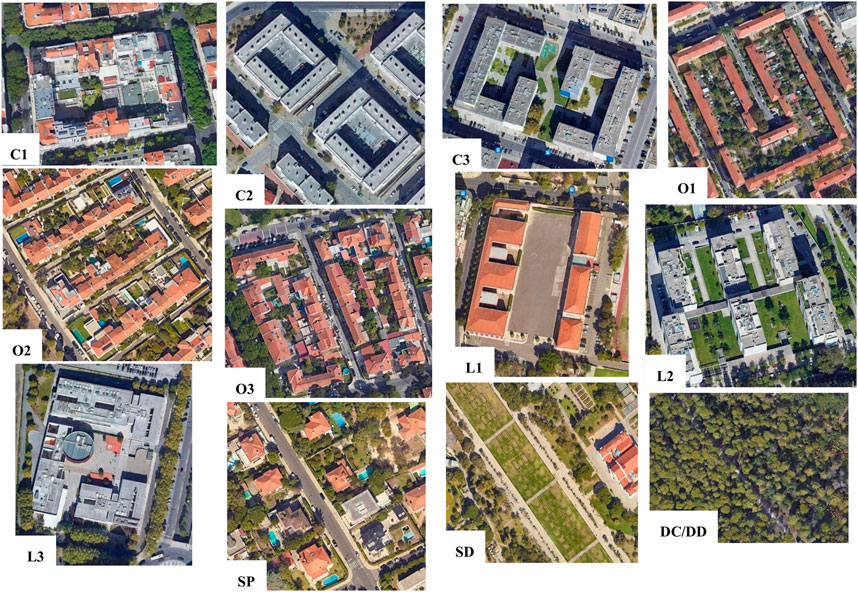
FIGURE 4. Lisbon sample areas selected for UTC modeling. Source: Google Earth Pro.
2.3.2 Meteorological input data
As input meteorological data for SkyHelios, hourly air temperature, relative humidity, cloud cover, wind speed and direction, and global radiation registered at the airport weather station (Figure 3) were incorporated. Hourly global radiation data refers to the thermal infrared irradiance under all sky conditions reaching an horizontal plane at the Earth’s surface. A sample of 163 very hot summer days between 2008 and 2014 was selected. This LWT occurs on 21.4% of the thermal summer (Reis et al., 2020; Reis et al., 2022a). Local Standard Time in Portugal during this season is UTC + 1 h (Western European Summer Time—WEST). Figure 5 displays the day and nighttime meteorological conditions registered at the Lisbon’s airport weather station (Figure 2).
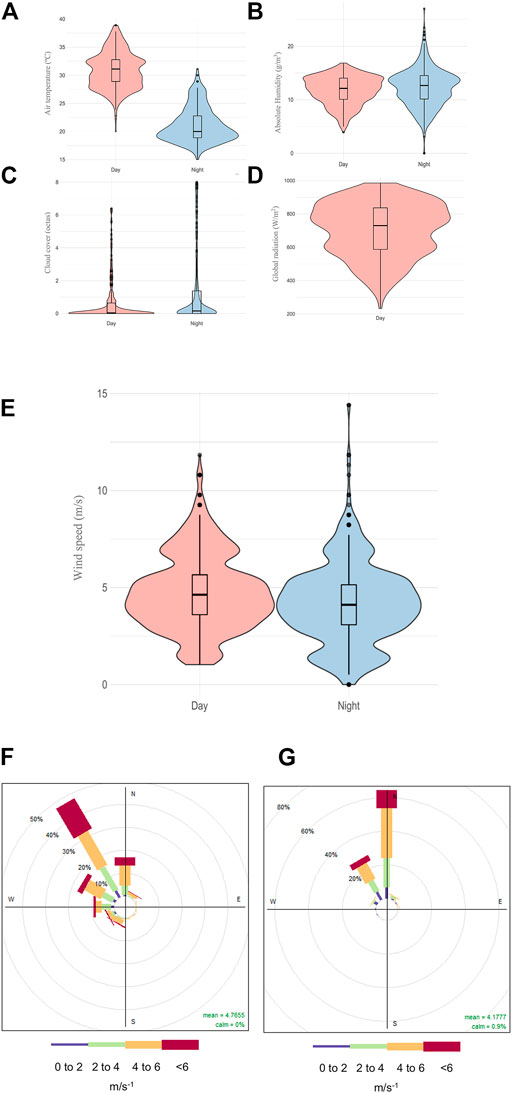
FIGURE 5. (A) Day (12:00 to 15:00 h) and nighttime (00:00–03:00 h) input meteorological data from very hot summer days (2008–2014) in Lisbon (airport weather station data): (A) air temperature (°C); (B)absolute humidity (g/m3); (C) cloud cover (octas); (D) global radiation (W/m2); (E) wind speed (m/s); (F) daytime wind-rose; (G) nighttime wind rose.
During the day, average air temperatures reach 31°C but range mostly between 25°C and 39°C, while at nighttime average minimum temperatures reach 20°C (tropical nights—Lopes et al., 2018), even though on the majority of days stay around 19°C. The water content of these air masses is quite similar on both periods but slightly higher during the night (average daytime absolute humidity of 11.7 g/m3 against 12.2 g/m3 during the night). Skies are often clear during both periods of the day (average cloud cover below 1 octa) and the amount of radiation that reaches the surface during the daytime period ranges between 250 W/m2 and almost 1,000 W/m2, depending on the day of the year and the hour of the day (in June and July the amount of global radiation is higher than on the remaining months of the thermal summer). Wind blows at average speeds of 4 m/s, slightly stronger during the day, even though it ranges mostly between 2 and 10 m/s, coming especially from NW during the daytime period and from N at night.
Average day and nighttime UHI intensity for these 163 days was retrieved (Reis et al., 2022a; Reis et al., 2022b) in each sample area and on the corresponding LCZ (Table 1). During the day the average UHI intensity is generally low on all urban LCZ classes and sample areas, except for O2 sample (UHI intensity drops 0.1°C at night). On most compact and open sample areas (except for O2, with 1°C and C1 with 0°C) an UCI emerges during this time period. LCZ 8 sample areas show a very slight UHI, between 0.1°C and 0.2°C and the SP sample area presents a higher daytime UHI intensity, with 0.7°C. At night, the intensity rises considerably (0.9°C difference on L3 and 0.8°C on C1 and L1, for instance) and on L3 sample surpasses 1°C. This behavior is consistent with previous research about Lisbon’s daily UHI cycle (Oliveira et al., 2021; Reis et al., 2022a), which showed the formation of a slight UCI in Lisbon during the day and the rise of the UHI intensity at late afternoon with its stabilization during the night. Vegetation LCZ classes and samples show a different path. LCZ A and the respective samples DC and DD depict a slight UHI (between 0.2°C and 0.3°C) during the day and an UCI at night (between −0.1 and −0.3°C), while LCZ B (sparse trees) presents a slightly higher UHI during the day (0.5°C) that drops 0.1°C at night.
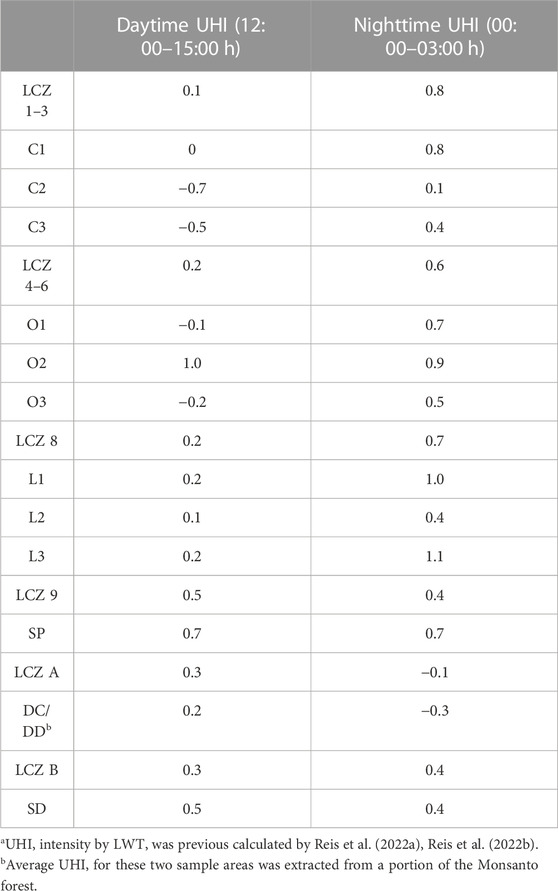
TABLE 1. Average daytime and nighttime UHIa by LCZ and sample areas in Lisbon.
2.3.3 Input geospatial data and software configurations
The TC modeling by LCZs was performed on SkyHelios. This free and user-friendly software was developed especially for microclimate and human biometeorology studies that include the estimation of radiation fluxes, MRT and thermal indices like Perceived Temperature (PT), PET and UTCI with very high resolution on a spatial continuous basis (Chen et al., 2017; Fröhlich et al., 2019). It incorporates typical spatial formats (shapefiles, TIFF, ASCII and CityGML), as well as special formats used by other models like Rayman obstacle files or ENVI-met area input files (Fröhlich et al., 2019). Based upon the SVF, the radiation fluxes are performed on vector-basis for any location within the model domain (Fröhlich and Matzarakis, 2018; Nouri et al., 2018). Fröhlich and Matzarakis (2018) highlighted that SkyHelios does not consider the urban surroundings in terms of different surfaces, but in terms of pixels in the fisheye image weighted by the sine of the distance to the images center. SkyHelios can achieve good results on urban and complex environments with a short development and computing time and with low costs due to the use of open source frameworks (Matzarakis and Matuschek, 2011; Fröhlich and Matzarakis, 2018).
In this case, for each sample area two different shapefiles from GIS systems were included in SkyHelios: a polygon shapefile with buildings and a point shapefile with street trees provided by the Lisbon’s municipal council with detailed information about building heights and tree types. Supplementary Table S4 presents all different street tree specimens from each sample area included in the TC modeling. The majority of street trees are deciduous. Since only the street trees in Lisbon are catalogued, there are some trees missing on several samples, especially on residential areas (private gardens). Also, lawns were not included in the modeling. Additionally, samples DC and DD are a representation of the densely wooded areas with coniferous and deciduous trees in the Monsanto Forest. For that, the distances between the tree crowns on some areas of this forest were measured using Google Earth Pro (v.7.3.4.) and a point shapefile was created on GIS considering those measurements (average crown distance of 12 m). This shapefile is the same on both DC and DD samples, only the tree species and average height were changed. Considering building radiative properties, SkyHelios default values are in accordance with previous literature (Oke et al., 2017) about albedo and emissivity standards for urban areas.
Regarding the wind model settings, Supplementary Table S5 displays the configurations previously defined in SkyHelios. The diagnostic steady-state wind model implemented into this software calculates four different modifications to the wind field caused by the multiple obstacles (buildings and/or trees): a stagnation zone windward from the obstacle, a recirculation on the lee-side, a velocity deficit zone adjacent to the recirculation and a street canyon vortex (Fröhlich and Matzarakis, 2018). The most important wind settings are dependent on the meteorological input conditions like the instrument height (m), which sets the level for the input wind speed and direction records, Z0 (m), displacement height or ZD (m) and the atmospheric stability factor, which describes the tendency for horizontal or vertical exchange in the lower atmosphere (Matzarakis and Matuschek, 2011). Modelled wind speed and direction are further incorporated into the assessment of the human thermal comfort (Matzarakis et al., 2021).
2.3.4 Thermo-physiological comfort indices
In this investigation, UTCI, one of the most know worldwide TC indices was modeled, as well as MRT. UTCI is a thermal index defined as “the isothermal air temperature of the reference condition that would elicit the same dynamic response (strain) of the physiological model” (Jendritzky et al., 2012). This index was developed following the concept of an equivalent temperature (ET) and it if often estimated with a regression equation based on Fiala’s heat transfer model, due to the extremely high complexity and computational effort (Błażejczyk et al., 2010; Fiala et al., 2012; Jendritzky et al., 2012). A wind speed of 0.5 m/s at 10 m height, relative of humidity of 50%, a constant water vapor pressure of 20 hPa, MRT equals to air temperature and a moving individual at 4 km/h (metabolic rate of 135 W/m-2) are considered as reference conditions for UTCI calculation. Table 2 presents the different UTCI values categorized in terms of thermal stress (Błażejczyk et al., 2013).
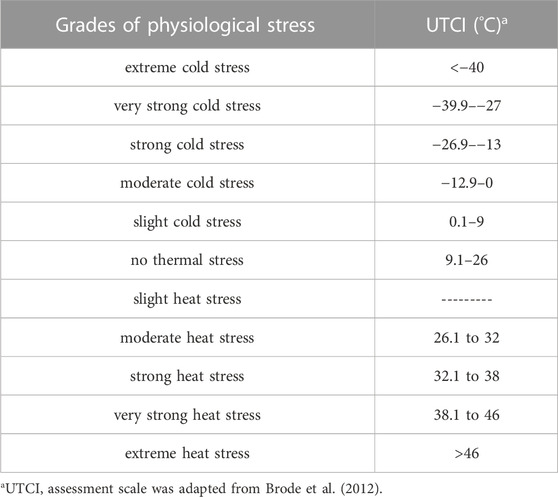
TABLE 2. UTCI assessment scale and grades of physiological stress.
It is important to notice that UTCI is only a quantitative evaluation of the surrounding environment’s thermal sensation and of the physiological stress of human beings. In this case, the clothing/personal features were kept on default on SkyHelios (a man with 80 kg, 1.75 m and 35 years old; clothing of 0.9 clo and activity of 80 W—standing).
Since one of the most important determining factors of UTCI is the MRT (Matzarakis et al., 1999), this parameter was also separately calculated in SkyHelios. According to Matzarakis et al. (2021), MRT in SkyHelios is determined based on the radiational impact of the lower and upper hemispheres for long and shortwave radiation fluxes. Therefore, direct and scattered short-wave radiation fluxes (including single reflections by the neighborhood) as well as long-wave ground and surroundings emittance are taking into account (Matzarakis et al., 2021).
2.3.5 Thermo-physiological comfort analysis
The outputs of the TC modeling on SkyHelios (ASCII format) were processed on GIS systems (ArcGis Pro v. 3.1.0). The TC results were only evaluated on streets and open spaces around buildings. The resulting data from this geoprocessing model was statistically analyzed on R software (Rstudio v.4.2.0).
3 Results
3.1 Lisbon’s daytime thermo-physiological comfort conditions by Local Climate Zones
Figure 6 shows the boxplots with daytime UTCI values by LCZ in Lisbon.
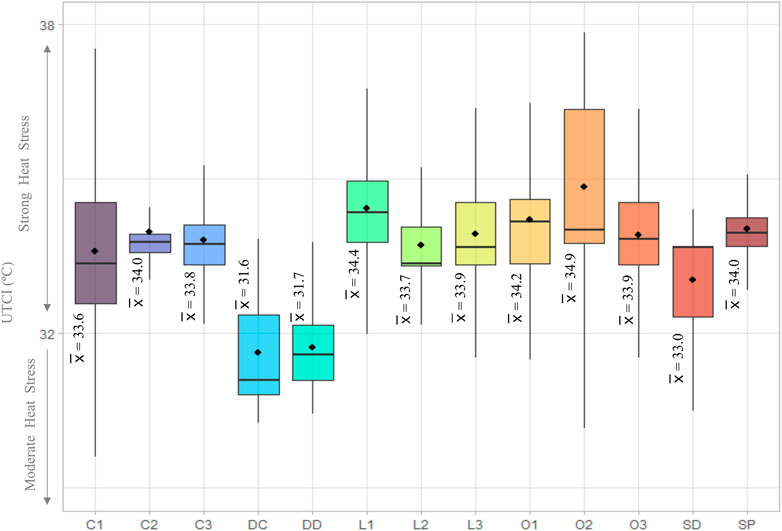
FIGURE 6. Daytime (12:00–15:00 h) UTCI by LCZ in Lisbon. Outliers were removed to improve data visualization. Black dots identify mean PET.
Higher average UTCI values occur in open areas with fewer buildings, little vegetation and, consequently, less shade: O2 sample with 34.9°C, followed by L1 (34.4°C) and O1 (34.2°C). In contrast, lower average UTCI values are found on the densely tree cover areas (DC with 31.6°C and DD with 31.7°C), followed by areas with scattered trees (SD sample with 33°C). Additionally, only on LCZ A samples the majority of its TC results shows moderate heat stress while the remaining areas depict mostly strong heat stress TC conditions.
Despite the average TC conditions on all urban classes being similar and its differences to LCZ A being of about 2°C, there are significant contrasts when it comes to the percentage of area (%) classified according to grades of physiological stress (Table 3). Considering all 163 days, on urban LCZ classes and on spots with scattered trees (SD—LCZ B), between 83% (C1) and 100% (O2) of area is classified with strong heat stress. In opposition to this, on DC and DD samples most of the area (between 77% on DC and 84% on DD) is classified with moderate heat stress. However, considering only the days where air temperature is equal or above 35°C, which corresponds to 29% of this LWT in Lisbon between 2008 and 2014 (75th percentile), the area classified with moderate heat stress disappears in all samples including the densely wooded areas. Additionally, the very strong heat stress UTCI class appears on all urban classes (in LCZ B is residual) covering between 9% (SP) and 22% (O1). This class occupies on average 14% of area on LCZs 1–3, 15% on LCZs 4%–6% and 18% on LCZ 8. On DD and DC samples 100% of its area is classified with strong heat stress, instead of 16%–23%.
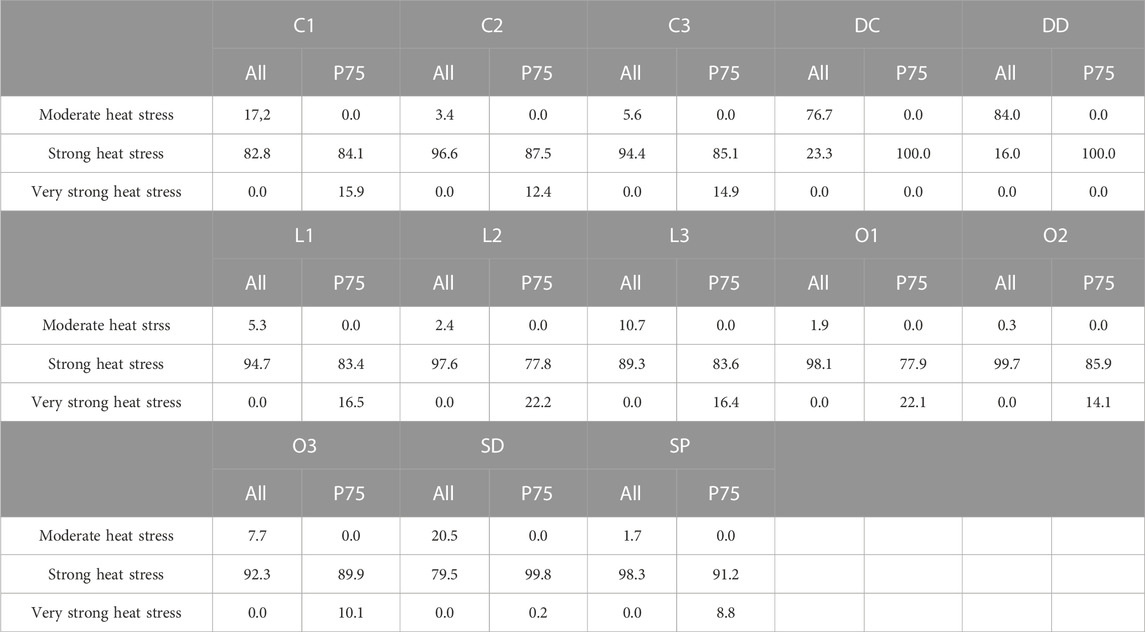
TABLE 3. Percentage (%) of area classified by UTCI grades of physiological stress considering all modeling data and the days where air temperature is equal or superior to 35°C (75th percentile) on very hot summer conditions in Lisbon
Figure 7 displays the distribution of UTCI values (average daytime conditions combining all 163 days) across the different sample areas. The sun-exposed and wind-sheltered (less ventilated) areas present higher UTCI values, generally above 34°C and, sometimes, reaching 38°C (very strong heat stress). Examples of this are the areas inside the blocks on C1, C2, C3 and O2. This relation between wind speed and UTCI values is demonstrated on Figure 8. It can be seen that the increase in wind speed lowers TC levels (except on SD sample).
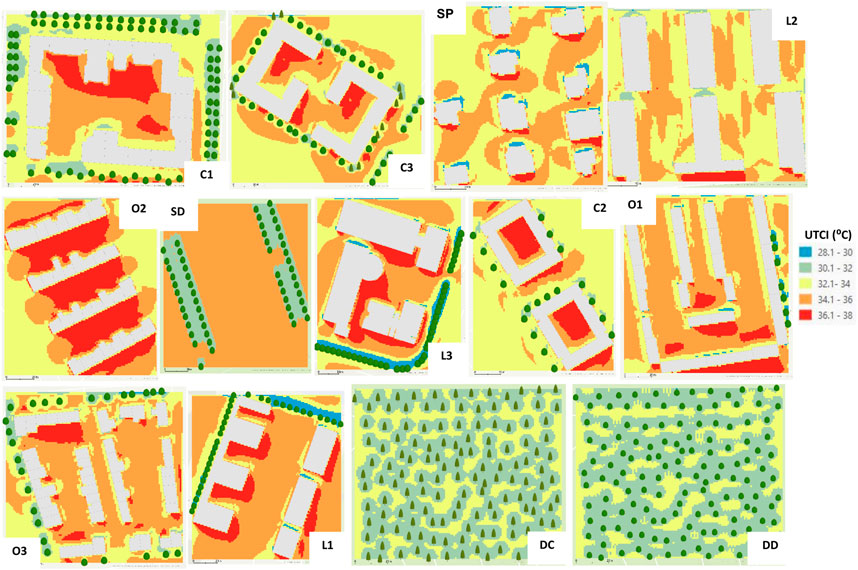
FIGURE 7. Daytime (12:00 to 15:00 h) average UTCI distribution in 13 LCZ samples located on the Lisbon’s municipality. Source of buildings and trees spatial information: Lisbon city hall (https://geodados-cml.hub.arcgis.com/).
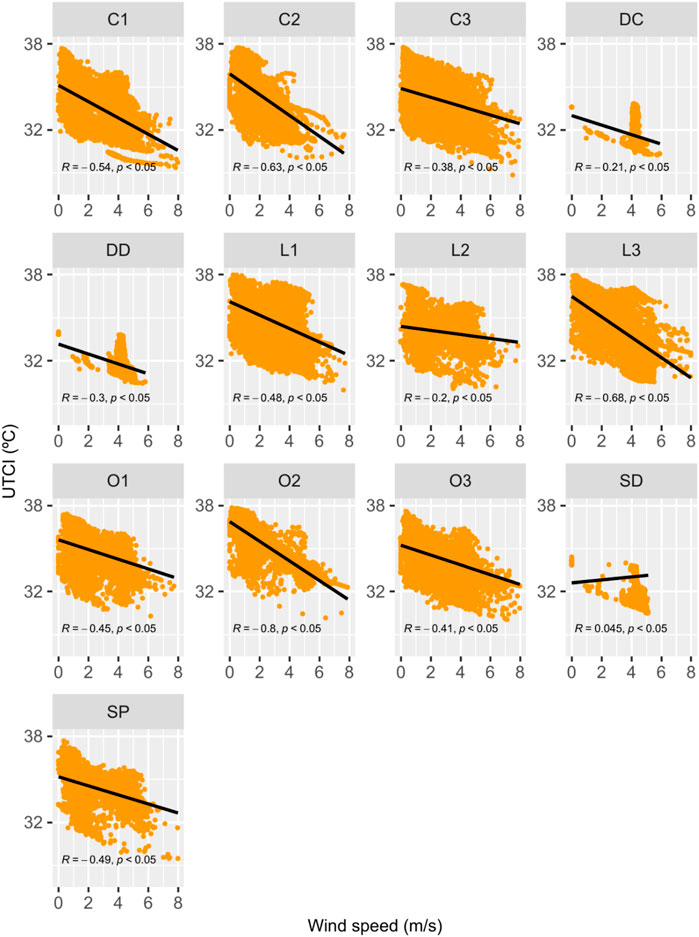
FIGURE 8. Scatter plots with average daytime UTCI (°C) and wind speed (m/s) per sample area in Lisbon.
Figure 9 displays daytime MRT values by LCZ. Higher average MRT values are found on O2 (51.6°C), followed by SP (50.8°C) and SD (50.7°C). This can be explained by the lower shaded area on some of these samples, represented on Table 4 (O2—8.3%; SP—10%) since MRT summarizes all different radiation fluxes and there is no direct solar radiation on shaded areas. As it can be seen from Table 4, average MRT differences between sun-shaded and sun-exposed areas are above 10°C and can reach 13.8°C on O2 sample. Lower average MRT values are found on the densely tree cover samples (DC with 44.5°C and DD with 44.9°C), with the highest shaded areas (Table 4). Furthermore, higher IQR are found on O3 (12.4°C), L3 (11.4°C) and on C2 (10.4°C), while lower IQR are found on DC (4.5°C), SD (5.3°C) and C3 (5.6°C). During the day, these IQR are greater in MRT than on PET.
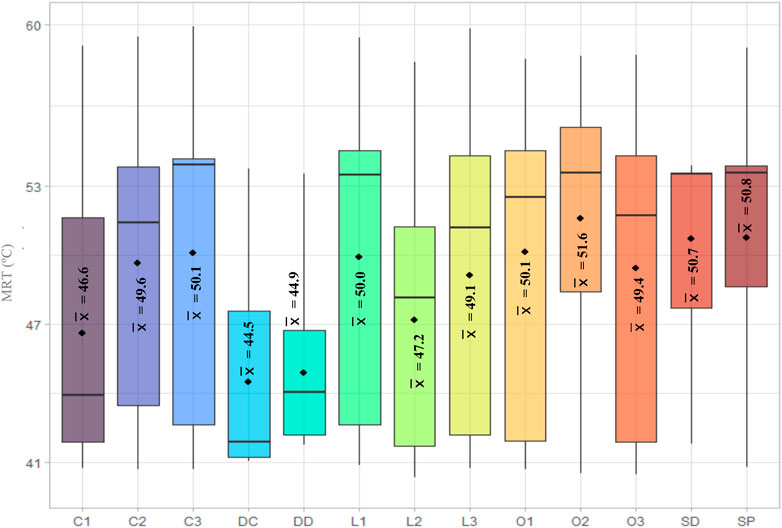
FIGURE 9. Daytime (12:00 to 15:00 h) MRT by LCZ in Lisbon. Outliers were removed to improve data visualization. Black dots identify mean MRT.
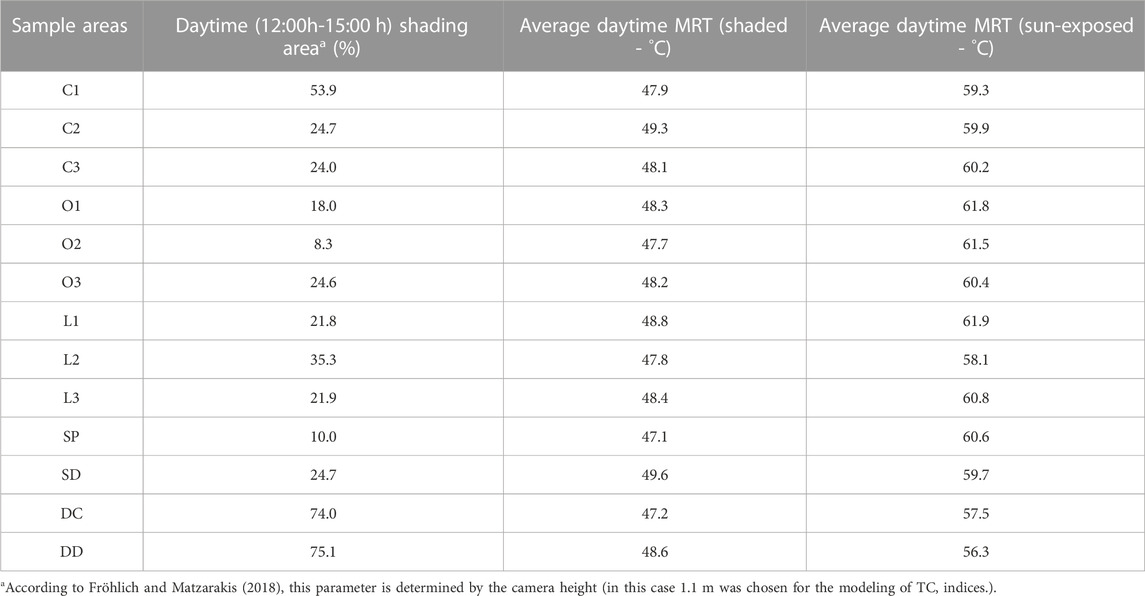
TABLE 4. Average shading area (%) and daytime MRT (shaded vs. sun-exposed areas) on each TC sample in Lisbon.
3.2 Lisbon’s nighttime thermo-physiological comfort conditions by Local Climate Zones
Figure 10 shows the nighttime UTCI boxplots for all 13 LCZ samples. UTCI simulations show no thermal stress on all samples. However, slightly higher average UTCI values are found on C1 (17.8°C), followed by C2, C3, L1, O1 and O3 (17.1°C), while lower average values occur in SD (15.3°C), DC (15.4°C) and DD (15.5°C). Additionally, higher IQR are found on O3 (3.9°C), O2 (3.8°C), L3, L2 and C3 (3.7°C), while minimal IQR are found on SD (0°C), DC (0,1°C) and DD (0.2°C).
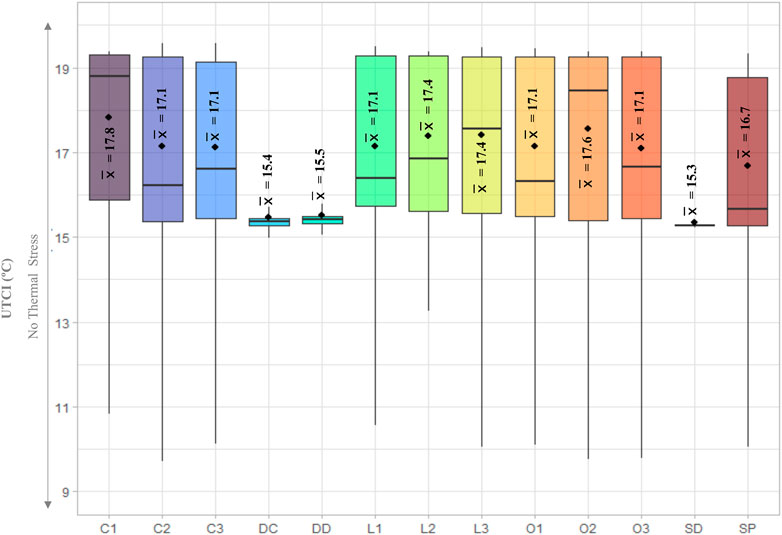
FIGURE 10. Nighttime (00:00–03:00 h) UTCI by LCZ in Lisbon. Outliers were removed to improve data visualization. Black dots identify mean UTCI.
Figure 11 presents the nighttime MRT boxplots per LCZ sample. During this period the average MRT differences between samples are attenuated (0.5°C). Despite that, unlike the daytime period, higher average nighttime MRT values are found in densely tree cover areas (DC and DD, with 13.8°C), while lower MRT values are found in O2 and SP (13.3°C), followed by L3 and C1 samples (13.4°C).
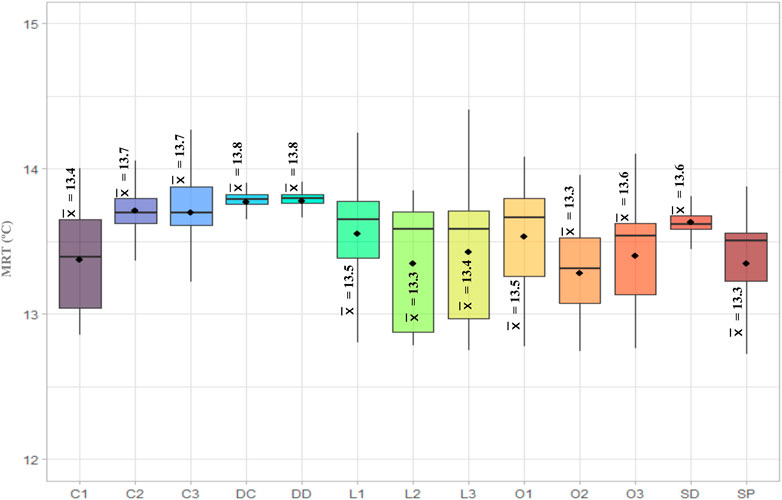
FIGURE 11. Nighttime (00:00–03:00 h) MRT by LCZ in Lisbon. Outliers were removed to improve data visualization. Black dots identify mean MRT.
The nighttime MRT IQR are shortened, with DC and DD sample with no IQR and L2 and L3 with IQR close to 1°C (0.8°C and 0.7°C, respectively).
4 Discussion
Increased thermo-physiological discomfort on urban areas associated with extreme heat conditions poses severe health risks. Ma et al. (2023), who created and tested an LCZ-based risk assessment approach in Changzhou (China), showed that heat-related health risks were higher in built types than in natural types and at least 60% of LCZs 1 to 5 (compact high-/mid-/low-rise, open high-/mid-rise areas) were designated as high-risk areas.
The mapping of the distribution of daytime UTCI values in all LCZ samples allows to identify the strong influence of solar radiation/shade effect and wind on TC levels. These results are in line with Andrade (2003) findings about Lisbon’s bioclimatic conditions, which, at the microscale, depend mostly on radiative conditions, either during the day (exposure to direct solar radiation) or night (with SVF), than air temperature (greater homogeneity at this spatial scale). Concerning solar radiation, the sun-shaded areas are often more thermally comfortable than the sun-exposed spots. Trees are crucial to reduce the thermal load, despite the reduction of thermal stress being only localized. This happens not only because of their shading effect, but also due to the evapotranspiration process (Venhari et al., 2017; Su et al., 2022). In this case the samples with the highest number of trees (C1 and SD) have the highest percentage of area classified with a lower grade of physiological stress, according to UTCI (moderate heat stress), while L2, O1 and O2 samples with almost no trees depict the lowest percentage classified with moderate heat stress. Even in small sun-exposed spots within the densely wooded samples (DC and DD), UTCI values are lower than in sun-exposed areas on urban LCZ, despite the surface friction caused by trees which reduces wind speed. Focusing on the influence of vegetation on the TC of Mendoza (Argentina—arid climate conditions with continental characteristics), Puliafito et al. (2013) showed that during the daylight, trees and parks improve TC through shading and evapotranspiration and urban tree corridors delay night cooling by retaining warm air beneath their canopies; Iungman et al. (2023), who analyzed the cooling effect of urban green infrastructure and its health impact, estimated that increasing tree coverage to 30% would prevent 2,644 premature deaths in European cities. In the case of Lisbon, deciduous trees provide shade during the hottest months and allow the radiation to reach the surface during the autumn and winter months. Even when there is no available space to plant trees or the surrounding conditions do not allow it (water scarcity, poor soil fertility), the creation of shade through retractable awnings, for instance, can be a viable solution to improve TC conditions on several streets.
Regarding the influence of wind on TC, buildings oriented W-E are blocking the dominant air masses (in this case coming from N and NW), creating heat pockets on their leeward side. Moreover, building height can amplify the wind barrier effect. These patterns show the need to create and preserve ventilation paths to improve TC at the neighborhood scale. This information is corroborated by Alcoforado et al. (2009), who defined climatic guidelines in Lisbon, in order to transpose the knowledge about the urban climate into urban planning. According to the authors, ventilation paths should be kept free for prevailing wind circulation towards the city core. These paths were delimitated based on topography, built density and orientation (Alcoforado et al., 2009). Along with this, the in-depth knowledge of the city’s local climate conditions (LWT) may help urban planning and design processes. On a previous study about the microclimatic variation of TC in a district of Lisbon (Telheiras) Andrade and Alcoforado (2008) modeled PET during the night and found higher TC values in streets sheltered from the wind (low SVF), while the coolest conditions occurred in open areas (center of large courtyards and marginal areas).
Daytime MRT results corroborate Baltazar (2010) findings at the mesoscale: on hot summer days, throughout the city MRT values are extremely high, above 50°C and almost reaching 60°C, especially on open sites. In this study samples with a lower shaded-area percentage (O2, SP and SP) register higher mean values. Müller et al. (2014) calculated TC in urban areas with different green and water space proportions on Oberhausen (Germany—temperate oceanic climate), based on the LCZ scheme. The authors found that during the day, the reduction in MRT by the tree shading results in a lower thermal load in LCZ A (dense trees), such that even the negative effects caused by the weakening of the wind speed can be compensated.
During the nighttime period, according to UTCI results, all samples registered no thermal stress, favoring nocturnal recovering by the human body from the unpleasant daytime thermal conditions. These refreshing TC conditions may be explained by the possible formation of local wind systems (sea breezes) during the nocturnal positive UHI phase. Baltazar (2010), who calculated PET on hot summer nights, reported a slight cold stress (13°C and 18°C) and low PET ranges across the city (between 5°C and 6°C).
Despite the lack of research about TC by LCZ, Milošević et al. (2016), who calculated PET on 9 different LCZ classes in Novi Sad (Servia—temperate warm climate) during an heat wave period, found that higher PET values are found on LCZ 5 (Open midrise areas) during the daytime period (4–18 UTC) and on LCZ 2 (Compact midrise areas) during the nighttime period (19–3 UTC). This can be explained by the higher portion of direct solar radiation reaching the surface during the day on open midrise areas (more area with no obstacles/sun-exposed/high SVF) and the trapping of longwave radiation inside the compact canyons of the midrise zone during the night. Throughout the whole day, LCZ A (dense trees) registered the lower PET values. The authors ranked the LCZ samples by decreasing PET values: midrise, low-rise, sparsely built, low plants and LCZ A. During a larger time period (14 months, between July 2010 and September 2011), Müller et al. (2014) concluded that the densely built compact midrise (LCZ 2) showed particularly high thermal loads during hot days (maximum air temperatures above 30°C), along with open midrise and low-rise (LCZ 5 and 6) areas, while the areas without a substantial building effect like sparsely built and dense trees (LCZ 9 and A) rarely exceeded the highest thermal load levels during the daytime period. At night, the authors found that the highest PET values were registered under dense trees, since the effective longwave radiation and wind speed are attenuated by the crown protection of the tree cover. Recently, Wu et al. (2022) evaluated UTCI in Shenzhen (China—subtropical monsoon climate) in 2020 using hourly data from 65 weather stations covering 11 different LCZ classes. The authors depicted higher UTCI values on urban LCZ classes and lower levels on LCZ A and showed a positive correlation between TC and building surface fraction, building height, street aspect ratio and distance to the sea, and a negative correlation between TC, pervious surface fraction and SVF.
Nighttime UTCI and MRT IQR are quite lower because there is no shortwave radiation and, consequently, no sun-shaded/sun-exposed contrasts. Lower nighttime PET ranges were found by Baltazar (2010), Baltazar (2014), who modelled PET for the entire city of Lisbon on different meteorological conditions (summer hot days and nights, winter cold days and nights and days with strong N winds or “Nortada”). The author found that on summer hot nights PET ranged only between 13°C and 18°C throughout the city and the lower TC values were found on open and wind exposed areas, subject to rapid radiative losses, and on vegetated areas due to the cooling provided by the evapotranspiration process.
5 Conclusion
In this study, TC was analyzed in 13 different LCZ samples located on the Portuguese capital, Lisbon. During the daytime period, urban sample areas show strong heat stress conditions (34°C, on average) and densely wooded areas (DC and DD) depict moderate heat stress conditions (2°C cooler, on average) according to UTCI simulations, while at night meteorological conditions can potentially provide a significant physiological recovery (no thermal stress).
The results obtained on this research are conditioned by several factors.
• Only street trees were included in the modeling because there is still no detailed cartography with the trees located on public and private urban green spaces. Hence, some trees are missing on several sample areas. Also, DC and DD samples are only a representation of the Monsanto forest;
• Lawns were not included in the modeling;
• Urban materials and color details were not considered. Thus, there is a need for a detailed database with all urban materials and colors used on urban areas;
• Only small sample areas are viable for modelling on SkyHelios software;
• High computational power needed to quickly process the results;
• It was not possible to clearly distinguish the TC patterns of each LCZ and to withdraw definitive conclusions about the LCZ with the highest thermal loads. This may be partially explained by the fact that, unlike the climatopes system (areas with similar microclimatic characteristics), on the LCZ classification the background topography is considered to be relatively uniform throughout all classes. However, Lisbon has unique relief conditions (a plateau at the north and four main valleys oriented N-S at south), which strongly influence the local climate conditions.
Despite that, the analysis of UTCI during the hottest summer days in Lisbon showed the importance of shade to reduce TD conditions aggravated by the urban effect on the local climate conditions. Urban quarters (LCZ 1 to 3) with a higher number and height of buildings per unit of area and, consequently, lower SVF, can effectively block part of the income shortwave radiation during the day, reducing the TD, especially if surrounded by vegetation (street trees). However, this advantage might be offset by the absorption of radiation performed by low albedo urban materials and its release during the nighttime period, partially preventing cooling of the streets. In contrast, open areas (LCZ 4 to 6, 8 and 9) with fewer and lower buildings and little vegetation seem to provide more discomfortable thermal environments during the day but since the absorption of radiation is supposably lower, the nighttime cooling of the adjacent streets might be facilitated. Additionally, well-ventilated spots offer a more comfortable thermal environment, even with the absence of shade. Taking into account the regional (synoptic patterns) and local (ocean and/or river breezes) wind regimes and the annual Sun path when planning an urban quarter may contribute to alleviate TD conditions, especially considering future climate scenarios of increasing warmer atmospheres.
Data availability statement
The raw data supporting the conclusions of this article will be made available by the authors, without undue reservation.
Author contributions
CR: Conceptualization, Methodology, Software, Validation, Formal analysis, Investigation, Writing—Original Draft, Visualization, Revision. AN: Conceptualization, Methodology, Software, Supervision, Writing—Review and Editing, Revision. AL: Conceptualization, Methodology, Software, Validation, Supervision, Writing—Review and Editing, Revision. All authors listed have made a substantial, direct, and intellectual contribution to the work and approved it for publication.
Funding
This research was funded by FCT (Fundação para a Ciência e Tecnologia), grant number SFRH/BD/146757/2019 and the ZEPHYRUS research group of the CEG/IGOT—Universidade de Lisboa (UIDB/00295/2020 and UIDP/00295/2020).
Conflict of interest
The authors declare that the research was conducted in the absence of any commercial or financial relationships that could be construed as a potential conflict of interest.
Publisher’s note
All claims expressed in this article are solely those of the authors and do not necessarily represent those of their affiliated organizations, or those of the publisher, the editors and the reviewers. Any product that may be evaluated in this article, or claim that may be made by its manufacturer, is not guaranteed or endorsed by the publisher.
Supplementary material
The Supplementary Material for this article can be found online at: https://www.frontiersin.org/articles/10.3389/feart.2023.1099045/full#supplementary-material
References
Alcoforado, M. J., Andrade, H., Lopes, A., and Vasconcelos, J. (2009). Application of climatic guidelines to urban planning: The example of Lisbon (Portugal). Landsc. urban Plan. 90 (1-2), 56–65. doi:10.1016/j.landurbplan.2008.10.006
American Meteorological Society (1999). “Aerodynamic roughness length,” in Glossary of Meteorology. Available online at http://glossary.ametsoc.org/wiki/Aerodynamic_roughness_length.
Andrade, H. (2003). Bioclima humano e temperatura do ar em Lisboa. [Ph. D. thesis] (Lisbon, Portugal: University of Lisbon). (in portuguese).
Andrade, H., and Vieira, R. (2007). A climatic study of an urban green space: The gulbenkian park in Lisbon (Portugal). Finisterra 42 (84). doi:10.18055/Finis1420
Andrade, H., and Alcoforado, M. J. (2008). Microclimatic variation of thermal comfort in a district of Lisbon (Telheiras) at night. Theor. Appl. Climatol. 92, 225–237. doi:10.1007/s00704-007-0321-5
Baltazar, S. C. P. (2010). Mapas bioclimáticos de Lisboa. Master dissertation presented to Institute of Geography and Spatial Planning (Lisbon: University of Lisbon). (in Portuguese).
Baltaza, S. (2014). New bioclimatic maps of Lisbon. Spatial modelling of physiological equivalent temperature. Finisterra 49 (98), 1–26. doi:10.18055/Finis6457
Błażejczyk, K., Broede, P., Fiala, D., Havenith, G., Holmér, I., Jendritzky, G., et al. (2010). Principles of the new Universal Thermal Climate Index (UTCI) and its application to bioclimatic research in European scale. Misc. Geogr. Regional Stud. Dev. 14, 91–102. doi:10.2478/mgrsd-2010-0009
Błażejczyk, K., Jendritzky, G., Bröde, P., Fiala, D., Havenith, G., Epstein, Y., et al. (2013). An introduction to the universal thermal climate index (UTCI). Geogr. Pol. 86 (1), 5–10. doi:10.7163/Gpol.2013.1
Bröde, P., Fiala, D., Błażejczyk, K., Holmér, I., Jendritzky, G., Kampmann, B., et al. (2012). Deriving the operational procedure for the Universal Thermal Climate Index (UTCI). Int. J. Biometeorol. 56, 481–494. doi:10.1007/s00484-011-0454-1
Câmara Municipal de Lisboa (2012). Biodiversidade na cidade de Lisboa: uma estratégia para 2020 | documento técnico (Lisbon City Council, Lisbon).
Câmara Municipal de Lisboa (2019). Guia ilustrado de vinte e cinco árvores de Lisboa (Lisbon City Council, Lisboa: Lisboa E-Nova).
Chen, Y. C., Fröhlich, D., Matzarakis, A., and Lin, T. P. (2017). Urban roughness estimation based on digital building models for urban wind and thermal condition estimation—application of the SkyHelios model. Atmosphere 8 (12), 247. doi:10.3390/atmos8120247
Choudhury, A. R., Majumdar, P. K., and Datta, C. (2011). “Factors affecting comfort: Human physiology and the role of clothing,” in Improving comfort in clothing (Sawston, United Kingdom: Woodhead Publishing), 3–60. doi:10.1533/9780857090645.1.3
Correia, E., Lopes, A., and Marques, D. (2015). “An automatic GIS procedure to calculate urban densities to use in Urban Climatic Maps,” in Proceedings of the 9th international conference on urban climate, 12th symposium on the urban environment, 20–24.
Correia, E. (2019). “Mapas Climáticos Urbanos – geometria e densidade urbana atual. Relatório,” in Cartografia de Vulnerabilidade Térmica – mapeamento dos efeitos das Ondas de Calor em Lisboa, face às projeções climáticas (Lisboa, Portugal: Câmara Municipal de Lisboa). (in Portuguese).
Das, M., Das, A., and Mandal, S. (2020). Outdoor thermal comfort in different settings of a tropical planning region: A study on sriniketan-santiniketan planning area (SSPA), eastern India. Sustain. Cities Soc. 63, 102433. doi:10.1016/j.scs.2020.102433
Fanger, P. O. (1973). Assessment of man’s thermal comfort in practice. Occup. Environ. Med. 30 (4), 313–324. doi:10.1136/oem.30.4.313
Fiala, D., Havenith, G., Bröde, P., Kampmann, B., and Jendritzky, G. (2012). UTCI-Fiala multi-node model of human heat transfer and temperature regulation. Int. J. biometeorology 56 (3), 429–441. doi:10.1007/s00484-011-0424-7
Fröhlich, D., Gangwisch, M., and Matzarakis, A. (2019). Effect of radiation and wind on thermal comfort in urban environments-Application of the RayMan and SkyHelios model. Urban Clim. 27, 1–7. doi:10.1016/j.uclim.2018.10.006
Fröhlich, D., and Matzarakis, A. (2018). Spatial estimation of thermal indices in urban areas – basics of the SkyHelios model. Atmosphere 2018 (9), 209. doi:10.3390/atmos9060209
Fröhlich, D., and Matzarakis, A. (2020). Calculating human thermal comfort and thermal stress in the PALM model system 6.0. Geosci. Model Dev. 13 (7), 3055–3065. doi:10.5194/gmd-13-3055-2020
Geletič, J., Lehnert, M., Savić, S., and Milošević, D. (2018). Modelled spatiotemporal variability of outdoor thermal comfort in local climate zones of the city of Brno, Czech Republic. Sci. total Environ. 624, 385–395. doi:10.1016/j.scitotenv.2017.12.076
Huang, C. H., Tsai, H. H., and Chen, H. C. (2020). Influence of weather factors on thermal comfort in subtropical urban environments. Sustainability 12 (5), 2001. doi:10.3390/su12052001
Huang, K. T., Yang, S. R., Matzarakis, A., and Lin, T. P. (2018). Identifying outdoor thermal risk areas and evaluation of future thermal comfort concerning shading orientation in a traditional settlement. Sci. Total Environ. 626, 567–580. doi:10.1016/j.scitotenv.2018.01.031
Iungman, T., Cirach, M., Marando, F., Barboza, E. P., Khomenko, S., Masselot, P., et al. (2023). Cooling cities through urban green infrastructure: A health impact assessment of European cities. Lancet 401, 577–589. doi:10.1016/S0140-6736(22)02585-5
Jendritzky, G., de Dear, R., and Havenith, G. (2012). UTCI—Why another thermal index? Int. J. biometeorology 56 (3), 421–428. doi:10.1007/s00484-011-0513-7
Ketterer, C., and Matzarakis, A. (2014). Human-biometeorological assessment of heat stress reduction by replanning measures in Stuttgart, Germany. Landsc. Urban Plan. 122, 78–88. doi:10.1016/j.landurbplan.2013.11.003
Krüger, E. L., Minella, F. O., and Matzarakis, A. (2014). Comparison of different methods of estimating the mean radiant temperature in outdoor thermal comfort studies. Int. J. Biometeorology 58 (8), 1727–1737. doi:10.1007/s00484-013-0777-1
Kyaw, A. K., Hamed, M. M., Kamruzzaman, M., and Shahid, S. (2023). Spatiotemporal changes in population exposure to heat stress in south Asia. Sustain. Cities Soc. 93, 104544. doi:10.1016/j.scs.2023.104544
Lau, K. K. L., Chung, S. C., and Ren, C. (2019). Outdoor thermal comfort in different urban settings of sub-tropical high-density cities: An approach of adopting local climate zone (LCZ) classification. Build. Environ. 154, 227–238. doi:10.1016/j.buildenv.2019.03.005
Lopes, A., Fragoso, M., and Correia, E. (2018). “Contextualização climática (Cap. 3) e Cenarização bioclimática (Cap. 4),” in Plano Metropolitano de Adaptação às Alterações Climáticas, Volume I – definição do Cenário Base de Adaptação para a AML, 71–168. (in portuguese).
Lopes, A. (2003). Modificações no clima de Lisboa como consequência do crescimento urbano. Vento, ilha de calor de superfície e balanço energético. PhD thesis in Physical Geography presented to Faculdade de Letras, Universidade de Lisboa. Lisbon: Univerisdade de Lisboa, 354.
Lopes, A., Saraiva, J., and Alcoforado, M. J. (2011). Urban boundary layer wind speed reduction in summer due to urban growth and environmental consequences in Lisbon. Environ. Model. Softw. 26, 241–243. doi:10.1016/j.envsoft.2010.05.015
Lowry, W. P. (1977). Empirical estimation of the urban effects on climate: A problem analysis. J. Appl. Meteorology 16, 129–135. doi:10.1175/1520-0450(1977)016<0129:EEOUEO>2.0.CO;2
Ma, L., Huang, G., Johnson, B. A., Chen, Z., Li, M., Yan, Z., et al. (2023). Investigating urban heat-related health risks based on local climate zones: A case study of Changzhou in China. Sustain. Cities Soc. 91, 104402. doi:10.1016/j.scs.2023.104402
Manavvi, S., and Rajasekar, E. (2020). Estimating outdoor mean radiant temperature in a humid subtropical climate. Build. Environ. 171, 106658. doi:10.1016/j.buildenv.2020.106658
Matzarakis, A., Gangwisch, M., and Fröhlich, D. (2021). in Urban microclimate modelling for comfort and energy studies (Cham: Springer), 339–361. doi:10.1007/978-3-030-65421-4_16RayMan and SkyHelios model
Matzarakis, A., Martinelli, L., and Ketterer, C. (2016). “Relevance of thermal indices for the assessment of the urban heat island,” in Counteracting urban heat island effects in a global climate change scenario (Cham: Springer), 93–107. doi:10.1007/978-3-319-10425-6_4
Matzarakis, A., and Matuschek, O. (2011). Sky view factor as a parameter in applied climatology rapid estimation by the SkyHelios model. Meteorol. Z. 20 (1), 39–45. doi:10.1127/0941-2948/2011/0499
Matzarakis, A., Mayer, H., and Iziomon, M. G. (1999). Applications of a universal thermal index: Physiological equivalent temperature. Int. J. biometeorology 43 (2), 76–84. doi:10.1007/s004840050119
Milošević, D. D., Savić, S. M., Marković, V., Arsenović, D., and Šećerov, I. (2016). Outdoor human thermal comfort in local climate zones of Novi Sad (Serbia) during heat wave period. Hung. Geogr. Bull. 65 (2), 129–137. doi:10.15201/hungeobull.65.2.4
Müller, N., Kuttler, W., and Barlag, A. B. (2014). Counteracting urban climate change: Adaptation measures and their effect on thermal comfort. Theor. Appl. Climatol. 115 (1), 243–257. doi:10.1007/s00704-013-0890-4
Nouri, A. N. (2018). Addressing urban outdoor thermal comfort thresholds through public space design. [Ph. D. thesis] (Lisbon, Portugal: University of Lisbon).
Nouri, A. S., Fröhlich, D., Matos Silva, M., and Matzarakis, A. (2018). The impact of Tipuana tipu species on local human thermal comfort thresholds in different urban canyon cases in Mediterranean climates: Lisbon, Portugal. Atmosphere 9 (1), 12. doi:10.3390/atmos9010012
Oke, T. R., Mills, G., Christen, A., and Voogt, J. A. (2017). Urban climates. Cambridge, UK: Cambridge University Press. doi:10.1017/9781139016476
Oke, T. R. (1988). The urban energy balance. Prog. Phys. Geogr. 12 (4), 471–508. doi:10.1177/030913338801200401
Oliveira, A., Lopes, A., Correia, E., Niza, S., and Soares, A. (2021). Heatwaves and summer urban heat Islands: A daily cycle approach to unveil the urban thermal signal changes in Lisbon, Portugal. Atmosphere 12 (3), 292. doi:10.3390/atmos12030292
Oliveira, A., Lopes, A., and Niza, S. (2020a). Local climate zones datasets from five southern European cities: Copernicus based classification maps of Athens, Barcelona, Lisbon, Marseille and Naples. Data brief 31, 105802. doi:10.1016/j.dib.2020.105802
Oliveira, A., Lopes, A., and Niza, S. (2020b). Local climate zones in five southern European cities: An improved GIS-based classification method based on Copernicus data. Urban Clim. 33, 100631. doi:10.1016/j.uclim.2020.100631
Peel, M. C., Finlayson, B. L., and McMahon, T. A. (2007). Updated world map of the Köppen-Geiger climate classification. Hydrol. Earth Syst. Sci. 11 (5), 1633–1644. doi:10.5194/hess-11-1633-2007
Potcher, O., Cohen, P., Lin, T. P., and Matzarakis, A. (2018). Outdoor human thermal perception in various climates: A comprehensive review of approaches, methods and quantification. Sci. Total Environ. 631, 390–406. doi:10.1016/j.scitotenv.2018.02.276
Puliafito, S. E., Bochaca, F. R., Allende, D. G., and Fernandez, R. P. (2013). Green areas and microscale thermal comfort in arid environments: A case study in Mendoza. Atmospheric and Climate Sci. 3, 372–384. doi:10.4236/acs.2013.33039
Reis, C., Lopes, A., Correia, E., and Fragoso, M. (2020). Local weather types by thermal periods: Deepening the knowledge about Lisbon’s urban climate. Atmosphere 11 (8), 840. doi:10.3390/atmos11080840
Reis, C., Lopes, A., and Nouri, A. S. (2022a). Assessing urban heat island effects through local weather types in Lisbon's Metropolitan Area using big data from the Copernicus service. Urban Clim. 43, 101168. doi:10.1016/j.uclim.2022.101168
Reis, C., Lopes, A., and Nouri, A. S. (2022b). Urban heat island data by local weather types in Lisbon metropolitan area based on Copernicus climate variables dataset for European cities. Data Brief 42, 108292. doi:10.1016/j.dib.2022.108292
Ren, J., Yang, J., Zhang, Y., Xiao, X., Xia, J. C., Li, X., et al. (2022). Exploring thermal comfort of urban buildings based on local climate zones. J. Clean. Prod. 340, 130744. doi:10.1016/j.jclepro.2022.130744
Rengasamy, R. S. (2011). “Improving moisture management in apparel,” in Improving comfort in clothing (Sawston, United Kingdom: Woodhead Publishing), 182–215.
Rodríguez Algeciras, J. A., Coch, H., De la Paz Pérez, G., Chaos Yeras, M., and Matzarakis, A. (2016). Human thermal comfort conditions and urban planning in hot-humid climates—the case of Cuba. Int. J. biometeorology 60 (8), 1151–1164. doi:10.1007/s00484-015-1109-4
RStudio Team (2020). RStudio: Integrated development for R. RStudio. Boston, MA: PBC. URL http://www.rstudio.com/.
Spangler, K. R., Liang, S., and Wellenius, G. A. (2022). Wet-bulb globe temperature, universal thermal climate index, and other heat metrics for US Counties, 326–2020. Sci. data 9 (1), 326. doi:10.1038/s41597-022-01405-3
Stewart, I. D., and Oke, T. R. (2012). Local climate zones for urban temperature studies. Bull. Am. Meteorological Soc. 93 (12), 1879–1900. doi:10.1175/BAMS-D-11-00019.1
Su, Y., Wu, J., Zhang, C., Wu, X., Li, Q., Liu, L., et al. (2022). Estimating the cooling effect magnitude of urban vegetation in different climate zones using multi-source remote sensing. Urban Clim. 43, 101155. doi:10.1016/j.uclim.2022.101155
Unger, J., Skarbit, N., and Gál, T. (2018). Evaluation of outdoor human thermal sensation of local climate zones based on long-term database. Int. J. biometeorology 62, 183–193. doi:10.1007/s00484-017-1440-z
Venhari, A. A., Tenpierik, M., and Hakak, A. M. (2017). Heat mitigation by greening the cities, a review study. Environment. Earth Ecol. 1 (1). doi:10.24051/eee/67281
Keywords: outdoor thermal comfort, Mediterranean city, climate change, UTCI, mean radiant temperature, LCZ, urban climate, thermal summer
Citation: Reis C, Nouri AS and Lopes A (2023) Human thermo-physiological comfort assessment in Lisbon by local climate zones on very hot summer days. Front. Earth Sci. 11:1099045. doi: 10.3389/feart.2023.1099045
Received: 15 November 2022; Accepted: 05 May 2023;
Published: 17 May 2023.
Edited by:
Tomas Halenka, Charles University, CzechiaReviewed by:
Mohammed Magdy Hamed, Technology and Maritime Transport (AASTMT), EgyptIoannis Charalampopoulos, Agricultural University of Athens, Greece
Copyright © 2023 Reis, Nouri and Lopes. This is an open-access article distributed under the terms of the Creative Commons Attribution License (CC BY). The use, distribution or reproduction in other forums is permitted, provided the original author(s) and the copyright owner(s) are credited and that the original publication in this journal is cited, in accordance with accepted academic practice. No use, distribution or reproduction is permitted which does not comply with these terms.
*Correspondence: Cláudia Reis, Y2xhdWRpYXJlaXMyQGNhbXB1cy51bC5wdA==