 Mohammed H. Aljahdali1
 Amr S. Deaf2*
 Thomas Gentzis3
 Rashad A. Bantan1
 Ramadan H. Abu-Zied1Humberto Carvajal-Ortiz3Miran M. Khalaf4
- 1Marine Geology Department, Faculty of Marine Sciences, King Abdulaziz University, Jeddah, Saudi Arabia
- 2Geology Department, Faculty of Science, Assiut University, Assiut, Egypt
- 3Core Laboratories, Houston, TX, United States
- 4Geology Department, Faculty of Science, Sohag University, Sohag, Egypt
Integrated organic petrographic and geochemical analyses were made on organic-rich marine carbonate and mixed clastic-carbonate rocks of Middle–Late Jurassic and Early Cretaceous age from the Shushan Basin, Egypt to evaluate their hydrocarbon potential. Analyses allowed the identification of depositional settings, paleoclimate, and three third order genetic stratigraphic sequences (SQ) with deposits assigned to highstand (HST), lowstand (LST) and transgressive systems tracts (TST). Deposition of the source rocks in the rifting Shushan Basin resulted from the interaction between Neotethyan sea level changes, tectonic, and climate. The good reducing conditions developed during the Neotethyan Middle–Late Jurassic (Bajocian–Kimmeridgian) second order sea level rises and the climatically induced carbonate sedimentation resulted in the deposition of the organic-rich carbonates of the Khatatba Formation (SQ 1, early–middle TST) in inner–middle shelf settings under anoxic–dysoxic conditions. The Late Jurassic (late Kimmeridgian) uplifting resulted in the deposition of the organic-lean mixed clastic–carbonate strata of the Masajid Formation (SQ 1, latest TST) in the same shelfal and reducing conditions, which experienced a notable dilution of organic matter. The late TST deposits of SQ 1 are good to very good oil-producing source rocks, where they show average good to very good generative potential of late mature (late oil-to early wet gas-window) highly oil-prone organic matter. The Early Cretaceous (Valanginian–Albian) uplifting associated with the rifting of the Shushan Basin overprinted the Neotethyan late Valanginian–Hauterivian second order sea level rises, Aptian second order highstand sea level, and Albian second order sea level rise. The coeval climatic shift toward more humid conditions resulted in the clastic-dominated deposition of the organic-lean regressive units of SQ 2 (HST and LST of Alam El Bueib, Alamein, and Dahab formations) and SQ 3 (HST and LST of the lower–upper Kharita Formation) in marginal marine settings under anoxic–dysoxic to oxic conditions. The HST and LST deposits of the SQ 2 and SQ 3 show poor to good organic richness of early–mid mature (early–peak oil-window) oil/gas-prone and gas/oil-prone organic matter, respectively and exhibit average fair oil source rock potential with no gas generation.
1 Introduction
The Western Desert is regarded as one of the main hydrocarbons producing areas in Egypt (Meshref, 1990; Zein El-Din et al., 2001; Lotfy et al., 2020). Numerous studies were conducted on the hydrocarbon resources of the Western Desert and indicated that about 90% of oil and 80% of natural gas are still unexplored (EGPC, 1992). This is supported by the new discoveries and production of 8,500 barrel of oil per day (BOPD) from the Meleiha concessions in the Western Desert (Eni, 2022). The Western Desert is made up of several extensional rift basins, including the costal basins Alamein, Matruh, and Shushan, in addition to the Abu Gharadig, which lies to south of the coastal basins holding a more interior position (Figure 1).
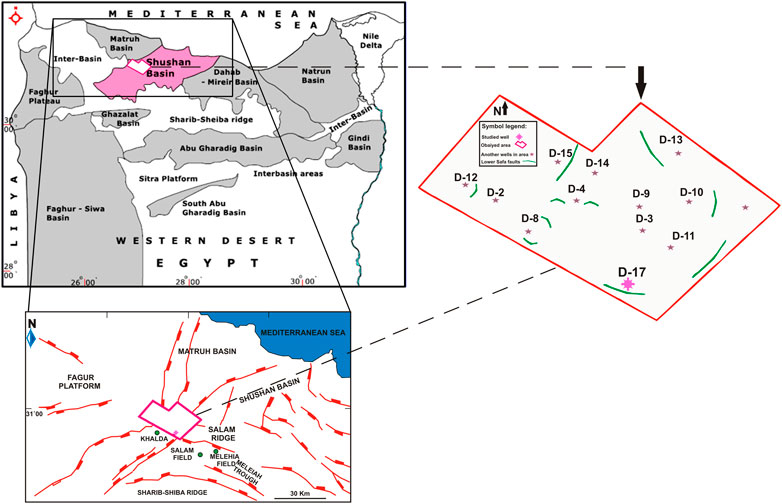
FIGURE 1. Mesozoic basins in the Western Desert of Egypt showing location (A) and a simple structure map (B) of the studied Shushan Basin (after EGPC, 1992; Shalaby et al., 2012). (C) Location map of the Obaiyed Field and the studied OBA D-17 well (Papetco/Shell, 2000).
Several previous studies have focused on the hydrocarbon potential of the Middle Jurassic and Lower Cretaceous rocks of northern Western Desert focusing mostly on organic geochemical analyses (e.g., Felesteen, 1998; Khaled, 1999; El Nady, 2015). Integrated studies based on combined organic geochemical and organic petrographic analyses have greatly improved the understanding of the hydrocarbon potential of the Jurassic and Cretaceous successions (e.g., Tahoun and Deaf, 2016; Deaf and Tahoun, 2018; Gentzis et al., 2018, 2019; Deaf et al., 2020b, 2021, 2022). However, these efforts are still inadequate to fully understand the hydrocarbon potential of the region, because various basins have undergone different tectonostratigraphic evolutions and thus yield different hydrocarbon potential. The Shushan Basin contains important producing Middle–Upper Jurassic and Lower Cretaceous carbonate and mixed clastic–carbonate source rocks of deltaic to shallow marine origins. Nevertheless, this basin has received little attention with respect to its hydrocarbon potential. In addition, most of the hydrocarbon investigations embraced mostly the conventional organic geochemical assessment methods (Metwalli and Pigott, 2005; Shalaby et al., 2011; Shalaby et al., 2014; El Nady et al., 2016; Ahmed and Hassan, 2019; Lotfy et al., 2020; El Dally, et al., 2022). In these studies, understanding of the controlling factors responsible for the accumulation and preservation of organic matter is missing (e.g., Galloway, 1989; Van Wagoner, 1995; Tyson, 1996; Deaf and Tahoun, 2018; Jong, 2019; Deaf, 2021). To our knowledge, no sequence stratigraphic analyses were made on the Middle Jurassic–Lower Cretaceous of the Shushan Basin. Therefore, this study focuses on the integration of organic geochemical, organic petrographic, and sequence stratigraphic analyses to unravel the hydrocarbon potential of the Middle–Upper Jurassic and the Lower Cretaceous rocks in the Shushan Basin. The aim of this study extends to have a better understanding of the impact of the allogenic controls on the formation of the potential source rocks.
2 Geological setting and lithostratigraphy
The Western Desert of Egypt exhibits a complex geological setting, containing several rift basins, which were formed during two main regional tectonic events occurred in the Jurassic and Cretaceous (Guiraud et al., 2001; Bumby and Guiraud, 2005). The Shushan Basin is a NE–SW trending half-graben basin, which contains sedimentary strata attaining a total thickness of about 7.5 km of Paleozoic, Mesozoic, and Cenozoic rocks (Said 1990). The Shushan Basin comprised a part of a large continental rift basin during the Paleozoic (Meshref and Hammouda, 1990; Abdel Halim and Moussad, 1992).
This continental basin was separated into the Shushan and Matruh basins during the Late Jurassic–Early Cretaceous, when they started to evolve as extensional rift basins as a response to the opening of the Neotethyan and the Atlantic oceans (Meshref and Hammouda, 1990; Abdel Halim and Moussad, 1992; Tari et al., 2012). The Shushan was later converted into a convergent margin because of Late Cretaceous–Early Palaeogene compression in northern Egypt. However, during the Miocene, the Shushan Basin once again transformed into a rift basin (Bumby and Guiraud, 2005; Metwalli and Pigott, 2005; Tari et al., 2012; Moustafa, 2020).
Sedimentation in the Shushan Basin was controlled primarily by regional tectonics and eustatic sea level changes (Sestini, 1994; Moustafa, 2020). The sedimentary successions in the Shushan Basin are divided into four major and thick tectono-stratigraphic sequences, which are separated by regional unconformity surfaces (Sultan and Abdelhalim, 1988), which are linked to regional tectonic events. These unconformity-bounded sedimentary successions are classified according to Sloss (1963) as second order tectonically-bounded sequences (TBS). The continental Paleozoic and continental to deltaic–shallow marine Jurassic deposits represent the first sequence (Figure 2). The first unconformity surface (i.e., upper boundary of TBS 1; Figure 2) separating the Upper Jurassic from the Lower Cretaceous in the Shushan Basin is connected to the regional Latest Jurassic “Late Cimmerian event.” This event resulted in block faulting and uplifting of large parts of the northern African margin including the Egyptian north Western Desert. This tectonic event was connected to the opening of the North Atlantic Ocean and the NE drifting of Africa towards Europe (e.g., Guiraud et al., 1998; Guiraud et al., 2001; Bumby and Guiraud, 2005; Moustafa, 2020; Bosworth and Tari, 2021).
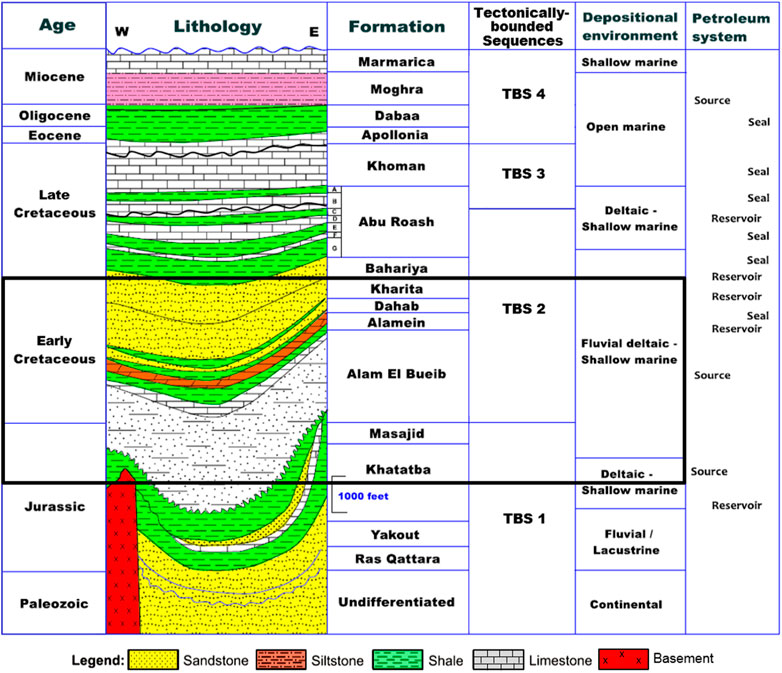
FIGURE 2. Stratigraphic column of the Shushan Basin in the Egyptian north Western Desert with depositional environments and petroleum systems (After Aram et al., 1988; EGPC, 1992). TBS, Tectonically-bounded sequences. The studied sections are marked with a bold rectangle.
The deltaic to shallow marine Lower–middle Cretaceous clastic deposits represent the second sequence. The second unconformity surface occurring in the upper Santonian represents the upper boundary of TBS 2 (Figure 2) and is linked to the widespread Late Cretaceous compressional forces. These deformational forces resulted in regional folding, faulting, and basin inversion in the NE African plate including the north Western Desert of Egypt. This folding and basin inversion created a series of fold belts commonly known as the “Syrian Arch System,” which extends from the NE African plate in a NE direction across northern Egypt and continues up in a NNE direction across the Levantine plate. This event resulted from the N–S convergence between the African and Eurasian plates (e.g., Guiraud et al., 1998; Guiraud et al., 2001; Bumby and Guiraud, 2005; Moustafa, 2020; Bosworth and Tari, 2021).
The shallow–open marine carbonates of the Upper Cretaceous and middle Paleogene (Eocene) represent the third sequence. The unconformity surface representing the upper boundary of TBS 3 (Figure 2) also resulted from regional folding and basin inversion in the Egyptian north Western Desert. This tectonic event was linked to the widespread regional Latest Cretaceous (Maastrichtian)–Earliest Paleogene (early Paleocene) compressional forces (Guiraud and Bosworth, 1997). This tectonic event was contemporaneous with the Alpine orogeny, which resulted from the progressive northward drift of the African plate towards Eurasia (Guiraud and Bosworth, 1997; Guiraud et al., 1998; Guiraud et al., 2001; Bosworth and Tari, 2021).
The shallow to open marine fine clastics of the late Paleogene (Oligocene) and mixed clastic–carbonate deposits of the early Neogene (Miocene) represent the uppermost sequence (Figure 2). The fourth unconformity surface (i.e., upper boundary of TBS 4; Figure 2) occurring at top of the Miocene also resulted from regional folding and basin inversion of the same basin in the Egyptian north Western Desert. This event was linked to the inception of the Red Sea rifting (Guiraud et al., 2001; Bosworth et al., 2015; Bosworth and Tari, 2021).
In the north Western Desert of Egypt including the Shushan Basin, the Middle Jurassic (Bajocian–Callovian) Khatatba Formation is composed at its base of deltaic to shallow marine deposits consisting of sandstones alternating with siltstone, shales, and coal. This changes upward into shallow marine deposits consisting of alternating shale and limestone. The Khatatba Formation is overlain conformably by deltaic to shallow marine limestone and shale assigned to the Late Jurassic (Oxfordian–Kimmeridgian) Masajid Formation (Hantar, 1990; Keeley et al., 1990; EGPC, 1992; Bapetco/Shell, 2000; Guiraud et al., 2001). Deltaic to shallow marine clastics of the Lower Cretaceous (Berriasian/Valanginian–Barremian) Alam El Bueib Formation overly unconformably the Masajid Formation. The deposits of the Alam EL Bueib Formation are succeeded by a succession of deltaic to shallow marine clastics and carbonates of the Aptian Alamein Formation and shallow marine shales of the Dahab Formation. The overlying Kharita Formation, consisting of deltaic to shallow marine sandstone with frequent shale alternations rests conformably on the Dahab Formation over large several parts of the Western Desert except in some parts as reported in the OBA D-17 well (Hantar, 1990; EGPC, 1992; Bapetco/Shell, 2000; Guiraud et al., 2001).
3 Materials
To evaluate the hydrocarbon potential of the Middle–Upper Jurassic and Lower Cretaceous source rock units, this study investigated samples taken from the OBA D-17 well. This well was drilled during an exploration campaign in the western part of the Shushan Basin (Lat. 31° 04′ 05.28″N, Long. 26° 40′ 02.09″E; Figure 1). The study is based on 25 ditch cutting samples collected at depths ranging from 2,150 to 4,030 m (Supplementary Table S1). Access to the well data was provided by the Badr Petroleum Company (BAPETCO). Other material used included a suite of conventional wireline logs and a gamma ray (GR) log to aid in lithology and facies interpretations.
4 Methods
A wide range of methods was used to investigate the hydrocarbon potential of the Middle–Upper Jurassic and Lower Cretaceous source rock units of the Shushan Basin. This includes various organic petrographic analyses to investigate the organic matter composition, kerogen types, and level of thermal maturation This also extended to the Rock-Eval/Total Organic Carbon analyses to investigate the organic geochemical characterization of the studied rock units. A summary of the procedures is provided below.
4.1 Transmitted white light (TWL) organic petrography
For the current transmitted white light petrographic analyses of organic matter, 2 g of each cutting sample were palynologically processed in accordance with the standard HCl/HF procedure (Phipps and Playford, 1984; Traverse, 2007). This included treating the rock samples with HCl and HF to remove the carbonate and silicate contents, respectively. Digested samples were then sieved through a 15 µm nylon screen to remove the remaining clay portion of the sediment matrix and to extract the palynological organic matter (POM). Organic residues were not subjected to ultrasonic treatment or oxidation to eliminate bias in the organic matter composition for TWL (i.e., palynofacies) analyses. Prepared slides were examined using TWL microscopy at various magnifications to carry out qualitative and semi-quantitative analyses of organic matter. POM was qualitatively differentiated into terrestrial and marine “phytoplankton” palynomorphs, while palynodebris was differentiated into translucent (vitrinite) and opaque (intertinite) phytoclasts, and amorphous organic matter (AOM). Quantitative petrographic kerogen typing was carried out by counting of about 500 kerogen components (Supplementary Table S1), including palynomorphs, translucent and opaque phytoclasts, and AOM. The normalized percentage frequency data from the total kerogen count of 500 particles were plotted on Dow and O'Connor (1982) and Tyson (1995) Liptinite-Vitrinite-Inertinite (LVI) ternary diagrams, and on Tyson (1995) AOM-Phytoclasts-Palynomorphs (APP) ternary diagram (Tyson, 1995). This was made to determine the kerogen type in the studied formations. A further count of 200 grains of palynomorphs was made from each sample (Supplementary Table S2) to counter the dilution effect of dominant phytoclasts and AOM components to palynomorphs (Tyson, 1995; Deaf and Tahoun, 2018; Deaf et al., 2020a, b, 2021, Deaf, 2021). To identify depositional paleoenvironments, eight palynological categories based on two subsets of organic matter, total palynomorphs, and total POM were used (Tyson, 1995; Deaf et al., 2020a; Deaf et al., 2020b; Deaf, 2021; Deaf et al., 2021). Furthermore, the count of the marine phytoplankton “dinoflagellate cysts” was differentiated into ecological/environmental groups (i.e., cavate, proximate, and chorate). The percentage frequency data generated from the raw count of 200 palynomorphs was normalized to 100% and plotted in the Federova’s (1977) and Duringer and Doubinger’s (1985) Spores-Microplankton-Pollen (SMP) ternary diagram for better recognition of the depositional environments (Supplementary Table S2). Quantification of POM in terms of percentage abundance was made as follows: POM (>50%) as very abundant, (36%–50%) abundant, (16%–35%) frequent, (5%–15%) common, and finally (<5%) rare. All slides and residues are preserved and recorded in the Paleontology Research Laboratory, Geology Department, Faculty of Science, Sohag University, Egypt.
4.2 Reflected white light (RWL) and UV light (UVL) organic petrography
A total of ten representative samples were selected for reflected organic petrographic analyses. An aliquot of 10 g/sample was crushed and homogenized into fine particles of 840 µm and mixed with a mixture of epoxy resin EpoThin and hardener. The blocks (pellets) were grinded using 320 and 600 µm cloths and then polished through two stages by alumina powder (0.3 and 0.05 µm, respectively) and water. The prepared pellets were investigated under reflected white light (RWL) using a Zeiss Axio Imager® A2m microscope that was equipped with a white (halogen) light source (from a 12 V/100 W) with stabilized current and a fluorescent UV light (UVL) source (from a high-pressure 100 W mercury lamp with stabilized current). The vitrinite reflectance Ro% measurements were conducted using a ×50 oil immersion objective with noil = 1.514 at 23°C, where the magnification provided was ×500. Representative photomicrographs were taken using a digital camera. The UVL analysis was conducted using two filters with an excitation wavelength at 465 nm and a combined beam splitter and barrier filter having a cut at 515 nm. The samples were analyzed on a whole-rock basis. Measurements of random reflectance (Ro, r) values were conducted on primary vitrinite that were calibrated with a sapphire standard (0.47% Ro). The preparation techniques and measurements were conducted at the Advanced Technology Center, Core Laboratories Facilities in Houston, TX, United States. For further details, the reader can refer to the ISO standards (ISO 7404-2, 7404-5, 2009) and ASTM D7708-14 (2014). The classification of the vitrinite and liptinite group macerals is based on the ICCP System (Sýkorová et al., 1996; Sýkorová et al., 2005; Pickel et al., 2017), respectively.
4.3 TOC/open-system programmed (Rock-Eval) pyrolysis
Twenty-five samples from the OBA D-17 well were analyzed for their total organic carbon (TOC) content and Rock-Eval pyrolysis. For the TOC measurements, approximately 250–500 mg aliquots were pulverized into fine particles (∼100 µm). Carbonates were removed by chemical digestion using hydrochloric acid (HCl) for 24 h with intermittent stirring, then rinsing the HCl solution by distilled water. The samples were dried by heating in an oven to eliminate the influence of moisture, then they were combusted at an oven temperature reaching up to ∼1,350°C using a LECO SC-632 analyzer. The amount of released CO2 was measured by an infrared cell with a precision rate better than +0.2% (Carvajal-Ortiz and Gentzis, 2015).
The twenty-five samples were analyzed using a Rock-Eval 6® (RE6) instrument (Vinci Technologies, France; Lafargue et al., 1998). The basic/bulk-rock method (Behar et al., 2001) was used to characterize the potential source rock in terms of free hydrocarbons (S1 peak), amount of remaining hydrocarbon potential (S2 peak), and level of maturity total (Tmax in °C). The temperature program for pyrolysis was 300°C isothermal for 3 min followed by a 25°C/min ramping from 300°C to 650°C; oxidation program was 300°C isothermal for 30 s followed by a 25°C/min ramping from 300°C to 850°C, held isothermal for 5 min at 850°C. Carbon monoxide (CO) and carbon dioxide (CO2) released during the thermal decomposition of organic matter (OM) were also measured during pyrolysis (S3CO and S3CO2 peaks) and oxidation (S4CO and S4CO2 peaks) along with mineral Carbon (S5 peak). Hydrocarbons were measured via a flame ionization detector (FID for hydrocarbons), while both CO2 and CO were measured by infrared (IR) cells (Carvajal-Ortiz and Gentzis, 2015). The above analyses were completed at the Core Laboratories Advanced Technology Center in Houston, TX, United States.
4.4 Organofacies analysis
In this study, the organofacies definition of Jones (1987) was followed. Jones (1987) presented seven gradational organofacies types, each representing units of sedimentary rock that show distinctive compositional and geochemical characteristics of organic matter reflecting various depositional settings in the basin. Jones’s (1987) organofacies types can be related to geochemically identified kerogen Types I–IV, and this enables a pragmatic identification of the hydrocarbon potential of strata deposited under specific depositional conditions more efficiently (e.g., Tyson, 1995; Deaf et al., 2020b, 2021, 2022; Deaf, 2021). Tyson (1995) provided more detailed definitions of the environmental conditions of the organofacies of Jones (1987), which will be used here in the interpretation of the depositional environments and sequence stratigraphic analysis of the studied sedimentary succession (Table 1).
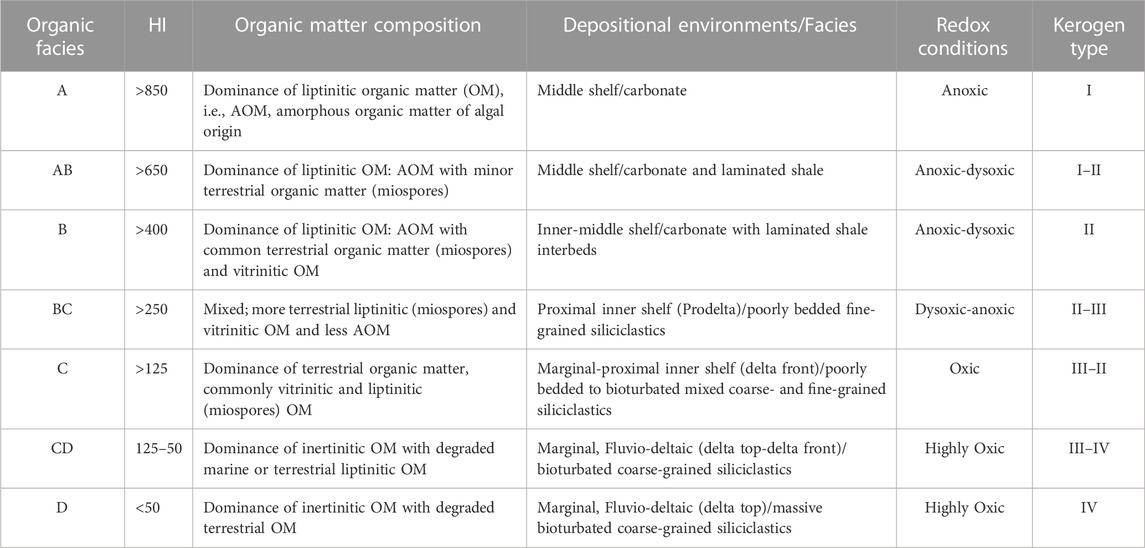
TABLE 1. Organic facies, organic matter composition, depositional settings/facies, and kerogen types (Modified after Jones, 1987; Tyson, 1995, 1996; Mendonça Filho et al., 2012).
5 Results and discussion
5.1 Depositional environments and paleoclimate: integration of palynofacies, organofacies, and lithofacies analyses
The interpretation of the depositional environment depends largely on the sedimentological and ecological indications of certain parameters of palynofacies (PF) and organofacies types. The interpretation depends subordinately on lithofacies characteristics along with the well log data represented by the down hole gamma ray (GR) profile of the studied rock units. Two main PFs were recognized, namely, PF-1 and PF-2, with the latter including two sub-facies (PF-2A and PF-2B). The interpretation of the Middle–Late Jurassic and Early Cretaceous paleoclimatic conditions is based on palynological, lithological, and organofacies data gleaned from the OBA D-17 well. Reference to the recent work of Deaf et al. (2020a) on the regional Cretaceous climate of Egypt was also made.
5.1.1 PF-1 (Samples 1–6/depths 4,030–3,420 m)
5.1.1.1 Stratigraphic setting and distribution
The current palynofacies unit encompasses mixed clastic–carbonate deposits of the Middle Jurassic Khatatba and the Upper Jurassic Masajid formations, which are represented by Samples 1–6 (Figure 3). It contains very abundant AOM (60%–67%, avg. 64% of total kerogen), common translucent phytoclasts (7%–13%, avg. 9% of total kerogen), and frequent opaque phytoclasts (20%–32%, avg. 27% of total kerogen). PF-1 also contains very abundant terrestrial palynomorphs, which are essentially represented by pteridophyte spores (25%–38%, avg. 33% of total palynomorphs) and spherical pollen grains (30%–39%, avg. 34% of total palynomorphs). PF-1 is marked by common dinoflagellate cysts (9%–18%, avg. 13% of total palynomorphs) and MFTLs (10%–33%, avg. 14% of total palynomorphs) abundances (Figures 3, 4A, B).
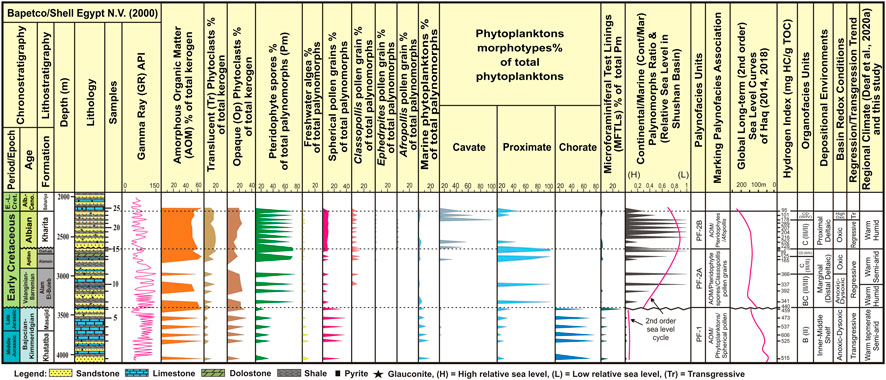
FIGURE 3. Lithological log of the Middle Jurassic–Lower Cretaceous successions in the OBA D-17 well, gamma ray profile, vertical distribution of selected palynofacies parameters used in the identification of the depositional environments/trends, relative sea level curves (this study) and paleoclimate.
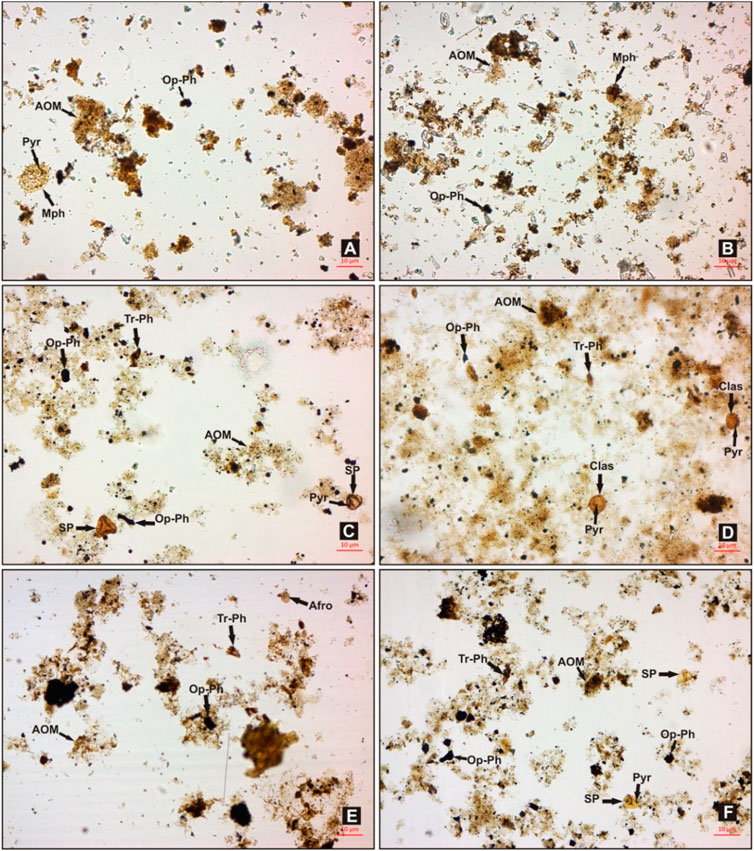
FIGURE 4. Photomicrographs of the Middle Jurassic–Lower Cretaceous palynofacies (PF) types in the OBA D-17 well. Key to labels: Sp, Spore; Pyr, Pyrite; MPh, Marine phytoplankton; Tr-Ph, Translucent phytoclast; Op-Ph, Opaque phytoclast; AOM, Amorphous organic matter. (A,B) PF-1 dominated by AOM and translucent phytoclasts and enriched in phytoplanktons and spherical pollen grains, Sample 6, depth 3,420 m. (C) PF-2A dominated by AOM and translucent phytoclasts, and enriched in sporomorphs, Sample 12, depth 2,800 m. (D) PF-2A dominated by AOM and Classopollis pollen grains Sample 14, depth 2,700 m. (E) PF-2B, dominated by AOM and translucent phytoclasts, and enriched in Afropollis pollen, Sample 17, depth 2,580 m. (F) PF-2B dominated by AOM and translucent phytoclasts and enriched in sporomorphs, Sample 20, depth 2,380 m.
5.1.1.2 Marking palynofacies association
AOM/marine phytoplankton/spherical pollen dominated.
5.1.1.3 Organofacies unit
The dominance of AOM and terrestrial palynomorphs, common occurrences of marine phytoplankton (dinoflagellate cysts and MFTLs) and translucent phytoclasts, and relatively high HI values (459–606, avg. 519.2 mg HC/g TOC) infer an organofacies Type B according to the classification of Jones (1987; Figure 3; Table 1; Supplementary Table S3).
5.1.1.4 Interpreted environment
The common abundances of the dinoflagellate cysts are mainly represented by the very abundant (59%–78%, avg. 70% of total dinoflagellate cysts) open marine (inner–middle shelf) chorate forms (e.g., Systematophora). The marginal–inner shelf cysts (e.g., Escharisphaeridia) occur subordinately in common abundances (19%–35%, avg. 27% of total dinoflagellate cysts). The composition of this dinoflagellate association indicates deposition of PF-1 sediments in inner–middle shelf settings (Downie et al., 1971; Smelror, and Leereveld, 1989; Tahoun and Deaf, 2016; Deaf and Tahoun, 2018; Deaf et al., 2020a). The common occurrences of MFTLs, generally point to normal marine settings (e.g., Lister and Batten, 1988; Stancliffe, 1989; Deaf and Tahoun, 2018).
Plotting of PF-1 samples in the Spores-Microplankton-Pollen (SMP) ternary diagram of Federova’s (1977) and Duringer and Doubinger’s (1985) also supports the interpreted shallow marine (inner shelf)–offshore (middle shelf) settings (Figure 5A). The occurrences of very abundant AOM in the shale intercalations of the clastic part of PF-1 also suggest deposition of these sediments in proximal, inner shelf settings close to vegetated land. However, the intercalated shale and limestone were deposited in a clastically-starved, distal middle shelf setting under anoxic–dysoxic conditions (Einsele, 1992; Tyson, 1995, Deaf et al., 2020a, 2021; Figure 5B). Anoxic–dysoxic conditions are also reflected by the occurrence of pyrite in the shale beds and in the bodies of the palynomorphs (Tyson, 1995; Deaf and Tahoun, 2018; Deaf et al., 2020a; Deaf et al., 2020b; Deaf et al., 2021; Figures 3, 4A).
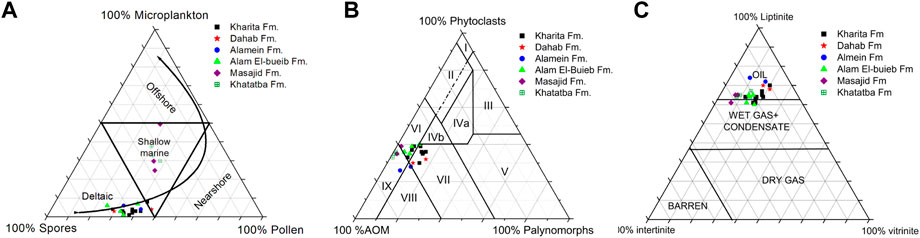
FIGURE 5. (A) Spores–Microplankton–Pollen (SMP) ternary plot showing depositional environments of the studied formations in the OBA D-17 well (After Federova, 1977; Duringer and Doubinger, 1985), (B) AOM–Phytoclasts–Palynomorphs (APP) ternary plot showing different palynofacies types and redox conditions for the samples from the OBA D-17 well (after Tyson, 1995), (C) Ternary Liptinite–Vitrinite–Inertinite (LVI) plot showing hydrocarbon potential of the studied formations in the OBA D-17 well (After Law et al., 1980).
The nearly equal frequencies of spherical pollen grains, mostly Araucariacites spp. (30%–39%, avg. 34% of total palynomorphs) and pteridophyte spores, mostly Deltoidospora spp. (25%–38%, avg. 33% of total palynomorphs) indicates deposition in open marine (inner–middle) shelf settings. These depositional settings were relatively far from sources of terrestrial palynomorphs (Tyson, 1989; Deaf and Tahoun, 2018). The occurrence of high abundances of spherical pollen grains in comparison to pteridophyte spores are commonly used to infer low energy, distal offshore (middle shelf) settings (Tyson, 1989, 1995; Tahoun and Deaf, 2016; Deaf and Tahoun, 2018).
The freshwater algae show common abundances (7%–8%, avg. 7%) in the mixed clastic–carbonate deposits of the Khatatba Formation and an upward decrease to rare occurrences (3%–5%, avg. 4%) in the mostly carbonate-dominated deposits of the Masajid Formation. This indicates a change in the depositional environment from inner shelf to proximal middle settings (Tyson, 1995; Tahoun and Deaf, 2016; Deaf and Tahoun, 2018). High abundances of freshwater algae are indicative of near shore, high energy, marginal marine (deltaic)–inner shelf settings that are normally subjected to tides and high wave energy (e.g., Sarjeant and Taylor, 1999; Courtinat, 2000; Deaf et al., 2020a, Deaf et al., 2020b; Deaf et al., 2021).
Dominance of the opaque phytoclasts (20%–32%, avg. 27% of total kerogen) over the translucent phytoclasts (7%–13%, avg. 9% of total kerogen) also confirms the suggested inner–middle shelf settings. High abundances of opaque phytoclasts are used to indicate offshore depositional settings that were mostly removed from strong influxes of fresh “translucent” phytoclasts. The opaque phytoclasts are more brittle and liable to fragmentation into smaller particles with offshore transportation, and thus, tend to concentrate in the very fine-grained siliciclastic sediments (Firth, 1993; Tyson, 1995; Tahoun and Deaf, 2016; Deaf and Tahoun, 2018; Deaf et al., 2020a).
5.1.1.5 Paleoclimate
Deaf et al. (2020a) presented interpretations of the regional Early Cretaceous climate prevailed over the Egyptian landmass. This work was based on the ecological and environmental significance of certain palynomorphs and on the lithological indication and/or relationship to climatic conditions. For example, warm humid climate was characterised by dominance of the humid loving pteridophyte spores (e.g., Deltoidospora) and deposition of siliciclastic strata. Whereas, warm semi-arid climate was characterized by the dominance of xerophytic pollen grains (e.g., Classopollis and Ephedripites) and deposition of limestone and dolostone strata. The same approach was followed in the current study and was supplemented by indications of organofacies data.
PF-1 exhibits relatively similar frequencies of spherical pollen grains (i.e., Araucariacites spp.) indicative of warm temperate and semi-arid climate and pteridophyte spores (i.e., Deltoidospora spp.) indicative of warm humid climate (Table 2). This suggests that the Egyptian landmass witnessed mild, warm temperate and relatively humid to semi-arid conditions during the Middle–Late Jurassic.
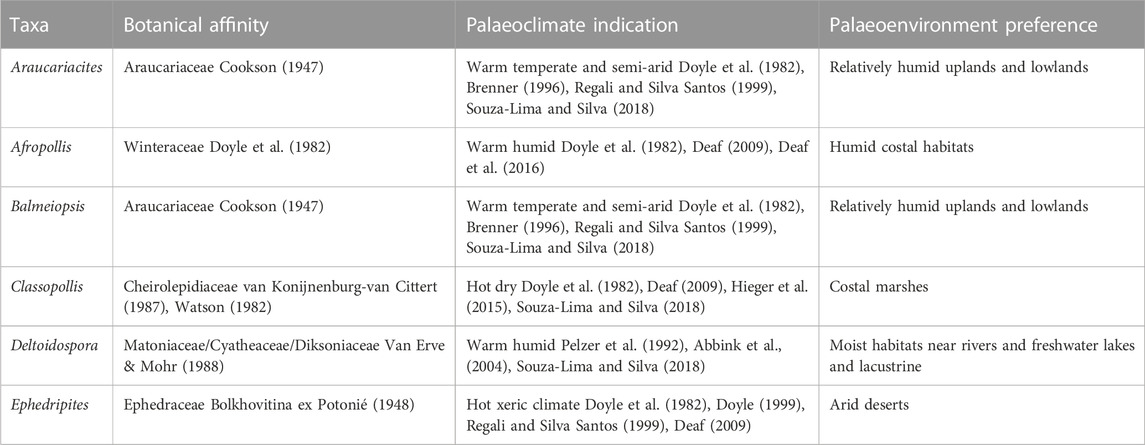
TABLE 2. Botanical affinities, ecological preferences, and paleoclimatic indications of some selected sporomorphs in tropical and subtropical regions (modified after Deaf, 2009; Souza-Lima and Silva, 2018; Deaf et al., 2020a).
From an organofacies perspective, the dominant AOM and terrestrial palynomorphs, and common marine phytoplankton and translucent phytoclasts occurrences showing relatively high HI values (Figure 3; Table 1; Supplementary Table S3) were recovered from the well bedded/laminated shales and carbonates of PF-1. These organic petrographic/geochemical and lithological criteria are typically diagnostic of organofacies Type B. Deposition of this organofacies is associated with sedimentations under semi-arid conditions and inner–middle shelf environments (Jones, 1987; Tyson, 1995; Deaf, 2021; Deaf et al., 2022).
Lithologically, humid climatic conditions are characterized by deposition of siliciclastic sediments, whereas arid climatic conditions are characterized by deposition of carbonates (e.g., Cecil, 1990; Leeder et al., 1998; Cecil and Dulong, 2003; Ziegler et al., 2003; Feldman et al., 2005; Hfaiedh et al., 2013; Deaf, 2021). Thus, deposition of the relatively thick carbonate units interbedded with clastic units of PF-1 indicates the development of mild, warm temperate and semi-arid climatic conditions during the Middle–Late Jurassic (e.g., Cecil, 1990; Feldman et al., 2005; Deaf, 2021).
5.1.2 PF-2A (Samples 7–15/depths 3,400–2,680 m)
5.1.2.1 Stratigraphic setting and distribution
This is the middle palynofacies unit, which is bounded at its base and top by unconformity surfaces (Bapetco/Shell, 2000). It is represented by Samples 7–15 from the Lower Cretaceous clastic deposits of the Alam El Bueib (Valanginian–Barremian), Alamein, and Dahab (Aptian) formations (Figure 3). This palynofacies unit contains very abundant AOM (50%–66%, avg. 58% of total kerogen), common translucent phytoclasts (9%–21%, avg. 15% of total kerogen), and frequent opaque phytoclasts (11%–25%, avg. 18% of total kerogen). PF-2A is distinguished from the underlying PF-1 by showing higher terrestrial palynomorphs abundances (pteridophyte spores 69%–77%, avg. 73% of total palynomorphs). PF-2A is also characterized by enrichment in Classopollis pollen grains (9–14, avg. 12%) and lower (mostly rare) marine phytoplankton abundances (dinoflagellate cysts1–5%, avg. 1%; MFTLs 1%–4%, avg. 1% of total palynomorphs) (Figures 4C, D).
5.1.2.2 Marking palynofacies association
AOM/pteridophyte spores-dominated/Classopollis-enriched.
5.1.2.3 Organofacies unit
Samples 7–11, which consist mostly of shale and assigned to the lower–upper Alam El Bueib Formation, contain high abundances of AOM (50%–63%, avg. 57% of total kerogen) and the highest total phytoclasts abundances (13%–25%, avg. 18% of total kerogen) among all the PF-2A samples. These samples exhibit moderate HI values (337–440, avg. 375.2 mg HC/g TOC). All the aforementioned organic petrographic/geochemical data denote an organofacies Type BC for the lower part of PF-2A (Figure 3; Table 1; Supplementary Table S3).
The clastic-dominated deposits of the uppermost Alam El Bueib and the entire Alamein and Dahab formations (Sample 12–15) contain similar high AOM (51%–66%, avg. 59% of total kerogen) and the lowest total phytoclasts abundances (9%–21%, avg. 15% of total kerogen) among PF-2A samples. These largely clastic deposits show relatively lower HI values (89–215, avg. 148.5 mg HC/g TOC). All these organic petrographic and geochemical data indicate organofacies Types C–CD for the upper part of PF-2A (Figure 3; Table 1).
5.1.2.4 Interpreted paleoenvironment
Deposits of PF-2A display notably lower rare abundances of the dinoflagellate cysts, which decrease upward and are almost represented by the very abundant (67%–100%, avg. 92% of total dinoflagellate cysts) inner–middle shelf, proximate cysts (e.g., Pseudoceratium). A frequent abundance of marginal marine–inner shelf cavate forms, e.g., Palaeoperidinium (33% of total dinoflagellate cysts) occurs in Sample 12 only. The inner–middle shelf chorate forms are absent from this palynofacies unit. Collectively, this suggests deposition in inner shelf settings for PF-2A (Tahoun and Deaf, 2016; Deaf and Tahoun, 2018, Deaf et al., 2020a; Deaf et al., 2020b).
The rare occurrences and upward decrease in the MFTLs also suggest the development of shallower marine settings of stressed salinity than that suggested for the preceding PF-1 (Lister and Batten, 1988; Stancliffe, 1989; Deaf and Tahoun, 2018). Plotting of PF-2A samples in the SMP and APP diagrams also indicates stressed proximal shallow marine (deltaic) settings (Figures 5A, B). The APP diagram indicates mostly suboxic–anoxic conditions for the lower part of PF-2A (i.e., Alam El Bueib Formation), while the geochemical (HI) data specifies the development of better reducing (dysoxic–anoxic) conditions (Figure 3; Table 1). Similarly, the APP diagram implies dysoxic–anoxic conditions for the upper part of PF-2A (i.e., uppermost Alam El Bueib, Alamein, and Dahab formations); however, the geochemical data indicates oxic conditions. The later conditions are related to possible bioturbation of the deltaic shale and oxidation of AOM in Sample 12, which is commonly known to downgrade HI values and is reflected here on the poor preservation of palynomorphs (Hofmann et al., 1993; Tyson, 1995). Moreover, the occurrence of infrequent glauconite in the sandstones indicates reworking, and presumably low sedimentation rates, which is supported by the very poor preservation of palynomorphs in PF-2A (Deaf and Tahoun, 2018). The glauconite is known to accumulate in very shallow marine conditions that are characterized by very low sedimentation rate and/or showing almost non-deposition (Einsele, 1992; Dooley, 2006). The oxic conditions recognized near the unconformity surface (i.e., at the location of Sample 15, Figure 3) were developed mostly due to uplift and erosion, which resulted in reworking and oxidation of organic matter (Tyson, 1995). This shows the important role of calibrating and supplementing the organic petrographic data with the geochemical data to obtain correct interpretations of depositional settings. The occurrences of very abundant AOM that is coupled with upward increases in the translucent phytoclasts and conversely decreases in the opaque phytoclasts indicate deposition of PF-2A unit in proximal inner shelf (deltaic) settings adjacent to active sources of terrestrial organic matter (Tyson, 1995, Deaf and Tahoun, 2018; Deaf et al., 2020a, b, 2021). The interpreted reducing conditions are also confirmed by the infrequent occurrences of pyrite in the shale beds and in the palynomorphs’ body (Figures 3, 4C, D).
The upward increase in the pteridophyte spores (69%–77%, avg. 73% of total palynomorphs) and decrease in the spherical pollen grains (9%–12%, avg. 11% of total palynomorphs) also confirm that deposition of PF-2A took place in proximal shallow marine (deltaic) settings. These depositional settings were shallower and closer to sources of terrestrial palynomorphs than that interpreted for the underlying PF-1 (Deaf and Tahoun, 2018; Deaf et al., 2020a). The persistent occurrences of freshwater algae (1%–4%, avg. 4%) in PF-2A strata reinforce the interpreted deltaic settings. Moreover, the common abundances of the Classopollis pollen grains (9%–14%, avg. %12 of total palynomorphs) also postulate deltaic settings for PF-2A. The parent plants of Classopollis are known to flourish in coastal marshes, where their pollen grains show low to common abundances in marginal marine settings and very high abundances in more offshore (middle shelf) environments (Tyson, 1995; Hieger et al., 2015; Deaf and Tahoun, 2018; Deaf et al., 2020a).
The dominance of AOM and terrestrial organic matter that are mixed with very low marine phytoplankton abundances in the poorly laminated clastic sediments in addition to the moderate to low HI values also suggest deposition of PF-2A strata in deltaic environments (Jones, 1987; Tyson, 1995; Deaf, 2021; Deaf et al., 2022).
5.1.2.5 Paleoclimate
In the lower part of PF-2A (Samples 8–10, Figure 3), the notable increase in the warm humid indicators pteridophyte spores and decrease in the warm temperate indicators spherical pollen grains suggest development of warmer and more humid climatic conditions during the Valanginian–early Barremian time in comparison to the mild and less humid Middle–Late Jurassic climate. A shift toward warmer and semi-arid conditions is postulated for the late Barremian–Aptian time. This is explained by the appearance and common abundances of the hot climate indicators Classopollis pollen grains in the upper part of PF-2A (Samples 11–15) (Figure 3; Table 2). High abundance of these hot xeric pollen grains is indicative of hot dry climatic conditions (Doyle et al., 1982; Deaf, 2009; Hieger et al., 2015; Souza-Lima and Silva, 2018; Deaf et al., 2020a).
Deposition of organofacies BC in the fine-grained siliciclastic deposits of the lower PF-2A (Samples 8–11) indicates warm humid climatic conditions during the Valanginian–early Barremian. Deposition of organofacies C–CD in the mixed coarse- and fine-grained siliciclastic deposits with few limestone and dolostone interbeds of the upper PF-2A (Samples 12–15) indicates warm semi-arid conditions during the late Barremian–Aptian (Jones, 1987; Cecil, 1990; Tyson, 1995; Pittet and Gorin, 1997; Leeder et al., 1998; Ziegler et al., 2003; Feldman et al., 2005; Hfaiedh et al., 2013; Deaf, 2021).
5.1.3 PF-2B (Samples 16–24/depths 2,670–2,170 m)
5.1.3.1 Stratigraphic setting and distribution
PF-2B is the uppermost palynofacies unit. It covers the Albian Kharita Formation and corresponds to Samples 16 to 24. PF-2B exhibits organic matter composition and abundances similar to those identified in PF-2A. PF-2B contains very abundant AOM (49%–59%, avg. 53% of total kerogen), common translucent phytoclasts (12%–20%, avg. 17% of total kerogen), and frequent opaque phytoclasts (10%–24%, avg. 18% of total kerogen). PF-2B also contains very abundant pteridophyte spores (68%–74%, avg. 72% of total palynomorphs) and nearly equal common abundances of spherical pollen grains (8%–12%, avg. 10% of total palynomorphs) and Classopollis pollen grains (8–11, avg. 9% of total palynomorphs). The current palynofacies also contains rare marine phytoplanktons abundances (dinoflagellate cysts 1%–4%, avg. 1%; MFTLs 1%–2%, avg. 1% of total palynomorphs) similar to those of PF-2A (Figures 4E, F). PF-2B is distinguished from PF-2A by dinoflagellate cysts showing remarkably different morphotype composition. PF-2B contains higher cavate (50%–100%, avg. 65%) and lower proximate (33%–50%, avg. 44%) cysts. PF-2B is also characterized by the almost continuous occurrences of Afropollis (2%–6%, avg. 3%) and Ephedripites (2%–5%, avg. 3%) pollen grains.
5.1.3.2 Marking palynofacies association
AOM/pteridophyte spores-dominated/Afropollis-enriched.
5.1.3.3 Organofacies unit
The dominance of AOM and terrestrial organic matter (palynomorphs and total phytoclasts), rare marine phytoplanktons along with the moderate HI values (204–289, avg. 232.7 mg HC/g TOC) for Samples 16–21 indicate an organofacies Type BC. Sample 22 (178 mg HC/g TOC) and Samples 23–24 (95–101, avg. 98 mg HC/g TOC) generally exhibit lower HI values, which correspond to organofacies Types C and CD, respectively (Figure 3; Table 1; Supplementary Table S3).
5.1.3.4 Interpreted paleoenvironment
Deposits of PF-2B show organic petrographic composition and vertical stratigraphic distribution similar to those of PF-2A, except that dinoflagellate cysts show higher deltaic–inner shelf cavate forms (e.g., Subtilisphaera) and remarkably lower abundances of the inner–middle shelf proximate forms (e.g., Pseudoceratium). Thus, the composition of this dinoflagellate cysts association indicates deposition in relatively shallower marginal marine (deltaic) settings. The disappearance of the proximate forms from most of PF-2B samples and the occurrence in the last top samples indicate the onset of a minor sea level rise (Figure 7). The rare occurrences of the MFTLs also suggest deposition in deltaic settings similar to that suggested for PF-2A. The SMP and APP diagrams also confirm the interpreted deltaic settings (Figures 5A, B).
In a similar manner, the APP diagram indicates mostly suboxic–anoxic to dysoxic–anoxic conditions for PF-2B (Figure 5B). In contrast, the organic geochemical (HI) data (Figure 3; Table 1) indicates dysoxic–anoxic to oxic conditions for samples of the current palynofacies unit, which is probably related to continued bioturbation of the deltaic sediments and oxidation of organic matter including AOM. The occurrence of frequent glauconite in the sandstone beds indicates reworking and low sedimentation rates during deposition of the PF-2B sediments (Figure 3). The combined occurrences of the proximate dinoflagellate forms and the glauconite in the last two topmost argillaceous samples point to an onset of sea level rise. The glauconite mineral is commonly found to accumulate in argillaceous deposits during commencing sea level rises (e.g., Catuneanu, 2006).
Furthermore, the occurrence of Afropollis pollen grains also supports deltaic setting for PF-2B unit, where the parent plant of this pollen grain is known to live in humid coastal plains (Deaf et al., 2016; 2020a). The continued dominance of AOM and terrestrial organic matter, and very low marine phytoplanktons in the poorly bedded to bioturbated coarser clastic units along with moderate to low HI values collectively indicate that the PF-2B sediments accumulated in proximal deltaic settings (Jones, 1987; Tyson, 1995).
5.1.3.5 Paleoclimate
The persistent very high abundances of the warm humid indicators pteridophyte spores and the notable decline in the hot climate indicators Classopollis pollen grains (Figure 3; Table 2) suggest a shift toward warm and more humid conditions during the Albian time. High abundances of these hot xeric pollen grains are indicative of hot dry climatic conditions (Doyle et al., 1982; Deaf, 2009; Deaf et al., 2020a). The rare occurrences of the xerophytic pollen grains Ephedripites provide further support to the interpreted warm conditions (Figure 3; Table 2) because high abundances of these forms are indicative of hot dry conditions (Doyle et al., 1982; Doyle, 1999; Regali and Silva Santos, 1999; Deaf, 2009; Deaf et al., 2016, 2020a).
Deposition of organofacies C–CD in the mixed coarse- and fine-grained siliciclastic deposits of PF-2B (Samples 16–24, Figure 3; Supplementary Table S3) indicates warm humid conditions (e.g., Jones, 1987; Cecil, 1990; Tyson, 1995; Leeder et al., 1998; Cecil and Dulong, 2003; Ziegler et al., 2003; Feldman et al., 2005; Hfaiedh et al., 2013; Deaf, 2021).
5.2 Development of Middle Jurassic–Lower Cretaceous stratigraphic sequences: impact of allogenic controls
Light microscopic (LM) investigation of vertical and lateral distributions of palynological organic matter have proven to provide valuable sequence stratigraphic information on clastic and carbonate sequences (e.g., Tyson, 1996; Pittet and Gorin, 1997; Bombardiere and Gorin, 1998; Deaf and Tahoun, 2018; Deaf, 2021). Selected palynofacies components and parameters (e.g., continental/marine (Cont/Mar) palynomorphs ratio, opaque/translucent (Op/Tr) phytoclasts ratio, and abundances of the marine phytoplankton) are very helpful in identifying the vertical stratal stacking patterns (e.g., coarsening upward sequences, CUS; fining upward sequences, FUS). These selected parameters are also useful in identifying the bounding surfaces of the stratigraphic sequences (e.g., maximum flooding surfaces, maximum regressive surfaces), and systems tracts (e.g., Tyson, 1995, 1996; Pittet and Gorin, 1997; Deaf, 2021).
Moreover, the use of organic geochemical data, especially the Hydrogen index (HI in mg HC/g TOC) also adds another dimension to the sequence stratigraphic analyses. Sedimentological conditions are known to have direct impact on the geochemical characteristics of the organic matter (e.g., Jones, 1987; Tyson, 1995). Therefore, organofacies types and their vertical changes can be used in identifying systems tracts and vertical stratal stacking (Robison and Engel, 1993; Tyson, 1996; Bombardiere and Gorin, 1998; Dahl et al., 2004; Deaf, 2021; Deaf et al., 2022). Deaf (2021) proposed a schematic model of the palynofacies and organofacies stratigraphic compositions to identify stratigraphic sequences and their systems tracts deposited in mixed clastic–carbonate basins containing marginally mature to early mature organic matter. Herein, a slight modification to the organofacies types of that model is made to identify the depositional environments and their associated redox conditions in this study (Figure 6). The Cont/Mar ratio is considered as one of the important organic petrographic parameters, where its vertical stratigraphic change is found to reflect variations in the third order sea level, and thus, indicates sedimentation trends in terms of transgression and regression (Pittet and Gorin, 1997; Prauss, 2001; Deaf et al., 2020a; Deaf, 2021).
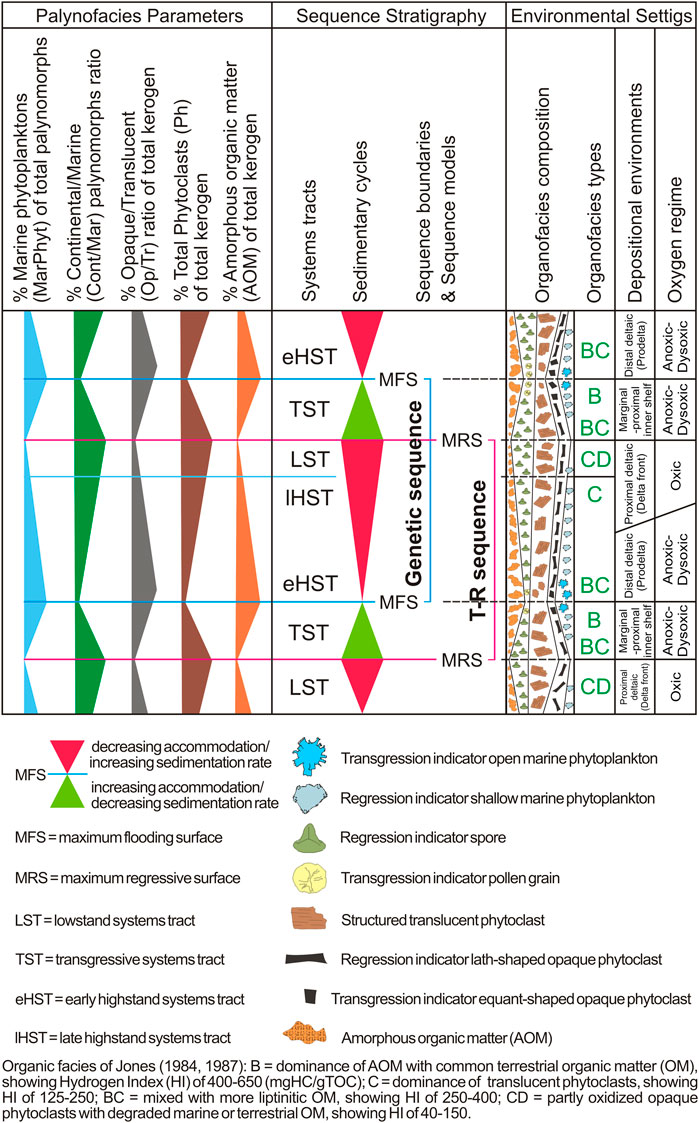
FIGURE 6. Organofacies model proposed and used here, corresponding depositional environments, redox conditions, and vertical stratigraphic trend of palynofacies constituents and/or parameters used in the interpretation of depositional environments and sequence stratigraphic units in the studied formations in the OBA D-17 well (Compiled and modified from Deaf, 2021).
In the present work, the smoothed trend of the Cont/Mar ratio is used to draw the regional second order sea level cycles (Prauss, 2001, 2006; Hermann et al., 2011; Deaf, 2021) because the available samples are not evenly distributed over the studied section. The integration of vertical changes in lithofacies characteristics recognized from cutting samples with well log data (gamma ray, GR) and organic petrographic data provides more robust sequence stratigraphic analyses (Rider, 2002; Catuneanu, 2019; Deaf, 2021).
The Middle–Upper Jurassic and Lower Cretaceous strata investigated in the present study can be subdivided into three genetic sequences (sensu Galloway, 1989) separated and bounded by marine flooding surfaces. Because these sequences occur within the framework of the second order unconformity bounded tectonostratigraphic sequences/units documented in previous papers and outlined further above (Section 2), the three sequences (SQ) were regarded to be of third order (sensu Sloss, 1963). A systematic description of the three sequences, their systems tracts, and bounding surfaces (sensu Van Wagoner, 1995; Tyson, 1996; Bombardiere and Gorin, 1998) is provided below. Recent advances in sequence stratigraphy (e.g., Zecchin and Catuneanu, 2013, 2017; Catuneanu, 2020b) along with the comprehensive scheme of Deaf (Deaf (2021); Supplementary Table S4) were also followed. The model-independent approach of sequence stratigraphic analysis of Catuneanu (2019) was implemented in this study. Furthermore, the genetic model of Galloway (1989) was used to investigate the organofacies distribution in order to evaluate the hydrocarbon potential of the studied successions, because potential source rocks are found to be largely associated with late TST/early HST, at about the time when the maximum flooding surface (MFS) forms (Tyson, 1996; Deaf and Tahoun, 2018; Deaf, 2021). Deposition and stratal stacking of stratigraphic sequences are governed by allogenic (global sea level changes, regional climate, and tectonics) and autogenic (e.g., deltaic switching, autocyclicity) processes. Thus, it is crucial to study the impact of all these processes to gain a better insight on the development of the studied sequences (e.g., Catuneanu and Zecchin, 2013; Hampson, 2016; Catuneanu, 2020a, b; Deaf, 2021).
5.2.1 SQ 1: the Khatatba and Masajid formations (Samples 1–6)
This sequence includes only TST, which covers the Middle–Upper Jurassic (Bajocian–Kimmeridgian) Khatatba and Masajid formations. It is composed at its lowermost and uppermost parts by clastic units showing alternations of sand and shale beds, and at its middle part by a main carbonate unit with minor shale intercalations (Figure 7). It has a thickness of 610 m. It is delineated at its base by the sandstone unit at Sample 1 and at its top by the MFS at the carbonate unit at Sample 6 just below the unconformity surface. Strata of this sequence were deposited during a transgressive phase in inner–middle shelf settings under reducing anoxic–dysoxic conditions (Figures 3, 7).
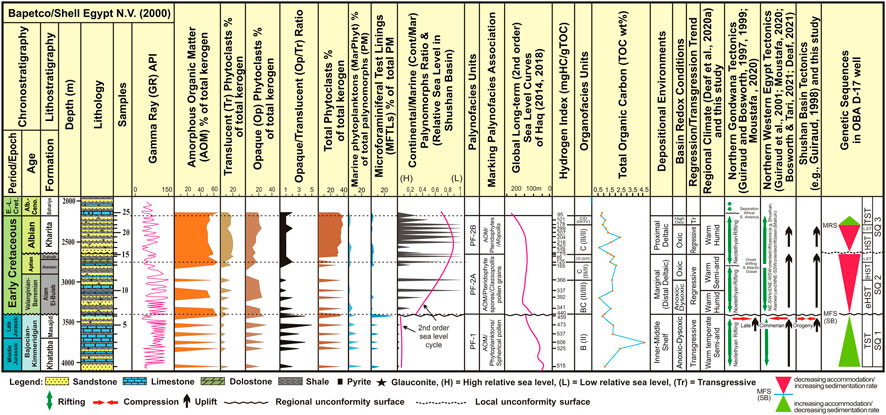
FIGURE 7. Lithological log of the Middle Jurassic–Lower Cretaceous succession in the OBA D-17 well, gamma ray profile, vertical distribution of selected palynofacies parameters, depositional environments/trends, and relative sea level curves used in the identification of the genetic sequences (SQ) in western Shushan Basin.
5.2.1.1 Transgressive system tracts (TST): Samples 1–6 (depths 4,030–3,420 m).
This TST exhibits a FUS with the basal coarse-grained sandstone unit grading upward into shale and major limestone units. This FUS is also reflected by the GR profile (Rider, 2002; Figure 7). The lower boundary of this TST is located nearly at the top of a basal sandstone unit, which shows the minimum Op/Tr ratio (1.5) and high total phytoclasts abundance (33%). The indication of the Cont/Mar palynomorphs ratio is not conclusive here because deposition of this TST took place in open marine, inner–middle settings that were situated far from strong influxes of terrestrial palynomorphs (Tyson, 1996; Deaf and Tahoun, 2018; Deaf, 2021) (Section 5.1.1, Figures 3, 4). Adding to that, the development of semi-arid conditions that are reflected by the clastic sediments starvation and carbonate sedimentation (Cecil, 1990; Pittet and Gorin, 1997; Ziegler et al., 2003; Feldman et al., 2005; Catuneanu and Zecchin, 2013; Deaf et al., 2020a; Deaf, 2021) probably has an important impact on the diminished reproduction and transportation of terrestrial palynomorphs to open marine settings (Einsele, 1992; Tyson, 1995; Deaf, 2021). The upper bounding surface of SQ 1 is regarded as a MFS and is located nearly at the top of a limestone unit at Sample 6. MFS is identified by the maximum marine phytoplankton abundance (41%), minimum Cont/Mar ratio (0.01), and high Op/Tr ratio (3.9) (Tyson, 1995; Pittet and Gorin, 1997; Prauss, 2000, 2001; Deaf and Tahoun, 2018; Deaf, 2021; Figures 6, 7; Supplementary Table S4). The maximum AOM and minimum total phytoclasts abundances are not detected at the MFS because of erosion and truncation of the topmost part of the sequence.
The samples of the current TST show an organofacies Type B, which is categorized by dominance of terrestrial organic matter (mostly spherical pollen grains and translucent phytoclasts) and high marine phytoplankton and indicates reducing (anoxic–dysoxic) conditions (Figures 6, 7; Table 1).
Deposition of the transgressive SQ 1 took place in inner–middle shelf settings in the western Shushan Basin during a marine transgression. Correlation of the regional second order high sea level identified in this study with the Neotethyan Middle–Late Jurassic (Bajocian–Kimmeridgian) second order high sea level of Haq (2018) shows a clear match between them (Figure 7). This indicates that the deposition of SQ 1 was mainly controlled by the Neotethyan sea level rise. There is a change in deposition form carbonate to clastic sediments showing coarsening and shallowing upward trend, which ends up with the disappearance of the Tithonian deposits and the occurrence of an unconformity surface separating the Upper Jurassic from the Lower Cretaceous in the OBA D-17 well (Figure 7). This is attributed to the simultaneous late Tithonian sharp sea level fall and the regional Latest Jurassic “Late Cimmerian event.” This tectonic event resulted in block faulting and uplifting of large parts of North Africa including northwestern Egypt, which was connected to the opening of the North Atlantic Ocean and the NE drifting of Africa towards Europe (e.g., Guiraud et al., 1998; Guiraud et al., 2001; Bumby and Guiraud, 2005; Moustafa, 2020; Figure 7).
As has been mentioned earlier in Section 5.1.1, the mostly clastic-starved, carbonate-dominated sedimentation of SQ 1 was related to the warm temperate and semi-arid climatic conditions that prevailed during the Middle–Late Jurassic (Figure 7). Collectively, all the above-mentioned sedimentological, tectonic, and climatic conditions, indicate that deposition of SQ 1 was mainly controlled by the Neotethyan sea level, regional tectonics, and regional climate (Figure 7).
5.2.2 SQ 2: the Alam El Bueib, Alamein, and Dahab formations (Samples 7–15)
This is the first regressive sequence, which is also incomplete and covers the Lower Cretaceous Alam El Bueib (Valanginian–Barremian), and Alamein and Dahab (Aptian) formations. It is composed of a major clastic unit, which is made of shale and sandstone beds with few carbonate intercalations at the middle and upper parts of the section. It attains a thickness of 720 m. It shows a CUS and is bounded at its base a maximum regressive surface (MRS) at a sandy shale unit at Sample 15 and at the top by an unconformity surface (Figure 7). Strata of this sequence were deposited during a regressive phase in marginal marine (deltaic) settings under dysoxic–anoxic to oxic conditions (Figures 5A, B, 7).
5.2.2.1 Highstand system tracts (HST): Samples 7–13 (depths 3,400–2,760 m).
This HST is identified from the Alam El Bueib and most of the Alamein formations, which were deposited in deltaic environments under persistent change in redox conditions from reducing (dysoxic–anoxic) to oxic conditions (Figure 7). This HST exhibits a CUS, which is reflected by the upward increase in the Cont/Mar ratio (from 0.19 to 0.66) and decrease in the abundances of marine phytoplankton (from 4.5% to 0.5%) and MFTLs (from 2.5% to 1%) (Tyson, 1995; Pittet and Gorin, 1997; Prauss, 2001; Deaf and Tahoun, 2018; Deaf, 2021). The upward decrease in the AOM (from 63% to 60%) and Op/Tr ratio (from 1.7 to 0.6) also indicates upward shallowing conditions. Moreover, a large-scale coarsening and shallowing upward trend is also evident in the GR data (Figure 7). The lower boundary of the current HST is located just above the unconformity surface at top of a shale unit. The upper boundary is delineated by the basal surface of forced erosion (BSFR = correlative conformity C.C. surface of Posamentier and Allen, 1999). BSFR is delineated at Sample 13 and corresponds to the temporal point separating the late Aptian third order relative sea level rise from the subsequent latest Aptian third relative sea level fall (Deaf, 2021; Supplementary Table S4). The onset of this relative sea level fall at the BSFR is identified by the remarkable increase in the Cont/Mar ratio (0.66), and the minimum marine phytoplankton (0.5%) and MFTLs (1%) abundances (Deaf, 2021; Figure 7; Supplementary Table S4).
Furthermore, the HST of SQ 2 can be divided into early highstand systems tracts (eHST) and late highstand systems tracts (lHST) based on their organofacies composition (Tyson, 1995, 1996). The eHST (Samples 7–11) corresponds to an organofacies Type BC, which denotes reducing (anoxic–dysoxic) conditions and is characterized by high opaque phytoclasts (20%–25%, avg. 22%) and low marine phytoplankton (0.5%–4.5%, avg. 1.7%). The lHST (just above Samples 11–13) corresponds to an organofacies Type C, which indicates oxic conditions and is characterized by low opaque phytoclasts (11%–17%, avg. 14%) and low marine phytoplankton (0.5%–1.5%, avg. 1.0%). The upward downgrade in the organofacies from Type BC to C and the changes from reducing to oxic conditions add another line of evidence, which demonstrates a coarsening and shallowing upward trend typical of the HST (Figures 6, 7; Table 1). The quality of organic matter and redox conditions are known to decrease with progressive shallowing (Tyson, 1995, 1996; Bombardiere and Gorin, 1998; Deaf et al., 2020b; Deaf, 2021).
The Neotethyan Early Cretaceous (late Valanginian–Aptian) second order sea level of Haq (2014) shows a minor late Valanginian sea level rise with major sea level rise developing during the Hauterivian–early Barremian ending with minor sea level fall during the late Barremian and a long-term stasis during the Aptian–early Albian (Figure 7). Correlation of the regional second order sea level showing a major shallowing upward trend with that of the Neotethyan of Haq (2014) indicates that deposition of HST was mainly affected by local uplifting. This uplifting is probably overprinted the Neotethyan minor–major sea level rises and long-term stasis in sea level mentioned above (Figure 7). This local uplifting was probably connected to the regional block faulting and uplifting associated with Hauterivian–Barremian and early Aptian rifting of numerous basins, for example, Shushan, Matruh, and Abu Gharadig (Guiraud et al., 1998; Guiraud et al., 2001; Tari et al., 2012; Moustafa, 2020; Deaf et al., 2020a, Deaf, 2021).
Deposition of a major clastic unit of the lower–middle eHST that ends up with a major coarser clastic unit of uppermost eHST and the entire lHST containing few carbonate intercalations indicate a shift in climate from warm humid Valanginian–early Barremian to warm and semi-arid late Barremian-Aptian times (Figure 7).
Overall, deposition of HST of the SQ 2 was mainly controlled by the regional climate and tectonics, which masked the Neotethyan late Valanginian–Hauterivian second order sea level rises and the Aptian second order high sea level stand (Figure 7).
5.2.2.2 Lowstand system tracts (LST): Samples 14–15 (depths 2,700–2,680 m).
The current LST corresponds to a dolostone unit and clastics of uppermost Alamein and the entire Dahab formations. Sediments of this LST were deposited during a continued regressive phase in proximal deltaic settings under persistent oxic conditions. This sedimentary section shows a coarsening upward trend, which is exemplified by the general upward increase in the Cont/Mar ratio to 0.99 and decrease in the abundance of MFTLs to 0.5%. In a similar manner, the AOM (from 66% to 58%) and Op/Tr (from 1.9 to 0.8) ratios also show an upward decrease, respectively. It is bounded at its base by BSFR and at its tope by another unconformity surface, situated just above the level where Sample 15 was located (Figure 7). The topmost part of the current section is characterized by the maximum Cont/Mar ratio (0.99), minimum marine phytoplankton (0.5%), MFTLs (0.5%), and AOM (58%) abundances (Figure 7; Supplementary Table S4) denoting the occurrence of a MRS.
Samples of the LST show an organofacies Type C, which is characterized by the dominance of terrestrial organic matter (mostly spores and translucent phytoclasts) and low marine phytoplankton, and indicates oxic conditions (Figures 6, 7; Table 1). The upward decrease in the organofacies quality from BC to C along with the corresponding change from reducing to oxic conditions and GR data indicating a coarsening upward grain size trend, point to regressive conditions during deposition of this sequence (Figure 7).
Deposition of a dolostone unit that ends up with a coarse clastic unit showing shallowing up conditions and truncation at its uppermost part indicates the continued impact of the regional uplift and warm semi-arid climate on sedimentation of the current LST. This regressive event outpaced the Neotethyan Aptian second order high sea level stand (Figure 7).
5.2.3 SQ 3: the Kharita Formation (Samples 16–24)
This is the only complete sequence, which contains HST, LST, and TST. It covers the Lower Cretaceous (Albian) Kharita Formation. The sediments of SQ 3 display the nature of cyclic deposition of deltaic systems and represent a second cycle of deposition showing a CUS typically characteristic for prograding deltas. It is composed of a clastic unit made of frequent alternations of shale and sandstone, and has a total thickness of 500 m. It is bounded at its base by an unconformity surface and ends up at that last sample of the formation at a shale unit at Sample 24. Deposits of SQ 3 were accumulated under oxic to highly oxic conditions.
5.2.3.1 Highstand system tracts (HST): Samples 16–20 (depths 2,670–2,380 m).
In a similar fashion to the older HST of SQ 2, the current HST of SQ 3 exhibits a CUS, which is reflected by the upward increase in the Cont/Mar ratio (from 0.39 to 1.0) and decrease in abundance of the marine phytoplankton (from 1.0% to 0.0%) and MFTLs (from 1.5% to 0.0%). This CUS is also demonstrated by the upward decrease in the AOM (from 59% to 51%) that is accompanied by an increase in the opaque (from 10% to 19%) and total phytoclasts (from 30% to 36%) abundance (Figure 7; Supplementary Table S4). The lower boundary of this HST lies just above the unconformity surface at a shale unit at Sample 16 (Figure 7). The upper boundary is demarcated by the BSFR at Sample 22, which corresponds to the temporal point separating the Albian third order relative sea level rise from the subsequent latest Albian third order relative sea level fall. The inception of the relative sea level fall at the BSFR is reflected by the maximum Cont/Mar ratio (1.0), minimum AOM (51%), absence of marine phytoplankton and MFTLs, and maximum translucent (17%) and total phytoclasts (36%) abundances (Figure 7; Supplementary Table S4).
Samples of the HST exhibit an organofacies Type C, which indicates oxic conditions (Figures 6, 7; Table 1). This is no significance change in the organofacies composition to divide this HST into eHST and lHST. The GR profile also signifies this CUS.
Deposition of a major clastic unit of HST during a regressive phase indicates the prominent combined impact of the Albian regional block faulting and uplifting associated with the basin rifting in the north Western Desert (e.g., Guiraud et al., 1998; Moustafa, 2020) and the prevalence of warm humid conditions (Deaf et al., 2020a; Figure 7). This regressive event surpassed the Neotethyan Albian second order sea level rise (Figure 7).
5.2.3.2 Lowstand system tracts (LST): just above Samples 20–22 (depths 2279.9–2,290 m).
Deposits of this LST were accumulated during a continued regressive phase in proximal deltaic settings under persistent oxic conditions. This LST shows obvious CUS, which is exemplified by the upward increase in the Cont/Mar ratio (from 0.99 to 1.0) and total phytoclasts (from 36% to 39%). This CUS is also demonstrated by the decrease in the abundances of the marine phytoplankton (from 0% to 0.5%), MFTLs (from 1.0% to 0.0%), AOM (from 50% to 49%), and Op/Tr ratio (from 2 to 1.3) (Figure 7; Supplementary Table S4). In a similar manner, the GR values indicate the development of CUS. The current LST is bounded at its base by BSFR and at its top by the maximum Cont/Mar ratio (0.99), and total phytoclasts (39%), and conversely minimum Op/Tr ratio (1.3), AOM (50%), marine phytoplankton (0.5%), and MFTLs (0.0%).
Samples of the LST show an organofacies Type C, which is characterized by dominance of terrestrial organic matter (mostly spores and translucent phytoclasts) and low marine phytoplankton and indicates oxic conditions (Figures 6, 7; Table 1).
The continued clastic-dominated sedimentation of LST during a regressive phase indicates the continued impact of the Albian regional uplifting, which overprinted the Neotethyan Albian second order sea level rise and the continued prevalence of the regional warm humid conditions (Figure 7).
5.2.3.3 Transgressive system tracts (TST): juts above Samples 22–24 (depths 2289.9–2,170 m).
The deposits of this TST show minor fining and deepening upward conditions, which are reflected petrographically by the upward decrease in the Con/Mar ratio (from 0.49 to 0.28), and relative increase in the marine phytoplankton (from 1.0% to 1.5%), MFTLs (from 0.5% to 2.5%), and AOM (from 50% to 53%). This fining upward trend in grain size is also reflected by the GR profile and change in deposition from shale to limestone. The lower boundary of the present TST is located at a basal shale at Sample 22 showing the maximum Cont/Mar ratio (0.99), while its tope boundary is located at the last sample of the Kharita Formation at Sample 24 (Figure 7; Supplementary Table S4).
Combined organic geochemical and petrographic data indicates an organofacies CD, which denotes highly oxic conditions for the depositional setting of the current TST (Figures 6, 7; Table 1).
Correlation of the regional minor second order seal level rise with that of the Neotethys indicates that the sedimentation of the clastic deposits of the TST was relatively controlled by the Neotethyan late Albian sea level rise and the prevailing humid climate (Figure 7).
5.3 Hydrocarbon potential: integrated organic geochemical and petrographic approach
The hydrocarbon potential of source rock units has traditionally been based on organic geochemical analysis of bulk rock samples, where identification of kerogen type and quality is based on the plot of Hydrogen index (HI) and Oxygen index (OI) data on a modified Van Krevelen (1961) diagram. The maturation of the identified kerogen types is also determined by the pyrolysis estimated Tmax (°C) temperatures. Organic petrography is widely used nowadays to identify and calibrate the geochemically identified kerogen types. It has proved to be successful in recognizing the main kerogen type, unlike the geochemical analysis, which sometimes fails to recognize prevailing kerogen type because of mixing of kerogen types (Dembicki, 2009; Deaf et al., 2020a; Deaf et al., 2021). This mixing is usually associated with marginal marine (e.g., deltaic) and inner shelf environments, where mixing of allochthonous terrestrial organic matter (mostly kerogen Type III) with autochthonous marine organic matter (kerogen Type II) is a common process (e.g., Deaf et al., 2020b, 2021, 2022; Deaf, 2021). Moreover, the organic petrographic maturity indices such as vitrinite reflectance and spore coloration (e.g., thermal alteration index, TAI) provide reliable interpretation of maturation levels and overcome some limitations of the Tmax temperature. The later index is sometimes affected adversely by several factors, for example, poor organic carbon content, kerogen type, mineral matrix dilution, contamination by drilling mud additives, migration of hydrocarbons, saturation of the flame ionization detector (FID). Therefore, these petrographic maturity proxies must calibrate and support Tmax (°C) temperatures derived from pyrolysis.
5.3.1 Organic richness and remaining generative potential
The organic richness in terms of the total organic carbon (TOC wt%) content of the studied succession ranges from mostly fair (21 samples) to less commonly good (3 samples) and excellent (1 sample) (Figure 8A) according to the Peters’s (2018) new cut-offs of source rock potential (Supplementary Table S5).
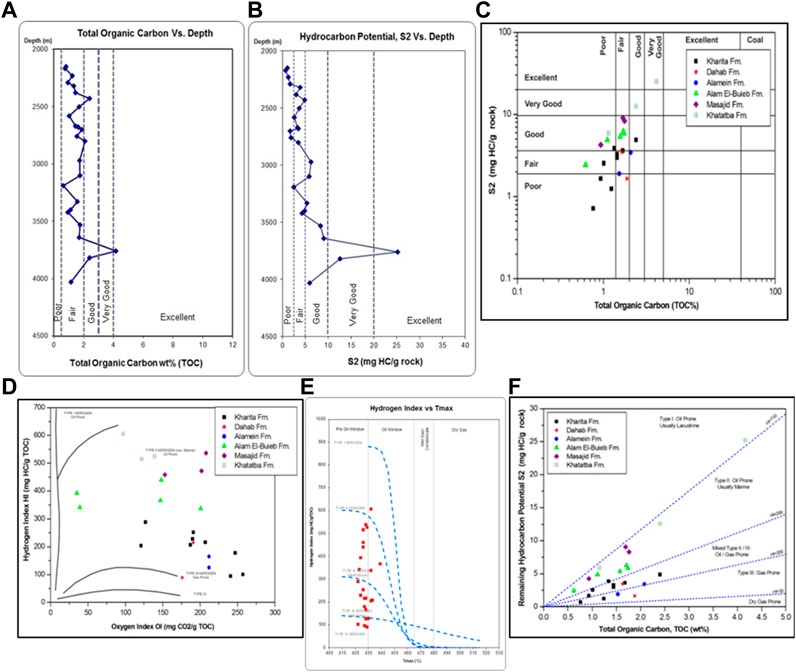
FIGURE 8. (A) Organic richness. (B,C) Remaining hydrocarbon generative potential. (D) Plot of HI versus OI. (E) Plot of Tmax °C versus HI. (F) Plot of S2 versus TOC data and kerogen types in the studied Middle Jurassic–Lower Cretaceous successions in the OBA D-17 well.
It is worth to mention that the TOC proxy does not indicate the source rock potential precisely, because TOC analysis may embrace non-generative organic carbon (i.e., kerogen Type VI). Consequently, the S2 (milligram of HC per gram of rock) data must supplement the TOC data, where the former measures the actual generative potential of a source rock. The S2 proxy is thus a better and more accurate measure of the source rock quality (e.g., Dembicki, 2009; Deaf and Tahoun, 2018; Peters, 2018; Deaf et al., 2021, 2022). The S2 values indicate that the Middle Jurassic upper Khatatba Formation (i.e., lower SQ 1, TST; Figure 7) shows good to excellent (at average very good) source rock potential (5.92–25.23, avg. 14.6 mg HC/g rock) (Figures 8B, C). The Upper Jurassic Masajid Formation (i.e., upper SQ 1, TST; Figure 7) shows fair to good and average good source rock potential (4.27–9.08, avg. 7.22 mg HC/g rock). The Lower Cretaceous Alam El Bueib Formation (i.e., lower SQ 2, eHST–lower lHST; Figure 7) shows poor to good and average fair source rock potential (2.43–6.26, avg. 4.96 mg HC/g rock). The Alamein and Dahab formations (i.e., upper SQ 2, uppermost lHST and LST; Figure 7) has poor to fair and average fair source rock potential (1.67–3.5, avg. 2.62 mg HC/g rock). The Kharita Formation (i.e., SQ 3, HST-LST-TST; Figure 7) shows poor to fair and average fair source rock potential (0.72–4.9, avg. 2.76 mg HC/g rock).
5.3.2 Kerogen characterization
The plots of HI versus OI and Tmax °C versus HI indicate an oil-prone, kerogen Type II for the Khatatba and Masajid formations (Figures 8D, E). The high HI values (459–606, avg. 519.2 mg HC/g TOC) and dominance of the AOM also signifies an oil-prone source rock unit dominated by organofacies B (Jones, 1987), which is characterized by dominance of liptinitic material (mainly AOM). The opaque phytoclasts in the Khatatba and Masajid formations are numerous but volumetrically insignificant to alter the kerogen type, because they occur as equant-shaped, small fragments (Tyson, 1995; Deaf and Tahoun, 2018). The kerogen quality (S2/TOC) diagram (Figure 8F) also postulate an oil-prone source rock unit dominated by a kerogen Type II. However, the HI profile shows a slight upward decrease in the kerogen quality, which is related to the development of relatively less reducing conditions due to uplift and erosion as is reflected by the sedimentation of coarse clastics at the top of the Masajid Formation (Tyson, 1995; Deaf, 2021; Deaf et al., 2021).
Petrographically, plot of the POM data in the LVI (Figure 5C) also indicates that the two formations (SQ 1, TST; Figure 7) contain oil-prone liptinitic material (Tyson, 1995). The RWL and UVL petrographic analyses of particulate organic matter of the Khatatba and Masajid formations indicate dominance of the liptinitic maceral group (kerogen Type II), which is mainly composed of bituminite (AOM). The liptinitic materials of the Khatatba Formation shows no visible fluorescence colors, and this is related here to their high thermal maturation levels (0.81–1.1, avg. 0.98 Rv %), which is known to vanish the fluorescence nature of sporinite and bituminite (Tyson, 1995). The bituminite maceral of the liptinitic maceral group of the Masajid Formation shows weak to moderate fluorescence colors. The marine unicellular telalginite (marine phytoplanktons), sporinite, and fewer freshwater telalginite, which represent important parts of the liptinitic maceral group show golden-yellow to dull-yellow fluorescence colors (Figures 9A–D). The vitrinitic maceral group (kerogen Type III) represents a subordinate component of POM in the two formations.
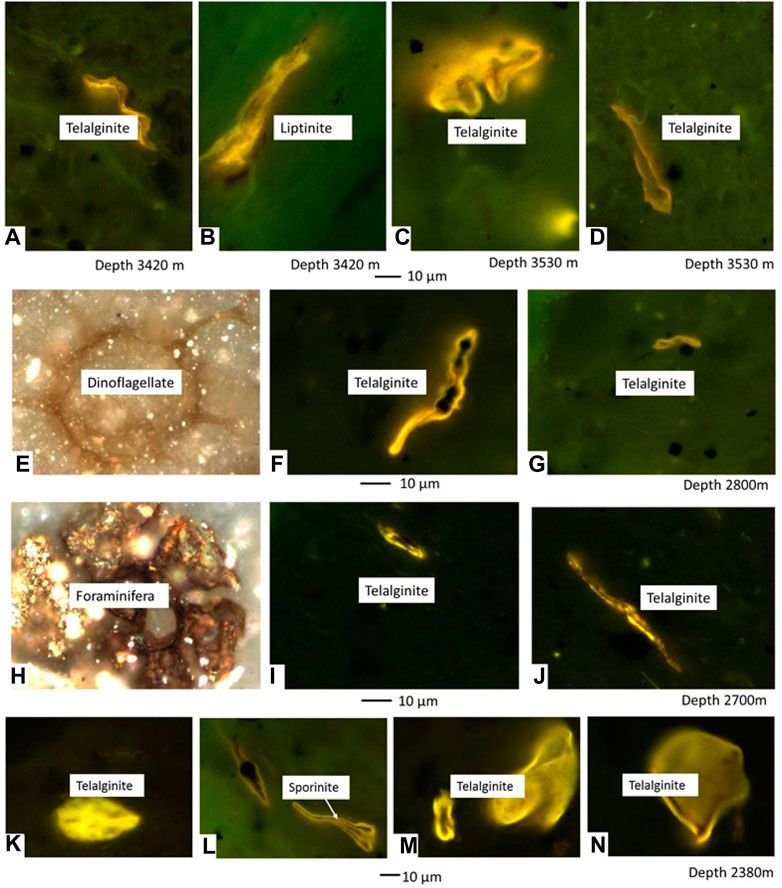
FIGURE 9. Photomicrographs of organic matter from the OBA D-17 well taken under reflected white light (RWL) and UV light (UVL). Excitation is at 465 nm; combined dichroic mirror and barrier filter have a cut at 515 nm. (A,C,D) telalginite particles from the Masajid Formation showing golden-yellow to dull-yellow fluorescence colours; (B) A liptinite particle from the Masajid Formation of probable algal origin showing a golden-yellow fluorescence colour; (E) Dinoflagellate/telalginite under RWL filled with framboidal pyrite and (F,G) Telalginite particles under UVL from the Alamein Formation showing dull orange-yellow with weak-dull bituminite (AOM) fluorescence colours; (H) Chitinous microforaminiferal test lining (MFTL) under RWL filled with framboidal pyrite; (I,J) Telalginite particles under UVL from the Dahab Formation showing a dull orange-yellow fluorescence colour; (K,M,N) Telalginite particles; (L) A Sporinite particle from the Kharita Formation under UVL showing bright yellow fluorescence colours with weak-dull bituminite (AOM) colour.
The HI-OI and Tmax °C-HI diagrams indicate lower kerogen Types II–III for the Alam El Bueib Formation (lower SQ 2, eHST–lower lHST; Figure 7), and Types III–II for the Alamein and Dahab formations (i.e., upper SQ 2, uppermost lHST and LST; Figure 7). These kerogen types are characterized by moderate to low HI values (337–440, avg. 375.2 mg HC/g TOC) and (89–215, avg. 148.5 mg HC/g TOC), respectively. This organic geochemical data along with the dominance of AOM and vitrinite suggest an oil/gas-prone, organofacies BC for Alam El Bueib Formation, and a gas/oil-prone, organofacies C for the Alamein and Dahab formations. These organofacies types are characterized by significant increases in the vitrinitic material at the expenses of liptinitic material. The three formations (SQ 2; Figure 7) show another upward decline in the kerogen quality, which is suggested here to be related to coarsening upward, regressive trend.
The LVI diagram confirms that Alam El Bueib Formation (lower SQ 2, eHST–lower lHST; Figure 7) contains oil/gas-prone, kerogen Types II–III, which is consistent with the geochemical analysis. However, the LVI diagram suggests a higher kerogen Type II than those (Types III–II) determined geochemically for the Alamein and Dahab formations (upper SQ 2, uppermost lHST and LST; Figure 7). This discrepancy between the organic geochemical and TWL petrographic analysis is resolved by the RWL and UVL petrographic analyses of POM. The Alamein and Dahab formations contain mainly liptinitic maceral group, which is represented by dominant bituminite (AOM) and relatively moderate frequencies of sporinite maceral: and less frequent telalginite and zooclast (MFTL) macerals (Figures 9E, H). These formations also contain higher occurrences of vitrinitic maceral group when compared with their counterpart in the underlying Khatatba and Masajid formations (SQ 1, TST; Figure 7). The liptinitic maceral group in the lowermost Alamein Formation shows stronger yellow–yellowish orange telalginite and weak to moderate bituminite fluorescence colors respectively (Figures 9F, G).
In comparison, the liptinitic maceral group in the Alamein and especially in the topmost Dahab formations (upper SQ 2, uppermost lHST and LST; Figure 7) shows weaker fluorescence colors, which are represented by dull orange yellow telalginite and weak–dull bituminite (AOM) macerals (Figures 9I, J). This weaker fluorescence indicate oxidation of the liptinitic organic matter and thus diminishing in the kerogen quality, i.e., lower HI values (Tribovillard and Gorin, 1991; Tyson, 1995; Deaf et al., 2021). This in turn confirms the lower kerogen Types II–III and III–II designated for the Alamein and Dahab formations, respectively. The lowest kerogen Types III–IV designated for the topmost part of the Dahab Formation (upper SQ 2, LST; Figure 7) is related to the progressive shallowing upward. This resulted in the development of more oxic conditions that ended with uplift and erosion and/or non-deposition and oxidation of sedimentary organic matter (Tyson, 1995; Deaf, 2021).
The cross plots of the organic geochemical parameters indicate kerogen Types III–II (204–289, avg. 232.7 mg HC/g TOC) for the Kharita Formation (SQ 3, HST-LST-TST; Figure 7) that downgrade upward to Types III–IV (95–178, avg. 124.7 mg HC/g TOC) in its topmost part. Deposits of the Kharita Formation show persistent high AOM and subordinate phytoclasts frequencies, which indicate collectively with their HI values organofacies Types C to CD.
The TWL organic petrographic analysis and LVI diagram show that the Kharita Formation exhibit kerogen Types III–II to III–IV reflecting dominance of vitrinitic maceral group and lower occurrences of the liptinitic maceral group. However, the liptinitic maceral group (mainly AOM) dominates the POM. This probably suggests that this AOM was either derived from bacterial degradation of hydrogen-poor terrestrial organic matter or was derived from marine phytoplankton that was later subjected to oxidation. The fluorescence colors show an upward decrease from bright yellow telalginite, sporinite, and resinite and weak–dull bituminite (AOM) at the middle Kharita Formation to yellowish-green telalginite, lamalginite, and sporinite and dull bituminite (AOM) in the topmost Kharita Formation (Figures 9K–N) and in its overlying Sample 25 of the Bahariya Formation. This at least suggests that some AOM particles were of marine origin and subjected to oxidation, which is consistent with the general regressive conditions recorded in the Kharita Formation and development of more oxic conditions. However, dominance of the terrestrial organic matter (mainly sporinite and vitrinite) suggests that most of the AOM was of terrestrial origin, which is typically known to show low HI values (Tyson, 1995).
5.3.3 Organic thermal maturation
Checking the Tmax profile (423°C–439°C) against the vitrinite reflectance (0.58–1.01 RVo %) and thermal alteration index (TAI: 2+ to 3−) data of the studied successions of the OBA D-17 well indicates that Tmax data is evidently suppressed. Plotting the production index (PI) versus Tmax data (Figure 10) also shows low Tmax values probably due to samples being enriched in free hydrocarbons or contamination by drilling mud additives. The late mature (late oil to early gas-window) Middle–Upper Jurassic (SQ 1, TST; Figure 7) and mid mature (peak oil-window) Lower Cretaceous shale units (SQ 2, eHST; Figure 7) containing kerogen Type II and Types II–III respectively, suggest production of free oil and entrapment in the same impermeable shale units, where oil carry-over resulted in quenching the Tmax values (Carvajal-Ortiz and Gentzis, 2015; Tahoun et al., 2018).
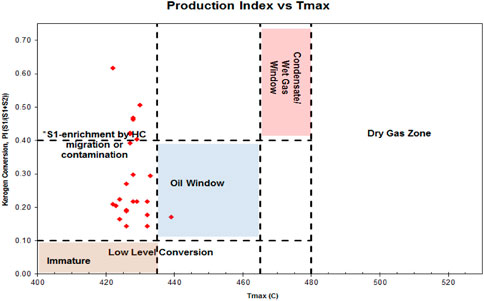
FIGURE 10. Kerogen conversion (PI, production index) and maturity (Tmax) plot of studied samples in the OBA D-17 showing effect of enrichment by free hydrocarbons and/or contamination by drilling mud additives on estimated Tmax values.
Furthermore, the RWL petrographic analysis shows the occurrence of few mud additives (Figure 11) of a significantly low reflectance value (0.13 versus 1.04% RVo in Sample 1), which could have a notable negative impact on measured Tmax values (Snowdon, 1995; Jarvie, 2012; Carvajal-Ortiz and Gentzis, 2015). The Tmax data is unreliable here and therefore the level of thermal maturation will be assessed by combined RVo and TAI data, which shows a consistent maturation trend against depth. Samples of the Khatatba and Masajid formations (SQ 1, TST; Figure 7) exhibit high vitrinite reflectance values (0.83–1.01 RVo %) signifying a late mature source rocks, which reached late oil to early wet gas-window stages.
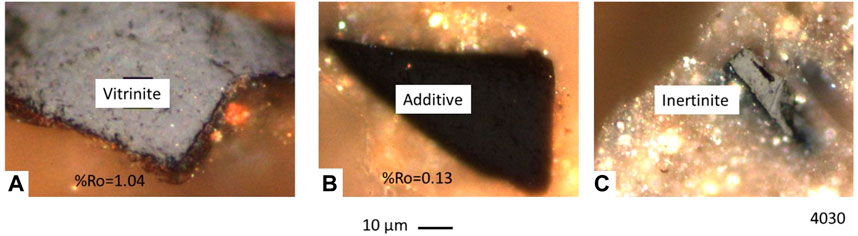
FIGURE 11. RWL photomicrographs showing the reflectance of a vitrinite particle (A), a mud additive gilsonite asphaltic bitumen particle (B), and an inertinite particle (C) in Sample 1 (depth 4,030 m).
Samples of the Alam El Bueib, Alamein, and Dahab formations (SQ 2, HST and LST; Figure 7) show moderate vitrinite reflectance values (0.68–0.77 RVo%) and a TAI value of 3− indicating mid mature source rocks, which reached the peak oil-window stage (Pearson, 1990; Peters and Cassa, 1994; Hartkopf-Fröder et al., 2015; Hackly and Cardott, 2016). It is worth mentioning that the notable gap in the RVo data between the topmost part of Masajid (0.83 RVo%) and lowermost Alam El Bueib (0.75 RVo%) formations suggests and reinforces the erosion detected by Bapetco (2000), where a considerable amount of strata has been removed (Marshall, 1988). Vitrinite reflectance data is known to show an exponential trend with depth for rock successions that show continuous deposition, while it shows a break in the data continuum commonly referred to as the “dog-leg curve” at the hiatus and/or the erosion surfaces (Marshall, 1988; Hunt and Tucker, 1992; Hunt, 1996; Ibrahim, 1996; Ibrahim, 2002a; Dembicki, 2016; Tahoun et al., 2018). Samples of the Kharita Formation (SQ 3, HST-LST-TST; Figure 7) display relatively moderate vitrinite reflectance values (0.57–0.65 RVo%) and a TAI value of 2+ indicating early mature source rock, which reached the early oil-window stage. Similarly, the gap between the topmost Dahab and lowermost Kharita formations indicates the occurrence of another unconformity surface due to erosion of some sediments overburden.
5.3.4 Source rock assessment
In SQ 1, the Khatatba and Masajid formations show average good (2.23 TOC wt%) source rock, average good to very good remaining generative potential, high kerogen quality (Type II), and late maturation status (late oil-to early wet gas-window). All these data suggest the aforementioned formations as mostly good to very good oil-producing source rocks in the OBA D-17 well (Figure 12).
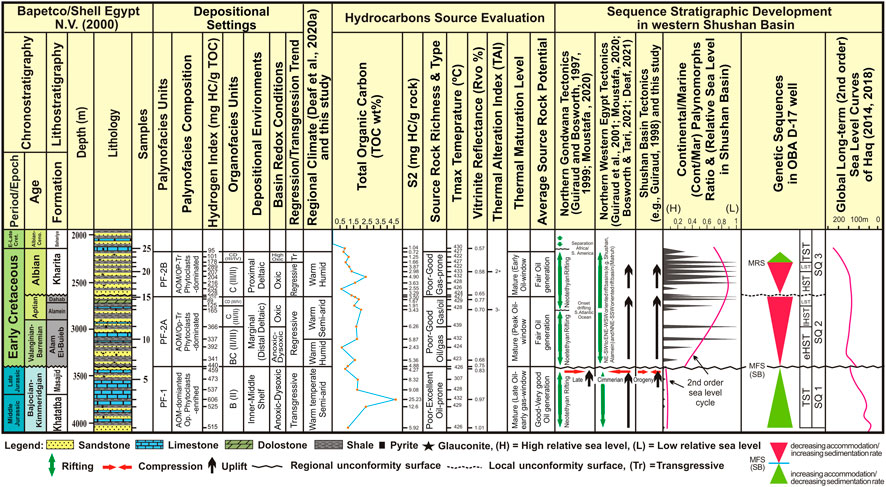
FIGURE 12. Summarizing figure showing the identified depositional settings, sequence stratigraphic (SQ) units, organic facies/kerogen types, and hydrocarbon source rock potential of the studied Middle–Upper Jurassic and Lower Cretaceous formations in the OBA D-17 well, northwestern Desert, Egypt.
In SQ 2, the Alam El Bueib Formation (lower SQ 2, eHST and lower lHST; Figure 12) shows average fair source rock (1.35 TOC wt%), average poor to good remaining generative potential, moderate kerogen quality (Types II–III), and peak oil-window maturation. This suggests this formation as a fairly good oil-producing source rock in the studied well. There is no gas generation from the Alam El Bueib Formation because the gas-prone organic matter did not reach the postmature stage to produce gas. The organic matter of the Alamein and Dahab formations (upper SQ 2, uppermost lHST and LST) shows average fair source rock (1.78 TOC wt%), fair to poor remaining generative potential, and low quality kerogen (Types III–II and Types III–IV), which also reached the middle maturation status (peak oil-window). Accordingly, the Alamein Formation exhibits only fair oil potential, while the Dahab Formation has no hydrocarbon generation potential because its reactive gas-prone material is not mature (Figure 12).
In SQ 3, the Kharita Formation shows exceptional good organic richness (2.40 TOC wt%) in Sample 19 due to occurrence of coaly/carbonaceous material, which shows a relatively lower kerogen quality. Generally, the lower and middle Kharita Formation (SQ 3, HST and LST; Figure 12) show average fair (1.49 TOC wt%) source rock, average fair remaining generative potential, low kerogen quality (Types III–II), and early maturation status (early oil-window). This data suggests that the lower Kharita Formation only has fair oil source rock potential. The topmost Kharita Formation shows no gas generation potential because the gas-prone organic matter is not mature.
5.3.5 Discussion on sequence stratigraphic development and source rock deposition in western Shushan Basin
Deposits of the Middle–Late Jurassic Khatatba and Masajid formations are stacked in a TST pattern in inner-middle shelf settings under anoxic-dysoxic conditions, where the late TST represented by the topmost Khatatba Formation shows the highest oil-prone source rock potential (avg. 2.23 TOC wt%). This is related to the Neotethyan Middle–Late Jurassic second order sea level rise, which inundated the Shushan Basin. This marine transgression probably brought nutrients-rich oxygen minimum zone (OMZ) at the Shushan Basin, which in turn promoted surface high primary productivity and subsurface organic matter preservation (Tyson, 1995; Arthur and Sageman, 2004; Deaf, 2021). This explains the fact that source rocks in TST deposits commonly tend to accumulate at or around the time of MFS during transgression periods because of prevalence of reducing conditions (Creaney and Passey, 1993; Tyson, 1996; Arthur and Sageman, 2004; Deaf and Tahoun, 2018; Deaf, 2021). Moreover, the Middle–Late Jurassic rifting is also expected to increase the accommodation space and thus help develop deep OMZ at the area of the Shushan Basin (Arthur and Sageman, 2004; de Sousa et al., 2021; Deaf, 2021). In addition, the warm temperate and semi-arid climatic conditions resulted in carbonate-dominated sedimentation and low clastic input. This in turn resulted in low organic matter dilution by clastic sediments and deposition of organic-rich sediments (Creaney and Passey, 1993; Tyson, 1996; Arthur and Sageman, 2004; de Sousa et al., 2021; Deaf, 2021). Regionally, in the neighbouring Matruh rift basin, source rock (avg. 2.30 TOC wt%) was recoded from the TST of Sequence 2 in the Nest-1 well that was deposited in outer middle shelf setting under reducing (suboxic–anoxic) conditions (Deaf and Tahoun, 2018). Source rock (avg. 2.30 and 2.37 wt%) was also recorded from Sequence 1 of the Alam El Bueib and lower Alamein formations in the Abu Tunis-1X well that was deposited in inner middle shelf setting under suboxic–anoxic conditions (Deaf, 2021). Similarly, source rock (avg. 6.06 TOC wt%) was detected from the upper Khatatba Formation in the OBA 2-2A well in Matruh Basin that was deposited in inner shelf setting under dysoxic–anoxic conditions (Deaf et al., 2022). Worldwide, numerous rift basins are similarly documented to show source rocks from TST deposited during transgressive episodes in relatively deep marine settings under reducing conditions. For example, the TSTs of the Middle and Upper Napo Formation (avg. ∼11 TOC wt%) in the Sub-Andean Zone, Ecuador that were deposited in shallow marine setting under dysoxic–anoxic conditions (Vallejo et al., 2002). In a similar fashion, the TST of Sequence MS6 in the Ceará Basin in Brazil was deposited in deep marine slope setting under reducing conditions and was found to contain source rock showing an average richness of about 2.1 TOC wt% (de Sousa et al., 2021).
In SQ 2, deposits of the Alam El Bueib Formation (lower SQ 2, eHST and lower lHST; Figure 12) and the Alamein and Dahab formations (upper SQ 2, uppermost lHST and LST) reflect progressive shallowing and overall regressive sedimentation representing the HST and LST. Deposition of the regressive HST and LST are associated here with the tectonically induced sea level falls, which overprinted the Neotethyan late Valanginian–Hauterivian second order sea level rises and the Aptian second order high sea level stand. These regressive deposits accumulated in marginal marine (deltaic) settings under deteriorating reducing (anoxic–dysoxic to oxic) conditions. These regressive conditions were probably connected to the Hauterivian–Barremian and Aptian uplift events interpreted herein (Section 5.2.2) and latest Aptian non-sedimentation and erosion (Figure 12). Deposition of these regressive HST and LST is also connected to the climatic shift toward warm humid conditions, which resulted in higher influxes of the terrestrial organic matter associated with the clastic-dominated sedimentation. These sedimentation conditions are characterized by high sedimentation rates and water circulation (Creaney and Passey, 1993; Tyson, 1996; Arthur and Sageman, 2004; Deaf et al., 2020b; de Sousa et al., 2021; Deaf, 2021). This resulted in oxidation of the organic matter and increased organic matter dilution by clastic sediments, which caused diminishing in the organic richness (avg. fair 1.35 TOC wt%) and kerogen quality (Types II–III) of the Alam El Bueib Formation. Similarly, the organic richness (avg. fair 1.78 TOC wt%) and kerogen quality (Types III–II and Types III–IV) of the Alamein and Dahab formations show the upward decreasing trend in source rock potential (Figure 7). An interpretation that is typically consistent with several studies made Worldwide on regressive stratigraphic sequences. During deposition of the HST and LST, strong water circulation, increased sedimentation rates (i.e., dilution effect), and oxidation typically decreased the richness and quality of organic matter (Creaney and Passey, 1993; Tyson, 1996, 2001; Arthur and Sageman, 2004; Deaf and Tahoun, 2018; Deaf et al., 2020b; Deaf et al., 2022). Regional and Worldwide examples include poor–relatively fair source rock (avg. 1.02 TOC wt%) that was deposited in shallow marine settings under anoxic–dysoxic to oxic conditions, which was recorded from HSTs of the upper Khatatba Formation in the OBA 2-2A well in the Matruh Basin in Egypt (Deaf et al., 2022). This also applies to the HST (avg. ∼1.3 TOC wt%) and LST (avg. ∼0.8 TOC wt%) of the Napo Basal Formation in Sub-Andean Zone in Ecuador (Vallejo et al., 2002), and the Sequences MS1–MS4 (avg. ∼1.2 TOC wt%) in Ceará Basin in Brazil (de Souza et al., 2021).
In SQ 3, deposits of the lower and middle Kharita Formation (SQ 3, HST and LST; Figure 12) reflect a recurring upward shallowing and regressive sedimentation, which accumulated in marginal marine (deltaic) settings under oxic conditions. These regressive conditions are suggested in this study (Section 5.2.3) to be connected to the continuous local Albian uplift (Figure 12). The continued clastic-dominated sedimentation associated with the warm humid conditions along with the developed unfavourable regressive oxic conditions resulted in notable decreases in the organic richness (avg. fair 1.49 TOC wt%) and kerogen quality (Types III–II) of the lower and middle Kharita Formation (Figure 12). The topmost Kharita Formation (SQ 3; Figure 12) exhibits a commencing deposition assigned to the TST, which is well-known worldwide to contain low organic matter content (avg. 0.98 TOC wt%) of low quality (III–IV), where water circulation and oxidation of organic matter are still prevailing conditions (Tyson, 1996; Pittet and Gorin, 1997; Bombardiere and Gorin, 1998; Deaf and Tahoun, 2018). Organic-lean TST deposited in oxic marine settings of rift basins were documented regionally and worldwide from the Sequence 2 of the Dahab Formation (avg. 0.65 TOC wt%) in the Matruh Basin in Egypt (Deaf, 2021). Similarly, the A Member of the Ain Grab Formation in Central Tunisia (Blondel et al., 1993) contains organic-poor deposits (avg. 0.65 TOC wt%). The Sequence CS1 in the Vocontian Basin in SE France (Bombardiere and Gorin, 1998) and that in the Napo Basal Formation in Sub-Anean Zone in Ecuador (Vallejo et al., 2002), also contain similar organic-lean deposits (avg. ∼1.80 TOC wt%). The Sequences MS1–MS4 in Ceará Basin in Brazil were also found to contain less organic-rich deposits showing average 1.5 TOC wt% (de Souza et al., 2021).
6 Conclusion
Integrated transmitted white light (TWL) organic petrographic (palynofacies) and organic geochemical (organofacies) analyses enabled the identification of the depositional environments, redox conditions, and transgression–regression stacking trend of the Middle–Upper Jurassic (Khatatba and Masajid formations) and Lower Cretaceous (Alam El Bueib, Alamein, and Dahab formations) successions. This extended to identify the regional paleoclimate conditions responsible for clastic-dominated and carbonate-dominated deposition of the studied rock units. Furthermore, the integrated TWL organic petrographic, organic geochemical, and well log data gamma ray (GR) analyses enabled a reconstruction of three third order genetic stratigraphic sequences (SQ 1–3) to study and understand vertical stratal distribution of organic matter pertaining to their hydrocarbon source rock potential. Moreover, the organic geochemical analysis was supplemented with TWL and reflected white light and ultraviolet light (RWL/UVL) organic petrographic analyses to identify kerogen type and maturation and to resolve the problem of suppressed Tmax data across the studied succession of OBA D-17 well. The combined interpretations gleaned from the various analyses mentioned above enabled drawing a conclusion regarding the hydrocarbon source rock potential of the Middle–Upper Jurassic and Lower Cretaceous syn-rift successions in the western Shushan Basin as shown below.
Deposition of the good source rocks in the western Shushan Basin resulted from the interplay between Neotethyan sea level changes, regional tectonic, and climate. Deposition of the clastic–carbonate succession of the Khatatba and Masajid formations (SQ 1, TST; Figure 12) during a marine transgression episode in a transgressive systems tract (TST) pattern in inner–middle shelf settings under prevailing reducing (anoxic–dysoxic) conditions resulted in poor to excellent preservation of organic matter. The organic-rich deposits of the Khatatba and Masajid formations have the highest hydrocarbon generative potential in the OBA D-17 well. They show average good to very good remaining generative potential of late mature (late oil-to early wet gas-window) high oil-prone organic matter, which classifies these formations as good to very good oil-producing source rocks in the western Shushan Basin. The late TST deposits represented by the topmost Khatatba Formation (middle SQ 1, TST; Figure 12) show the highest source rock potential.
Deposition of the clastics of the Alam El Bueib, Alamein, and Dahab formations (SQ 2; Figure 12) during a marine regression episode in regressive highstand system tracts (HST) and lowstand system tracts (LST) patterns in marginal marine (deltaic) settings under reducing (anoxic–dysoxic) to oxic conditions resulted in poor to good preservation of organic matter. The Alam El Bueib Formation (lower SQ 2, eHST–basal lHST; Figure 12) shows poor to good hydrocarbon generative potential of mid mature (peak oil-window) oil/gas-prone organic matter, which labels this formation as having fair oil source rock potential with no gas generation. The more regressive deposits of the Alamein and Dahab formations (upper SQ 2, topmost lHST–LST) exhibit lower hydrocarbon potential because of upward decline in richness (from marginally good–fair to fair–poor) and kerogen type (from Types III–II to Types III–IV), respectively. The mid mature oil/gas-prone organic matter of the Alamein Formation has fair oil source rock potential, whereas the Dahab Formation displays no hydrocarbon potential because it contains immature gas-prone organic matter.
Deposition of the Kharita Formation (SQ 3; Figure 12) clastics during a recurring marine regression episode in mostly regressive HST and LST patterns in marginal marine (deltaic) settings under oxic to highly oxic conditions resulted in poor to good preservation of organic matter. Deposits of the lower Kharita Formation (basal SQ 3, basal eHST; Figure 12) also show fair oil source rock potential of early mature (early oil-window) gas/oil-prone organic matter. The upper Kharita Formation (middle–upper SQ 3, LST and TST; Figure 12) contains gas-prone organic matter of no gas generation potential.
Data availability statement
The original contributions presented in the study are included in the article/Supplementary Material, further inquiries can be directed to the corresponding author.
Author contributions
MA helped with laboratory work, data interpretation, and reviewed the final draft of M/S. AD wrote most of the sections of the M/S, helped in drafting of illustrations, and finished the final draft. TG and HC-O carried out vitrinite and Rock-Eval analyses and reviewed the final draft of M/S. RB and RA-Z helped drafting earlier versions of M/S. MK performed most of the laboratory work, drafting of illustrations, data interpretation, and wrote the first draft of the M/S. All authors contributed to manuscript revision, read, and approved the submitted version.
Funding
The Deanship of Scientific Research (DSR) at King Abdulaziz University (KAU), Jeddah, Saudi Arabia has funded this Project under Grant No. G: 703-150-1443.
Acknowledgments
Authors are grateful for the Egyptian General Petroleum Corporation (EGPC) and Badr Petroleum Company (BAPETCO) for permission to obtain rock samples and well logging data of OBA D-17 well. Authors are indebted to Assiut and Sohag Universities for partial funding towards samples processing.
Conflict of interest
Authors TG and HC-O were employed by Core Laboratories.
The remaining authors declare that the research was conducted in the absence of any commercial or financial relationships that could be construed as a potential conflict of interest.
Publisher’s note
All claims expressed in this article are solely those of the authors and do not necessarily represent those of their affiliated organizations, or those of the publisher, the editors and the reviewers. Any product that may be evaluated in this article, or claim that may be made by its manufacturer, is not guaranteed or endorsed by the publisher.
Supplementary material
The Supplementary Material for this article can be found online at: https://www.frontiersin.org/articles/10.3389/feart.2023.1129379/full#supplementary-material
References
Abbink, O. A., Van Konijnenburg-van Cittert, J. H. A., and Visscher, H. (2004). A sporomorph ecogroup model for the northwest European jurassic - lower cretaceousi: Concepts and framework. Neth. J. Geosci. Geol. Mijnb. 83, 17–31. doi:10.1017/s0016774600020436
Abdel Halim, M., and Moussad, M. (1992). Western Desert oil and gas fields (a comprehensive overview). Proceed. 11th Petrol. Explor. Prod. Conf. (E.G.P.C. 92, 432.
Ahmed, M. A., and Hassan, M. M. A. (2019). Hydrocarbon generating-potential and maturity-related changes of the Khatatba Formation, Western desert, Egypt. Petrol. Res. 4, 148–163. doi:10.1016/j.ptlrs.2019.03.001
Aram, R. B., Roehl, N. L., and Feazel, C. T. (1988).Seismic stratigraphy and subsurface Geology of the north–central portion of the south umbarka concession, Western Desert. Egypt: Phillips Petrol. Co, 11.
Arthur, M. A., and Sageman, B. B. (2004). Sea-level control on source-rock development: Perspectives from the holocene black sea, the mid-cretaceous Western interior basin of north America, and the late devonian appalachian basin. The deposition of organic carbon-rich sediments: Models, mechanisms, and consequences. SEPM Soc. Sediment. Geol.) Spec. Publ. 82, 35–59.
Bapetco/Shell Egypt, N. V. (2000). Final report and composite well log of Obaiyed-D17 borehole. Egypt: Badr El-Din Petroleum Company.
Behar, F., Beaumont, Y., De, B., and Penteado, H. I. (2001). Rock-eval 6 Technology: Performances and developments. Rev. d’IFP Ener. Nouv. Inst. Français Pétrol (IFP) 56, 111–134. doi:10.2516/ogst:2001013
Blondel, T. J. A., Gorin, G. E., and Jan Du Chene, R. (1993). Sequence stratigraphy in costal environments: Sedimentology and palynofacies of the Miocene in central Tunisia. Spec. Publ. Int. Assoc. Sedimentol. 18, 161–179.
Bombardiere, L., and Gorin, G. E. (1998). Sedimentary organic matter in condensed sections from distal oxic environments: Examples from the mesozoic of SE France. Sedimentology 45, 771–788. doi:10.1046/j.1365-3091.1998.00177.x
Bosworth, W., Drummond, M., Abrams, M., and Thompson, M. (2015). “Jurassic rift initiation source rock in the Western Desert, Egypt – relevance to exploration in other continental rift systems,” in Petroleum systems in “rift” basins. Editors P. J. Post, J. L. Jr.Coleman, N. C. Rosen, D. E. Brown, T. Roberts-Ashby, P. Kahnet al. (Houston, CD-ROM, 615–650.
Bosworth, W., and Tari, G. (2021). Hydrocarbon accumulation in basins with multiple phases of extension and inversion: Examples from the Western desert (Egypt) and the Western black sea. Solid earth. 12, 59–77. doi:10.5194/se-12-59-2021
Brenner, G. J. (1996). “Evidence for the earliest stage of angiosperm pollen evolution: A paleoequarorial section from Israel,” in Flowering plant origin, evolution and phylogeny. Editors D. W. Taylor, and L. J. Hickey (New York: Chapman & Hall), 91–115.
Bumby, A. J., and Guiraud, R. (2005). The geodynamic setting of the Phanerozoic basins of Africa. J. Afr. Earth Sci. 43, 1–12. doi:10.1016/j.jafrearsci.2005.07.016
Carvajal-Ortiz, H., and Gentzis, T. (2015). Critical considerations when assessing hydrocarbon plays using Rock-Eval pyrolysis and organic petrology data: Data quality revisited. Int. J. Coal Geol. 152, 113–122. doi:10.1016/j.coal.2015.06.001
Catuneanu, O. (2020a). “Sequence stratigraphy,” in Regional Geology and tectonics: Principles of geologic analysis. Editor N. Scarselli, J. Adam, D Chiarella, D. G. Roberts, A. W. Ballyet al. (Elsevier), 1, 605–686.
Catuneanu, O. (2019). Model-independent sequence stratigraphy. Earth-Science Rev. Earth-Sci. Rev. 188, 312–388. doi:10.1016/j.earscirev.2018.09.017
Catuneanu, O. (2019). Scale in sequence stratigraphy. Mar. Petrol. Geol. 106, 128–159. doi:10.1016/j.marpetgeo.2019.04.026
Catuneanu, O. (2020b). Sequence stratigraphy in the context of the ‘modeling revolution. Mar. Petrol. Geol. 116, 104309. doi:10.1016/j.marpetgeo.2020.104309
Catuneanu, O., and Zecchin, M. (2013). High-resolution sequence stratigraphy of clastic shelves II: Controls on sequence development. Mar. Petrol. Geol. 39, 26–38. doi:10.1016/j.marpetgeo.2012.08.010
Cecil, C. B., and Dulong, F. T.SEPM (2003). “Precipitation models for sediment supply in warm climates,”. Climate controls on stratigraphy. Editors C. B. Cecil, N. T. Edgar, and S. Publ, 77, 21–28.
Cecil, C. B. (1990). Paleoclimate controls on stratigraphic repetition of chemical and siliciclastic rocks. Geology 18, 533–536. doi:10.1130/0091-7613(1990)018<0533:pcosro>2.3.co;2
Courtinat, B. (2000). Review of the dinoflagellate cyst Subtilisphaera? Inafecta (drugg, 1978) bujak and davies, 1983 and S.? Paeminosa (drugg, 1978) bujak and davies, 1983. J. Micropal. 19, 165–175. doi:10.1144/jm.19.2.165
Creaney, S., and Passey, Q. R. (1993). Recurring patterns of total organic carbon and source rock quality within a sequence stratigraphic framework. Bull. AAPG 77, 386–401.
Dahl, B., Bojesen‒Koefoed, J., Holm, A., Justwan, H., Rasmussen, E., and Thomsen, E. (2004). A new approach to interpreting Rock-Eval S2 and TOC data for kerogen quality assessment. Org. Geochem. 35, 1461–1477. doi:10.1016/j.orggeochem.2004.07.003
de Souza, A. C. B., do Nascimento, D. R., Filho, F. N., Batezelli, A., dos Santos, F. H., Oliveira, K. M. L., et al. (2021). Sequence stratigraphy and organic geochemistry: An integrated approach to understand the anoxic events and paleoenvironmental evolution of the Cear´a Basin, Brazilian Equatorial margin. Mar. Petrol. Geol. 129, 105074. doi:10.1016/j.marpetgeo.2021.105074
Deaf, A. S., El Soughier, M. I., Gentzis, T., and Makled, W. A. (2021). Hydrocarbon source rock potential of the lower eocene carbonates from the Abu darag sub-basin, gulf of suez, Egypt: Integrated organic geochemical and petrographic analyses. Mar. Petrol. Geol. 132, 105235. doi:10.1016/j.marpetgeo.2021.105235
Deaf, A. S., Harding, I. C., and Marshall, J. E. A. (2020a). Cretaceous (Hauterivian–Cenomanian) palaeoceanographic conditions in southeastern tethys (Matruh Basin, Egypt): Implications for the cretaceous climate of northeastern gondwana. Cretac. Res. 106, 104229. doi:10.1016/j.cretres.2019.104229
Deaf, A. S., Harding, I. C., and Marshall, J. E. A. (2016). Early Cretaceous palynostratigraphy of the Abu Tunis 1X borehole, northern Western Desert, Egypt, with emphasis on the possible palaeoclimatic effect upon the range of Dicheiropollis etruscus in North Africa. Palynology 40, 25–53. doi:10.1080/01916122.2014.993480
Deaf, A. S., Omran, A. A., Zain El-Arab, E. S., and Maky, A. F. (2022). Integrated organic geochemical/petrographic and well logging analyses to evaluate the hydrocarbon source rock potential of the Middle Jurassic upper Khatatba Formation in Matruh Basin, northwestern Egypt. Mar. Petrol. Geol. 140, 105622. doi:10.1016/j.marpetgeo.2022.105622
Deaf, A. S. (2009). Palynology, palynofacies and hydrocarbon potential of the Cretaceous rocks of northern Egypt (Published PhD thesis). Southampton: University of Southampton, 348. Available online at: https://www.eprints.soton.ac.uk/168943/.
Deaf, A. S. (2021). Sequence stratigraphy and distribution of organic-rich Lower Cretaceous mixed clastic-carbonate strata in Matruh Basin, northwestern Egypt: Constrains on the Tethyan sea level changes, palaeoclimate, and tectonics. Mar. Petrol. Geol. 129, 105105. doi:10.1016/j.marpetgeo.2021.105105
Deaf, A. S., Tahoun, S. S., Gentzis, T., Carvajal-Ortiz, H., Harding, I. C., Marshall, J. E. A., et al. (2020b). Organic geochemical, palynofacies, and petrographic analyses examining the hydrocarbon potential of the Kharita Formation (Albian) in the Matruh Basin, northwestern Egypt. Mar. Petrol. Geol. 112, 104087. doi:10.1016/j.marpetgeo.2019.104087
Deaf, A. S., and Tahoun, S. S. (2018). Integrated palynological, organic geochemical, and sequence stratigraphic analyses of the middle to upper cenomanian hydrocarbon reservoir/source Abu roash “G” member: A depositional model in northwestern Egypt. Mar. Petrol. Geol. 92, 372–402. doi:10.1016/j.marpetgeo.2017.11.005
Dembicki, H. (2016). Practical petroleum geochemistry for exploration and production. Amsterdam: Elsevier.
Dembicki, H. (2009). Three common source rock evaluation errors made by geologists during prospect or play appraisals. AAPG Bull. 93, 341–356. doi:10.1306/10230808076
Dooley, J. H. (2006). “Glauconite,” in Industrial minerals and rocks. Littleton: Soci mining metal. Explor). Editors J. E. Kogel, N. C. Trivedi, J. M. Barker, and S. T. Krukowski seventh ed, 495–506.
Dow, W. G., O'Connor, D. I., Staplin, F. L., Dow, W. G., Milner, C. W. O., Milner, C. W. D., et al. (1982). “Kerogen maturity and type by reflected light microscopy applied to petroleum exploration,” in How to assess maturation and paleotemperatures, 7, 133–157.SEPM Short Course)
Downie, C., Hussain, M. A., and Williams, G. L. (1971). Dinoflagellate cyst and acritarch associations in the Paleogene of southeast England. Geoscience Man 3, 29–35. doi:10.2307/3687275
Doyle, J. A., Jardiné, S., and Doerenkamp, A. (1982). Afropollis, a new genus of early angiosperm pollen, with notes on the Cretaceous palynostratigraphy and paleoenvironments of northern Gondwana. Bul. Cent. Recher. Explor. Prod. Aquit. 6, 39–117.
Doyle, J. A. (1999). “The rise of angiosperms as seen in the African Cretaceous pollen record,” in Third conference on african palynology, johannesburg 14–19 september, 1997 (Rotterdam: Balkema), 3–29.
Duringer, P., and Doubinger, J. (1985). La palynologie: Un outil de characterisation des facies marines et continentaux a la limite muschelkalk supérieur-lettenkohle boundary. Sci. Géol. Bull. Mém 38, 19–34.
Einsele, G. (1992). Sedimentary basins: Evolution, facies, and sediment budget. Berlin: Springer-Verlag.
El Dally, N. H., Youssef, M. S., Abdel Aal, M. H., Ismail, A., and Metwalli, F. I. (2022). 3D basin and petroleum systems modeling in Shushan Basin, Western Desert, Egypt. Earth Syst. Environ. doi:10.1007/s40808-022-01559-4
El Nady, M. M. (2015). Evaluation of the nature, origin and potentiality of the subsurface middle jurassic and lower cretaceous source rocks in melleiha G-1x well, north Western desert, Egypt. J. Petrol. 24, 317–323. doi:10.1016/j.ejpe.2015.07.012
El Nady, M. M., Ramadan, F. S., Eysa, E. A., and Said, N. M. (2016). The potentiality of hydrocarbon generation of the Jurassic source rocks in Salam-3x well, North Western Desert, Egypt. J. Petrol. 25, 97–105. doi:10.1016/j.ejpe.2015.03.007
Eni (2022). Eni announces new discoveries in the Western Desert of Egypt. https://www.eni.com/en-IT/media/press-release/2022/04/eni-announces-new-discoveries-western-desert-egypt.html (Accessed February 24, 2023).
Federova's, V. A. (1977). “The significance of the combined use of microphytoplankton, spores, and pollen for differentiation of multi-facies sediments,”. Questions of phytostratigraphy. Leningrad, trudy neftyanoi nauchno-issledovatelskii geologorazvedochnyi institute (VNIGRI) leingrad. Editors S. R. Samoilovich, and N. Timoshina, 398, 70–88.
Feldman, H. R., Franseen, E. K., Joeckel, R. M., and Heckel, P. H. (2005). Impact of Longer-Term Modest Climate Shifts on Architecture of High-Frequency Sequences (Cyclothems), Pennsylvanian of Midcontinent U.S.A. U.S.A. J. Sediment. Res. 75, 350–368. doi:10.2110/jsr.2005.028
Felesteen, A. (1998). Organic geochemical studies of some Early Cretaceous sediments, Abu Gharadig Basin, Western Desert, Egypt. J. Afr. Earth Sci. 27/1, 115–127. –l 27. doi:10.1016/s0899-5362(98)00050-5
Firth, J. V. (1993). Palynofacies and thermal maturation analysis of sediments from the Nankai Trough. Proc. Ocean. Drill. Proj. Sci. Results 131, 57–69.
Galloway, W. E. (1989). Genetic stratigraphic sequences in basin analysis, I. Architecture and Genesis of flooding-surface bounded depositional units. AAPG Bull. 73, 125–142.
Gentzis, T., Carvajal, H., Deaf, A., and Tahoun, S. S. (2018). Multi-proxy approach to screen the hydrocarbon potential of the Jurassic succession in the Matruh Basin, north Western Desert, Egypt. Int. J. Coal Geol. 190, 29–41. doi:10.1016/j.coal.2017.12.001
Gentzis, T., Carvajal-Ortiz, H., Tahoun, S. S., Deaf, A. S., and Ocubalidet, S. (2019). Organic facies and hydrocarbon potential of the early-middle Albian Kharita Formation in the Abu Gharadig Basin, Egypt, as demonstrated by palynology, organic petrology, and geochemistry. Int. J. Coal Geol. 209, 27–39. doi:10.1016/j.coal.2019.05.002
Guiraud, R., and Bosworth, W. (1997). Senonian basin inversion and rejuvenation of rifting in Africa and Arabia: synthesis and implications to plate-scale tectonics. Tectonophysics 282, 39–82. doi:10.1016/s0040-1951(97)00212-6
Guiraud, R., Issawi, B., and Bosworth, W. (2001). “Phanerozoic history of Egypt and surrounding areas,” in Peri-tethys memoir 6: Peri-tethyan rift/wrench basins and passive margins. Editors P. A. Ziegler, W. Cavazza, A. H. F. Robertson, S. Crasquin-Soleau, and Paris (Paris: Mem. Mus. Nat. Hist. Nat.), 469–509.
Guiraud, R., MacGregor, D. S., Moody, R. T. J., and Clark-Lowes, D. D. (1998)., 132. The Geological Society, London, Spec. Publ., 217–229.Mesozoic rifting and basin inversion along the northern African Tethyan margin: an overviewPetroleum Geol. North Afr.
Hackley, P. C., and Cardott, B. J. (2016). Application of organic petrography in North American shale petroleum systems: A review. Int. J. Coal Geol. 163, 8–51. doi:10.1016/j.coal.2016.06.010
Hampson, G. J. (2016). Towards a sequence stratigraphic solution set for autogenic processes and allogenic controls: Upper Cretaceous strata, Book Cliffs, Utah, USA. J. Geol. Soc. 173, 817–836. doi:10.1144/jgs2015-136
Hantar, G. (1990). “North Western Desert,” in The Geology of Egypt. Editor R. Said (Rotterdam: Balkema), 293–319.
Haq, B. U. (2014). Cretaceous eustasy revisited. Glob. Planet. Change 113, 44–58. doi:10.1016/j.gloplacha.2013.12.007
Haq, B. U. (2018). Jurassic Sea-Level Variations: A Reappraisal. GSA Today 28, 4–10. doi:10.1130/gsatg359a.1
Hartkopf-Fröder, C., Königshof, P., Littke, R., and Schwarzbauer, J. (2015). Optical thermal maturity parameters and organic geochemical alteration at low grade diagenesis to anchimetamorphism: a review. Int. J. Coal Geol. 150–151, 74–119. doi:10.1016/j.coal.2015.06.005
Hermann, E., Hochuli, P. A., M_ehay, S., Bucher, H., Brühwiler, T., Ware, D., et al. (2011). Organic matter and palaeoenvironmental signals during the early triassic biotic recovery: the salt range and surghar range records. Sediment. Geol. 234, 19–41. doi:10.1016/j.sedgeo.2010.11.003
Hfaiedh, R., Vanneau, A. A., Godet, A., Arnaud, H., Zghal, I., Ouali, J., et al. (2013). Biostratigraphy, palaeoenvironments and sequence stratigraphy of the Aptian sedimentary succession at Jebel Bir Oum Ali (northern chain of Chotts, South Tunisia): comparison with contemporaneous Tethyan series. Cretac. Res. 46, 177–207. doi:10.1016/j.cretres.2013.08.004
Hieger, T. J., Serbet, R., Harper, C. J., Taylor, T. N., Taylor, E. L., and Gulbranson, E. L. (2015). Cheirolepidiaceous diversity: an anatomically preserved pollen cone from the Lower Jurassic of southern Victoria Land, Antarctica. Rev. Palaeobot. Palynol. 220, 78–87. doi:10.1016/j.revpalbo.2015.05.003
Hofmann, P., Leythaeuser, D., and Carpentier, B. (1993). Palaeoclimate controlled accumulation of organic matter in Oligocene evaporite sediments of the Mulhouse basin. Org. Geochem. 20, 1125–1138. doi:10.1016/0146-6380(93)90004-u
Hunt, D., and Tucker, M. E. (1992). Stranded parasequences and the forced regressive wedge systems tract: deposition during base-level fall. Sediment. Geol. 81, 1–9. doi:10.1016/0037-0738(92)90052-s
Ibrahim, M. I. A. (1996). Aptian-Turonian palynology of the Ghazalat-1 well (GTX-1), Qattara Depression, Egypt. Rev. Palaeobot. Palynol. 94, 137–168. doi:10.1016/0034-6667(95)00135-2
Ibrahim, M. I. A. (2002a). New angiosperm pollen from the upper Barremian-Aptian of the Western Desert, Egypt. Palynology 26, 107–133. doi:10.2113/0260107
Jarvie, D. M. (2012). “Shale resource systems for oil and gas: part 2— shale-oil resource systems,”. Shale reservoirs - giant resources for the 21st century. Editor J. A. Breyer, 97, 89–119.AAPG Mem.
Jones, R. W. (1987). “Organic facies,” in Advances in petroleum geochemistry. Editors J. Brooks, and D. H. Welte (New York: Academic Press), 1–90.
Jong, E. C. (2019). Basin classification of Shoushan Basin, Western Desert, Egypt. Earth Sci. Malays. 3/1, 35–38.
Keeley, M. L., Dungworth, G., Floyd, G. S., Forbes, G. A., Kin, C., Mcgarva, R. M., et al. (1990). The jurassic system in northern EGYPT: I. Regional stratigraphy and implications for hydrocarbon prospectivity. J. Petrol. Geol. 13, 397–420. doi:10.1111/j.1747-5457.1990.tb00856.x
Khaled, K. A. (1999). Cretaceous source rocks at the Abu Gharadig oil- and gasfield, northern Western Desert, Egypt. J. Petrol. Geol. 22/4, 377–395. doi:10.1111/j.1747-5457.1999.tb00475.x
Lafargue, E., Marquis, F., and Pillot, D. (1998). Rock-Eval 6 Applications in Hydrocarbon Exploration, Production, and Soil Contamination Studies. Rev. IFP 53 (4), 421–437. doi:10.2516/ogst:1998036
Leeder, M. R., Harris, T., and Kirkby, M. J. (1998). Sediment supply and climate change: implications for basin stratigraphy. Basin Res. 10, 7–18. doi:10.1046/j.1365-2117.1998.00054.x
Lister, J. K., and Batten, D. J. (1988). Stratigraphic and paleoenvironmental distribution of early Cretaceous dinoflagellate cysts in the Hurlands Farm borehole, West Sussex, England. Palaeontogr. Abt. B 210, 8–89.
Lotfy, M. M., Abd El Gawad, E. A., and Abdelghafar, A. (2020). Hydrocarbon source-rock potential of the Jurassic succession in eastern part of the North Western Desert, Egypt. J. Petrol. 29, 243–249. doi:10.1016/j.ejpe.2020.09.002
Marshall, J. E. A. (1988). The recognition of multiple hydrocarbon generation episodes: an example from Devonian lacustrine sedimentary rocks in the Inner Moray Firth, Scotland. J. Geol. Soc. Lond. 155, 335–352. doi:10.1144/gsjgs.155.2.0335
Mendonça Filho, J. G., Menezes, T. R., Mendonça, J. O., de Oliveira, A. D., da Silva, T. F., Rondon, N. F., et al. (2012). “Organic facies: palynofacies and organic geochemistry approaches,” in Earth's system processes geochemistry. Editor D. Panagiotaras (Rijeka): InTech), 211–248.
Meshref, W. M., and Hammouda, H. (1990). Basement tectonic map of Northern Egypt. Proceed. EGPC 9th Explor. Prod. Conf., 55–76.
Meshref, W. M. (1990). “Tectonic framework,” in The Geology of Egypt. Editor R. Said (Rotterdam: Balkema), 113–156.
Metwalli, F. I., and Pigott, J. D. (2005). Analysis of petroleum system criticals of the Matruh–Shushan Basin, Western Desert, Egypt. Petrol. Geosci. 11, 157–178. doi:10.1144/1354-079303-593
Moustafa, A. R. (2020). “Mesozoic-Cenozoic deformation history of Egypt,” in The Geology of Egypt, regional Geology reviews. Editor Z. Hamimi, A. El-Barkooky, J. M. Frías, H. Fritz, and Y. Abd El-Rahman (Springer), 253–294.
Pearson, D. L. (1990). Pollen/spore color “standard. Geology Branch, Bartlesville, Oklahoma: Phillips Petrol. Co. Version 2.
Pelzer, G., Riegel, W., and Wilde, V. (1992). Depositional control on the lower Cretaceous Wealden coals of Northwest Germany. GSA Spec. Pap. 267, 227–243.
Peters, K. E., and Cassa, M. R. (1994). “Applied source rock geochemistry,” in The petroleum system from source to trap. Editors L. B. Magoon, and W. G. Dow (Tulsa, Oklahoma: AAPG Mem.), 93–117.
Peters, K. E. (2018). Introduction to petroleum geochemistry, 15th Latin America congress on organic geochemistry ‘scientific interdisciplinarity in benefit of organic geochemistry, in Pre Conference Course, Salvador, Bahia, Brazil. November 4–7.
Phipps, D., and Playford, G. (1984). Laboratory techniques for extraction of palynomorphs from sediments. Pap. Depart. Geol. Uni. Qld. 11, 23.
Pickel, W., Kus, J., Flores, D., Kalaitzidis, S., Christanis, K., Cardott, B. J., et al. (2017). Classification of liptinite – ICCP System 1994. Int. J. Coal Geol. 169, 40–61. doi:10.1016/j.coal.2016.11.004
Pittet, B., and Gorin, E. (1997). Distribution of sedimentary organic matter in a mixed carbonate-siliciclastic platform environment: Oxfordian of the Swiss Jura Mountains. Sedimentology 44, 915–937. doi:10.1046/j.1365-3091.1997.d01-58.x
Posamentier, H. W., and Allen, G. P. (1999). Siliciclastic sequence stratigraphy: concepts and applications. SEPM Concepts Sedimentology Paleontology 7.
Prauss, M. (2001). Sea-level changes and organic-walled phytoplankton response in a Late Albian epicontinental setting, Lower Saxony basin, NW Germany. Palaeogeogr. Palaeoclim. Palaeoecol. 174, 221–249. doi:10.1016/s0031-0182(01)00295-4
Prauss, M. (2006). The Cenomanian/Turonian Boundary Event (CTBE) at Wunstorf, north-west Germany, as reflected by marine palynology. Cretac. Res. 27, 872–886. doi:10.1016/j.cretres.2006.04.004
Prauss, M. (2000). The oceanographic and climatic interpretation of marine palynomorph phytoplankton distribution from Mesozoic, Cenozoic and Recent sections. - Göttinger Arb. Geol. Paläont. 76, 1–235.
Regali, M. S. P., and Silva Santos, P. R. (1999). Palinoestratigrafia e geocronologia dos sedimentos Albo-Aptianos das bacias de Sergipe e de Alagoas – Brasil. In 1er Simposio Sobre el Cretácico de América del Sur, D. Dias-Brito, J. C. de Castro, and R. Rohn, Boletim Do 5° Simpósio Sobre O Cretáceo Do Brasil/, Serra Negra, São Paulo, Brasil, 411–419.
Rider, M. H. (2002). The geological interpretation of well logs. Scotland: Rider-Frensh Counsulting Ltd.
Robison, V. D., and Engel, M. H. (1993). “Characterization of the source horizons within the Late Cretaceous transgressive sequence of Egypt,” in Source rocks in a sequence stratigraphic framework. AAPG studies in Geology. Editors B. J. Katzand, and L. M. Pratt, 37, 101–118.
Sarjeant, W. A. S., and Taylor, F. J. R. "Max" (1999). Dinoflagellates, fossil and modern: certain unresolved problems. Grana 38, 186–192. doi:10.1080/00173139908559227
Sestini, G. (1994). “Egypt,”. Regional petroleum Geology of the world. Editor H. Kulke (Berlin: Gebruder Borntraeger), 3, 23–46.
Shalaby, M. R., Hakimi, M. H., and Abdullah, W. H. (2011). Geochemical characteristics and hydrocarbon generation modeling of the Jurassic source rocks in the Shoushan Basin, north Western Desert, Egypt. Mar. Petrol. Geol. 28/9, 1611–1624. doi:10.1016/j.marpetgeo.2011.07.003
Shalaby, M. R., Hakimi, M. H., and Abdullah, W. H. (2012). Geochemical characterization of solid bitumen (migrabitumen) in the Jurassic sandstone reservoir of the Tut Field, Shushan Basin, northern Western Desert of Egypt. Int. J. Coal Geol. 100, 26–39. doi:10.1016/j.coal.2012.06.001
Shalaby, M. R., Hakimi, M. H., and Abdullah, W. H. (2014). Petroleum system analysis of the Khatatba Formation in the Shoushan Basin, north Western Desert, Egypt. J. Geosci. 7, 4303–4320. doi:10.1007/s12517-013-1109-9
Sloss, L. L. (1963). Sequences in the cratonic interior of North America. Geol. Soc. Am. Bull. 74, 93–114. doi:10.1130/0016-7606(1963)74[93:sitcio]2.0.co;2
Smelror, M., and Leereveld, H. (1989). Dinoflagellate and Acritarch assemblages from the late Bathonian to early Oxfordian of Montagne Crussol, Rhone valley, southern France. Palynology 13, 121–141. doi:10.1080/01916122.1989.9989358
Snowdon, L. R. (1995). Rock-Eval Tmax suppression: documentation and amelioration. AAPG Bull. 79, 1337–1348.
Souza-Lima, W., and Silva, R. O. (2018). Aptian–Albian paleophytogeography and paleoclimatology from Northeastern Brazil sedimentary basins. Rev. Palaeobot. Palynol. 258, 163–189. doi:10.1016/j.revpalbo.2018.08.003
Stancliffe, R. P. W. (1989). Microforaminiferal linings: their classification, biostratigraphy and paleoecology, with special reference to specimens from British Oxfordian sediments. Micropaleontology 35, 337–352. doi:10.2307/1485676
Sultan, N., and Abd El Halim, M. (1988). Tectonic framework of Northern Western Desert, Egypt and its effect on hydrocarbon accumulations. Paper presented at the Proceedings of the EGPC 9th Exploration and Production Conference, Cairo. EGPC Bull. 20-23, 31.
Sýkorová, I., Novotna, M., Pavlikova, H., and Machovic, V. (1996). “Petrological and spectroscopic structural characteristics of Bohemian and Moravian coals and their possible relation to gas proneness,”In Coal bed methane and coal Geology. Editors R. Gayer, and I. Harris, 109, 249–260.
Sýkorová, I., Pickel, W., Christanis, K., Wolf, M., Talor, G. H., and Flores, D. (2005). Classification of huminite – ICCP system 1994. Int. J. Coal Geol. 62, 85-106.
Tahoun, S. S., and Deaf, A. S. (2016). Could the conventionally known Abu Roash “G” reservoir (upper Cenomanian) be a promising active hydrocarbon source in the extreme northwestern part of Egypt? Palynofacies, palaeoenvironmental, and organic geochemical answers. Mar. Petrol. Geol. 76, 231–245. doi:10.1016/j.marpetgeo.2016.05.025
Tahoun, S. S., Deaf, A. S., Gentzis, T., and Carvajal-Ortiz, H. (2018). Modified RGB-based kerogen maturation index (KMI): Correlation and calibration with classical thermal maturity indices. Int. J. Coal Geol. 190, 70–83. doi:10.1016/j.coal.2017.09.004
Tari, G., Kohazy, R., Hannke, K., Hussein, H., Novotny, B., and Mascle, J. (2012). Examples of deep-water play types in the Matruh and Herodotus basins of NW Egypt. Lead. Edge 31, 816–823. doi:10.1190/tle31070816.1
Tribovillard, N. P., and Gorin, G. E. (1991). Organic facies of the early Albian Niveau Paquier, a key black shales horizon of the Marnes Bleues formation in the Vocontian Trough (Subalpine Ranges, SE France). Palaeogeogr. Palaeoclimatol. Palaeoecol. 85, 227–237. doi:10.1016/0031-0182(91)90162-k
Tyson, R. V. (1989). “Late Jurassic palynofacies trends, Piper and Kimmeridge Clay Formations, UK onshore and northern North Sea,” in Northwest European micropalaeontology and palynology. Editors D. J. Batten, and M. C. Keen (New York: Halsted Press), 135–172.
Tyson, R. V. (1995). Sedimentary organic matter: Organic facies and palynofacies. London: Chapman & Hall.
Tyson, R. V. (2001). Sedimentation rate, dilution, preservation and total organic carbon: some results of a modelling study. Geochem 32, 333–339. doi:10.1016/s0146-6380(00)00161-3
Tyson, R. V. (1996). “Sequence-stratigraphical interpretation of organic facies variations in marine siliciclastic systems; general principles and application to the onshore Kimmeridge Clay Formation, UK,”. Sequence stratigraphy in British Geology. Editors S. P. Hesselbo, and D. N. Parkinson, 103, 75–96.Geol. Soc. Spec. Publ.
Vallejo, C., Hochuli, P. A., Winkler, W., and von Salis, K. (2002). Palynological and sequence stratigraphic analysis of the Napo Group in the Pungarayacu 30 well, Sub-Andean Zone, Ecuador. Cretac. Res. 23, 845–859. doi:10.1006/cres.2002.1028
Van Krevelen, D. W. (1961). Coal: Typology-chemistry-physics-constitution. Amsterdam: Elsevier Science.
Van Wagoner, J. C. (1995). “Sequence stratigraphy and marine to nonmarine facies architecture of Foreland Basin Strata”, in Sequence Stratigraphy of Foreland Basin Deposits. Editors J. C. Van Wagoner, and G. T. Bertram (Book Cliffs, Utah, United States: AAPG Mem.), Vol. 64, 137–223.
Zecchin, M., and Catuneanu, O. (2013). High-resolution sequence stratigraphy of clastic shelves I: units and bounding surfaces. Mar. Petrol. Geol. 39, 1–25. doi:10.1016/j.marpetgeo.2012.08.015
Zecchin, M., and Catuneanu, O. (2017). High-resolution sequence stratigraphy of clastic shelves VI: mixed siliciclastic-carbonate systems. Mar. Petrol. Geol. 88, 712–723. doi:10.1016/j.marpetgeo.2017.09.012
Zein El Din, M. Y., Abd El Gawad, E. A., El Shayb, H. M., and Haddad, I. A. (2001). Geological Studies and Hydrocarbon Potentialities of the Mesozoic Rocks in Ras Kanayes Onshore Area, North Western Desert, Egypt. Ann. Geol. Sur. Egypt 24, 115–134.
Keywords: organic petrology, Rock-Eval, sequence stratigraphy, paleoclimate, Neotethyan ocean, Shushan Basin, rifting, Egypt
Citation: Aljahdali MH, Deaf AS, Gentzis T, Bantan RA, Abu-Zied RH, Carvajal-Ortiz H and Khalaf MM (2023) Organic petrographic, geochemical, and sequence stratigraphic analyses for evaluating the hydrocarbon potential of Middle Jurassic–Lower Cretaceous rocks in Shushan Basin, northwestern Egypt. Front. Earth Sci. 11:1129379. doi: 10.3389/feart.2023.1129379
Received: 21 December 2022; Accepted: 02 May 2023;
Published: 15 May 2023.
Edited by:
Lei Chen, Southwest Petroleum University, ChinaReviewed by:
Entao Liu, China University of Geosciences Wuhan, ChinaSten-Andreas Grundvåg, UiT The Arctic University of Norway, Norway
Copyright © 2023 Aljahdali, Deaf, Gentzis, Bantan, Abu-Zied, Carvajal-Ortiz and Khalaf. This is an open-access article distributed under the terms of the Creative Commons Attribution License (CC BY). The use, distribution or reproduction in other forums is permitted, provided the original author(s) and the copyright owner(s) are credited and that the original publication in this journal is cited, in accordance with accepted academic practice. No use, distribution or reproduction is permitted which does not comply with these terms.
*Correspondence: Amr S. Deaf, YW1yLmRhaWZAc2NpZW5jZS5hdS5lZHUuZWc=, YXNkZWFmNzVAeWFob28uY29t