 Masayuki Ikeda
 Tenichi Cho
 Maximilien Bôle
- 1Department of Earth and Planetary Science, The University of Tokyo, Bunkyo, Japan
- 2Graduate School of Creative Science and Engineering, Waseda University, Shinjuku, Japan
The end-Triassic mass extinction event (ETE) is considered to be linked with the emplacement of the Central Atlantic magmatic province (CAMP), yet their temporal relation and underlying nature of global environmental and biotic changes remain controversial. A drastic radiolarian faunal turnover was associated with deep-sea acidification and changes in the chemical composition of pelagic terrigenous components, which were interpreted as the results of increased CAMP-derived materials, such as Fe2O3/Al2O3, MgO/Al2O3, and SiO2/Al2O3, without statistical tests. Here, we re-examined these CAMP-like signatures in terms of changes in the chemical composition of the Triassic–Jurassic pelagic deep-sea chert succession in Japan. Our newly compiled dataset suggests that changes in Fe2O3/Al2O3 and MgO/Al2O3 across the ETE were not significant, and thus, they may not be appropriate proxies for CAMP-derived material, potentially due to the dissolution of iron by ocean acidification and the formation of chlorite during diagenesis, respectively. Decreased SiO2/Al2O3 was also considered to have been reflected in increased CAMP-related dust flux and/or decreased biosiliceous productivity, but a slight increase in the Al2O3/TiO2 ratio (a biosiliceous productivity proxy) and an increase in shale bed thickness (dust flux proxy) across the radiolarian ETE imply increased eolian dust flux rather than decreased productivity. Furthermore, statistically significant Na enrichment at the radiolarian ETE level might be related to CAMP volcanism and/or associated changes in the source areas of eolian dust.
1 Introduction
The end-Triassic extinction (ETE) marks one of the “Big Five” mass extinctions (Raup and Sepkoski, 1982). This event is likely related to a massive release of CO2 and volatiles from the Central Atlantic magmatic province (CAMP) (Marzoli et al., 1999; Schaller et al., 2011), which could have promoted environmental degradation and triggered the end-Triassic extinction event both on terrestrial and marine biota (e.g., Guex et al., 2016; Heimdal et al., 2018; Kaiho et al., 2022).
The timing of such events is still debated due to the diachronous last/first appearance of different taxa and uncertainty in correlations between different basins up to hundreds of thousand years (Wignall and Atkinson, 2020). Exceptionally high-resolution biostratigraphic works suggested that the ETE was a catastrophic turnover of approximately < ∼20 kyr scale (Olsen et al., 2002; Carter and Hori, 2005; Longridge et al., 2007; Fox et al., 2020). The U-Pb ages of the intercalated CAMP lava and sill intrusions and magneto-cyclostratigraphy confirmed <10-kyr-scale biotic turnover coincident with the initial CAMP volcanism at least in terrestrial Pangea (Olsen et al., 2002; Blackburn et al., 2013).
Although the available radiometric ages of volcanic ash beds across the ETE in marine successions fall within the errors for the terrestrial ETE on a 100-kyr timescale (Schoene et al., 2010; Wotzlaw et al., 2014), their correlation with continental succession is still debated. The negative organic carbon isotope excursions (NCIEs) are widely used for stratigraphic correlation, which was assumed to be derived from isotopically light carbon injection by CAMP volcanism, but biomarker analyses revealed that NCIEs are caused by changes in local sources of organic carbon in at least some Tethyan sections (Fox et al., 2020). The mercury (Hg) anomaly was also considered the fingerprint of the CAMP volcanic signature, yet comparisons of Hg records between marine and continental successions are still controversial (e.g., Thibodeau et al., 2016; Yager et al., 2021).
One of the most constrained biotas for the end-Triassic marine turnover is Radiolaria in pelagic and neritic Panthalassa (Carter and Hori, 2005; Hori et al., 2007; Longridge et al., 2007). In the pelagic deep-sea succession, the radiolarian turnover is recognized within the upper part of the biogenic magnetite- and hematite-depleted interval, which was interpreted as the result of deep-sea acidification, probably by the doubling of pCO2 by initial CAMP volcanism, but this was considered to precede the end-Triassic radiolarian extinction by ∼100 kyr (Abrajevitch et al., 2013). However, the timing of deep-sea acidification needs to be re-evaluated due to the acidification of sediment pore water because of biogenic magnetite and hematite formed within the sediment (Ikeda et al., 2015).
The coincidence between the radiolarian turnover and CAMP volcanism was suggested by increased MgO/Al2O3, Fe2O3/Al2O3, and Al2O3/SiO2 across the end-Triassic extinction interval of pelagic chert, which potentially reflected the increased eolian dust derived from weathered CAMP volcanic rocks (Ikeda et al., 2015). It is noteworthy that environmental changes across the ETE could be linked to CAMP volcanism and associated climate change due to increased aerosol and atmospheric pCO2 (e.g., Schaller et al., 2011; Kaiho et al., 2022). Changes in the atmospheric circulation and terrestrial climate zone could have enhanced the emission of eolian dust, possibly associated with changes in the chemical composition of eolian dust (e.g., Ikeda et al., 2015). However, their paleoenvironmental significance remains unclear due to various factors controlling these compositional changes in bedded cherts, including diagenetic processes (e.g., Murray et al., 1992a; Murray et al., 1992b; Murray et al., 1993; Murray, 1994).
To test the significance of changes in these proxies across the ETE, we statistically compared these proxies derived from our newly compiled major elemental data below and above the ETE in the Inuyama area, Japan. Although most of the changes in the previous ratios were not statistically significant, μm-scale Na enrichment and increased shale bed thickness across the ETE imply increased eolian dust flux on pelagic Panthalassa, which may be related to the continental climate change across the ETE.
2 Geological setting
The studied Katsuyama and Kurusu sections are located in the Inuyama area, in the southwestern part of the Mino Terrane, central Japan (Figure 1). The accretionary complex in the Inuyama area comprises the Lower Triassic to Lower Jurassic bedded chert and Middle Jurassic siliciclastic rocks, which are repeated as tectonic slices (Figure 1; Yao et al., 1980; Yao et al., 1980; Matsuda and Isozaki, 1991; Kimura and Hori, 1993). The distance between the Katsuyama and Kurusu sections can be originally several tens of kilometers apart, given the modern geometry of these thrust sheets (e.g., Kimura and Hori, 1993). The siliciclastic rocks and bedded cherts correspond to hemipelagic deep-sea and trench sediments, having been deposited prior to subduction and accretion, and more distal pelagic deep-sea sediments of the Panthalassa superocean, respectively (Matsuda and Isozaki, 1991). Paleomagnetic analyses of the bedded chert sequence in the Inuyama area suggest that the site of deposition changed as a result of plate motion from low latitudes during the Middle Triassic to mid-latitudes during the Jurassic (Figure 1; Shibuya and Sasajima, 1986; Oda and Suzuki, 2000; Ando et al., 2001). Based on a 50-Myr travel history until the subduction during the Late Jurassic, the distance from the paleoshoreline at Katusyama and Kurusu sections traveled before accretion can be assumed to be 1,500–3,000 km using a convergence rate of 3–6 cm/yr.
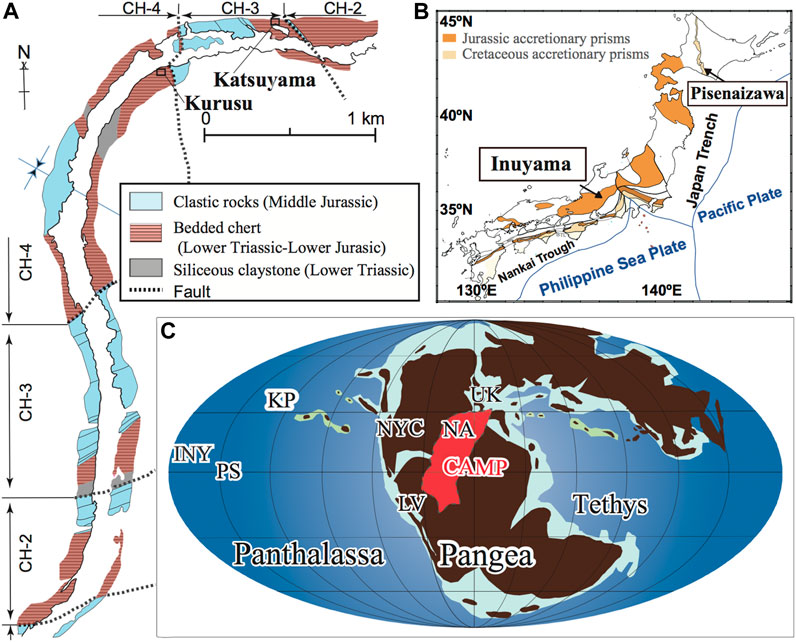
FIGURE 1. (A) Geologic map and (B) location map showing the locations of the Katsuyama and Kurusu sections in the Inuyama area, Mino–Tanba Terrane, Japan. (C) Paleogeographic map during Triassic–Jurassic transition (modified by Golonka (2002); Kent and Irving (2010)) with the hypothesized extent of the Central Atlantic magmatic province (CAMP; Kent and Tauxe, 2005) and the approximate paleolocation of Triassic–Jurassic boundary sites plotted. INY, Inuyama, Japan; PS, Pisenaizawa, Japan; KP, Kennecott Point, Haida Wadii (Queen Charlotte Island), Canada; NYC, New York Canyon, United States; LV, Levanto, Peru; NA, Newark basin, United States, and UK, St. Audrie’s Bay section, United Kingdom.
The rhythmic alternations of cm-thick chert and mm-thick shale beds in the Inuyama area probably reflect changes in the biogenic Si burial rate under a slower accumulation rate of the terrigenous material with probable eolian dust, based on 10–100 times higher abundance of magnetic microspherules of extraterrestrial origin in shale than in chert (e.g., Hori et al., 1993). Such changes in the Si content were enhanced by diagenetic segregation, whereby SiO2 is exported from layers with low Si content to those with high Si contents during the silica phase transformation from opal-CT to quartz (e.g., Tada, 1991). Because there are no large chert nodules or quartz veins, at least in the studied sections, we did not consider significant hydrothermal Si input during diagenesis. According to the biostratigraphic age model, the average sedimentary duration of a chert-shale couplet is −20 kyr for each stage throughout the Triassic and Early Jurassic, whose duration is consistent with the precession cycle (Hori et al., 1993; Ikeda and Tada, 2014). Hierarchically, higher cycles of chert thickness identified correspond to obliquity cycles (−40 kyr) and eccentricity cycles (−100 kyr, 405 kyr, 2 Myr, 4 Myr, and −10 Myr), which allow a −70 Myr astronomical timescale for this succession (Ikeda and Tada, 2014; Ikeda and Tada 2020).
Chronostratigraphy of the Triassic–Jurassic deep-sea sequence in the Inuyama area has been well constrained by radiolarian and conodont biostratigraphy, chemostratigraphy, and cyclostratigraphy (Figure 3; e.g., Sugiyama, 1997; Carter and Hori, 2005; Ikeda and Tada, 2013; Ikeda and Tada, 2014; Ikeda and Tada 2020; see Bole et al., 2022 for details and references therein). A significant turnover of radiolarian fossils in the Katsuyama and Kurusu sections is correlative with other sections, especially Haida Gwaii (Queen Charlotte Islands, Canada) at the species level (Carter and Hori, 2005; Hori et al., 2007). Based on the last appearance datum (LAD) on the Triassic radiolarian G. tozeri assemblage from the purple chert and the first occurrence of the Jurassic radiolarian Pantanellium tanuense assemblage from the purple chert to the lowermost dusky red chert bed (Figure 2), the radiolarian transition can be between them at the Katsuyama section (Carter and Hori, 2005). It is noteworthy that the Triassic radiolarian Globolaxtorum tozeri assemblage co-occurs with Jurassic-type Radiolaria Praehexasaturmalis tetradiatus in a single bed at both the Katsuyama and Kurusu sections and section I of Kennecott Points in Haida Gwaii (Figures 1, 2; Carter and Hori, 2005; Hori et al., 2007; Longridge et al., 2007; Bole et al., 2022). Similar radiolarian faunal turnover is also known in Tethyan sections, now located at the Csővár section, Hungary, and Canj section, Montenegro, although the co-occurrence of Triassic-type and Jurassic-type Radiolaria in a bed was not identified partly due to their relatively lower resolution (Figure 2; Pálfy et al., 2007; Črne et al., 2011).
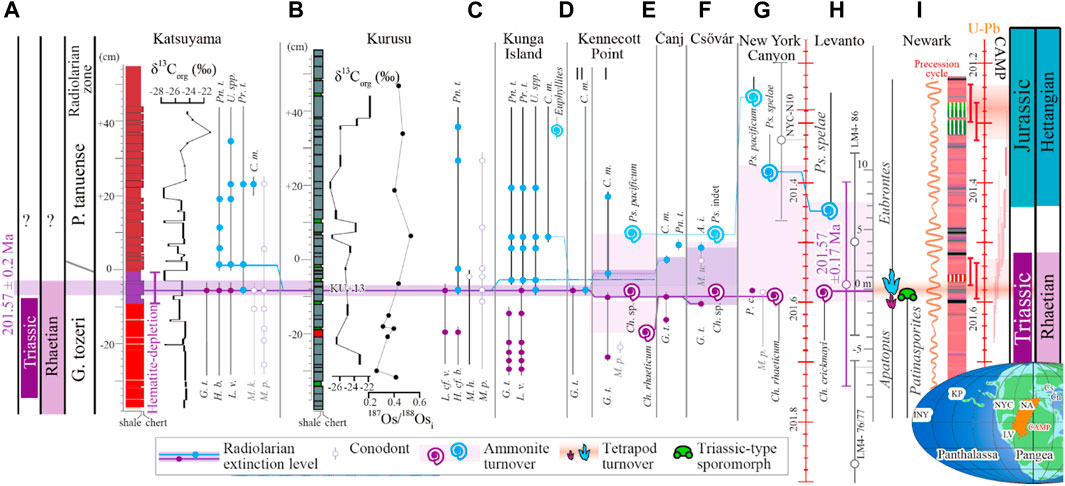
FIGURE 2. Biostratigraphic correlation of the uppermost Triassic to lowermost Jurassic deep-sea sequence at (A) Katsuyama and (B) Kurusu sections in the Inuyama area, central Japan (Carter and Hori, 2005; Hori et al., 2007; Kuroda et al., 2010; Ikeda et al., 2015; Okada et al., 2015) with the shallow marine sections in (C) Kunga Island and (D) sections Ⅰ and Ⅱ of Kennecott point in Haida Wadii (Queen Charlotte Island), Canada (Tipper and Guex, 1994; Carter and Hori, 2005; Longridge et al., 2007; Williford et al., 2007; Carter et al., 2010), (E) Csovar section, Hungary (Pálfy et al., 2007; Kovács, et al., 2020), (F) New York Canyon, USA (Ward et al., 2001; Guex et al., 2004; Longridge et al., 2007; Orchard, 2007; Williford et al., 2007; Guex et al., 2012), and (G) Levant section, Peru (e.g., Schaltegger et al., 2008; Schoene et al., 2010; Guex et al., 2012) are also shown. The astronomical timescale of the Newark basin is anchored at the ETE for the tetrapod footprint and sporomorph as 201.58 ± 0.034 Ma based on the U-Pb dating of intercalated CAMP volcanic rocks in (H) Newark–Argana–Fundy basins (Olsen et al., 2002; Blackburn et al., 2013). Inset map is according to the studies of Golonka (2002) and Kent and Irving (2010). INY, Inuyama, Japan; KP, Kennecott Point, Haida Wadii (Queen Charlotte Island), Canada; NYC, New York Canyon; CS=Csovar, Hungary; CN, Čanj, Montenegro; LV, Levanto, Peru; NA=Newark basin, G.t., Globolaxtorum tozeri; H. b., Haeckelicytium breviora; L. v., Livarella varida; Pr. t., Prehexasaturnalis tetraradiatus; Pa.t., Pantanellium tanuense; U. spp., Udaria spp.; C.m., Canoptum merum; M. p., Misikella posthernsteini; M. k., Misikella kovacsi; Ch., Choristoceras; Ps., Psiloceras.
The end-Triassic radiolarian turnover interval is located within the ammonoid turnover interval at Kennecott Point and New York Canyon, which can be correlated with the ammonoid turnover in the Pucara section, Peru (Figure 3; Guex et al., 2004; Schaltegger et al., 2008; Ward et al., 2001; Ward et al., 2004; Ward et al., 2007). In the Pucara section, the Lowest Occurrence (LO) of Triassic ammonoid Ch. crickmayi can be 201.57 ± 0.17 Ma based on linear interpolation of ash beds dated at 201.51 ±0.15 Ma (LM4-86) and dated at 201.87 ± 0.17 Ma (LM4-76/77) (Figure 2E; Guex et al., 2012; Wotzlaw et al., 2014). This age falls within the uncertainty of the terrestrial ETE in the Newark basin as 201.564 ± 0.015 Ma based on astronomical calibration anchored by U-Pb ages of several CAMP volcanic rocks (Blackburn et al., 2013).
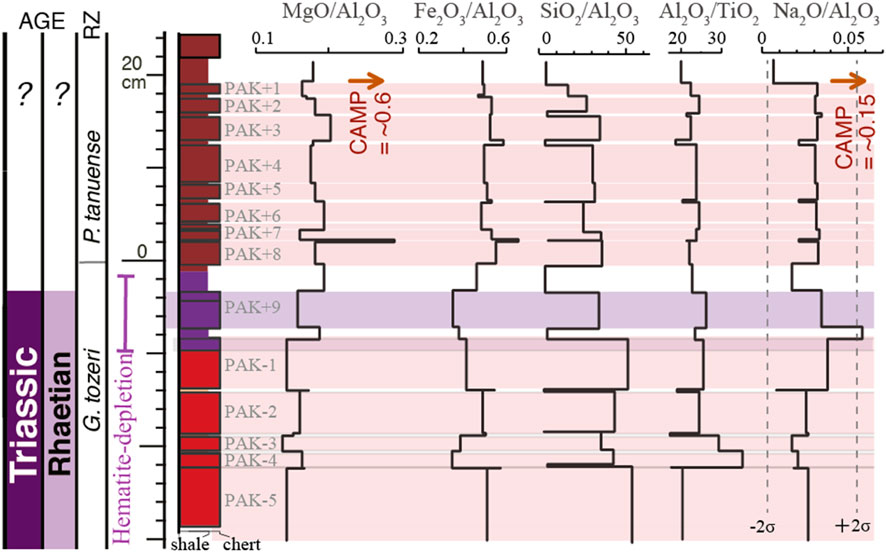
FIGURE 3. Stratigraphic changes in geochemical data across the Triassic–Jurassic (T–J) transition at the Katsuyama section, Inuyama, Japan. MgO/Al2O3, Fe2O3/Al2O3, SiO2/Al2O3, Al2O3/TiO2, and Na2O/Al2O3 ratios are according to the studies of Okada et al. (2015) and Fujisaki et al. (2016). G., Globolaxtorum; P., Pantanellium.
Previous studies also examined the end-Triassic extinction interval of deep-sea chert succession by chemostratigraphy and conodont biostratigraphy (Kuroda et al., 2010; Fujisaki et al., 2018; Bole et al., 2022; Shen et al., 2022). The LO of conodonts ca. 30 cm above the radiolarian turnover was not used for correlation because conodonts occur up to the Toarcian, probably by reworking (Hori, 1997). The organic carbon isotope correlation seems to be difficult between the Katsuyama and Kurusu sections, partly due to the relatively lower resolution in the Kurusu section and cm-scale −4‰ oscillations between chert and mudstone, and potentially due to different sources and/or diagenetic processes (Kuroda et al., 2010; Okada et al., 2015; Fujisaki et al., 2018). Further independent analyses will be necessary to clarify the origin of organic carbon and the organic carbon isotope correlation.
Mercury (Hg) anomalies are also widely used as a tracer of CAMP volcanism and were detected around the radiolarian extinction interval at the Katsuyama and Kurusu sections (Schoepfer et al., 2022; Shen et al., 2022). However, these Hg peaks are not only the intervals above the radiolarian turnover level but also the intervals a few meters below this level (several Myr before ETE; Schoepfer et al., 2022; Shen et al., 2022). Thus, considering the sedimentation rate of these sections as ca. 1 m/Myr, these Hg anomalies in our section are not necessarily derived from CAMP volcanism but possibly from other sources.
At the Kurusu section, a negative Os isotope excursion ca. 2 m below the radiolarian turnover level was interpreted as a result of increased radiogenic Os derived from CAMP rock weathering (Kuroda et al., 2010), yet their interpretation is contradictory with the available geochronologic data on CAMP volcanism (Figure 2). Because the Os isotope ratio of seawater reflects the mixing of felsic and mafic rock weathering, mantle, and extraterrestrial sources (Peucker-Ehrenbrink and Ravizza, 2000), the positive Os shift across the radiolarian turnover level may reflect increased felsic rock weathering relative to mafic rock weathering, such as CAMP, although negative Os isotope shifts across the ETE were reported from St. Audrie’s section (Cohen and Coe, 2002). Thus, it is difficult to examine the timing of CAMP volcanism based on the Os isotope record in the Kurusu section, possibly related to the diagenetic transportation of Os in pyrite in the Kurusu section (Schoepfer et al., 2022).
Across the end-Triassic radiolarian turnover interval, lithological change has been identified as a distinct color change from brick red to dusky red cherts with a −6-cm purple interval (PAK+9r; Figure 2) composed of two intercalated purple chert beds within purple shales (Hori, 1992; Carter and Hori, 2005; Okada et al., 2015). The change from brick red to purple occurs gradually on the last 5 mm of the uppermost brick red chert bed (PAK-1 of Okada et al., 2015), whereas the change from purple to dusky red is sharp at the top of the last purple shale just below the lowermost dusky red chert (PAK+8 of Okada et al., 2015; Figure 2). Changes in Fe-bearing mineral compositions are responsible for such color changes (Sato et al., 2012; Ikeda et al., 2015) and are interpreted to reflect changes in deep-sea acidification under oxygen-rich bottom water (Abrajevitich et al., 2013; Ikeda et al., 2015). Here, we assign the base of post-ETE as the purple shale (IYF53D-0 of Fujisaki et al., 2016; between PAK-1 and PAK+9 of Okada et al., 2015) and the base of KU+17 at the Katsuyama and Kurusu sections, respectively, based on radiolarian biostratigraphy (Figure 2; Hori et al., 2007).
3 Methods
To examine the bulk chemical signature of the end-Triassic extinction event in deep-sea chert succession, we compared these proxies of newly compiled data between pre- and post-ETE levels at the Katsuyama and Kurusu sections across the end-Triassic extinction.
The bulk major element data on cherts and shales at the Katsuyama section and cherts at the Kurusu section are measured by XRF spectroscopy (PW2400, Philips) at Ehime University (Hori et al., 2007; Okada et al., 2015) and by ICP-AES outsourced to the ALS Minerals (Method CCP-PKG01) (Fujisaki et al., 2016). The precision (1s) for most of the chert data in Kurusu sections was <1% with an accuracy of 0.183 wt% for SiO2, 0.005 wt% for TiO2, 0.225 wt% for Al2O3, 0.030 wt% for Fe2O3* (total iron as Fe2O3), 0.146 wt% for MgO, and 0.037 wt% for Na2O (Hori et al., 2007). The data on major elements for chert in the Katsuyama section had an accuracy of 0.118 wt% for SiO2, 0.009 wt% for TiO2, 0.060 wt% for Al2O3, 0.040 wt% for Fe2O3*, 0.046 wt% for MgO, and 0.028 wt% for Na2O (Okada et al., 2015), which are high enough to conduct statistical analyses for Al-normalized anomalies between pre- and post-ETE. Although those for shale samples in the Katsuyama section were not presented (Fujisaki et al., 2016), considering the several times higher concentrations of elements other than SiO2 in shale samples relative to chert, this analytical precision should be high enough to conduct statistical analyses.
Past version 4 software application was used for statistical analyses (Hammer et al., 2001). Although the sampling patterns of the two sections are different, we can compare the difference in the median of selected elemental data between pre- and post-ETE at the 95% confidence level, shown as no overlapping notches in the box and jitter plot (Figure 4; Chambers et al., 1983).
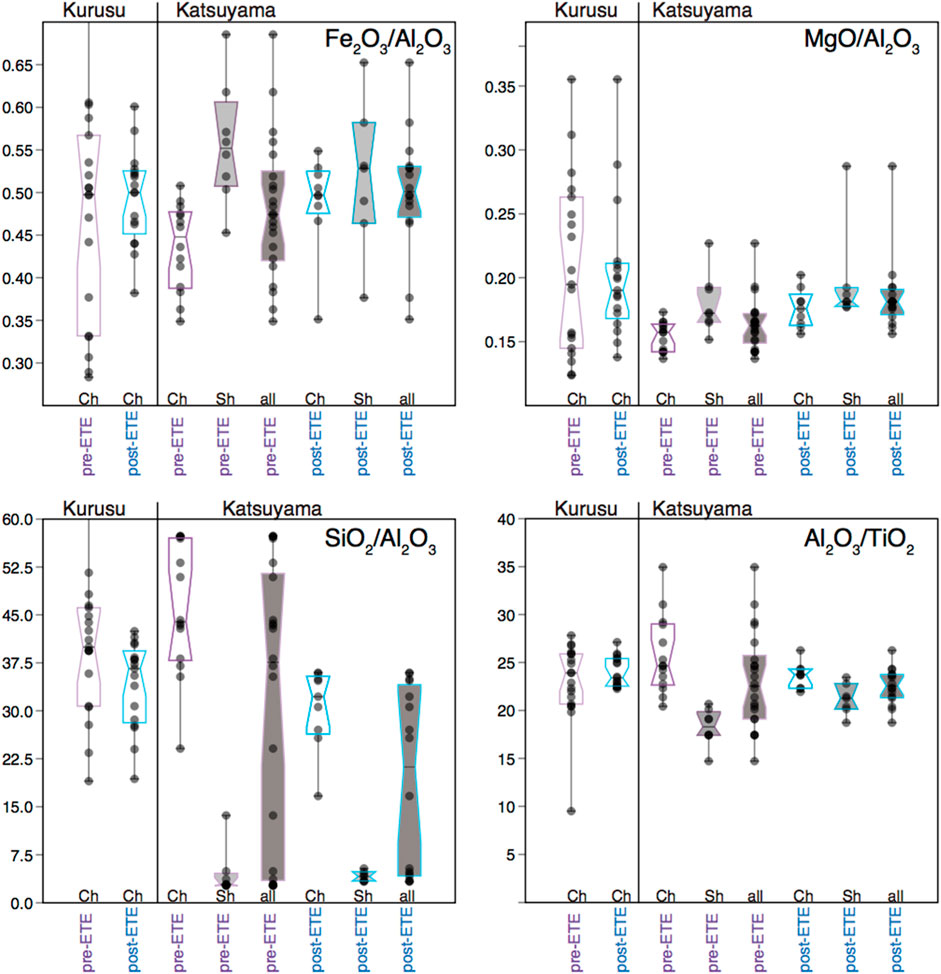
FIGURE 4. Box and jitter plots of major element data (MgO/Al2O3, Fe2O3/Al2O3, SiO2/Al2O3, and Ti2O/Al2O3 ratios) across the end-Triassic radiolarian extinction zone at the Katsuyama and Kurusu sections. MgO/Al2O3, Fe2O3/Al2O3, SiO2/Al2O3, and Al2O3/TiO2 ratios are according to the studies of Hori et al. (2007); Okada et al. (2015); and Fujisaki et al. (2016). The center lines in the boxes are median values, and the box limits are ±1 σ, where no overlapping notches are present and the two medians are significantly different at the 95% confidence level (Chambers et al., 1983). Ch, chert; Sh, shale; all, chert+shale. Overlap of all (chert + shale) samples between pre-ETE and post-ETE are shown to emphasize that variations in those proxies between chert and shale are larger than those across the ETE due to large impact of diagenetic segregation and precession-scale environmental changes.
4 Discussion
4.1 Chemical signature of Central Atlantic magmatic province-related material in deep-sea chert across the radiolarian extinction event
The coincidence between the end-Triassic mass extinction (ETE) and initial CAMP volcanism is generally confirmed in Pangean continental succession (e.g., Blackburn et al., 2013), yet their relation with the ETE for marine biota is highly debated (e.g., Whiteside et al., 2007; Fox et al., 2020). Ikeda et al. (2015) inferred the coincidence between the end-Triassic radiolarian turnover and CAMP volcanism, relying on the increased Fe2O3/Al2O3, MgO/Al2O3, and SiO2/Al2O3 ratios of cherts across the end-Triassic extinction interval of pelagic chert. However, these elemental ratios reflect various factors, including changes in provenance, sedimentological, biological, redox, and diagenetic processes in bedded chert (Murray et al., 1992a; Murray et al., 1992b; Murray et al., 1994).
Fe2O3/Al2O3 ratios in post-ETE cherts are statistically higher than those in pre-ETE cherts at the Katsuyama section at the 95% confidence level (p < 0.02; Figure 4). However, those in post-ETE cherts are slightly lower than those in pre-ETE shale at the Katsuyama section and overlap with those in pre-ETE and post-ETE cherts at the Kurusu section (Figure 4). In other words, Fe2O3/Al2O3 in pre-ETE cherts at the Katsuyama section are lower than that in other samples, potentially related to the dissolution of biogenic magnetite and hematite as a result of acidification/reduction of bottom-water and sediment pore water below the seafloor (Abrajevitch., 2013; Fuhrer et al., 1999; Reader et al., 1999; Fischer et al., 2007; McGee et al., 2010; Abrajevitch et al., 2013; Ikeda et al., 2015; Ikeda et al., 2015).
MgO/Al2O3 ratios of post-ETE cherts are also statistically higher than those of pre-ETE chert at the Katsuyama section (p < 0.005; Figure 4), which is consistent with the idea that increased Mg-rich CAMP-derived eolian dust (Ikeda et al., 2015). The increased Mg content of the tropical terrestrial sequence in Morocco and the Tethyan section has been interpreted as an increased supply of mafic clay minerals produced from the weathered CAMP basalt (Pálfy and Zajzon, 2012; Dal Corso et al., 2014). However, MgO/Al2O3 ratios in post-ETE cherts overlap with those in pre-ETE shales at the Katsuyama section and that in pre-ETE chert at the Kurusu section (Figure 3).
Previous studies using Mossbauer analysis in this interval at the Katsuyama section detected Fe3+(h.s.) and Fe2+(outer), which are likely included in clay minerals, such as illite or chlorite in addition to hematite (Sato et al., 2012). X-ray absorption fine structure (XAFS) analysis at the Katsuyama section also detected illite, but no chlorite signature was found in this interval, probably due to dilution by abundant hematite and illite (Ikeda et al., 2015). Thus, the host of Mg in bedded chert may be derived from illite and/or chlorite. Micro-scale observation also detected diagenetic chlorite particles and veins >100 μm-scale larger in deep-sea chert (Kameda et al., 2012). Although previous studies carefully removed veins before powdering, it should be noted that the relative contribution of (early) diagenetic chlorite formation is critical to discussing such elemental enrichments in this section, especially for the shale particle just above the lowermost dusky red chert bed (Figure 3). Thus, MgO/Al2O3 and Fe2O3/Al2O3 seem not to be appropriate proxies for CAMP-derived eolian dust, although we cannot rule out this possibility.
On the contrary, Na enrichment in the lowermost purple shale is statistically different at the 95% confidence level from the corresponding means at the Katsuyama section (Figure 3), implying the contribution of an additional dust source across the radiolarian ETE. This may be related to a relatively higher bulk Na2O/Al2O3 ratio of CAMP volcanic rocks (0.12–0.17; Marzoli et al., 2019) compared with the Na2O/Al2O3 ratio of deep-sea chert (0.01–0.05; Figure 3). Although CAMP volcanic material may fly to pelagic Panthalassa, we cannot deny the possible formation of authigenic Na-aluminosilicate, and its identification will need essential criteria. In addition, the expansion of dust source regions in Pangea across the ETE may contribute to Na-enriched dust input into the pelagic Panthalassa. Further provenance analyses will be needed to clarify CAMP volcanism and associated environmental changes recorded in the pelagic deep-sea succession.
4.2 Changes in the eolian dust component and flux on pelagic Panthalassa across the radiolarian extinction event
SiO2/Al2O3 ratios of post-ETE cherts are systematically lower than those of pre-ETE cherts at the Katsuyama section (p < 0.001; Figure 4), which was interpreted as the result of increased CAMP-related Si-poor eolian dust (Ikeda et al., 2015). SiO2/Al2O3 ratios in post-ETE cherts also decreased from pre-ETE cherts at the Kurusu section despite their differences not being statistically significant (Figure 4). In contrast, SiO2/Al2O3 ratios in post-ETE shales are slightly higher than those in pre-ETE shale, but their differences are not statistically significant either (Figure 4).
It is noteworthy that the migration of biogenic Si from proto-shale intervals to adjacent proto-chert intervals during the diagenetic transformation from opal-A to opal-CT (Tada, 1991) suggests that SiO2/Al2O3 ratios in shales tend to be similar to those of eolian dust, while those in cherts reflect the biogenic Si content within a chert and adjacent shale beds per terrigenous material content in the proto-chert interval (e.g., Ikeda et al., 2017). Therefore, a decrease in SiO2/Al2O3 ratios in chert does not necessarily imply a change in eolian dust composition but rather indicates a decrease in the biogenic Si content and/or an increase in the terrigenous content.
An independent proxy for biosiliceous productivity is the Al2O3/TiO2 ratio because of the preferential scavenging of dissolved Al from seawater to biogenic opal and because it is diagenetically conservative (Murray et al., 1993; Dymond et al., 1997). The Al2O3/TiO2 ratio in pre-ETE cherts is statistically higher than that in pre-ETE shale at the Katsuyama section (p < 0.002, Figure 4). Ranges of the Al2O3/TiO2 ratio in post-ETE cherts slightly overlap with those in post-ETE shale at the Katsuyama section (p = 0.022, Figure 4), yet stratigraphic changes in the Al2O3/TiO2 ratio also show higher values in post-ETE cherts relative to those in adjacent shales, potentially related to dynamic changes in the Al2O3/TiO2 ratio of the terrigenous component, as discussed in the following (Figure 3). Although it is debated whether high productivity (Tada, 1991; Hori et al., 1993) or low productivity (Isaacs et al., 1983; Williams et al., 1985; Abrajevitch, 2020) occurs during the deposition of proto-chert intervals, the observed Al2O3/TiO2 ratios are consistent with higher biosiliceous productivity for proto-chert than proto-shale. Recently, using the same chert beds as Okada et al. (2015), Bole et al. (2022) also reported higher δ30Si values of radiolarian molds in Si-rich sublayers relative to Si-poor sublayers, further supporting higher productivity for Si-rich intervals. Al2O3/TiO2 ratios of post-ETE cherts overlap with those of pre-ETE cherts in both Katsuyama and Kurusu sections, implying insignificant changes in biosiliceous productivity during the proto-chert interval across the ETE (Figure 4). On the contrary, those of post-ETE shales are lower than those of pre-ETE shales in the Katsuyama section (p < 0.01, Figure 4), implying a decrease in productivity and/or changes in terrigenous composition during the proto-shale intervals across the ETE. Because the Al2O3/TiO2 ratios of the CAMP basalts are relatively low (−8–11; Deenen et al., 2010), such changes cannot be explained by increased CAMP-derived material.
In terms of terrigenous components, increased eolian dust input is inferred from the increased intercalated shale bed thickness across the radiolarian ETE at several sections in the Inuyama area, including the Katsuyama section, despite the difficulty of measuring <1-mm-thick shale beds (Figure 2; Sugiyama, 1997; Carter and Hori, 2005; Hori et al., 2007). Similar increases in shale bed thickness are also observed in deep-sea bedded chert sequences in the Pisenaizawa section, Hokkaido, northern Japan, which is located in central Panthalassa, roughly 1,000–3,000 km east of the Inuyama area, according to their different durations before accretion and a rough convergence rate of 3–6 cm yr−1 (Figure 1; Ikeda, 2013; Ikeda et al., 2017). Based on biostratigraphic age constraints, the sedimentation rates of bedded chert in these sections were relatively constant, around 1–2 mm/kyr, and the average duration for each chert-shale couplet is −20 kyr throughout the Triassic to Jurassic, similar to that of the climatic precession cycle at that time (Ikeda, 2013; Ikeda and Tada, 2014). Thus, increased shale thickness may reflect an increase in terrigenous material flux, probably eolian dust (Hori et al., 1993; Ikeda et al., 2017).
Several primary factors control the eolian dust flux, including wind gustiness, the area and dust productivity of dust source regions, vegetation coverage, sea-level change, and glacial sediments (Fuhre et al., 1999; Reader et al., 1999; Fischer et al., 2007; Maher et al., 2010; McGee et al., 2010). A factor of 2–4 increase in dust deposition is reported in the equatorial Pacific during glacial periods relative to interglacial periods (Winckler et al., 2008). Thus, these factors need to be examined to understand the increased eolian dust burial flux in the pelagic deep-sea chert across the end-Triassic radiolarian turnover interval.
After the initial massive CAMP volcanism, SO2 injection into the stratosphere would have initiated a cooling of 3–8°C by increasing planetary albedo through the formation of sulfuric acid aerosols (Tanner et al., 2004; Korte et al., 2009; Guex et al., 2016). This cooling could have steepened the meridional temperature gradient, thereby enhancing global dust emissions (Sun et al., 2001; Washington et al., 2006). However, such cooling lasted only on the centennial scale after multiple eruptions due to the residence time of aerosols in the stratosphere (Kaiho et al., 2022). On the contrary, global warming resulting from a doubling of pCO2 (Schaller et al., 2011; Schaller et al., 2012) implies that changes in wind gustiness might have played a minor role in changes in shale bed thickness as dust flux on the 20-kyr scale.
The expansion of source areas due to aridification is one of the most widely recognized potential drivers of the increase in eolian dust flux (Rea et al., 1994), particularly during the ETE. Across the continental ETE, subtropical terrestrial succession seems to be temporally (<10 kyr-scale) wetter than the rest of the Rhaetian in the central Atlantic margin (CAM) rift basins (Olsen et al., 2002; Kent et al., 2017). Temporal expansion of lakes and subsequent formation of desiccated lake beds and dust sources could enhance the eolian dust emission from these regions. In the Colorado Plateau of western subtropical Pangea, the appearance of the temporal eolian succession just below a lacustrine limestone interval dated at 200.5 ± 0.5 Ma (Parrish et al., 2019) may also contribute to the eolian emission, yet their age uncertainty needs to be improved.
In addition to aridity, restricting vegetation density or inhibiting vegetation regrowth after the fire has been proposed as a means of increasing dust emissions during glacial periods (Bond et al., 2003; Mahowald et al., 2006). Across the ETE of the Newark Basin, a decrease in regional sporomorph diversity loss of the conifer forest with an increase in rapid fern is recognized within the terrestrial faunal turnover interval in the Newark Basin and other CAM rift basins (Fowell and Olsen, 1993; Olsen et al., 2002). A significant macrofloral turnover is also evidenced by the extinction of the peltasperm Lepidopteris and its replacement by the dipteridacean fern Thaumatopteris and a flora rich in ginkgoaleans, conifers, and bennettites (McElwain et al., 2007; Pott and McLoughlin, 2009; Mander et al., 2013). Because vegetation recovery took several hundred kyr after the ETE (Olsen et al., 2002; Vajda and Bercovici, 2014), such vegetation collapse may contribute to the increased eolian dust emission.
Considering that the eolian dust emission rate increased by CAMP volcanism and associated environmental changes, such as arid region expansion and vegetation collapse, these factors may have also contributed to a decrease in SiO2/Al2O3 and an increase in shale bed thickness of deep-sea succession across the radiolarian ETE. Assuming that the timing of this proto-shale accumulation can correspond to the period between the accumulation of proto-chert above and below the shale bed (Tada, 1991; Bole et al., 2022), increased eolian dust could be coincident with the radiolarian turnover and deep-ocean acidification in the Katsuyama section (Ikeda et al., 2015). We also acknowledge that changes in eolian dust dynamics may not be the sole cause of the observed variations in shale bed thickness, and the chemical composition of Triassic-Jurassic deep-sea chert and other unidentified processes, such as sedimentary and diagenetic processes, may contribute. Nevertheless, similar changes in shale thickness and their chemical composition in the older part of this succession are also linked with continental aridification and associated eolian dust dynamics across the Carnian Pluvial Episode (Cho et al., 2022). Further convincing evidence for eolian dust flux and its chemical composition, including trace and rare earth elements, will clarify this idea and deepen our understanding of the global environmental dynamics across the ETE.
5 Conclusion
This study examined the temporal relationship between the end-Triassic radiolarian extinction and CAMP volcanism based on the stratigraphic changes in chemical compositions of deep-sea cherts deposited in pelagic Panthalassa, now exposed in Japan. The major element dataset results, previously used signatures of CAMP-related eolian dust, such as MgO/Al2O3, Fe2O3/Al2O3, and SiO2/Al2O3, may not be appropriate due to authigenic/diagenetic formation of chlorite, dissolution of magnetite and hematite by deep-ocean acidification, and increased eolian dust burial rate. Alternatively, statistically significant Na enrichment at the lowermost purple shale may reflect increased CAMP-derived material and/or changes in the provenance of eolian dust. Additionally, a decrease in SiO2/Al2O3 in conjunction with insignificant changes in Al2O3/TiO2 and an increase in shale bed thickness imply that increased eolian dust flux potentially reflects the expansion of the arid areas, vegetation collapse, and wind gustiness due to CAMP volcanism and associated environmental perturbation.
Author contributions
MI designed this study. MI and MB compiled the major element dataset. MI and TC conducted statistical analyses. MI primarily wrote the manuscript with input from MB and TC. All authors contributed to the article and approved the submitted version.
Funding
This research was partly supported by grants from the Japan Society for the Promotion of Science 18K13647 and 19H02012 awarded to MI, and PE19051 to MB.
Acknowledgments
The authors thank R. S. Hori (Ehime University) and L. Julien (Shizuoka University) for their critical discussion. The authors are grateful to the associate editor and reviewers for providing suggestions and comments that helped improve the manuscript.
Conflict of interest
The authors declare that the research was conducted in the absence of any commercial or financial relationships that could be construed as a potential conflict of interest.
Publisher’s note
All claims expressed in this article are solely those of the authors and do not necessarily represent those of their affiliated organizations, or those of the publisher, the editors, and the reviewers. Any product that may be evaluated in this article, or claim that may be made by its manufacturer, is not guaranteed or endorsed by the publisher.
References
Abrajevitch, A. (2020). Diagenetic formation of bedded chert: Implications from a rock magnetic study of siliceous precursor sediments. Earth Planet. Sci. Lett. 533, 116039. doi:10.1016/j.epsl.2019.116039
Abrajevitch, A., Hori, R. S., and Kodama, K. (2013). Rock magnetic record of the triassic-jurassic transition in pelagic bedded chert of the Inuyama section, Japan. Geology 41, 803–806. doi:10.1130/G34343.1
Ando, A., Kodama, K., and Kojima, S. (2001). Low-latitude and southern hemisphere origin of anisian (triassic) bedded chert in the Inuyama area, Mino Terrane, central Japan. J. Geophys. Res. 106 (B2), 1973–1986. doi:10.1029/2000jb900305
Blackburn, T. J., Olsen, P. E., Bowring, S. A., McLean, N. M., Kent, D. V., Puffer, J., et al. (2013). Zircon U-Pb geochronology links the end-triassic extinction with the central atlantic magmatic province. Science 340 6135, 941–945. doi:10.1126/science.1234204
Bôle, M., Ushikubo, T., Hori, R. S., Baumgartner, P. O., Nakai, Y., and Ikeda, M. (2022). Si isotope ratio of radiolaria across Triassic–Jurassic transition in a pelagic deep-sea bedded chert (Inuyama, Japan). Glob. Planet. Change 215, 103882. doi:10.1016/j.gloplacha.2022.103882
Bond, W. J., Midgley, G. F., and Woodward, F. I. (2003). The importance of low atmospheric CO2 and fire in promoting the spread of grasslands and savannas. Glob. Change Biol. 9, 973–982. doi:10.1046/j.1365-2486.2003.00577.x
Carter, E. S., Goričan, Š., Guex, J., O'Dogherty, L., De Wever, P., Dumitrica, P., et al. (2010). Global radiolarian zonation for the pliensbachian, toarcian and aalenian. Palaeogeogr. Palaeoclimatol. Palaeoecol. 297, 401–419. doi:10.1016/j.palaeo.2010.08.024
Carter, E. S., and Hori, R. S. (2005). Global correlation of the radiolarian faunal change across the TriassicJurassic boundary. Can. J. Earth Sci. 42, 777–790. doi:10.1139/e05-020
Chambers, J. M., Cleveland, W. S., and Kleiner, B. (1983). Graphical methods for data analysis. Draper, Utah; Wadsworth International Group.
Cho, T., Ikeda, M., and Ohta, T. (2022). Increased terrigenous supply to the pelagic Panthalassa superocean across the carnian pluvial Episode: A possible link with extensive aridification in the pangean interior. Front. Earth Sci. 10. doi:10.3389/feart.2022.897396
Cohen, A. S., and Coe, A. L. (2002). New geochemical evidence for the onset of volcanism in the Central Atlantic magmatic province and environmental change at the Triassic-Jurassic boundary. Geology 30 (3), 267–270. doi:10.1130/0091-7613(2002)030<0267:ngefto>2.0.co;2
Črne, A. E., Weissert, H., Goričan, Š., and Bernasconi, S. M. (2011). A biocalcification crisis at the Triassic-Jurassic boundary recorded in the Budva Basin (Dinarides, Montenegro). GSA Bull. 123, 40–50. doi:10.1130/B30157.1
Dal Corso, J., Marzoli, A., Tateo, F., Jenkyns, H. C., Bertrand, H., Youbi, N., et al. (2014). The dawn of CAMP volcanism and its bearing on the end-triassic carbon cycle disruption. J. Geol. Soc. 171, 153–164. doi:10.1144/jgs2013-063
Deenen, M. H. L., Ruhl, M., Bonis, N. R., Krijgsman, W., Kuerschner, W. M., Reitsma, M., et al. (2010). A newchronology for the end-Triassic mass extinction. Earth Planet. Sci. Lett. 291, 113–125. doi:10.1016/j.epsl.2010.01.003
Dymond, J., Collier, R., McManus, J., Honjo, S., and Manganini, S. (1997). Can the aluminum and titanium contents of ocean sediments Be used to determine the paleoproductivity of the oceans? Paleoceanography 12, 586–593. doi:10.1029/97pa01135
Fischer, H., Siggaard-Andersen, M. L., Ruth, U., Röthlisberger, R., and Wolff, E. (2007). Glacial/interglacial changes in mineral dust and sea-salt records in polar ice cores: Sources, transport, and deposition. Rev. Geophys. 45 (1). doi:10.1029/2005RG000192
Fowell, S. J., and Olsen, P. E. (1993). Time calibration of triassic/jurassic microfloral turnover, eastern north America. Tectonophysics 222, 361–369. doi:10.1016/0040-1951(93)90359-R
Fox, C. P., Cui, X., Whiteside, J. H., Olsen, P. E., Summons, R. E., and Grice, K. (2020). Molecular and isotopic evidence reveals the end-triassic carbon isotope excursion is not from massive exogenous light carbon. Proc. Natl. Acad. Sci. U. S. A. 117, 30171–30178. doi:10.1073/pnas.1917661117
Fuhrer, K., Wolff, E. W., and Johnsen, S. J. (1999). Timescales for dust variability in the Greenland ice core project (GRIP) ice core in the last 100,000 years. J. Geophys. Res. 104, 31043–31052. doi:10.1029/1999JD900929
Fujisaki, W., Sawaki, Y., Yamamoto, S., Sato, T., Nishizawa, M., Windley, B. F., et al. (2016). Tracking the redox history and nitrogen cycle in the pelagic panthalassic deep ocean in the Middle triassic to early jurassic: Insights from redox-sensitive elements and nitrogen isotopes. Palaeogeogr. Palaeoclimatol. Palaeoecol. 449, 397–420. doi:10.1016/j.palaeo.2016.01.039
Guex, J., Bartolini, A., Atudorei, V., and Taylor, D. (2004). High-resolution ammonite and carbon isotope stratigraphy across the triassic–jurassic boundary at New York Canyon (Nevada). Earth Planet. Sci. Lett. 225, 29–41. doi:10.1016/j.epsl.2004.06.006
Guex, J., Pilet, S., Müntener, O., Bartolini, A., Spangenberg, J., Schoene, B., et al. (2016). Thermal erosion of cratonic lithosphere as a potential trigger for mass-extinction. Sci. Rep. 6, 23168. doi:10.1038/srep23168
Guex, J., Schoene, B., Bartolini, A., Spangenberg, J., Schaltegger, U., O’Dogherty, L., et al. (2012). Geochronological constraints on post-extinction recovery of the ammonoids and carbon cycle perturbations during the early jurassic. Palaeogeogr. Palaeoclimatol. Palaeoecol. 346-347, 1–11. doi:10.1016/j.palaeo.2012.04.030
Hammer, Ø., Harper, D. A., and Ryan, P. D. (2001). Past: Paleontological statistics software package for education and data analysis. Palaeontol. Electron. 4 (1), 9.
Heimdal, T. H., Svensen, H. H., Ramezani, J., Iyer, K., Pereira, E., Rodrigues, R., et al. (2018). Large-scale sill emplacement in Brazil as a trigger for the end-triassic crisis. Sci. Rep. 8, 141. doi:10.1038/s41598-017-18629-8
Hori, R. (1992). Radiolarian biostratigraphy at the Triassic–Jurassic Period boundary in bedded cherts from the Inuyama area, central Japan. J. Geosci. Osaka City Univ. 35, 53–65.
Hori, R. (1997). The Toarcian radiolarian event in bedded cherts from southwestern Japan. Mar. Micropaleontol. 30 (1-3), 159–169.
Hori, R. S., Cho, C.-F., and Umeda, H. (1993). Origin of cyclicity in triassic-jurassic radiolarian bedded cherts of the Mino accretionary complex from Japan. Isl. Arc 2, 170–180. doi:10.1111/j.1440-1738.1993.tb00084.x
Hori, R. S., Fujiki, T., Inoue, E., and Kimura, J. (2007). Platinum group element anomalies and bioevents in the triassic–jurassic deep-sea sediments of Panthalassa. Palaeogeogr. Palaeoclimatol. Palaeoecol. 244, 391–406. doi:10.1016/j.palaeo.2006.06.038
Ikeda, M. (2013). Cyclostratigraphy of the triassic to jurassic deep-sea sequence in Japan: Frequency modulation for stratigraphic correlation. Bull. N. M. Mus. Nat. Hist. Sci. 61, 259–267.
Ikeda, M., Hori, R. S., Okada, Y., and Nakada, R. (2015). Volcanism and deep-ocean acidification across the end-triassic extinction event. Palaeogeogr. Palaeoclimatol. Palaeoecol. 440, 725–733. doi:10.1016/j.palaeo.2015.09.046
Ikeda, M., and Tada, R. (2014). A 70 million year astronomical time scale for the deep-sea bedded chert sequence (Inuyama, Japan): Implications for triassic–jurassic geochronology. Earth Planet. Sci. Lett. 399, 30–43. doi:10.1016/j.epsl.2014.04.031
Ikeda, M., and Tada, R. (2013). Long Period astronomical cycles from the triassic to jurassic bedded chert sequence (Inuyama, Japan); geologic evidences for the chaotic behavior of solar planets. Earth, Planets Space 65, 351–360. doi:10.5047/eps.2012.09.004
Ikeda, M., Tada, R., and Ozaki, K. (2017). Astronomical pacing of the global silica cycle recorded in mesozoic bedded cherts. Nat. Commun. 8, 15532. doi:10.1038/ncomms15532
Ikeda, M., and Tada, R. (2020). Reconstruction of the chaotic behavior of the solar system from geologic records. Earth Planet. Sci. Lett. 537, 116168. doi:10.1016/j.epsl.2020.116168
Isaacs, Caroline M., Pisciotto, Kenneth A., and Garrison, Robert E. (1983). Facies and dia-genesis of the miocene monterey formation, California: A summary. Dev. Sedimentology 36, 247–282.
Kaiho, K., Tanaka, D., Richoz, S., Jones, D. S., Saito, R., Kameyama, D., et al. (2022). Volcanic temperature changes modulated volatile release and climate fluctuations at the end-triassic mass extinction. Earth Planet. Sci. Lett. 579, 117364. doi:10.1016/j.epsl.2021.117364
Kameda, J., Hina, S., Kobayashi, K., Yamaguchi, A., Hamada, Y., Yamamoto, Y., et al. (2012). Silica diagenesis and its effect on interplate seismicity in cold subduction zones. Earth, Planet. Sci. Lett. 317-318, 136–144. doi:10.1016/j.epsl.2011.11.041
Kent, D. V., and Irving, E. (2010). Influence of inclination error in sedimentary rocks on the triassic and jurassic apparent Pole wander path for north America and implications for cordilleran tectonics. J. Geophys. Res. Solid Earth 155, B10103. doi:10.1029/2009jb007205
Kent, D. V., Olsen, P. E., and Muttoni, G. (2017). Astrochronostratigraphic polarity time scale (APTS) for the late triassic and early jurassic from continental sediments and correlation with standard marine stages. Earth-Science Rev. 166, 153–180. doi:10.1016/j.earscirev.2016.12.014
Kent, D. V., and Tauxe, L. (2005). Corrected late triassic latitudes for continents adjacent to the north atlantic. Science 307, 240–244. doi:10.1126/science.1105826
Kimura, K., and Hori, R. (1993). Offscraping accretion of jurassic chert-clastic complexes in the mino-tamba belt, central Japan. J. Struct. Geol. 15, 145–161. doi:10.1016/0191-8141(93)90092-O
Korte, C., Hesselbo, S. P., Jenkyns, H. C., Rickaby, R. E., and Spötl, C. (2009). Palaeoenvironmental significance of carbon-and oxygen-isotope stratigraphy of marine Triassic–Jurassic boundary sections in SW Britain. J. Geol. Soc. 166, 431–445. doi:10.1144/0016-76492007-177
Kovács, E. B., Ruhl, M., Demény, A., Fórizs, I., Hegyi, I., Horváth-Kostka, Z. R., et al. (2020). Mercury anomalies and carbon isotope excursions in the Western Tethyan Csővár section support the link between CAMP volcanism and the end-Triassic extinction. Glob. Planet. Change 194, 103291. doi:10.1016/j.gloplacha.2020.103291
Kuroda, J., Hori, R. S., Suzuki, K., Grocke, D. R., and Ohkouchi, N. (2010). Marine osmium isotope record across the triassic-jurassic boundary from a pacific pelagic site. Geology 38, 1095–1098. doi:10.1130/g31223.1
Longridge, L. M., Carter, E. S., Smith, P. L., and Tipper, H. W. (2007). Early hettangian ammonites and radiolarians from the queen Charlotte Islands, British columbia and their bearing on the definition of the triassic–jurassic boundary. Palaeogeogr. Palaeoclimatol. Palaeoecol. 244, 142–169. doi:10.1016/j.palaeo.2006.06.027
Maher, B. A., Prospero, J. M., Mackie, D., Gaiero, D., Hesse, P. P., and Balkanski, H. (2010). Global connections between aeolian dust, climate and ocean biogeochemistry at the present day and at the last glacial maximum. Earth-science Rev. 99, 61–97. doi:10.1016/j.earscirev.2009.12.001
Mahowald, N. M., Muhs, D. R., Levis, S., Rasch, P. J., Yoshioka, M., Zender, C. S., et al. (2006). Change in atmospheric mineral aerosols in response to climate: Last glacial period, preindustrial, modern, and doubled carbon dioxide climates. J. Geophys. Res. 111. doi:10.1029/2005jd006653
Mander, L., Kürschner, W. M., and McElwain, J. C. (2013). Palynostratigraphy and vegetation history of the triassic–jurassic transition in east Greenland. J. Geol. Soc. 170, 37–46. doi:10.1144/jgs2012-018
Marzoli, A., Bertrand, H., Youbi, N., Callegaro, S., Merle, R., Reisberg, L., et al. (2019). The central atlantic magmatic province (CAMP) in Morocco. J. Petrol. 60, 945–996. doi:10.1093/petrology/egz021
Marzoli, A., Renne, P. R., Piccirillo, E. M., Ernesto, M., Bellieni, G., and De Min, A. (1999). Extensive 200-million-year-old continental flood basalts of the central atlantic magmatic province. Science 284, 616–618. doi:10.1126/science.284.5414.616
Matsuda, T., and Isozaki, Y. (1991). Well-documented travel history of mesozoic pelagic chert in Japan: From remote ocean to subduction zone. Tectonics 10, 475–499. doi:10.1029/90tc02134
McElwain, J. C., Popa, M. E., Hesselbo, S. P., Haworth, M., and Surlyk, F. (2007). Macroecological responses of terrestrial vegetation to climatic and atmospheric change across the triassic/jurassic boundary in east Greenland. Paleobiology 33, 547–573. doi:10.1666/06026.1
McGee, D., Broecker, W. S., and Winckler, G. (2010). Gustiness: The driver of glacial dustiness? Quatern. Sci. Rev. 29, 2340–2350. doi:10.1016/j.quascirev.2010.06.009
Murray, R. W. (1994). Chemical criteria to identify the depositional environment of chert: General principles and applications. Sediment. Geol. 90 (3-4), 213–232. doi:10.1016/0037-0738(94)90039-6
Murray, R. W., Jones, D. L., and Brink, M. R. B. T. (1992b). Diagenetic formation of bedded chert: Evidence from chemistry of the chert-shale couplet. Geology 20 (3), 271–274. doi:10.1130/0091-7613(1992)020<0271:dfobce>2.3.co;2
Murray, R. W., Leinen, M., and Isern, A. R. (1993). Biogenic flux of Al to sediment in the central equatorial pacific ocean: Evidence for increased productivity during glacial periods. Paleoceanography 8, 651–670. doi:10.1029/93pa02195
Murray, R. W., Ten Brink, M. R. B., Gerlach, D. C., Russ, G. P., and Jones, D. L. (1992a). Rare Earth, major, and trace element composition of Monterey and DSDP chert and associated host sediment: Assessing the influence of chemical fractionation during diagenesis. Geochimica Cosmochimica Acta 56 (7), 2657–2671. doi:10.1016/0016-7037(92)90351-i
Oda, H., and Suzuki, H. (2000). Paleomagnetism of triassic and jurassic red bedded chert of the Inuyama area, central Japan. J. Geophys. Res. 105, 25743–25767. doi:10.1029/2000jb900267
Okada, Y., Hori, R. S., Ikeda, M., and Ikehara, M. (2015). Geochemical study of Panthalassa deepsea sedimentary rocks across the triassic-jurassic boundary. News Osaka Micropaleontol. Spec. 15, 219–232.
Olsen, P. E., Kent, D. V., Sues, H-D., Koeberl, C., Huber, H., Montanari, A., et al. (2002). Ascent of dinosaurs linked to an iridium anomaly at the triassic-jurassic boundary. Science 296, 1305–1307. doi:10.1126/science.1065522
Orchard, M. J. (2007). A proposed carnian-norian boundary GSSP at black bear ridge, northeast British columbia, and a New conodont framework for the boundary interval. Albertiana 36, 130–141.
Pálfy, J., Demény, A., Haas, J., Carter, E. S., Görög, Á., Halász, D., et al. (2007). Triassic–Jurassic boundary events inferred from integrated stratigraphy of the Csővár section, Hungary. Palaeogeogr. Palaeoclimatol. Palaeoecol. 244, 11–33. doi:10.1016/j.palaeo.2006.06.021
Pálfy, J., and Zajzon, N. (2012). Environmental changes across the Triassic–Jurassic boundary and coeval volcanism inferred from elemental geochemistry and mineralogy in the Kendlbachgraben section (Northern Calcareous Alps, Austria). Earth Planet. Sci. Lett. 335, 121–134. doi:10.1016/j.epsl.2012.01.039
Parrish, J. T., Rasbury, E. T., Chan, M. A., and Hasiotis, S. T. (2019). Earliest jurassic U-Pb ages from carbonate deposits in the Navajo sandstone, southeastern Utah, USA. Geology 47, 1015–1019. doi:10.1130/G46338.1
Peucker-Ehrenbrink, B., and Ravizza, G. (2000). The marine osmium isotope record. Terra nova. 12 (5), 205–219. doi:10.1046/j.1365-3121.2000.00295.x
Pott, C., and McLoughlin, S. (2009). Bennettitalean foliage in the rhaetian–bajocian (latest triassic–middle jurassic) floras of scania, southern Sweden. Rev. Palaeobot. Palynol. 158, 117–166. doi:10.1016/j.revpalbo.2009.08.004
Raup, D. M., and Sepkoski, J. J. (1982). Mass extinctions in the marine fossil record. Science 215, 1501–1503. doi:10.1126/science.215.4539.1501
Rea, D. K., Hovan, S. A., and Janecek, T. R. (1994). “Late quaternary flux of eolian dust to the pelagic ocean,” in Geomaterial fluxes, glacial to recent (Washington DC: National Academy Press).
Reader, M. C., Fung, I., and McFarlane, N. (1999). The mineral dust aerosol cycle during the last glacial maximum. J. Geophys. Res. 104, 9381–9398. doi:10.1029/1999jd900033
Sato, T., Isozaki, Y., Shozugawa, K., Seimiya, K., and Matsuo, M. (2012). 57Fe mössbauer analysis of the upper triassic-lower jurassic deep-sea chert: Paleo-redox history across the triassic-jurassic boundary and the toarcian oceanic anoxic event. Hyperfine Interact. 208, 95–98. doi:10.1007/s10751-011-0520-4
Schaller, M. F., Wright, J. D., and Kent, D. V. (2011). Atmospheric Pco2 perturbations associated with the central atlantic magmatic province. Science 331, 1404–1409. doi:10.1126/science.1199011
Schaller, M. F., Wright, J. D., Kent, D. V., and Olsen, P. E. (2012). Rapid emplacement of the central atlantic magmatic province as a net sink for CO2. Earth Planet. Sci. Lett. 323-324, 27–39. doi:10.1016/j.epsl.2011.12.028
Schaltegger, U., Guex, J., Bartolini, A., Schoene, B., and Ovtcharova, M. (2008). Precise U–Pb age constraints for end-triassic mass extinction, its correlation to volcanism and hettangian post-extinction recovery. Earth Planet. Sci. Lett. 267, 266–275. doi:10.1016/j.epsl.2007.11.031
Schoene, B., Guex, J., Bartolini, A., Schaltegger, U., and Blackburn, T. J. (2010). Correlating the end-triassic mass extinction and flood basalt volcanism at the 100 ka level. Geology 38, 387–390. doi:10.1130/G30683.1
Schoepfer, S. D., Shen, J., Sano, H., and Algeo, T. J. (2022). Onset of environmental disturbances in the Panthalassic Ocean over one million years prior to the Triassic-Jurassic boundary mass extinction. Earth-Science Rev. 224, 103870. doi:10.1016/j.earscirev.2021.103870
Shen, J., Yin, R., Algeo, T. J., Svensen, H. H., and Schoepfer, S. D. (2022). Mercury evidence for combustion of organic-rich sediments during the end-Triassic crisis. Nat. Commun. 13 (1), 1307. doi:10.1038/s41467-022-28891-8
Shibuya, H., and Sasajima, S. (1986). Paleomagnetism of red cherts: A case study in the Inuyama area, central Japan. J. Geophys. Res. 91, 14105. doi:10.1029/jb091ib14p14105
Sugiyama, K. (1997). Triassic and lower jurassic radiolarian biostratigraphy in the siliceous claystone and bedded chert units of the southeastern Mino Terrane, central Japan. Bull. Mizunami Foss. Mus. 24, 79–193.
Sun, J., Zhang, M., and Liu, T. (2001). Spatial and temporal characteristics of dust storms in China and its surrounding regions, 1960-1999: Relations to source area and climate. J. Geophys. Res. 106, 10325–10333. doi:10.1029/2000jd900665
Tada, R. (1991). Compaction and cementation in siliceous rocks and their possible effect on bedding enhancement. Cycles and events in stratigraphy. Available at: https://ci.nii.ac.jp/naid/10020375022/.
Tanner, L. H., Lucas, S. G., and Chapman, M. G. (2004). Assessing the record and causes of late triassic extinctions. Earth-Science Rev. 65, 103–139. doi:10.1016/S0012-8252(03)00082-5
Thibodeau, A. M., Ritterbush, K., Yager, J. A., West, A. J., Ibarra, Y., Bottjer, D. J., et al. (2016). Mercury anomalies and the timing of biotic recovery following the end-Triassic mass extinction. Nat. Commun. 7 (1), 11147. doi:10.1038/ncomms11147
Tipper, H. W., and Guex, J. (1994). Preliminary remarks on the hettangian ammonite succession in queen Charlotte Islands, British columbia. Geobios . Memoire Spec. 27, 477–483. doi:10.1016/S0016-6995(94)80169-X
Vajda, V., and Bercovici, A. (2014). The global vegetation pattern across the cretaceous–paleogene mass extinction interval: A template for other extinction events. Glob. Planet. Change 122, 29–49. doi:10.1016/j.gloplacha.2014.07.014
Ward, P. D., Garrison, G. H., Haggart, J. W., Kring, D. A., and Beattie, M. J. (2004). Isotopic evidence bearing on Late Triassic extinction events, Queen Charlotte Islands, British Columbia, and implications for the duration and cause of the Triassic/Jurassic mass extinction. Earth Planet. Sci. Lett. 224, 589–600. doi:10.1016/j.epsl.2004.04.034
Ward, P. D., Garrison, G. H., Williford, K. H., Kring, D., Goodwin, D., Beattie, M., et al. (2007). The organic carbon isotopic and paleontological record across the Triassic– Jurassic boundary at the candidate GSSP section at Ferguson Hill, Muller Canyon, Nevada, USA. Palaeogeogr. Palaeoclimatol. Palaeoecol. 244, 281–289. doi:10.1016/j.palaeo.2006.06.042
Ward, P. D., Haggart, J. W., Carter, E. S., Wilbur, D., Tipper, H. W., and Evans, T. (2001). Sudden productivity collapse associated with the triassic-jurassic boundary mass extinction. Science 292, 1148–1151. doi:10.1126/science.1058574
Washington, R., Todd, M. C., Engelstaedter, S., Mbainayel, S., and Mitchell, F. (2006). Dust and the low-level circulation over the bodélé depression, Chad: Observations from BoDEx 2005. J. Geophys. Res. 111, D03201. doi:10.1029/2005jd006502
Whiteside, J. H., Olsen, P. E., Kent, D. V., Fowell, S. J., and Et-Touhami, M. (2007). Synchrony between the central atlantic magmatic province and the triassic–jurassic mass-extinction event? Palaeogeogr. Palaeoclimatol. Palaeoecol. 244 (1), 345–367. doi:10.1016/j.palaeo.2006.06.035
Wignall, P. B., and Atkinson, J. W. (2020). A two-phase end-Triassic mass extinction. Earth-Science Rev. 208, 103282. doi:10.1016/j.earscirev.2020.103282
Williams, L. A., Parks, G. A., and Crerar, D. A. (1985). Silica diagenesis, I: Solubility controls. J. Sediment. Res. 55, 301–311.
Williford, K. H., Ward, P. D., Garrison, G. H., and Buick, R. (2007). An extended organic carbon-isotope record across the triassic–jurassic boundary in the queen Charlotte Islands, British columbia, Canada. Palaeogeogr. Palaeoclimatol. Palaeoecol. 244, 290–296. doi:10.1016/j.palaeo.2006.06.032
Winckler, G., Anderson, R. F., Fleisher, M. Q., McGee, D., and Mahowald, N. (2008). Covariant glacial-interglacial dust fluxes in the equatorial pacific and Antarctica. Science 320, 93–96. doi:10.1126/science.1150595
Wotzlaw, J-F., Guex, J., Bartolini, A., Gallet, Y., Krystyn, L., McRoberts, C. A., et al. (2014). Towards accurate numerical calibration of the late triassic: High-precision U-Pb geochronology constraints on the duration of the rhaetian. Geology 42, 571–574. doi:10.1130/G35612.1
Yao, A., Matsuda, T., and Isozaki, Y. (1980). Triassic and jurassic radiolarians from the inuyma area, central Japan. J. Geosci. Osaka City Univ. 23, 135–154.
Yager, J. A., West, A. J., Thibodeau, A. M., Corsetti, F. A., Rigo, M., Berelson, W. M., et al. (2021). Mercury contents and isotope ratios from diverse depositional environments across the Triassic–Jurassic Boundary: towards a more robust mercury proxy for large igneous province magmatism. Earth-Sci. Rev. 223, 103775. doi:10.1016/j.earscirev.2021.103775
Keywords: Triassic–Jurassic, bedded chert, eolian dust, Pangea, Panthalassa, Central Atlantic magmatic province
Citation: Ikeda M, Cho T and Bôle M (2023) Did changes in terrigenous components of deep-sea cherts across the end-Triassic extinction relate to Central Atlantic magmatic province volcanism?. Front. Earth Sci. 11:1185241. doi: 10.3389/feart.2023.1185241
Received: 13 March 2023; Accepted: 16 June 2023;
Published: 17 July 2023.
Edited by:
Tianchen He, Hohai University, ChinaReviewed by:
Alexandra Abrajevitch, Institute of Tectonics and Geophysics named after Y. A. Kosygin (RAS), RussiaWolfram Michael Kürschner, University of Oslo, Norway
Copyright © 2023 Ikeda, Cho and Bôle. This is an open-access article distributed under the terms of the Creative Commons Attribution License (CC BY). The use, distribution or reproduction in other forums is permitted, provided the original author(s) and the copyright owner(s) are credited and that the original publication in this journal is cited, in accordance with accepted academic practice. No use, distribution or reproduction is permitted which does not comply with these terms.
*Correspondence: Masayuki Ikeda, aWtlZGEubWFzYXl1a2lAZXBzLnMudS10b2t5by5hYy5qcA==