 Melina Sinner1,2,3
 Wei Li Hong4
 Loïc N. Michel5†
 Sunil Vadakkepuliyambatta6
 Jochen Knies7,8
 Arunima Sen9,10*
- 1National Oceanography Center, University of Southampton, Southampton, United Kingdom
- 2Plentzia Marine Station, University of the Basque Country, Plentzia, Spain
- 3Faculty of Sciences, University of Liège, Liège, Belgium
- 4Department of Geological Sciences, Stockholm University, Stockholm, Sweden
- 5Centre national de la recherche scientifique (CNRS), Ifremer, UMR6197 BEEP (Biologie et Ecologie des Ecosystèmes marins Profonds), University Brest, Plouzané, France
- 6National Centre for Polar and Ocean Research (NCPOR), Ministry of Earth Sciences, Government of India, Vasco-da-Gama, Goa, India
- 7Geological Survey of Norway, Trondheim, Norway
- 8iC3: The Centre for ice, Cryosphere, Carbon, and Climate, The Department of Geosciences, UiT The Arctic University of Norway, Tromsø, Norway
- 9Department of Arctic Biology, The University Centre in Svalbard, Longyearbyen, Norway
- 10Department of Bioscience and Aquaculture, Nord University, Bodø, Norway
We used high-resolution imagery within a Geographic Information System (GIS), free gas and porewater analyses and animal bulk stable isotope measurements to characterize the biotic and abiotic aspects of the newly discovered Vestbrona Carbonate Field (VCF) seep site on the Norwegian shelf (63°28′N, 6° 31′E, ∿270 m water depth). Free gas was mainly composed of microbial methane. Sediment porewater sulfide concentrations were in the millimolar range and thus high enough to sustain seep chemosymbiotrophic animals. Nonetheless, the VCF lacked chemosymbiotrophic animals despite an abundance of methane-derived carbonate crusts which are formed by the same anaerobic processes that sustain chemosymbiotrophic animals at seeps. Furthermore, none of the sampled taxa, across various trophic guilds exhibited a detectable contribution of chemosynthetically fixed carbon to their diets based on bulk stable isotope values, suggesting a predominantly photosynthetic source of carbon to the VCF seep food web. We link the absence of chemosymbiotrophic animals to highly localized methane flow pathways, which may act as a “shunt-bypass” of the anaerobic oxidation of methane (AOM) and by extension sulfide generation, thus leading to sediment sulfide concentrations that are highly heterogeneous over very short lateral distances, inhibiting the successful colonization of chemosymbiotrophic animals at the VCF seep. Instead, the seep hosted diverse biological communities, consisting of heterotrophic benthic fauna, including long lived taxa, such as soft corals (e.g., Paragorgia arborea) and stony corals (i.e., Desmophyllum pertusum, formerly known as Lophelia pertusa). Compared to the surrounding non-seep seafloor, we measured heightened megafaunal density at the seep, which we attribute to increased habitat heterogeneity and the presence of a variety of hard substrates (i.e., methane-derived authigenic carbonates, dropstones and coral rubble), particularly since the most abundant taxa all belonged to the phylum Porifera. Compared to the surrounding non-seep seafloor, marine litter was denser within the VCF seep, which we link to the more variable local topography due to authigenic carbonates, which can rip off parts of bottom trawling nets thereby making the seep act as catchment area for marine litter.
1 Introduction
One of the most striking characteristics of the deep sea (below the photic zone, ∿ −200 m) is probably how vast and barren the seafloor appears, seemingly lacking both life-sustaining habitats and life itself. Local fauna is sparse, as food is derived from low quantities of photosynthesis-based material, slowly descending through the water column (Levin and Michener, 2002; Sahling et al., 2003). On the contrary, in areas known as cold seeps, where fluids enriched with reduced compounds and hydrocarbons (predominantly sulfide and methane) escape from the geosphere into the seafloor sediment, chemosynthesis-based carbon fixation can occur, thereby sustaining unique oasis-type ecosystems which act as hotspots for geo-biosphere interactions that provide a local, deep-sea energy source in the otherwise desert-like environment (Carney, 1994; Sibuet and Olu, 1998; Cordes et al., 2010; Levin et al., 2016; Ceramicola et al., 2018). The methane emitted at cold seep fluids may be generated by the microbial transformation of organic deposits in shallow sediments (microbial) or by geological processes occurring at greater depths in the sediment (thermogenic) (Suess, 2010; 2020; Levin et al., 2016; Ceramicola et al., 2018). Both methane and the sulfide generated through its anaerobic oxidation can function as energy sources for chemosynthesis, however, sulfide is highly toxic. Therefore cold seeps usually host low-diversity, high-biomass communities, which stand in contrast to the high-diversity, low-biomass communities of the non-seep background seafloor (Sibuet and Olu, 1998; Levin, 2005).
High latitude (e.g., Arctic and subarctic) seeps have only recently been subject to detailed studies and these have revealed both higher biomass and diversity in comparison to the surrounding benthos, as well as a notable absence of typical seep associated chemosymbiotrophic species such as vestimentiferans and large bodied mollusks (Gebruk et al., 2003; Rybakova et al., 2013; Sen et al., 2018b; 2018a; 2019a; Åström et al., 2018; Vedenin et al., 2020). Instead, communities of northern latitude seeps are often dominated by extensive meadows of chemosymbiotic Oligobrachia frenulate siboglinids (Smirnov, 2000; 2014; Lösekann et al., 2008; Paull et al., 2015; Sen et al., 2018b; Åström et al., 2018; Vedenin et al., 2020) and moniliferans (Sclerolinum contortum) (Gebruk et al., 2003; Lösekann et al., 2008; Rybakova et al., 2013). These are also the only confirmed chemoautotrophic symbiont-bearing animals at all high latitude seeps and are therefore particularly important for the functioning of high latitude seep ecosystems (Sen et al., 2018b; 2018a; 2020). Factors determining their presence or absence are however still under debate. Shallow water seeps tend to host few, if any chemosymbiotrophic animals (Sibuet and Olu, 1998; Sibuet and Olu-Le Roy, 2002; Dando, 2010), however, shallow water depths are no clear indicator of whether high latitude seeps host siboglinids or not, since active seep sites in the Laptev Sea at depths as shallow as 63 m host Oligobrachia siboglinids, whereas active seeps of similar depths (88 m) on the Prins Karls Forland shelf (western Svalbard) do not (Åström et al., 2016; Savvichev et al., 2018; Vedenin et al., 2020). It has been hypothesized that in shallow water areas, hydrographic regimes and associated photosynthetically derived food availability plays a role; productive, Atlantic water, for example, might favor animals that feed on phytodetrital material and select against chemosymbiotic animals, whereas eutrophic, food poorer regions allow for successful colonization by the latter (Åström et al., 2022). Other than oceanographic factors, the presence or absence of siboglinids has been linked to bottom substrate (i.e., a preference for soft muddy sediments) and to the animals’ need for high sulfide flux rates, and not simply high sulfide concentration (Åström et al., 2016; Sen et al., 2018a; 2019a; Vedenin et al., 2020). The interplay of oceanographic, geochemical and geophysical factors together likely determines the faunal inventories of high latitude seeps and whether or not chemosymbiotrophic animals are present.
Here, we address this question by analyzing a seep on the productive Mid-Norwegian continental shelf (63°28′N, 6°31′E), where the combined characteristics of relatively shallow water depth but yet beyond the photic zone (270 m) and high methane flux rates with free gas bubble emissions provide the perfect opportunity to explore these factors in relation to chemosymbiotrophic fauna and subsequent community composition of high latitude seeps. Due to the abundance of extensive methane-derived carbonate crusts at this site, close to the Vestbrona Volcanic province (Bugge et al., 1980), we refer to it as the Vestbrona Carbonate Field (VCF). We combined high-resolution imagery within a Geographic Information System (GIS) to characterize this newly discovered high latitude seep site. We additionally carried out free gas and porewater analyses to estimate the life stage and seepage regime of the site. Bulk stable carbon, nitrogen and sulfur isotope ratios measurements were made on opportunistically collected fauna, in order to gain insight into the role of chemosynthetically fixed carbon within the seep food web. We furthermore made semi-quantitative comparisons between the megafaunal community of the cold seep and the adjacent non-seep background area to assess the impact of the seep on local benthic community composition. The fundamental information reported here may be helpful for gaining new insights on seep ecosystems close to the photic zone in northern latitudes and generating new ecological perspectives in the context of marine conservation, sustainable management and exploration in the Norwegian Sea.
2 Methods and materials
2.1 Site location
The Vestbrona Carbonate Field (VCF) seep site is located on the mid-continental shelf of the Norwegian Sea, off the coast of Kristiansund, central Norway, at a water depth of about 270 m (63°28′N, 6°31′E; Figure 1A). In June 2020, we investigated the area with the remotely operated vehicle (ROV) Ægir 6,000 on board the R/V G.O. Sars (University of Bergen). Prior to seafloor inspection, free gas flares were mapped from the ship through acquisition of multibeam bathymetry and water column data using a Kongsberg EM302 system (Figure 1B). The site is characterized by massive carbonate precipitates in a generally hemipelagic environment with sediment largely composed of mud (Figure 2).
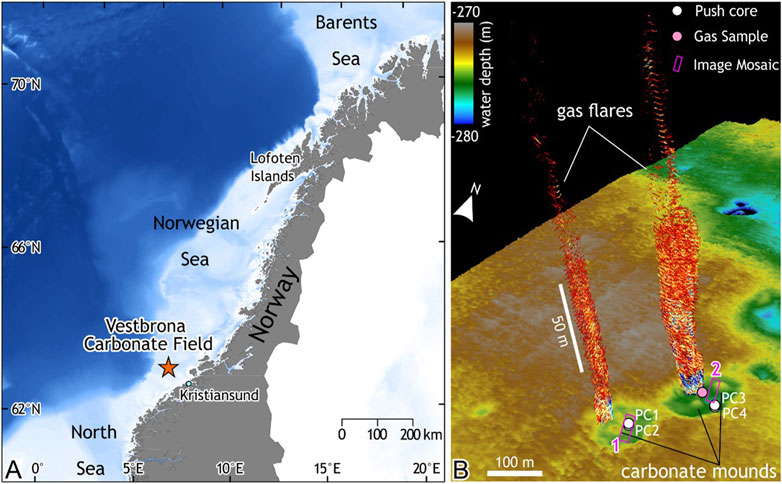
FIGURE 1. The studied Vestbrona Carbonate Field (VCF) seep site and its location. (A) Map of mainland Norway with the location of the VCF seep marked with a star. (B) Bathymetric map (in meters below sea surface) of the VCF and free gas escaping the seafloor into the water column (mapped with the ship based echosounder), ROV mosaicked areas and sampling locations are indicated. Note also carbonate mounds that are clearly visible in the bathymetric map.
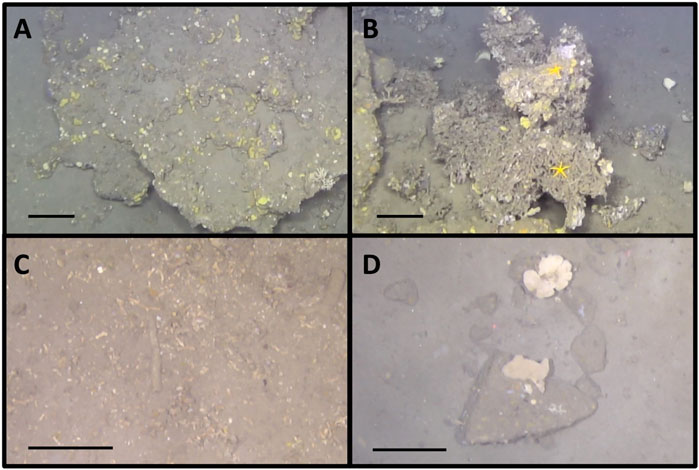
FIGURE 2. (A) Methane-derived carbonate crusts, (B) Dead Desmophyllum pertusum coral (formerly known as Lophelia pertusa), (C) Coral rubble, (D) Dropstones surrounded by soft sediment. Scale bars: 20 cm.
2.2 Video surveys and mosaicking of the VCF seep
A vertical, downward facing high-definition (HD) video camera mounted to the bottom of the ROV was used to map two locations (Mosaic 1: 679 m2 and Mosaic 2: 563 m2) in the VCF where active seepage was observed in the form of small gas flares (bubbling) and microbial mats (Figure 1). The ROV was maintained at an altitude of 2 m above the seafloor and moved slowly at a speed of about 0.5 knots in a lawn mower fashion, to ensure overlap between video lines. Still images were extracted from the video every 2 seconds with the free software FFmpeg (http://ffmpeg.org/) and time stamps were used to obtain the corresponding navigation data from the ROV. Resulting images and navigation files were loaded into Agisoft’s Metashape software (version 1.6.2 build 10247, 2020) to construct two georeferenced mosaics (Figure 3).
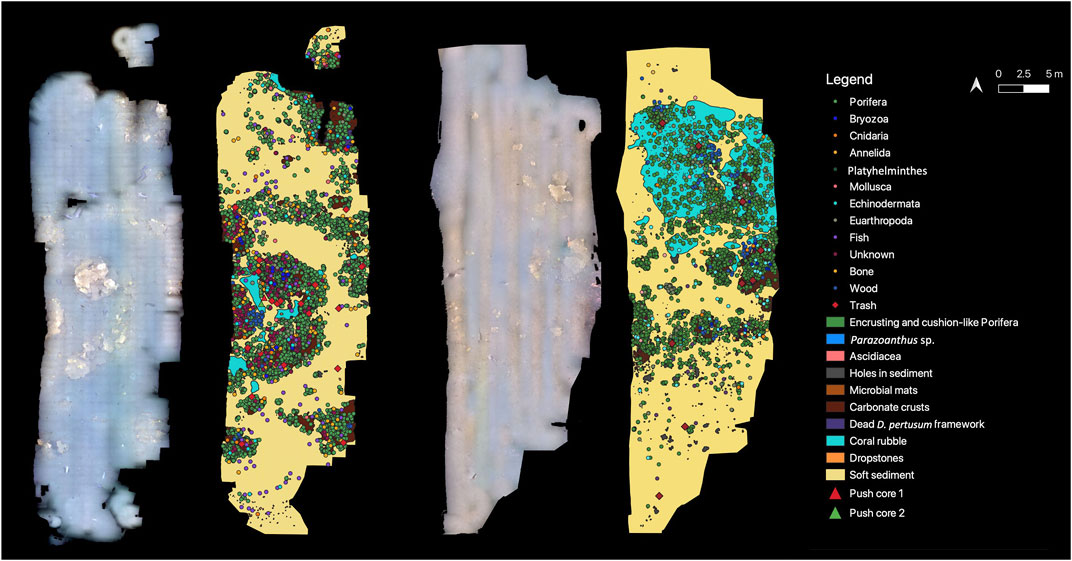
FIGURE 3. Georeferenced mosaics M1 and M2 with all visible features digitized. Note that taxa at the phylum level are presented here to enhance visualization, but numbers for individual taxa are in Table 1. Additionally all mosaic (and transect) data are published in GBIF (Sinner et al., 2023).
2.3 GIS based community characterization
All visible features (i.e., visible to the naked eye), such as animals (hereafter referred to as ‘megafauna’), microbial mats, litter and substrates were manually marked in ArcGIS Pro 2.6.0 via the Editor tool in the two georeferenced mosaics (Figure 3). Individuals were marked as point feature classes, whereas colonial animals, encrusting sponges and substrates were outlined using the polygon feature class. Classification was based on visible morphology and made to the lowest possible taxonomic level. Both the size of megafauna and the resolution of seafloor images did not always allow for identification of taxa to species-level. Therefore, our faunal inventory consists of groups based on taxonomic ranks ranging from species to class. Biological features (e.g., sponges) that could not be assigned to any taxon due to high levels of morphological plasticity between and within species, were classified as “morphotypes”, with some morphotypes possibly including several species. Some organisms could not be assigned to any specific phylum and were thus classified as ‘Unknown’. A variety of fish were observed and marked in both mosaics. Most of them were clearly demersal and swimming rather slowly just above the seabed or appeared completely immobile which allowed for reliable quantification. However, Atlantic Cod (Gadus morhua) was seen swimming slightly higher in the water column and was highly motile, making it difficult to effectively enumerate. This species was thus only included in species counts, but not in the statistical analyses.
Similarly, the 5 different substrate types (carbonate crusts, soft sediment, dead Desmophyllum pertusum, coral rubble and dropstones; Figure 2) were at times difficult to differentiate either due to overlap (e.g., corals growing on hard substrates) or due to image quality. Identification was made as best as possible and for the most part, texture differences or angled corners were clearly visible enough to distinguish between the different substrates.
2.4 Data analyses
Densities for all taxa were calculated based on the spatial extents of the two mosaics. Colonies of individuals (i.e., Ascidiacea, small living D. pertusum colonies and Parazoanthus sp.) were considered as individuals to calculate densities. Average megafaunal density, taxa richness (S), Pielou’s evenness (J), and Shannon’s diversity (H) were calculated from density data for each substrate across both mosaics to obtain integral community characteristics. As the Shannon index (H) in itself does not give any information on true diversity of the community and as its entropy is highly nonlinear, the effective number of species (ENS) was additionally calculated from all Shannon indices (exp(H)) (Jost, 2006).
Density data was square root transformed to reduce the impact of highly abundant taxa (e.g., sponges) and the similarity between “hard” (i.e., carbonate crusts, dead D. pertusum, dropstones) and ‘unconsolidated’ (i.e., coral rubble, soft sediment) substrates was estimated using the Bray-Curtis index. Non-metric multidimensional scaling (nMDS) was used to reveal separate groups and results were verified through an analysis of similarity (ANOSIM). Finally, contributions of the different morphotaxa to the dissimilarity between substrates was investigated through a similarity percentage analysis (SIMPER). All data analyses and data visualizations were performed in R with the packages “vegan” version 2.5–7 (Oksanen et al., 2022), “ggplot2” version 3.3.5 (Wickham et al., 2023), “ggpubr” version 0.4.0 (Kassambara, 2023) and “ggsci” version 2.9 (Xiao et al., 2023).
2.5 Gas and porewater analyses
Free gas was sampled with a gas sampler by the ROV near Mosaic 1. In addition, two push cores within Mosaic 1 (PC1-2) and two adjacent to Mosaic 2 (PC3-4) (see Figure 1 for locations), were taken and sampled immediately after recovery on deck. For methane (CH4) headspace analyses in the pore water samples, holes with a diameter of 1.5 cm were drilled into the plastic liner at intervals up to 5 cm (2 cm–26 cm), starting at the sediment-water interface. It should be noted however, that only three samples could be taken for PC4 (at 2 cm and 5 cm depth) and one for PC1 (at 24 cm). Sediment plugs of 3 ml were taken using a 5 ml syringe with the luer tip removed. Each sediment sample was transferred to a 20 ml serum vial containing 2 glass beads and 6 ml NaOH (2.5%) to prevent microbial degradation. The vial was immediately closed with a septum and an aluminum crimp seal and stored at 4°C until further analyses.
Stable carbon isotopes of methane (C1) and ethane (C2), as well as hydrogen isotopes of methane were analysed at Hydroisotop GmbH, Germany. For the analyses an aliquot of the free and headspace gas was taken with a 10 ml gastight syringe and injected into 20 ml headspace vial filled with helium (He). In the purge&trap autosampler (MessTechnik GmbH) the content of the bottle is flushed with He and trapped 20 min on the absorption material at −120°C. After fast heating up to 200°C the gas mixture was transferred to the GC–MS – IRMS system (Thermo Fischer Scientific GmbH). The GC (Trace Ultra) separates C1-C4 gases from each other which were then transferred to the combustion/pyrolysis interface for conversion of hydrocarbons to CO2 or H2 for carbon and hydrogen stable isotope measurements using an isotope ratio mass-spectrometer (IRMS, DeltaV Advantage). The isotopic composition (δ13C and δ2H) is reported in ‰ (δ-values) against the international standards Vienna Pee Dee Belemnite (VPDB) for carbon and Vienna Standard Mean Ocean Water (VSMOW) for hydrogen, according to the following equations:
Porewater samples for sulfide (ΣHS = H2S + HS− + S2) concentrations were taken at a ∿2-cm-depth resolution (2 cm–39 cm) along the length of PC1 and PC4, starting at the sediment-water interface. Porewater was extracted in a temperature-controlled room (4°C) with acid-washed rhizon samplers and syringes, and 0.5–2 ml of porewater was preserved with Zn(OAc)2 onboard (<30 min after rhizons were disconnected) for further analyses in the lab. Samples were kept frozen all the time until analyses were conducted. The concentrations of total dissolved sulfide (ΣHS = H2S + HS− + S2) were determined by the iodometric method (US Environmental Protection Agency, method 9030 and Pawlak and Pawlak, 1999). Before the analyses, samples were centrifuged for 5–7 min at 2000 rpm to separate the ZnS precipitates from the residual porewater. The supernatant fluid was pipetted and discarded as it may contain other reductants (such as dissolved organic carbon species) that may react with I2 and affect the results. The remaining ZnS precipitates were washed into a glass beaker with ca. 2 mL of 18Ω Milli-Q water for titration. Iodine (I2) solution of ca. 14 mM was added (0.2 mL). Aliquots of starch solution (0.05 mL; prepared every other day) were added as an end-point indicator and 4M HCl was added to ensure a completed reduction of I2 to 2I− by lowering the sample pH with HCl (Pawlak and Pawlak, 1999). The ZnS in the sample then reduces I2 when in contact (ZnS + I2→ 2ZnI + S). We then titrated the residual I2 to calculate the amounts of total sulfide in the samples (i.e., I2-unreacted – I2-residual = ZnSsample). Factory-made 0.00109N Na-thiosulfate (stabilized standard solution, Hach Lot# 2408949) was sequentially diluted 10 times and 100 times and used as titrants. Titrants were added to the sample with an automatic pipette under constant mixing in an open beaker until the purple color faded away as a result of complete I2 reduction. The amounts of titrant were then recorded for the calculation of ZnSsample. As I2 is fairly unstable when exposed to light, its concentration was closely monitored every ca. 30 min during the titration to constrain I2-unreacted. The uncertainty of the measurements was then determined from the two closest I2 measurements before and after the titration of the actual sample. In general, the concentration of I2-unreacted decreased by 0.27 mM every hour. New I2 was used during the same session of analyses if the I2-unreacted concentration was below 85% of its concentration earlier in the session. The Zn-acetate solution used to precipitate out total sulfide was also titrated following the identical protocol to ensure no measurable sulfide remained in it.
2.6 Animal bulk tissue and stable isotope ratio analyses
All attached fauna from two carbonate rocks collected from within Mosaic 1 were retrieved and all organisms, e.g., including sponge fragments, brittle stars, polychaete fragments (Nephtys sp.) and cnidarians were immediately frozen at −20°C after recovery on deck. In the lab, the recovered organisms were freeze-dried in a vacuum chamber for 24 h, then dissected to separate soft and non-metabolically active tissues (e.g., muscle, tegument) or, when body size was small, were used whole (Mateo et al., 2008). They were subsequently ground to a homogeneous powder using mortar and pestle. Samples containing hard inorganic carbon parts that could not be physically removed were acidified by exposing them to HCl vapors for 48 h in an airtight container (Hedges and Stern, 1984). Stable isotope ratio measurements were performed via continuous flow - elemental analysis - isotope ratio mass spectrometry (CF-EA-IRMS) at University of Liège (Belgium), using a vario MICRO cube C-N-S elemental analyzer (Elementar Analysensysteme GMBH, Hanau, Germany) coupled to an IsoPrime100 isotope ratio mass spectrometer (Isoprime, Cheadle, United Kingdom). Isotopic ratios were expressed using the widespread δ notation (Coplen, 2011), in ‰ and relative to the international references Vienna Pee Dee Belemnite (for carbon), atmospheric air (for nitrogen) and Vienna Canyon Diablo Troilite (for sulfur). IAEA (International Atomic Energy Agency, Vienna, Austria) certified reference materials sucrose (IAEA-C-6; δ13C = −10.8 ± 0.5‰; mean ± SD), ammonium sulfate (IAEA-N-2; δ15N = 20.3 ± 0.2‰; mean ± SD) and silver sulfide (IAEA-S-1; δ34S = −0.3‰) were used as primary analytical standards. Sulfanilic acid (Sigma-Aldrich; δ13C = −25.6 ± 0.4‰; δ15N = −0.13 ± 0.4‰; δ34S = 5.9 ± 0.5‰; means ± SD) was used as secondary analytical standard. Standard deviations on multi-batch replicate measurements of secondary and internal lab standards (amphipod crustacean muscle) analyzed interspersed with samples (one replicate of each standard every 15 analyses) were 0.2‰ for both δ13C and δ15N and 0.3‰ for δ34S.
2.7 Background megabenthos community characterization
Three video transects of the non-seep background area were extracted from the ROV video surveys of the surrounding background area. These videos were taken with a forward-facing and slightly downward tilted camera and since this camera setup does not allow for precise areal measurements to be made, georeferenced mosaics could not be constructed in the same manner as within the seep area. Nonetheless, time stamps were used to obtain the corresponding navigation data from the ROV which allowed for approximate areas of the seafloor covered by the transects to be calculated. All visible features (biological and non-biological, as in the two georeferenced mosaics) were counted within each transect and converted to densities based on the approximate area calculations. Diversity indices were then calculated for comparisons with the seep mosaics.
3 Results
3.1 Overall seep community composition
In total, 20,813 individuals/colonies of individuals were enumerated in Mosaic 1 (30.65 ind./m2) and 11,287 in Mosaic 2 (20.05 ind./m2) (Table 1; Figure 3). Forty-nine taxa (i.e., species, genus, family, class, and ‘morphotypes’, including microbial mats) across 9 phyla were identified within the two mosaics: Porifera, Bryozoa, Cnidaria, Annelida, Platyhelminthes, Mollusca, Echinodermata, Arthropoda and Chordata. These, however, are likely underestimates due to the difficulty of identifying fauna from images, the possible presence of cryptic species and some morphotypes possibly including several species. Therefore, the total taxonomic richness of the mosaics is likely higher than the 49 taxa shown in Table 1. The majority of all marked individuals (M1: 95%; M2: 97%) belonged to the phylum Porifera and included most importantly cushion-like orange sponges (possibly of the genus Suberites), globular/irregular white/cream colored sponges (possibly of the genera Geodia and Mycale), encrusting orange sponges (possibly of the genus Hymedesmia), encrusting yellow/orange sponges (possibly of the genus Amphilectus) and foliaceous white/cream colored sponges (possibly of the genera Phakellia and Axinella) (Figure 4). All remaining morphotaxa (i.e., not belonging to the phylum Porifera) together, only accounted for 5% or less of all marked individuals in both mosaics. Sponges were thus by far the most dominant members of the megafaunal community at the VCF seep. Furthermore, besides being extremely abundant, many sponges also displayed considerable sizes and very diverse three-dimensional morphologies (e.g., Phakellia sp., Axinella sp., Geodia sp., glass sponge, Figure 5). Following sponges, the next most numerous taxa were unidentifiable ‘fan’ animals (possibly bryozoans), Munida squat lobsters, Echiurids and Parazoanthus polyps (Figure 6). Among the various taxa identified in the mosaicked area, several also hold commercial value, such as Atlantic cod (G. morhua), common ling (Molva molva) and tusk (Brosme brosme) (Kvangarsnes et al., 2012; Helle et al., 2015; Norwegian Directorate of Fisheries, 2020). Despite this being a seep site, microbial mats appeared rather small (in the range of several cm at the most) and no visible chemosynthesis-based animals such as siboglinid polychaete worms were seen.
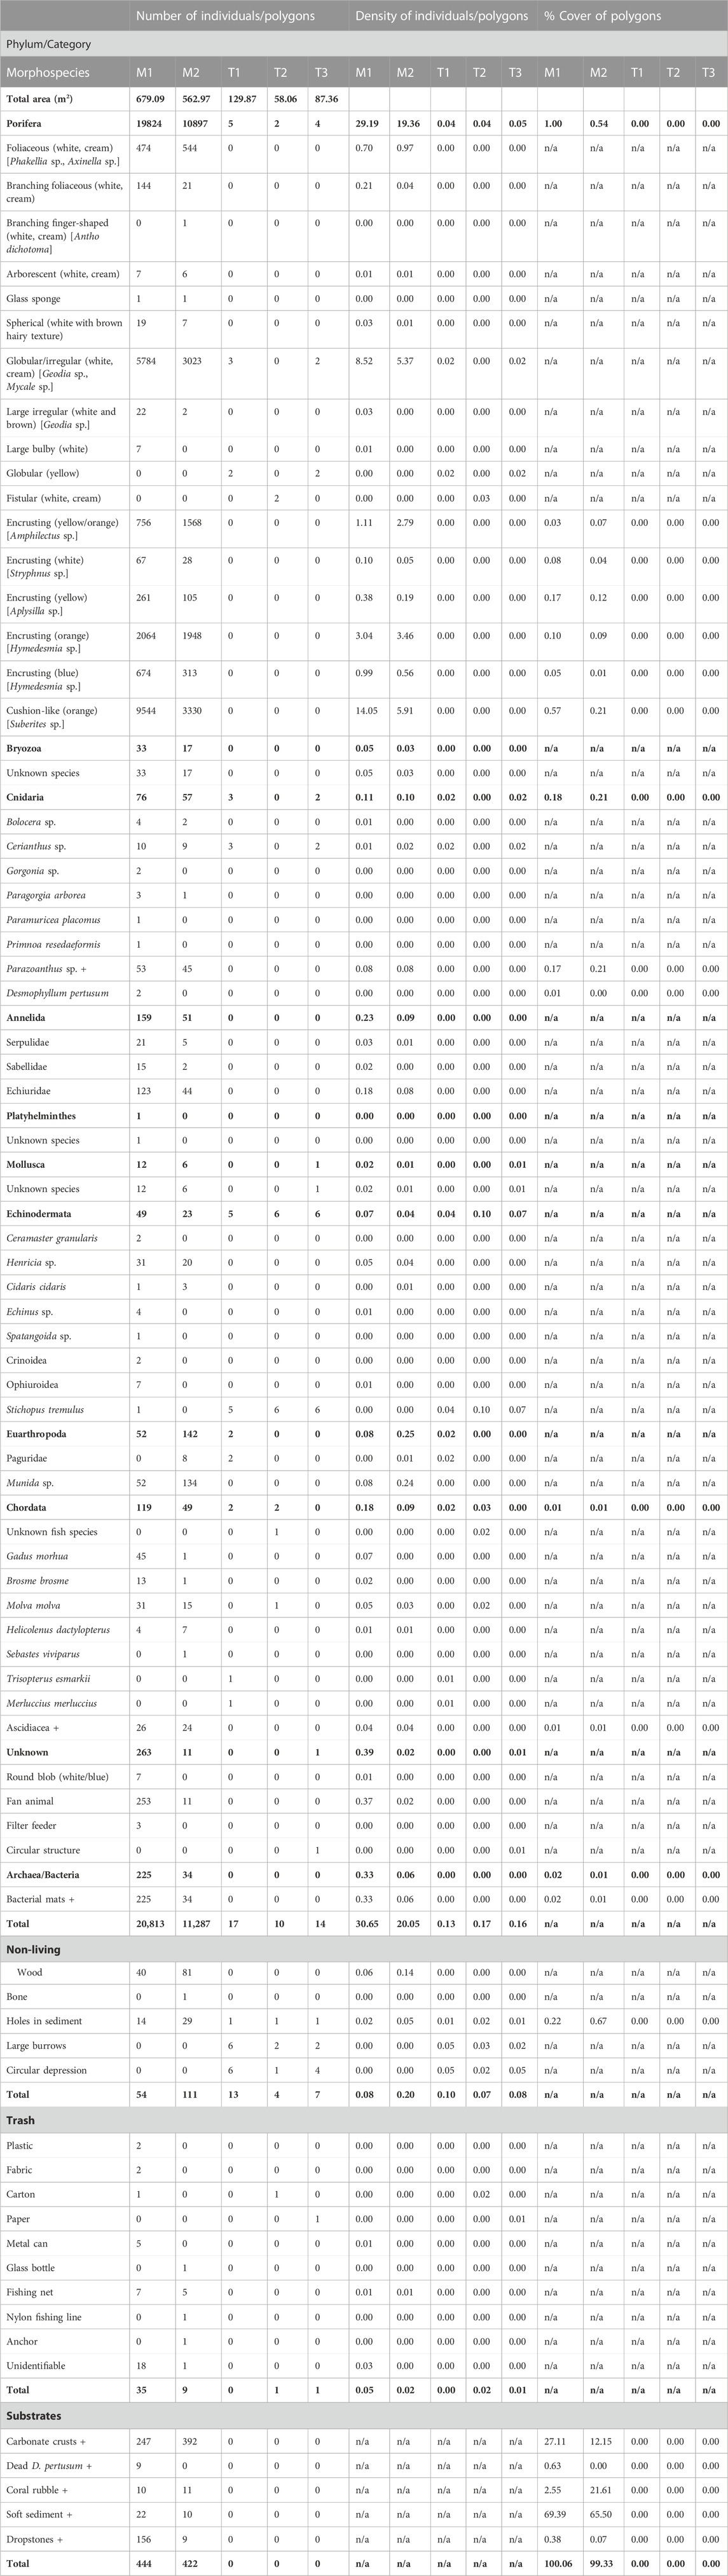
TABLE 1. Community, substrate, and litter observed and marked in the two georeferenced mosaics of the VCF seep (M1 and M2) and transects of the surrounding background area (T1 and T2). For each mosaic/transect, total numbers of individuals/polygons, densities of individuals/polygons and percent cover of polygons with respect to the entire mosaic/transect are listed, first, at the phylum level (in bold), and then for each individual taxon. Density of individuals and polygons are calculated as per square meter, based on the total area of the mosaic/transects (see first entry in the table). Colonial taxa are marked with +. This data are also publicly available at GBIF (Sinner et al., 2023) https://doi.org/10.15468/5vrbbj.
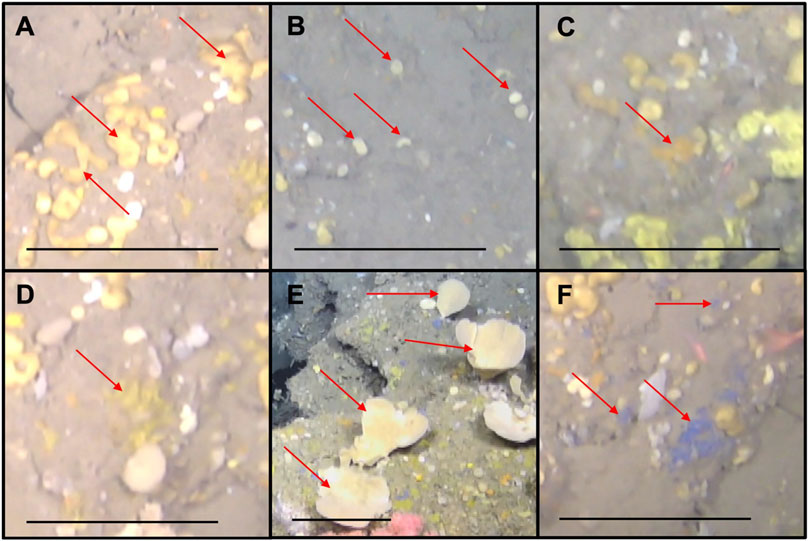
FIGURE 4. Porifera morphotaxa that constituted the majority of all marked individuals in both mosaics. (A) Suberites sp. (cushion-like orange sponge); (B) Geodia sp. and Mycale sp. (globular/irregular white/cream colored sponge); (C) Hymedesmia sp. (encrusting orange sponge); (D) Amphilectus sp. (encrusting yellow/orange sponge); (E) Phakellia sp. and Axinella sp. (foliaceous white/cream colored sponge); (F) Amphilectus sp. (encrusting blue sponge). Scale bars: 20 cm.
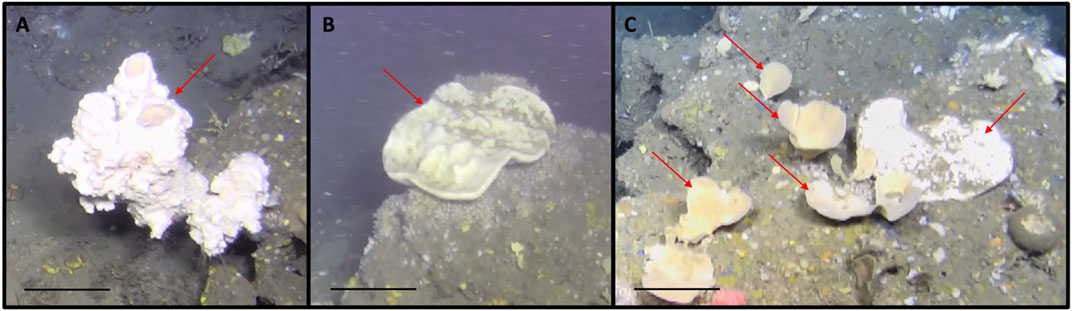
FIGURE 5. Porifera morphotaxa that displayed considerable sizes and diverse three-dimensional morphologies. (A) Glass sponge of unknown genus; (B) Geodia sp. (large irregular white and brown colored sponge); (C) arrows pointing towards the right: Phakellia sp. and Axinella sp. (foliaceous white/cream colored sponge), arrow pointing towards the left: Geodia sp. (large irregular white and brown colored sponge). Scale bars: 20 cm.
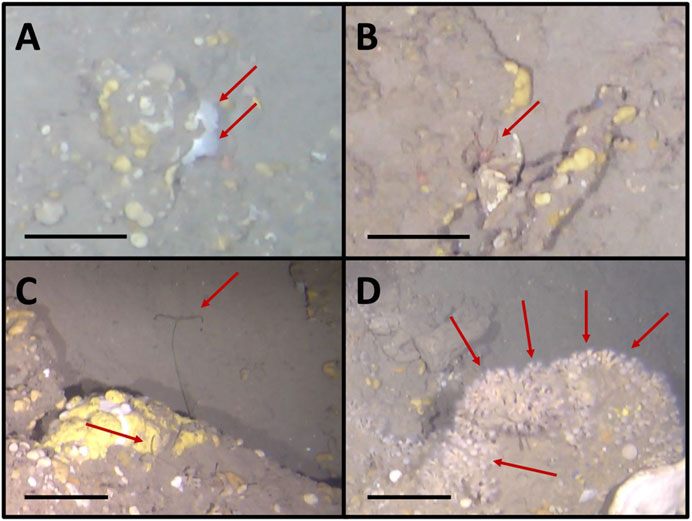
FIGURE 6. Examples of the most abundant taxa after sponges (A) ‘fan’ animals (possibly bryozoans), (B) Munida squat lobsters, (C) Echiurids and (D) Parazoanthus polyps. Scale bars: 20 cm.
3.2 Substrate types and associated communities
Five substrates were observed at the VCF: carbonate crusts, soft sediment, dead D. pertusum, coral rubble and dropstones. Of these, soft sediment made up the largest proportion of the surface area in both mosaics (M1: 69% and M2: 65%) (Table 1). Regarding hard substrata, M1 contained a large amount of carbonate crusts (27% of mosaicked area) but very little coral rubble (3% of mosaicked area), while M2 contained more coral rubble than carbonate crusts (22% and 12% of mosaicked area respectively). Dropstones and dead D. pertusum were less abundant and only accounted for less than 1% each of the total surface area in both mosaics (Table 1).
Based on the nMDS and ANOSIM, the fauna associated with the different substrates was significantly different (R: 0.67; p = 0.03). Faunal assemblages of ‘hard’ (i.e., carbonate crusts, dead D. pertusum, dropstones) were also significantly different from those on ‘unconsolidated’ (i.e., coral rubble, soft sediment) substrates (R: 0.91; p < 0.01) (Figure 7). In terms of megafaunal densities, carbonate crusts were the most highly populated substrate in both mosaics (M1: 108 ind./m2; M2: 135 ind./m2), dominated however, by extremely high numbers of sponges (e.g., the cushion-like orange sponge or the globular/irregular white/cream colored sponge) leading to low taxa evenness and thus only intermediate diversity values compared to the other substrates (Table 2). Nonetheless, carbonate crusts hosted the absolute majority of all marked individuals (M1: 95%; M2: 82%), as well as the majority (M1: 91%; M2:89%) of all morphotaxa identified in both mosaics. In contrast, soft sediment, which dominated both mosaics, hosted only 3%–4% of all marked individuals and 57%–60% of all morphotaxa identified. While the taxonomic composition on dead D. pertusum (M1: 58 ind./m2) and dropstones (M1: 55 ind./m2; M2: 80 ind./m2) was similar to that on carbonate crusts (66% and 60% similarity respectively) (Table 3), megafauna was only about half as dense and diversity values were comparatively low. Megafaunal densities were the lowest on coral rubble (M1: 2; M2: 13 ind./m2) and soft sediment (M1: 2; M2: 3 ind./m2), while diversity values were the highest among these two substrates. Community composition was very similar between soft sediment and coral rubble (57%), while similarities in taxonomic composition between soft sediment and most other substrates (i.e., carbonate crusts, dead D. pertusum and dropstones) were very low, ranging from 23% to 27%.
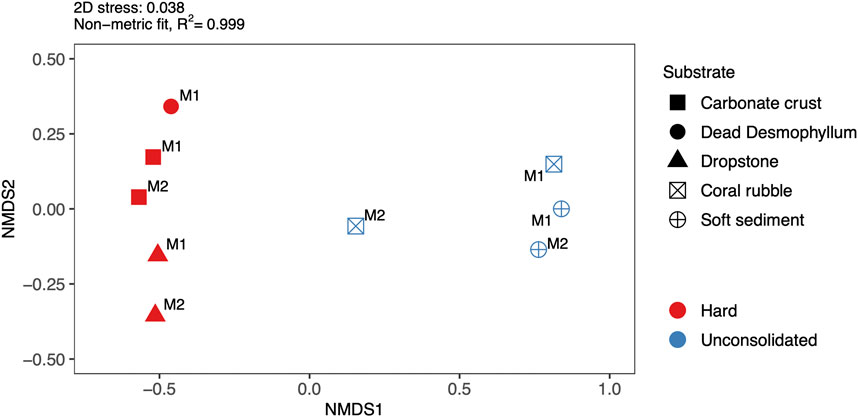
FIGURE 7. Non-metric multidimensional scaling (nMDS) plot of the communities associated with the different substrates (carbonate crust, coral rubble, dead Desmophyllum pertusum, dropstone and soft sediment) in the two mosaics (M1 and M2). ‘Hard’ substrates are indicated with red, filled icons and ‘unconsolidated’ substrates are indicated with blue unfilled icons.
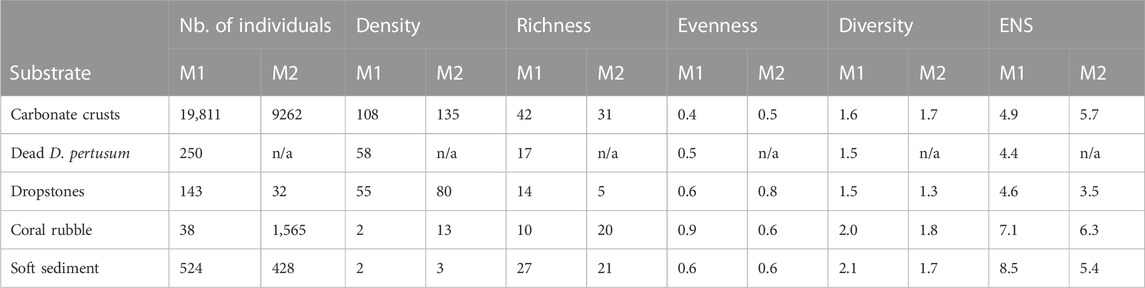
TABLE 2. Total number of individuals, total megafaunal density, taxa richness (S), Shannon’s diversity (H), Pielou’s evenness (J) and effective number of species (ENS) for the different substrates within the two seep mosaics.
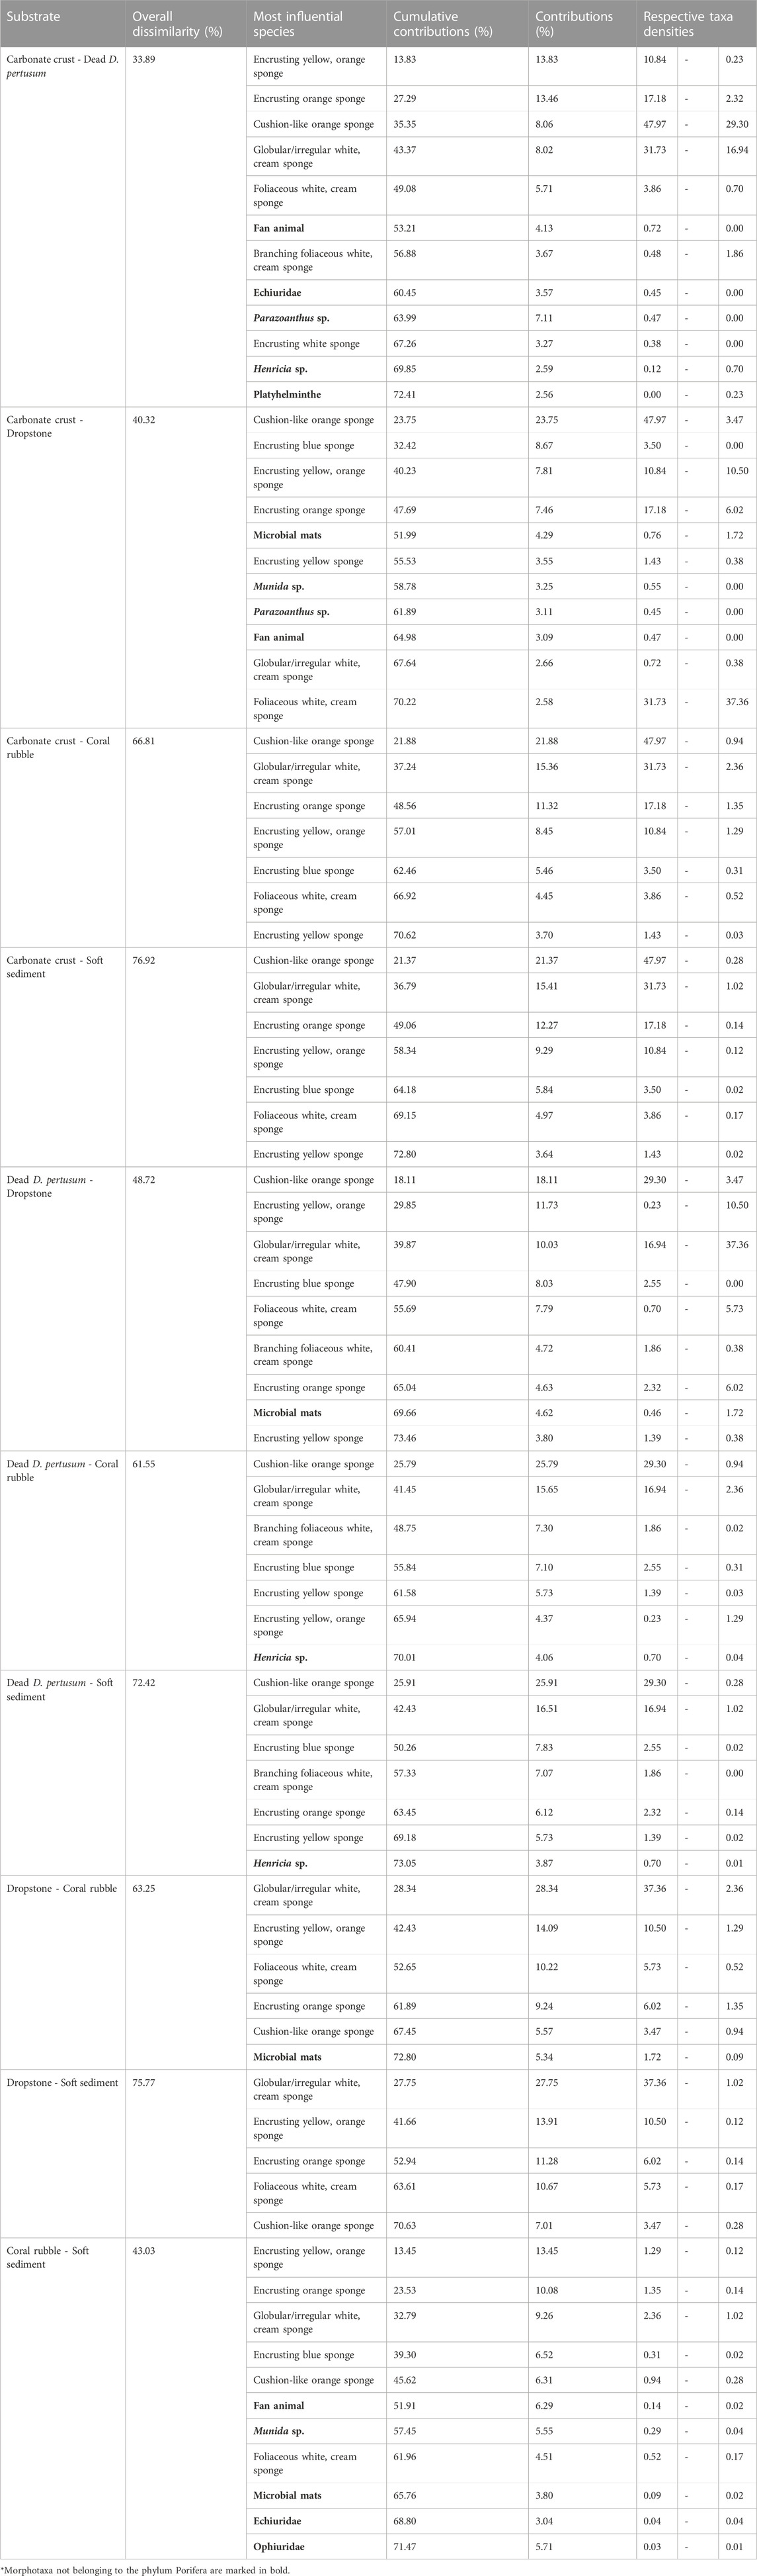
TABLE 3. Similarity percentage (SIMPER) results for average overall dissimilarities in the community assemblages between different substrates. The column “Contributions (%)” contains the three species contributing the most (cut-off at 70% contribution) to the average overall Bray-Curtis dissimilarity between communities.
3.3 Geochemical characteristics of the seep site
Stable carbon and hydrogen isotope analyses were conducted on the free gas samples to assess whether the underlying source of methane was of microbial (−110‰ ≥ δ13C ≥ −50‰ and −400‰ ≥ δD ≥ −150‰) or thermogenic (−50‰ ≥ δ13C ≥ −20‰ and −275‰ ≥ δD ≥ −100‰) origin (Whiticar, 1999). Wetness was measured by the molar ratio of methane to the sum of ethane and propane (C1/(C2+C3)), with wetter gases containing higher amounts of C2+ gases and displaying a low C1/(C2+C3) ratio. Microbial methane tends to be light and dry, whereas thermogenic methane is usually rather heavy and wet (Milkov and Etiope, 2018). The free gas was nearly entirely composed of methane (99.97%) with δ13C-CH4 and δD-CH4 values of −74.4‰ and −194‰ respectively, and with a ratio of methane over ethane and propane of >4,000, appears to be of microbial origin (Figure 8) (Whiticar, 1999; Nicot et al., 2017). Similarly, headspace gas analysis from the push cores also revealed methane of microbial origin (δ13C-CH4: −79.1‰ – −91.7‰; δD-CH4: −189‰ – −215‰ across all push cores). Note that while the δ13C-CH4 values clearly confirm the hydrogenotrophic methanogenesis (CO2-reduction), also in the revised genetic diagram by Milkov and Etiope (2018), the isotopic composition of ethane (d13C-C2H6)of −37.2‰ is well within the thermogenic range (Nakagawa et al., 2003). We suggest two possible pathways to explain this: 1) microbial methanogenesis in shallow sediment as a result of organic matter degradation fueled by methane-seep related biomass or 2) secondary methanogenesis as a result of thermogenic hydrocarbon biodegradation (Stagars et al., 2017) or a combination of both processes. At least, some admixture of thermogenic gas in our free gas sample is evident from the high ethane δ13C value. In push cores PC2 and PC3, low concentrations of methane (3 and 10 µM respectively) were measured shallow in the sediment (2 cm), although concentrations increased downcore, but nonetheless remained below the millimolar range (Figure 9). On the other hand, in both push cores 1 and 4, millimolar concentrations (1.0 and 1.9 mM) of methane were measured at 24 and 2 cm depth respectively. Sulfide concentrations were in the low millimolar range (<0.6 mM) in the first sediment layers (0–3 cm), and rapidly increased downcore, with high millimolar concentrations (max: 1.1 and 1.2 mM respectively) measured across both PC1 and PC4 (Figure 9).
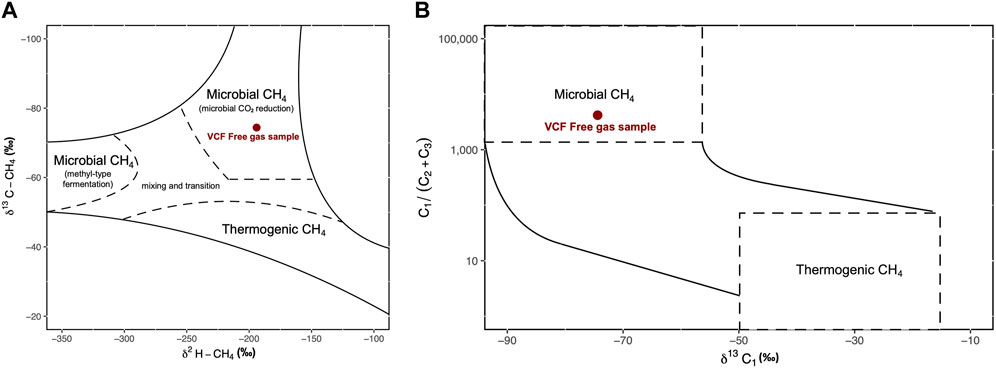
FIGURE 8. (A) Carbon and hydrogen isotopic composition of methane at the time of free gas sampling (adapted from Whiticar, 1999). (B) Ratio of methane (C1) to the higher-chain hydrocarbons ethane (C2) and propane (C3) vs. the δ13C of methane. Curves show mixing lines between thermogenic and microbial end members (dashed areas) (adapted from Sano et al., 2017).
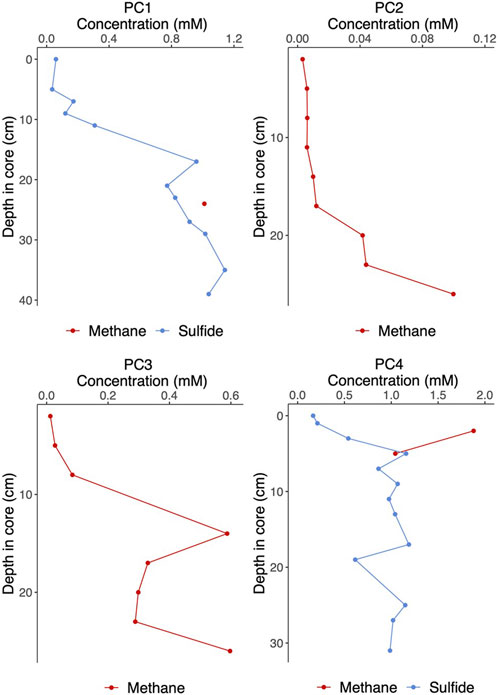
FIGURE 9. Sediment porewater methane and sulfide concentrations in push cores collected from the VCF study site. Push cores 1–2 (PC1 and PC2) were collected from within mosaic 1 (see Figures 1, 3 for locations) and push cores 3–4 (PC3 and PC4) were collected adjacent to mosaic 2 (Figure 1).
3.4 Animal bulk stable isotopes
All δ34S values ranged from 18.9 to 21.6‰ and were slightly lower or similar to ocean sulfate (MacAvoy et al., 2003) (Figure 10A). Bulk-tissue δ13C values varied between −18.3 and −25.8‰, corresponding to the range typically associated with biomass produced through photosynthesis (Hobson et al., 1996; Søreide et al., 2006), while δ15N values ranged between 7.7 and 8.2‰ for sponges, between 8.6 and 9.0‰ for cnidarians, between 9.3 and 9.7‰ for brittle stars and between 11.8 and 13.1‰ for polychaetes (Figure 10B) (All stable isotope data are published open access in SEANOE Sinner et al., 2020). These values are in line with samples belonging to different trophic levels, and food sources, e.g., filter feeding by sponges, deposit feeding by brittle stars and predation and deposit feeding by polychaetes (Fredriksen, 2003; Grall et al., 2006).
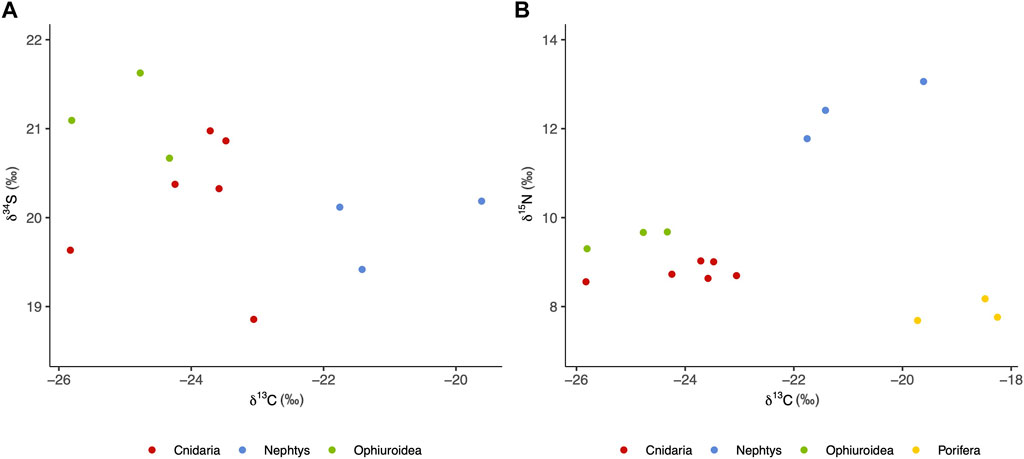
FIGURE 10. Scatterplot of δ34S and δ13C (A) and δ15N and δ13C (B) values of the fauna collected in the study. Porifera samples are not shown in the first plot because δ34S values were below detectable range. Stable isotope data are published and publicly available in SEANOE: https://doi.org/10.17882/95359 (Sinner et al., 2020).
3.5 Background benthos community composition and comparison to the seep community
The three transects outside the seep area contained a total of 12 megafaunal taxa (Table 1) across 6 phyla (Porifera, Cnidaria, Mollusca, Echinodermata, Arthropoda and Chordata). Three phyla (Bryozoa, Annelida and Platyhelminthes), which were seen in the seep mosaics were absent from the background transects. On the other hand, two sponge morphotaxa (yellow globular and white/cream fistular sponges), as well as three fish species (Trisopterus esmarkii, Merluccius merluccius and one fish of unknown genus) were identified in the background area that were not seen in the seep areas. The holothuroid Stichopus tremulus accounted for the majority of all megafauna in the background transects, representing 44% of all marked individuals (T1 – T3 combined). Substrate features included large burrows or circular depressions in the soft sediment and small holes, the latter also being present in the seep mosaics. No hard substrata were recorded in the background transects. Mean megafaunal density as well as total taxa richness were notably lower in the background non-seep transects compared to the seep mosaics (25 ± 7.4 ind./m2 vs. 0.15 ± 0.0 ind./m2 and 48 taxa vs. 12 taxa) (Figure 11). However, while evenness was high in the background area (J: 0.86 ± 0.1) and low in the seep area (J: 0.47 ± 0.1), diversity indices were similar in both areas (H’: 1.73 ± 0.1 in the seep area vs. 1.49 ± 0.4 in the non-seep area), with the true diversity showing 6 ± 0.7 effective species in the seep area and 5 ± 1.6 effective species in the non-seep area.
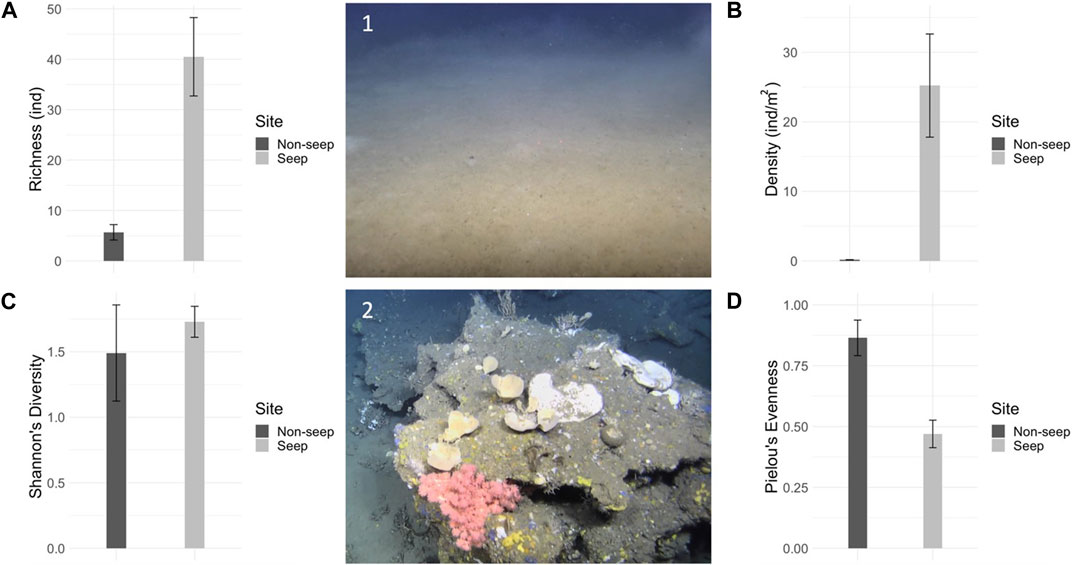
FIGURE 11. Richness and diversity of seep mosaics and non-seep background transects. (A) Taxa richness (S), mean (±s.d.), (B) megafaunal density (individuals/m2), (C) Pielou’s evenness (J), (D) Shannon’s diversity (H) for seep and non-seep (background) sites. 1: Representative image of the non-seep background area, 2: Representative image of the seep site.
3.6 Marine litter
Many instances of human-mediated litter were observed in the seep mosaics (Table 1; Figure 12). In total, 35 and 9 items were marked in M1 and M2 respectively, which consisted predominantly of fishing gear, but also glass, metals, paper, etc. (Figure 12). Fishing nets were the most abundant, with seven nets being marked in M1 and five in M2. Some reached sizes in the order of some square meters and many were entangled in soft corals and other benthic megafauna (Figure 12). Most of the litter did not appear to be particularly degraded, on the contrary, some bottles and cans were still perfectly intact. Considerably lower numbers of human litter items (2 in total) were observed in the transects of the background area outside the VCF seep.
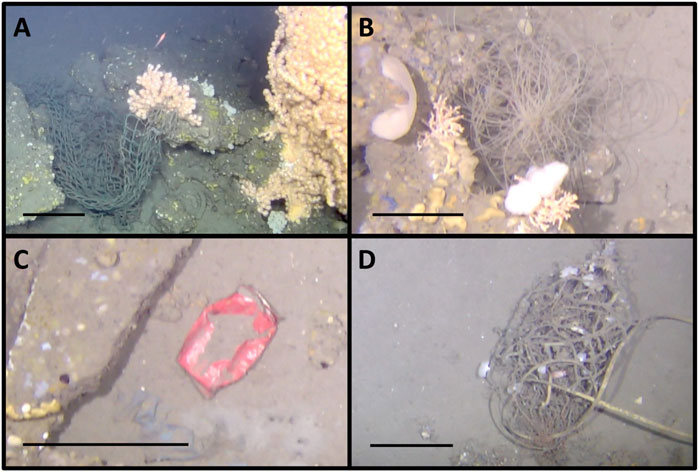
FIGURE 12. Examples of litter observed in the mosaicked areas. (A) Big fishing net entangled in a Paragorgia arborea soft coral; (B) Nylon fishing line entangled in carbonate seep crusts and its epifauna; (C) Soda can; (D) Fishing equipment. Scale bars: 20 cm.
4 Discussion
4.1 Chemosynthesis and nutrition at the VCF seep
Siboglinids dominate high latitude seeps and as chemosymbiotic fauna, they represent the base of the food chain and alter sediment geochemistry, functioning as ecosystem engineers (Levin, 2005; Cordes et al., 2010; Levin et al., 2016). Surprisingly, the VCF site did not contain any siboglinids at all. Low latitude shallow water cold seeps around the world tend to have a lower proportion of obligate taxa and a higher abundance of predators and other background taxa, than their deep water counterparts (Carney, 1994; Sahling et al., 2003; Tarasov et al., 2005; Vanreusel et al., 2009; Dando, 2010; Kiel, 2010). A possible hypothesis for this depth-related trend is that the increased input of photosynthetic organic matter from surface primary production at shallow depths mitigates the need for chemosynthesis as an energy source, even selecting against it and the energetically expensive adaptations it requires (Levin, 2005; Tarasov et al., 2005). Furthermore, shallow seeps are more prone to be invaded by higher levels of carnivorous predators from adjacent habitats, which would be able to efficiently prey on the largely sessile chemosynthesis-based (Carney, 1994; Sahling et al., 2003; Levin, 2005; Tarasov et al., 2005; Dando, 2010). Therefore, the relatively shallow water depth of the VCF site (270 m) could offer an explanation for the lack of siboglinids there. However, paradoxically, siboglinids have been recorded at Arctic seeps at considerably lower water depths (<80 m) (Savvichev et al., 2018; Vedenin et al., 2020). It has been hypothesized that among shallow water locations, the presence or absence of chemosymbiotic animals is linked to surface primary production, such that highly productive regions (with presumably considerable deposition of phytodetrital material to the seafloor) leads to the exclusion of chemosymbiotic animals, whereas more oligotrophic regions with lower levels of phytodetrital deposition favor them (Åström et al., 2022). Based on this, an explanation for the absence of siboglinids from the VCF site could be its location within the highly productive Norwegian Sea.
However, it can also be argued that the VCF site is simply beyond the photic zone where chemosynthesis-based symbioses would be selected against. In this case, other reasons need to be considered for the lack of chemosymbiotic animals at VCF. Since siboglinids are obligately symbiotic with chemosynthetic bacteria, the availability of chemosynthetic energy sources such as methane and sulfide represents a major limiting factor. We mapped two distinct gas flares in the multibeam survey (Figure 1B) and collected bubbling gas via the ROV close to the presence of carbonate crusts. This indicates that seepage is actively occurring at the VCF site. Indeed, we measured methane concentrations reaching up to 1.9 mM as shallow as 2 cm below the sediment-water interface and sulfide concentrations reaching up to 1.2 mM in only 5 cm of depth in the sediments. Therefore, it seems unlikely that sulfide (and methane) concentrations are insufficient to support siboglinids at the VCF site. However, despite sulfide and methane concentrations reaching millimolar concentrations at shallow depths in the sediment, we did observe considerable variation across different push cores. Thus, fluid release and sediment concentrations could be highly heterogeneous over very short lateral distances. Microbial mats were very patchy and small (Figure 13), which further supports the idea of the fluid regime at VCF being characterized by point sources with little lateral diffusion. Sediment heterogeneity (e.g., grain size) can lead to small-scale flow channelization, creating preferential rapid flow channels for methane, decreasing its residence time in the sediment and thus bypassing AOM by methane-consuming microbial communities (Torres et al., 2002; Luff et al., 2004; Mahadevan et al., 2012; Wankel et al., 2012). We did, in fact, observe patches of coarse sediment in the mosaics (Figure 14). The highly localized point sources of methane emission, which can act as a “bypass shunt” of AOM (Wankel et al., 2012) and by extension sulfide generation, may thus be a possible explanation for the absence of siboglinid polychaetes at the VCF seep.
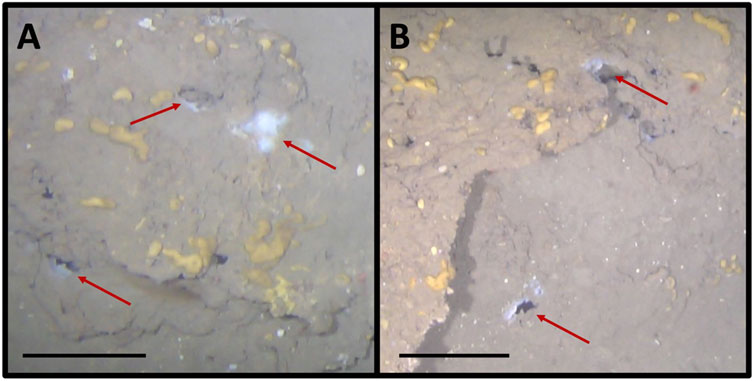
FIGURE 13. (A) and (B): Microbial mats observed at the VCF seep site. Scale bars: 20 cm.
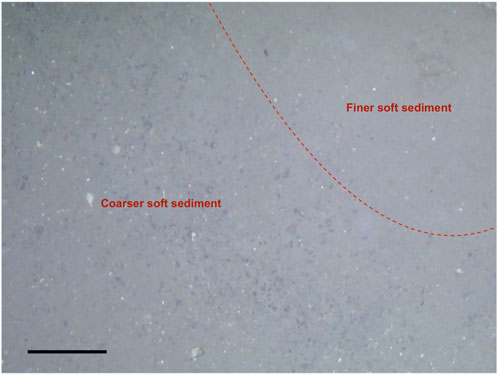
FIGURE 14. Coarser soft sediment compared to finer soft sediment observed within the mosaics. Scale bar: 20 cm.
Cold seep sabellids have recently been found to host methane oxidizing bacteria on their crowns and a nutritional symbiotic association has been suggested (Goffredi et al., 2020). We observed sabellids and sabellid-like animals at the VCF seep, including, in some instances, directly above microbial mats (Figure 15). Therefore, it is conceivable that methane-based chemosynthetic associations occur at the VCF seep, even if sulfide-based siboglinid chemosynthetic symbioses are absent. Nonetheless, the possible instances of methanotrophy-based sabellids at VCF are scarce overall in the community, in contrast with the extremely high densities and abundances exhibited by siboglinids when they are present at high latitude seeps (Åström et al., 2016; 2019; Sen et al., 2018b; 2018a; 2019b; Vedenin et al., 2020).
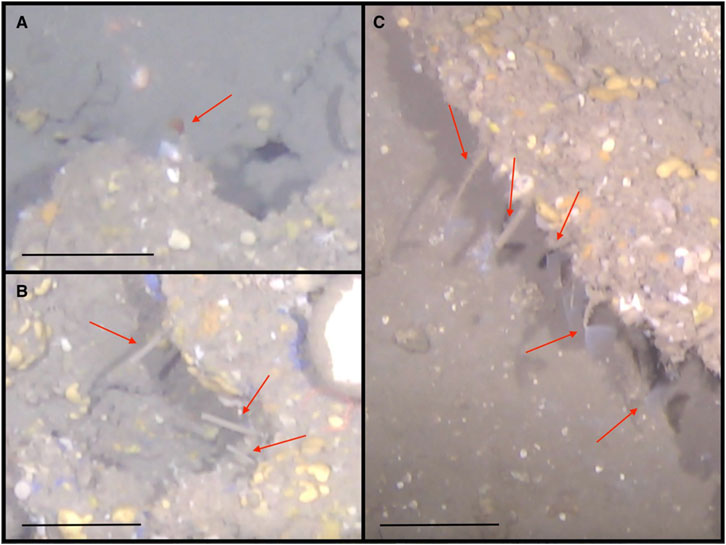
FIGURE 15. (A) Sabellids with protruding red feathery branchiae; (B) Sabellids with retracted branchiae; (C) Sabellids with protruding white feathery branchiae. Scale bars: 20 cm.
A lack, or paucity of chemosymbiotic animals would subsequently suggest that chemosynthetically fixed carbon does not constitute a major part of the food web at the VCF seep. We opportunistically sampled megabenthic fauna from two carbonate rocks retrieved from the VCF seep and conducted stable isotope analyses on them in order to assess the role of, and to track chemosynthetically fixed carbon through the food chain. Photosynthesis and chemosynthesis favor the two stable isotopes of carbon (12C and 13C) differently, therefore the ratio of the two constitutes a record of the carbon source at the base of the food web (DeNiro and Epstein, 1978; Fry, 2006). Specifically, biomass produced through chemosynthesis is depleted in the heavy isotopes of carbon (13C), and thus result in lower δ13C values, in comparison to biomass derived from photosynthesis (Kennicutt et al., 1992; MacAvoy et al., 2003). Methane seep organisms relying on chemosynthesis-derived organic matter have δ13C values typically lower than −30‰ when this matter is synthesized through sulfide oxidation, and even lower (sometimes as low as −60‰) when synthesized through methane oxidation (Demopoulos et al., 2010; Yamanaka et al., 2015). All of the sampled taxa of the VCF seeps displayed δ13C values between −25.8 and −19.6‰, suggesting a predominantly photosynthetic source of carbon (Hobson et al., 1996; Søreide et al., 2006) (Figure 10). Similarly, δ34S values were typical for ocean sulfate (19–21‰), further suggesting a lack of sulfide based chemosynthetic pathways (MacAvoy et al., 2003; Grey and Deines, 2005; Yamanaka et al., 2015) (Figure 10A). δ15N values display a notable tissue-diet shift, increasing by 2–4‰ with each trophic level (Minagawa and Wada, 1984; McCutchan Jr et al., 2003). The lowest values we found were 7.69 and 8.18‰ but given that those individuals also had the highest δ13C values, it is unlikely that they represent low level consumers feeding on chemosynthetic microbes. Chemosynthetic signatures have even been observed in higher trophic level organisms at Arctic seeps. For example, δ13C values as low as −31‰ have been recorded in predatory Nepthys worms at the Bjørnøyrenna crater field (Åström et al., 2019). We also sampled Nepthys worms, and they displayed the highest δ15N values (11.8–13.1‰, Figure 10B), which indicates that they are predatory at VCF as well. However, δ13C values among these worms were between −21.7 and −19.6‰ implying a photosynthetic origin of the ingested carbon.
Therefore, the combined results of our stable carbon, sulfur and nitrogen stable isotope analyses suggest that chemosynthesis does not play a major role in the benthic food web at the VCF seep, and that taxa primarily obtain their nutrition from phytodetrital material. It should be kept in mind however, that only a small fraction of the local fauna was subjected to stable isotope analyses, and that taxa with the highest potential for being chemosymbiotrophic, such as the previously mentioned sabellids were not analyzed. Additionally, we observed high numbers of echiurans (M1: 123 individuals; M2: 44 individuals), probably Bonellia viridis, a species that has previously been suggested to feed on microbial mats at the periphery of the Milos vent fields (Dando et al., 1995). Therefore, despite a lack or paucity of chemosymbiotic fauna, it is possible that chemosynthesis nonetheless plays a role in the food web and nutrition of the benthic community at the VCF site, and we simply could not detect it based on our sampling efforts. Furthermore, no sampling was done on sediment infauna and we thus cannot exclude the possibility of chemosymbiotrophic infauna (e.g., thyasirid bivalves), commonly seen at Arctic and subarctic seeps (Åström et al., 2017; Sen et al., 2018a), from being present at the VCF seep. Nonetheless, a lack of extensive microbial mat cover and the absence of siboglinid worms in combination with our isotope results together strongly suggest a minor role, if any, of chemosynthesis and chemosynthetically fixed carbon in the local food web and nutrition of the resident fauna of the VCF seeps. This is despite high sediment sulfide concentrations and free gas methane emissions. Therefore, the VCF represents an active seep within what is generally considered the deep sea with a predominantly background community. This implies that direct evidence of active seepage does not necessarily result in chemosynthesis-based seep communities in high latitude locations. If fluid flow pathways are highly localized and restricted to point sources, background communities can develop, supported through conventional phytodetrital nutritional pathways, even at water depths below the photic zone.
4.2 Impacts of seep substrates on the local benthos
Low latitude cold seeps around the world have been seen to host high biomass but low diversity communities compared to the surrounding non-seep seafloor, while seeps in higher latitudes appear to host both high abundance and high diversity communities in comparison to surrounding non-seep areas (Fisher et al., 2007; Levin et al., 2016; Sen et al., 2018a; 2019a; Åström et al., 2020). Our results seem to fall in between both trends with the VCF seeps hosting high biomass communities, compared to the background area (25 ind./m2 versus 0.15 ind./m2) with however probably similar diversity (Figure 11). Similar to other methane seep studies (Levin et al., 2016; Sen et al., 2018a; 2019a; Åström et al., 2018; 2020), we link the presence of most benthic community members and their high abundances to heightened habitat heterogeneity and the occurrence of hard substrates, especially carbonate crusts, which are absent from the surrounding non-seep background area (Figure 11). Carbonate crusts are formed due to an increased carbonate alkalinity in the seep sediment, mediated through microbial activity, specifically, through the anaerobic oxidation of methane (AOM) coupled to the reduction of sulfate, a highly localized process which can continue at seep locations over hundreds to thousands of years (Boetius et al., 2000; Joye et al., 2004; Bayon et al., 2009; Sen et al., 2019b).
Despite carbonate crusts not representing the most abundant substrate within the seep area, they hosted nearly all morphotaxa identified, as well as the majority of all marked individuals. In contrast, soft sediment, which dominated both mosaics, only hosted about half of the morphotaxa identified and less than a tenth of all marked individuals. Thus, even compared to other hard substrates, such as dead D. pertusum and dropstones, the latter also being found in the non-seep background area (in some supplementary video material, but not in the video transects), carbonate crusts seem to play a particularly important role in structuring the local benthos. This may be explained by methane-derived authigenic carbonate crusts having higher three-dimensional complexity, offering more nooks and crannies for different kinds of animals to find fixation points (e.g., Parazoanthus sp.) and shelter in (e.g., Munida sp.); higher elevation from the seafloor, giving heightened access to organic material from the water column (e.g., Sabellidae); and sheer volume/size compared to the other hard substrates such as dropstones or dead D. pertusum corals, offering more space for animals to grow in large numbers (e.g., cushion-like orange sponge) and to grow in size (e.g., Paragorgia arborea) (Gutt and Schickan, 1998; Meyer et al., 2016; Sedano et al., 2020). Moreover, while dropstones constitute island-like habitats for hardbottom-dwelling fauna at high latitudes, increasing taxa richness of the region overall, they are limited by their small size and consequently mechanisms such as hydrodynamics, affecting food supply, larval dispersal and recruitment (Meyer et al., 2016; Ziegler et al., 2017). Seep carbonate crusts on the other hand are much bigger and may thus function more like archipelagos (Sen et al., 2019a), where the previously mentioned limitations may not apply in the same manner. Instead, faunal recruitment on these substrates may be linked to the presence or absence of interacting species or their channelization of seeping fluids that could enhance or aggregate particular species (Grupe, 2014).
Though carbonates had the highest abundances and numbers of taxa overall, other substrates, and most importantly the two unconsolidated substrates (i.e., soft sediment and coral rubble) showed higher taxa evenness and diversity. In addition, community composition on these substrates highly differed from all other substrates through the absence or low abundance of hard-substrate dwelling suspension-feeding animals, such as sponges, sabellids, ‘fan animals’ or soft corals. Only one single taxon was unique to these substrates, S. tremulus, a soft-bottom dwelling sea cucumber commonly found on soft sediments along the Norwegian coast (Schagerström and Sundell, 2021). Differences between the two unconsolidated substrates were also observed, primarily the presence of a few more hard-substrate-dwelling animals, such as sponges and ‘fan animals’ and mobile animals such as Munida sp. and ophiuroids on coral rubble compared to soft sediment. Indeed, D. pertusum rubble has been linked to an increased abundance of predators, in contrast to soft sediment and increased diversity compared to hard substrates covered in microbial mats, sponges, or corals (Jonsson et al., 2004; Lessard-Pilon et al., 2010). Moreover, the diversity of microhabitats found on coral rubble has been found to provide perfect conditions for the settlement of juveniles and to protect them until adulthood (Jensen and Frederiksen, 1992). It is thus the multitude of different substrates, that makes the VCF different from the background seafloor, by offering a variety of colonization surfaces for the background taxa, supporting them from larval settlement to their adult life, and thereby functioning as an important megafaunal oasis and ‘ecological stepping stone’ that would not be possible if only soft sediment and dropstones would be present (Jensen and Frederiksen, 1992; Gutt and Schickan, 1998; Kiel, 2016; Meyer et al., 2016; Sedano et al., 2020).
4.3 Implications for marine management
Norway is the seventh biggest oil producer, the third largest net oil exporter, as well as the world’s second largest exporter of fish and seafood in the world (Mohn and Osmundsen, 2008; Lipková and Hovorková, 2018; Johansen et al., 2019). In order to limit the significant detrimental impacts these activities have on benthic communities, Norway has created its ‘Integrated Ocean Management Plans’, restricting the use of bottom trawls in areas with coral reefs (i.e., D. pertusum) and at depths exceeding 1,000 m and managing seismic surveying and exploration drilling in oil-bearing formations through seasonal permits (ICES, 2019; Norvegian Ministry of Climate and Environment, 2020). However, no targeted measures exist to protect sponge aggregations in water depths less than 1,000 m and/or coral garden habitats from human stressors unless they occur in conjunction with D. pertusum reefs in the closed areas (OSPAR, 2010). As a consequence, hard-bottom coral gardens, dominated by vulnerable and very fragile soft corals are still under high fishing pressure and their total area has considerably declined in the last decades (Norvegian Ministry of Climate and Environment, 2020).
The VCF seep, with its multitude of hard substrates, hosts a high diversity and high abundance faunal community that is distinct from the surrounding seafloor community. Based on OSPAR (The Convention for the Protection of the Marine Environment of the North-East Atlantic) descriptions, the VCF seep ought to be categorized as a threatened and/or declining habitat, as they not only feature D. pertusum colonies and soft corals, such as P. arborea, Paramuricea placomus and Primnoa resedaeformis, but also deep-sea sponge aggregations, including some which have reached very large sizes. All these taxa are extremely slow-growing and are therefore particularly vulnerable to disturbances, such as oil drilling, bottom trawling and other fisheries related activities (Clark et al., 2016; Sundahl et al., 2020). Deep-water coral and sponge habitats often have high levels of endemism, host the early life-stages of many deep-sea animals including juvenile fish of commercial value, act as substrate and shelter for many other species, and play a major role in marine biogeochemical cycles, acting as hotspots of carbon processing in the food devoid deep ocean (Jensen and Frederiksen, 1992; Buhl-Mortensen and Mortensen, 2004; Buhl-Mortensen and Mortensen, 2005; Rogers, 2004; Hogg, M.M. et al., 2010; Beazley et al., 2013; Kenchington et al., 2013; Cathalot et al., 2015; Maldonado et al., 2017; De Clippele et al., 2019; D’Onghia, 2019). Furthermore, sponges in conjunction with corals seem to be particularly important, as they have a huge pallet of functional roles within coral ecosystems (Wulff, 2001; McLean and Yoshioka, 2007; Bell, 2008; De Goeij et al., 2013). Destructive relationships range from boring sponges infesting the tissue-barren portions of coral skeletons, to sponges outcompeting corals for space and overgrowing them (Beuck et al., 2007; McLean and Yoshioka, 2007; Bell, 2008). Many sponge species, however, have a beneficial, rather than destructive, relationship with corals. Sponges are known to increase coral survival by binding live corals to the substrate and preventing access to their skeletons, to mediate the regeneration of physically damaged corals and to return dissolved organic carbon (DOC) from the water column to the coral reef ecosystem as detritus, while producing detrital particulate organic Nitrate (PON), which may act as high-quality food source for corals and other detritivores and suspension feeders (Wulff, 2001; McLean and Yoshioka, 2007; Bell, 2008; De Goeij et al., 2013; Pawlik and McMurray, 2020). In addition to functioning as a biogenic habitat and controlling coral populations, sponges are also highly effective filter-feeders and play an important role in denitrification, carbon sequestration and benthic–pelagic coupling (Pham et al., 2019; Rooks et al., 2020). The presence and activity of sponges and corals therefore likely enhances settlement of other animals at the VCF site, making it a high abundance and biomass location, despite a lack of typical seep ecosystem engineering taxa. Furthermore, cold water corals on the Norwegian shelf have been hypothesized to be linked to seeps (Hovland and Risk, 2003), and the VCF site represents a location where cold water corals are directly associated with seeps.
In the VCF seep mosaics we observed a considerable amount of marine litter (on average 0.03 items/m2), the majority of which was fishing gear (Table 1). Seven fishing nets were seen in M1 and five in M2, with one of the bigger fishing nets in M1 being completely entangled in a large P. arborea soft coral (Figure 12A). Demersal fishing such as bottom gillnetting or bottom trawling (De Juan and Lleonart, 2010) has thus taken place at the VCF at some point. Importantly as well, we observed much more fishing gear in the mosaics in comparison to the background areas (Table 1), even with differences in areas being accounted for. This could be due to the abundance of large carbonate slabs at the VCF seep, as well as associated large, three-dimensional structure-forming taxa, which stand in the way of nets that are towed along the ocean floor, leading to fragments of the nets being ripped off. Therefore, the seep itself could be more susceptible to being affected by fishing from a purely physical perspective.
Recovery time after damaging impacts (e.g., physical damage through fishing nets) in coral habitats may take decades and even though recovery time appears to be shorter for deep-sea sponge aggregations, they have been found to suffer from lingering damage and experience delayed mortality over the course of many years or even decades (Rogers, 2004; Althaus et al., 2009; Rooper et al., 2011; Clark et al., 2016; Malecha and Heifetz, 2017). Our results indicate that, in clear contrast with the surrounding non-seep background area, the VCF seeps with their multitude of substrates act as biomass hotspots, hosting a wide array of animals, including not only species of commercial interest but also large sponge aggregations and a variety of soft and hard corals. The VCF thus not only increases the diversity of the region overall, but also acts as a habitat for various species considered priorities for protection under the OSPAR convention, while possibly playing an important role in nitrogen cycling, carbon retention and benthic–pelagic coupling. Therefore, persistent fishing pressures, or the commencement of oil drilling could put animals that have lived there for decades, maybe centuries at risk, which would additionally affect associated benthic and epibenthic fauna. Our results therefore highlight why seeps should be maintained as particularly valuable and vulnerable habitats and protection efforts need to be implemented in order to achieve adequate protection and prevent significant adverse impacts, compromising ecosystem integrity.
5 Conclusion
Despite active seepage and high sediment methane and sulfide concentrations, the megafaunal communities of the Vestbrona Carbonate Field (VCF) on the Mid-Norwegian continental shelf lacked chemosymbiotrophic animals, which generally tend to dominate seep ecosystems. Instead, the VCF was dominated by dense sponge aggregations and was composed of heterotrophic background taxa. Our results emphasize however, that despite a lack of ecosystem engineering chemosymbiotrophic animals, seeps and their multitude of different substrates can play significant roles in benthic ecosystems by functioning as density hotspots and increasing the regional diversity. Our study shows that although the observed taxa are considered priorities for protection under the OSPAR convention and partly protected under national legislation, they are still subject to multiple human stressors, including highly destructive fishing activities. Informed and effective conservation measures will be needed to protect the VCF seeps and the unique biodiversity hotspot they represent.
Data availability statement
All data used in this study are presented in the tables. Data generated from the mosaics and transects 689 are published in GBIF (Sinner et al., 2020): https://doi.org/10.15468/5vrbbj. Stable isotope data 690 generated and used in this study are published in SEANOE (Sinner et al., 2020): 691 https://doi.org/10.17882/95359.
Author contributions
AS, MS, and JK contributed to the conception and design of the study. AS and JK were responsible for sample collections. WH conducted porewater chemistry measurements, LM conducted animal stable isotope measurements and SV conducted acoustic measurements. JK was responsible for the free gas analyses. AS and MS constructed the georeferenced seep mosaics and MS extracted the background transects. MS digitized and enumerated all features in the mosaics and transects and conducted all statistical analyses. MS wrote the main text of the manuscript under the supervision of AS with contributions from all authors. All authors contributed to the article and approved the submitted version.
Funding
We sincerely thank Spirit Energy Ltd. (now: Sval Energy AS) for supporting the ROV expedition onboard R/V G.O. Sars. The research was supported by the Research Council of Norway (RCN) (project numbers 223259, and 332635). The funder was not involved in the study design, collection, analysis, interpretation of data, the writing of this article or the decision to submit it for publication.
Acknowledgments
We would like to thank the captain and crew of the R/V G. O. Sars (University of Bergen), the ROV Ægir team, and the scientific team of the 20-0 CAGE cruise from which data for this project was gathered. We thank Henning Reiss and Morten Krogstad for helping with organization and logistics and Nord University for hosting the first author and providing office space and technical equipment. We thank the MER Consortium and Erasmus+ for funding the first author’s stay at Nord University and Brian Sevin for providing guidance and suggestions. We are grateful to Henning Reiss, Sabine Cochrane, Paul Renaud and Bodil Bluhm for help with identifying animals such as the “fan animal.”
Conflict of interest
LM was employed by the company Ifremer.
The remaining authors declare that the research was conducted in the absence of any commercial or financial relationships that could be construed as a potential conflict of interest.
Publisher’s note
All claims expressed in this article are solely those of the authors and do not necessarily represent those of their affiliated organizations, or those of the publisher, the editors and the reviewers. Any product that may be evaluated in this article, or claim that may be made by its manufacturer, is not guaranteed or endorsed by the publisher.
References
Althaus, F., Williams, A., Schlacher, T. A., Kloser, R. J., Green, M. A., Barker, B. A., et al. (2009). Impacts of bottom trawling on deep-coral ecosystems of seamounts are long-lasting. Mar. Ecol. Prog. Ser. 397, 279–294. doi:10.3354/meps08248
Åström, E. K. L., Bluhm, B. A., and Rasmussen, T. L. (2022). Chemosynthetic and photosynthetic trophic support from cold seeps in Arctic benthic communities. Front. Mar. Sci. 9, 910558. doi:10.3389/fmars.2022.910558
Åström, E. K. L., Carroll, M. L., Ambrose, W. G., Sen, A., Silyakova, A., and Carroll, J. (2018). Methane cold seeps as biological oases in the high-Arctic deep sea. Limnol. Oceanogr. 63, S209–S231. doi:10.1002/lno.10732
Åström, E. K. L., Carroll, M. L., Jr, W. G. A., and Carroll, J. (2016). Arctic cold seeps in marine methane hydrate environments: Impacts on shelf macrobenthic community structure offshore svalbard. Mar. Ecol. Prog. Ser. 552, 1–18. doi:10.3354/meps11773
Astrom, E., Carroll, M., Sen, A., Niemann, H., Ambrose, W., Lehmann, M., et al. (2019). Chemosynthesis influences food web and community structure in high-Arctic benthos. Mar. Ecol. Prog. Ser. 629, 19–42. doi:10.3354/meps13101
Åström, E. K. L., Oliver, P. G., and Carroll, M. L. (2017). A new genus and two new species of Thyasiridae associated with methane seeps off Svalbard, Arctic Ocean. Mar. Biol. Res. 13, 402–416. doi:10.1080/17451000.2016.1272699
Åström, E. K. L., Sen, A., Carroll, M. L., and Carroll, J. (2020). Cold seeps in a warming arctic: Insights for benthic ecology. Front. Mar. Sci. 7, 244. doi:10.3389/fmars.2020.00244
Bayon, G., Henderson, G. M., and Bohn, M. (2009). U–Th stratigraphy of a cold seep carbonate crust. Chem. Geol. 260, 47–56. doi:10.1016/j.chemgeo.2008.11.020
Beazley, L. I., Kenchington, E. L., Murillo, F. J., Sacau, M., and del, M. (2013). Deep-sea sponge grounds enhance diversity and abundance of epibenthic megafauna in the Northwest Atlantic. ICES J. Mar. Sci. 70, 1471–1490. doi:10.1093/icesjms/fst124
Bell, J. J. (2008). The functional roles of marine sponges. Estuar. Coast. Shelf Sci. 79, 341–353. doi:10.1016/j.ecss.2008.05.002
Beuck, L., Vertino, A., Stepina, E., Karolczak, M., and Pfannkuche, O. (2007). Skeletal response of Lophelia pertusa (Scleractinia) to bioeroding sponge infestation visualised with micro-computed tomography. Facies 53, 157–176. doi:10.1007/s10347-006-0094-9
Boetius, A., Ravenschlag, K., Schubert, C. J., Rickert, D., Widdel, F., Gieseke, A., et al. (2000). A marine microbial consortium apparently mediating anaerobic oxidation of methane. Nature 407, 623–626. doi:10.1038/35036572
Bugge, T., Prestvik, T., and Rokoengen, K. (1980). Lower tertiary volcanic rocks off Kristiansund — mid Norway. Mar. Geol. 35, 277–286. doi:10.1016/0025-3227(80)90121-8
Buhl-Mortensen, L., and Mortensen, P. B. (2004). Crustaceans associated with the deep-water gorgonian corals Paragorgia arborea (L., 1758) and Primnoa resedaeformis (Gunn., 1763). J. Nat. Hist. 38, 1233–1247. doi:10.1080/0022293031000155205
Buhl-Mortensen, L., and Mortensen, P. B. (2005). “Distribution and diversity of species associated with deep-sea gorgonian corals off Atlantic Canada,” in Cold-water corals and ecosystems erlangen Earth conference series. Editors A. Freiwald, and J. M. Roberts (Berlin, Heidelberg: Springer), 849–879. doi:10.1007/3-540-27673-4_44
Carney, R. S. (1994). Consideration of the oasis analogy for chemosynthetic communities at Gulf of Mexico hydrocarbon vents. Geo-Marine Lett. 14, 149–159. doi:10.1007/BF01203726
Cathalot, C., Van Oevelen, D., Cox, T. J. S., Kutti, T., Lavaleye, M., Duineveld, G., et al. (2015). Cold-water coral reefs and adjacent sponge grounds: Hotspots of benthic respiration and organic carbon cycling in the deep sea. Front. Mar. Sci. 2, 37. doi:10.3389/fmars.2015.00037
Ceramicola, S., Dupré, S., Somoza, L., and Woodside, J. (2018). “Cold seep systems,” in Submarine geomorphology springer geology. Editors A. Micallef, S. Krastel, and A. Savini (Cham: Springer International Publishing), 367–387. doi:10.1007/978-3-319-57852-1_19
Clark, M. R., Althaus, F., Schlacher, T. A., Williams, A., Bowden, D. A., and Rowden, A. A. (2016). The impacts of deep-sea fisheries on benthic communities: A review. ICES J. Mar. Sci. 73, i51–i69. doi:10.1093/icesjms/fsv123
Coplen, T. B. (2011). Guidelines and recommended terms for expression of stable-isotope-ratio and gas-ratio measurement results: Guidelines and recommended terms for expressing stable isotope results. Rapid Commun. Mass Spectrom. 25, 2538–2560. doi:10.1002/rcm.5129
Cordes, E. E., Cunha, M. R., Galéron, J., Mora, C., Roy, K. O.-L., Sibuet, M., et al. (2010). The influence of geological, geochemical, and biogenic habitat heterogeneity on seep biodiversity. Mar. Ecol. 31, 51–65. doi:10.1111/j.1439-0485.2009.00334.x
Dando, P. R. (2010). “Biological communities at marine shallow-water vent and seep sites,” in The vent and seep biota: Aspects from microbes to ecosystems topics in geobiology. Editor S. Kiel (Dordrecht: Springer Netherlands), 333–378. doi:10.1007/978-90-481-9572-5_11
Dando, P. R., Hughes, J. A., and Thiermann, F. (1995). Preliminary observations on biological communities at shallow hydrothermal vents in the Aegean Sea. Geol. Soc. Lond. Spec. Publ. 87, 303–317. doi:10.1144/GSL.SP.1995.087.01.23
De Clippele, L. H., Huvenne, V. A. I., Molodtsova, T. N., and Roberts, J. M. (2019). The diversity and ecological role of non-scleractinian corals (antipatharia and alcyonacea) on scleractinian cold-water coral mounds. Front. Mar. Sci. 6, 184. doi:10.3389/fmars.2019.00184
De Goeij, J. M., Van Oevelen, D., Vermeij, M. J. A., Osinga, R., Middelburg, J. J., De Goeij, A. F. P. M., et al. (2013). Surviving in a marine desert: The sponge loop retains resources within coral reefs. Science 342, 108–110. doi:10.1126/science.1241981
De Juan, S., and Lleonart, J. (2010). Fisheries conservation management and vulnerable ecosystems in the Mediterranean open seas, including the deep sea. Tunis: UNEP-MAP-RAC/SPA.
Demopoulos, A. W. J., Gualtieri, D., and Kovacs, K. (2010). Food-web structure of seep sediment macrobenthos from the Gulf of Mexico. Deep Sea Res. Part II Top. Stud. Oceanogr. 57, 1972–1981. doi:10.1016/j.dsr2.2010.05.011
DeNiro, M. J., and Epstein, S. (1978). Influence of diet on the distribution of carbon isotopes in animals. Geochimica Cosmochimica Acta 42, 495–506. doi:10.1016/0016-7037(78)90199-0
D’Onghia, G. (2019). “30 cold-water corals as shelter, feeding and life-history critical habitats for fish species: Ecological interactions and fishing impact,” in Mediterranean cold-water corals: Past, present and future: Understanding the deep-sea realms of coral coral reefs of the world. Editors C. Orejas, and C. Jiménez (Cham: Springer International Publishing), 335–356. doi:10.1007/978-3-319-91608-8_30
Fisher, C., Roberts, H., Cordes, E., and Bernard, B. (2007). Cold seeps and associated communities of the gulf of Mexico. Oceanog 20, 118–129. doi:10.5670/oceanog.2007.12
Fredriksen, S. (2003). Food web studies in a Norwegian kelp forest based on stable isotope (δ13C and δ15N) analysis. Mar. Ecol. Prog. Ser. 260, 71–81. doi:10.3354/meps260071
Gebruk, A. V., Krylova, E. M., Lein, A. Y., Vinogradov, G. M., Anderson, E., Pimenov, V., et al. (2003). Methane seep community of the Ha˚kon mosby mud volcano (the Norwegian sea): Composition and trophic aspects. Sarsia N. Atl. Mar. Sci. 88, 394–403. doi:10.1080/00364820310003190
Goffredi, S. K., Tilic, E., Mullin, S. W., Dawson, K. S., Keller, A., Lee, R. W., et al. (2020). Methanotrophic bacterial symbionts fuel dense populations of deep-sea feather duster worms (Sabellida, Annelida) and extend the spatial influence of methane seepage. Sci. Adv. 6, eaay8562. doi:10.1126/sciadv.aay8562
Grall, J., Le Loc’h, F., Guyonnet, B., and Riera, P. (2006). Community structure and food web based on stable isotopes (δ15N and δ13C) analysis of a North Eastern Atlantic maerl bed. J. Exp. Mar. Biol. Ecol. 338, 1–15. doi:10.1016/j.jembe.2006.06.013
Grey, J., and Deines, P. (2005). Differential assimilation of methanotrophic and chemoautotrophic bacteria by lake chironomid larvae. Aquat. Microb. Ecol. 40, 61–66. doi:10.3354/ame040061
Grupe, B. M. (2014). Implications of environmental heterogeneity for community structure, colonization, and trophic dynamics at eastern pacific methane seeps. Available at: https://escholarship.org/uc/item/3r68b6pz (Accessed November 8, 2022).
Gutt, J., and Schickan, T. (1998). Epibiotic relationships in the Antarctic benthos. Antarct. Sci. 10, 398–405. doi:10.1017/S0954102098000480
Hedges, J. I., and Stern, J. H. (1984). Carbon and nitrogen determinations of carbonate-containing solids1. Limnol. Oceanogr. 29, 657–663. doi:10.4319/lo.1984.29.3.0657
Helle, K., Pennington, M., Hareide, N.-R., and Fossen, I. (2015). Selecting a subset of the commercial catch data for estimating catch per unit effort series for ling (Molva molva L). Fish. Res. 165, 115–120. doi:10.1016/j.fishres.2014.12.015
Hobson, K. A., Ambrose, W. G., and Renaud, P. R. (1996). Sources of primary production, benthicpelagic coupling, and trophic relationships within the northeast water polynya: Insights from δ 1 3 C and δ 1 5 N analysis. Oceanogr. Lit. Rev. 7, 689.
Hogg, M. M., Tendal, O. S., Conway, K. W., Pomponi, S. A., van Soest, R. W. M., Gutt, J., et al. (2010). Deep-sea sponge grounds: Reservoirs of biodiversity. UNEP-WCMC Available at: https://dare.uva.nl/personal/pure/en/publications/deepsea-sponge-grounds-reservoirs-of-biodiversity(c0c920a3-4208-4d3c-b55d-1a1b09aced52).html (Accessed July 6, 2021).
Hovland, M., and Risk, M. (2003). Do Norwegian deep-water coral reefs rely on seeping fluids? Mar. Geol. 198, 83–96. doi:10.1016/S0025-3227(03)00096-3
ICES (2019). Norwegian Sea Ecoregion—Ecosystem overview. In Report of the ICES Advisory Committee. ICES Advice 2019, Section 12.1. doi:10.17895/ices.advice.5748
Jensen, A., and Frederiksen, R. (1992). The fauna associated with the bank-forming deepwater coral Lophelia pertusa (Scleractinaria) on the Faroe shelf. Sarsia 77, 53–69. doi:10.1080/00364827.1992.10413492
Johansen, U., Bull-Berg, H., Vik, L. H., Stokka, A. M., Richardsen, R., and Winther, U. (2019). The Norwegian seafood industry – importance for the national economy. Mar. Policy 110, 103561. doi:10.1016/j.marpol.2019.103561
Jonsson, L. G., Nilsson, P. G., Floruta, F., and Lundälv, T. (2004). Distributional patterns of macro- and megafauna associated with a reef of the cold-water coral Lophelia pertusa on the Swedish west coast. Marine Ecology Progress Series 284, 163–171. doi:10.3354/meps284163
Joye, S. B., Boetius, A., Orcutt, B. N., Montoya, J. P., Schulz, H. N., Erickson, M. J., et al. (2004). The anaerobic oxidation of methane and sulfate reduction in sediments from Gulf of Mexico cold seeps. Chem. Geol. 205, 219–238. doi:10.1016/j.chemgeo.2003.12.019
Kassambara, A. (2023). Ggpubr: “ggplot2” based publication ready plots. Available at: https://CRAN.R-project.org/package=ggpubr (Accessed March 29, 2023).
Kenchington, E., Power, D., and Koen-Alonso, M. (2013). Associations of demersal fish with sponge grounds on the continental slopes of the northwest Atlantic. Mar. Ecol. Prog. Ser. 477, 217–230. doi:10.3354/meps10127
Kennicutt, M. C., Burke, R. A., MacDonald, I. R., Brooks, J. M., Denoux, G. J., and Macko, S. A. (1992). Stable isotope partitioning in seep and vent organisms: Chemical and ecological significance. Chem. Geol. Isot. Geosci. Sect. 101, 293–310. doi:10.1016/0009-2541(92)90009-T
Kiel, S. (2016). A biogeographic network reveals evolutionary links between deep-sea hydrothermal vent and methane seep faunas. Proc. R. Soc. B Biol. Sci. 283, 20162337. doi:10.1098/rspb.2016.2337
Kiel, S. (2010). On the potential generality of depth-related ecologic structure in cold-seep communities: Evidence from Cenozoic and Mesozoic examples. Palaeogeogr. Palaeoclimatol. Palaeoecol. 295, 245–257. doi:10.1016/j.palaeo.2010.05.042
Kvangarsnes, K., Frantzen, S., Julshamn, K., Sætre, L. J., Nedreaas, K., and Maage, A. (2012). Distribution of mercury in a gadoid fish species, tusk (brosme brosme), and its implication for food safety. J. Food Sci. Eng. 2, 603–615. doi:10.17265/2159-5828/2012.11.001
Lessard-Pilon, S. A., Podowski, E. L., Cordes, E. E., and Fisher, C. R. (2010). Megafauna community composition associated with Lophelia pertusa colonies in the Gulf of Mexico. Deep Sea Res. 57, 1882–1890. doi:10.1016/j.dsr2.2010.05.013
Levin, L. A., Baco, A. R., Bowden, D. A., Colaco, A., Cordes, E. E., Cunha, M. R., et al. (2016). Hydrothermal vents and methane seeps: Rethinking the sphere of influence. Front. Mar. Sci. 3, 72. doi:10.3389/fmars.2016.00072
Levin, L. A. (2005). “Ecology of cold seep sediments: Interactions of fauna with flow, chemistry and microbes,” in Oceanography and Marine Biology: An Annual Review (Boca Raton: CRC Press), 1–46. doi:10.1201/9781420037449
Levin, L. A., and Michener, R. H. (2002). Isotopic evidence for chemosynthesis-based nutrition of macrobenthos: The lightness of being at Pacific methane seeps. Limnol. Oceanogr. 47, 1336–1345. doi:10.4319/lo.2002.47.5.1336
Lipková, Ľ., and Hovorková, K. (2018). Economic situation in Norway after the outbreak of the global financial and oil crises in the context of EU integration trends. EA-XXI 169, 12–14. doi:10.21003/ea.V169-02
Lösekann, T., Robador, A., Niemann, H., Knittel, K., Boetius, A., and Dubilier, N. (2008). Endosymbioses between bacteria and deep-sea siboglinid tubeworms from an arctic cold seep (haakon mosby mud volcano, barents sea). Environ. Microbiol. 10, 3237–3254. doi:10.1111/j.1462-2920.2008.01712.x
Luff, R., Wallmann, K., and Aloisi, G. (2004). Numerical modeling of carbonate crust formation at cold vent sites: Significance for fluid and methane budgets and chemosynthetic biological communities. Earth Planet. Sci. Lett. 221, 337–353. doi:10.1016/S0012-821X(04)00107-4
MacAvoy, S. E., Macko, S. A., and Carney, R. S. (2003). Links between chemosynthetic production and mobile predators on the Louisiana continental slope: Stable carbon isotopes of specific fatty acids. Chem. Geol. 201, 229–237. doi:10.1016/S0009-2541(03)00204-3
Mahadevan, A., Orpe, A. V., Kudrolli, A., and Mahadevan, L. (2012). Flow-induced channelization in a porous medium. EPL 98, 58003. doi:10.1209/0295-5075/98/58003
Maldonado, M., Aguilar, R., Bannister, R. J., Bell, J. J., Conway, K. W., Dayton, P. K., et al. (2017). “Sponge Grounds as Key Marine Habitats: A Synthetic Review of Types, Structure, Functional Roles, and Conservation Concerns,” in Marine Animal Forests: The Ecology of Benthic Biodiversity Hotspots. Editor S. Rossi, L. Bramanti, A. Gori, and C. Orejas Saco del Valle (Cham: Springer International Publishing), 1–39. doi:10.1007/978-3-319-17001-5_24-1
Malecha, P., and Heifetz, J. (2017). Long-term effects of bottom trawling on large sponges in the Gulf of Alaska. Cont. Shelf Res. 150, 18–26. doi:10.1016/j.csr.2017.09.003
Mateo, M. A., Serrano, O., Serrano, L., and Michener, R. H. (2008). Effects of sample preparation on stable isotope ratios of carbon and nitrogen in marine invertebrates: Implications for food web studies using stable isotopes. Oecologia 157, 105–115. doi:10.1007/s00442-008-1052-8
McCutchan, J. H., Lewis, W. M., Kendall, C., and McGrath, C. C. (2003). Variation in trophic shift for stable isotope ratios of carbon, nitrogen, and sulfur. Oikos 102, 378–390. doi:10.1034/j.1600-0706.2003.12098.x
McLean, E. L., and Yoshioka, P. M. (2007). “Associations and interactions between gorgonians and sponges,” in Porifera research: Biodiversity, innovation and sustainability série livros (Rio de Janeiro: Museu Nacional), 139–145.
Meyer, K. S., Young, C. M., Sweetman, A. K., Taylor, J., Soltwedel, T., and Bergmann, M. (2016). Rocky islands in a sea of mud: Biotic and abiotic factors structuring deep-sea dropstone communities. Mar. Ecol. Prog. Ser. 556, 45–57. doi:10.3354/meps11822
Milkov, A. V., and Etiope, G. (2018). Revised genetic diagrams for natural gases based on a global dataset of >20,000 samples. Org. Geochem. 125, 109–120. doi:10.1016/j.orggeochem.2018.09.002
Minagawa, M., and Wada, E. (1984). Stepwise enrichment of 15N along food chains: Further evidence and the relation between δ15N and animal age. Geochimica Cosmochimica Acta 48, 1135–1140. doi:10.1016/0016-7037(84)90204-7
Mohn, K., and Osmundsen, P. (2008). Exploration economics in a regulated petroleum province: The case of the Norwegian Continental Shelf. Energy Econ. 30, 303–320. doi:10.1016/j.eneco.2006.10.011
Nakagawa, F., Tsunogai, U., Yoshida, N., and Adams, D. D. (2003). “Stable isotopic compositions of bacterial light hydrocarbons in marginal marine sediments,” in Land and marine hydrogeology. Editors M. Taniguchi, K. Wang, and T. Gamo (Amsterdam: Elsevier), 141–150. doi:10.1016/B978-044451479-0/50021-2
Nicot, J.-P., Mickler, P., Larson, T., Castro, M. C., Darvari, R., Uhlman, K., et al. (2017). Methane occurrences in aquifers overlying the barnett shale play with a focus on parker county, Texas. Groundwater 55, 469–481. doi:10.1111/gwat.12508
Norvegian Ministry of Climate and Environment (2020). Norway’s integrated Ocean Management plans — barents sea–lofoten area; the Norwegian sea; and the North sea and skagerrak— report to the storting (white paper). regjeringen.no Available at: https://www.regjeringen.no/en/dokumenter/meld.-st.-20-20192020/id2699370/(Accessed June 13, 2021).
Norwegian Directorate of Fisheries (2020). Economic and biological figures from Norwegian fisheries – 2020.
Oksanen, J., Simpson, G. L., Blanchet, F. G., Kindt, R., Legendre, P., Minchin, P. R., et al. (2022). vegan: Community ecology package. Available at: https://CRAN.R-project.org/package=vegan (Accessed March 29, 2023).
Paull, C. K., Dallimore, S. R., Caress, D. W., Gwiazda, R., Melling, H., Riedel, M., et al. (2015). Active mud volcanoes on the continental slope of the Canadian Beaufort Sea. Geochem. Geophys. Geosystems 16, 3160–3181. doi:10.1002/2015GC005928
Pawlik, J. R., and McMurray, S. E. (2020). The emerging ecological and biogeochemical importance of sponges on coral reefs. Annu. Rev. Mar. Sci. 12, 315–337. doi:10.1146/annurev-marine-010419-010807
Pham, C. K., Murillo, F. J., Lirette, C., Maldonado, M., Colaço, A., Ottaviani, D., et al. (2019). Removal of deep-sea sponges by bottom trawling in the flemish cap area: Conservation, ecology and economic assessment. Sci. Rep. 9, 15843. doi:10.1038/s41598-019-52250-1
Rogers, A., Kennedy, A., Nelson, E., and Robinson, A. (2004). Patients' experiences of an open access follow up arrangement in managing inflammatory bowel disease. Qual. Saf. Health Care 13, 374–378. doi:10.1136/qhc.13.5.374
Rooks, C., Fang, J. K.-H., Mørkved, P. T., Zhao, R., Rapp, H. T., Xavier, J. R., et al. (2020). Deep-sea sponge grounds as nutrient sinks: Denitrification is common in boreo-arctic sponges. Biogeosciences 17, 1231–1245. doi:10.5194/bg-17-1231-2020
Rooper, C. N., Wilkins, M. E., Rose, C. S., and Coon, C. (2011). Modeling the impacts of bottom trawling and the subsequent recovery rates of sponges and corals in the Aleutian Islands, Alaska. Cont. Shelf Res. 31, 1827–1834. doi:10.1016/j.csr.2011.08.003
Rybakova (Goroslavskaya), E., Galkin, S., Bergmann, M., Soltwedel, T., and Gebruk, A. (2013). Density and distribution of megafauna at the Håkon Mosby mud volcano (the Barents Sea) based on image analysis. Biogeosciences 10, 3359–3374. doi:10.5194/bg-10-3359-2013
Sahling, H., Galkin, S. V., Salyuk, A., Greinert, J., Foerstel, H., Piepenburg, D., et al. (2003). Depth-related structure and ecological significance of cold-seep communities—A case study from the sea of Okhotsk. Deep Sea Res. Part I Oceanogr. Res. Pap. 50, 1391–1409. doi:10.1016/j.dsr.2003.08.004
Sano, Y., Kinoshita, N., Kagoshima, T., Takahata, N., Sakata, S., Toki, T., et al. (2017). Origin of methane-rich natural gas at the West Pacific convergent plate boundary. Sci. Rep. 7, 15646. doi:10.1038/s41598-017-15959-5
Savvichev, A. S., Kadnikov, V. V., Kravchishina, M. D., Galkin, S. V., Novigatskii, A. N., Sigalevich, P. A., et al. (2018). Methane as an organic matter source and the trophic basis of a Laptev Sea cold seep microbial community. Geomicrobiol. J. 35, 411–423. doi:10.1080/01490451.2017.1382612
Schagerström, E., and Sundell, K. S. (2021). Parastichopus tremulus (Gunnerus, 1767) red sea cucumber, red signal sea cucumber (Sweden), rødpølse (Norway and Denmark), Aspidochirotida, Stichopodidae. BECHE-DE-MER Inf. Bull. 3, 22–24.
Sedano, F., Navarro-Barranco, C., Guerra-García, J. M., and Espinosa, F. (2020). Understanding the effects of coastal defence structures on marine biota: The role of substrate composition and roughness in structuring sessile, macro- and meiofaunal communities. Mar. Pollut. Bull. 157, 111334. doi:10.1016/j.marpolbul.2020.111334
Sen, A., Åström, E. K. L., Hong, W.-L., Portnov, A., Waage, M., Serov, P., et al. (2018a). Geophysical and geochemical controls on the megafaunal community of a high Arctic cold seep. Biogeosciences 15, 4533–4559. doi:10.5194/bg-15-4533-2018
Sen, A., Chitkara, C., Hong, W.-L., Lepland, A., Cochrane, S., Primio, R., et al. (2019a). Image based quantitative comparisons indicate heightened megabenthos diversity and abundance at a site of weak hydrocarbon seepage in the southwestern Barents Sea. PeerJ 7, e7398. doi:10.7717/peerj.7398
Sen, A., Didriksen, A., Hourdez, S., Svenning, M. M., and Rasmussen, T. L. (2020). Frenulate siboglinids at high Arctic methane seeps and insight into high latitude frenulate distribution. Ecol. Evol. 10, 1339–1351. doi:10.1002/ece3.5988
Sen, A., Duperron, S., Hourdez, S., Piquet, B., Léger, N., Gebruk, A., et al. (2018b). Cryptic frenulates are the dominant chemosymbiotrophic fauna at Arctic and high latitude Atlantic cold seeps. PLOS ONE 13, e0209273. doi:10.1371/journal.pone.0209273
Sen, A., Himmler, T., Hong, W. L., Chitkara, C., Lee, R. W., Ferré, B., et al. (2019b). Atypical biological features of a new cold seep site on the Lofoten-Vesterålen continental margin (northern Norway). Sci. Rep. 9, 1762. doi:10.1038/s41598-018-38070-9
Sibuet, M., and Olu, K. (1998). Biogeography, biodiversity and fluid dependence of deep-sea cold-seep communities at active and passive margins. Deep Sea Res. Part II Top. Stud. Oceanogr. 45, 517–567. doi:10.1016/S0967-0645(97)00074-X
Sibuet, M., and Olu-Le Roy, K. (2002). “Cold seep communities on continental margins: Structure and quantitative distribution relative to geological and fluid venting patterns,” in Ocean margin systems. Editors P. D. G. Wefer, D. D. Billett, D. D. Hebbeln, P. D. B. B. Jørgensen, P. D. M. Schlüter, and D. T. C. E. van Weering (Berlin Heidelberg: Springer), 235–251. doi:10.1007/978-3-662-05127-6_15
Sinner, M., Hong, W., Michel, L., Vadakkepuliyambatta, S., Knies, J., and Sen, A. (2020). Stable isotope ratios of C, N and S in fauna sampled at the Vestbrona Carbonate Field (Norway). doi:10.17882/95359
Sinner, M., Sen, A., Hong, W. L., Michel, L. N., Vadakkepuliyambatta, S., and Knies, J. (2023). Megafauna of Vestbrona Carbonate Field and surrounding benthos from seafloor mosaics. doi:10.15468/5vrbbj
Smirnov, R. V. (2014). A revision of the Oligobrachiidae (Annelida: Pogonophora), with notes on the morphology and distribution of Oligobrachia haakonmosbiensis Smirnov. Mar. Biol. Res. 10, 972–982. doi:10.1080/17451000.2013.872799
Smirnov, R. V. (2000). Two new species of Pogonophora from the arctic mud volcano off northwestern Norway. null 85, 141–150. doi:10.1080/00364827.2000.10414563
Søreide, J. E., Hop, H., Carroll, M. L., Falk-Petersen, S., and Hegseth, E. N. (2006). Seasonal food web structures and sympagic–pelagic coupling in the European Arctic revealed by stable isotopes and a two-source food web model. Prog. Oceanogr. 71, 59–87. doi:10.1016/j.pocean.2006.06.001
Stagars, M. H., Mishra, S., Treude, T., Amann, R., and Knittel, K. (2017). Microbial community response to simulated petroleum seepage in caspian sea sediments. Front. Microbiol. 8, 764. Available at:. doi:10.3389/fmicb.2017.00764Accessed June 12, 2023)
Suess, E. (2010). “Marine cold seeps,” in Handbook of hydrocarbon and lipid microbiology. Editor K. N. Timmis (Berlin, Heidelberg: Springer), 185–203. doi:10.1007/978-3-540-77587-4_12
Suess, E. (2020). “Marine cold seeps: Background and recent advances,” in Hydrocarbons, oils and lipids: Diversity, origin, chemistry and fate. Editor H. Wilkes (Cham: Springer International Publishing), 747–767. doi:10.1007/978-3-319-90569-3_27
Sundahl, H., Buhl-Mortensen, P., and Buhl-Mortensen, L. (2020). Distribution and suitable habitat of the cold-water corals Lophelia pertusa, Paragorgia arborea, and Primnoa resedaeformis on the Norwegian continental shelf. Front. Mar. Sci. 7, 213. doi:10.3389/fmars.2020.00213
Tarasov, V. G., Gebruk, A. V., Mironov, A. N., and Moskalev, L. I. (2005). Deep-sea and shallow-water hydrothermal vent communities: Two different phenomena? Chem. Geol. 224, 5–39. doi:10.1016/j.chemgeo.2005.07.021
Torres, M. E., McManus, J., Hammond, D. E., de Angelis, M. A., Heeschen, K. U., Colbert, S. L., et al. (2002). Fluid and chemical fluxes in and out of sediments hosting methane hydrate deposits on Hydrate Ridge, OR, I: Hydrological provinces. Earth Planet. Sci. Lett. 201, 525–540. doi:10.1016/S0012-821X(02)00733-1
Vanreusel, A., Andersen, A., Boetius, A., Connelly, D., Cunha, M., Decker, C., et al. (2009). Biodiversity of cold seep ecosystems along the European margins. Oceanog 22, 110–127. doi:10.5670/oceanog.2009.12
Vedenin, A. A., Kokarev, V. N., Chikina, M. V., Basin, A. B., Galkin, S. V., and Gebruk, A. V. (2020). Fauna associated with shallow-water methane seeps in the Laptev Sea. PeerJ 8, e9018. doi:10.7717/peerj.9018
Wankel, S. D., Adams, M. M., Johnston, D. T., Hansel, C. M., Joye, S. B., and Girguis, P. R. (2012). Anaerobic methane oxidation in metalliferous hydrothermal sediments: Influence on carbon flux and decoupling from sulfate reduction. Environ. Microbiol. 14, 2726–2740. doi:10.1111/j.1462-2920.2012.02825.x
Whiticar, M. J. (1999). Carbon and hydrogen isotope systematics of bacterial formation and oxidation of methane. Chem. Geol. 161, 291–314. doi:10.1016/S0009-2541(99)00092-3
Wickham, H., Chang, W., Henry, L., Pedersen, T. L., Takahashi, K., Wilke, C., et al. (2023). ggplot2: Create elegant data visualisations using the grammar of graphics. Available at: https://CRAN.R-project.org/package=ggplot2 (Accessed March 29, 2023).
Wulff, J. (2001). Assessing and monitoring coral reef sponges: Why and how? Bull. Mar. Sci. 69, 831–846. Available at: http://pascalfrancis.inist.frvibadindex.phpaction=getRecordDetail&idt=13403160 (Accessed July 12, 2023).
Xiao, N., Cook, J., Jégousse, C., and Li, M. (2023). ggsci: Scientific journal and sci-fi themed color palettes for ggplot2. Available at: https://CRAN.R-project.org/package=ggsci (Accessed March 29, 2023).
Yamanaka, T., Shimamura, S., Nagashio, H., Yamagami, S., Onishi, Y., Hyodo, A., et al. (2015). “A compilation of the stable isotopic compositions of carbon, nitrogen, and sulfur in soft body parts of animals collected from deep-sea hydrothermal vent and methane seep fields: Variations in energy source and importance of subsurface microbial processes in the sediment-hosted systems,” in Subseafloor biosphere linked to hydrothermal systems: TAIGA concept. Editors J. Ishibashi, K. Okino, and M. Sunamura (Tokyo: Springer Japan), 105–129. doi:10.1007/978-4-431-54865-2_10
Keywords: seepage, GIS, imagery, megafauna, chemosynthesis, marine litter, benthos, sulfide
Citation: Sinner M, Hong WL, Michel LN, Vadakkepuliyambatta S, Knies J and Sen A (2023) Lack of detectable chemosynthesis at a sponge dominated subarctic methane seep. Front. Earth Sci. 11:1203998. doi: 10.3389/feart.2023.1203998
Received: 11 April 2023; Accepted: 07 July 2023;
Published: 20 July 2023.
Edited by:
Dong Liu, Chinese Academy of Sciences (CAS), ChinaReviewed by:
Erik Cordes, Temple University, United StatesOwen Sherwood, Dalhousie University, Canada
Copyright © 2023 Sinner, Hong, Michel, Vadakkepuliyambatta, Knies and Sen. This is an open-access article distributed under the terms of the Creative Commons Attribution License (CC BY). The use, distribution or reproduction in other forums is permitted, provided the original author(s) and the copyright owner(s) are credited and that the original publication in this journal is cited, in accordance with accepted academic practice. No use, distribution or reproduction is permitted which does not comply with these terms.
*Correspondence: Arunima Sen, YXJ1bmltYXNAdW5pcy5ubw==
†Present address: Loïc N. Michel, Animal Systematics and Diversity, Freshwater, and Oceanic Sciences Unit of Research (FOCUS), University of Liège, Liège, Belgium