 Junwei Qiao
 Changjian Wang
 Gang Su4
 Yu Zhang
- 1College of Geology and Environment, Xi’an University of Science and Technology, Xi’an, China
- 2Geological Research Institute for Coal Green Mining, Xi’an University of Science and Technology, Xi’an, China
- 3Shaanxi Provincial Key Laboratory of Geological Support for Coal Green Exploitation, Xi’an, China
- 4Shaanxi Shanmei Caojiatan Mining Co., Ltd., Yulin, China
There are abundant deep coal resources in northern Shaanxi, but the fragile natural environment in this area hinders the large-scale exploitation of oil-rich coal. In-situ thermal conversion of deep coal to oil and gas will become an environmentally friendly technology for oil-rich coal mining. Accurate prediction of oil-rich coal tar yield in various regions is a prerequisite. Based on a particle swarm optimization algorithm and two machine learning algorithms, BP neural network and random forest, a prediction model of tar yield from oil-rich coal is constructed in this paper. Combined with the particle swarm optimization method, the problem of slow convergence speed and possibly falling into local minimum value of BP neural network is solved and optimized. The results showed that the PSO-BP had a convergence speed about five times faster than that of the BP neural network. Furthermore, the predicted value of the PSO-BP was consistent with the measured value, and the average relative error was 4.56% lower than that of the random forest model. The advantages of fast convergence and high accuracy of the prediction model are obviously apparent. Accurate prediction of tar yield would facilitate the research process of in-situ fluidized mining of deep coal seams.
1 Introduction
Tar-rich coal is a resource that integrates coal, oil, and gas attributes, and it has received significant attention due to its high tar yield (Ju et al., 2021; Du and Li, 2022). When the coal is subjected to pyrolysis (500°C–700°C) and Gray-King assay, coal with a tar yield of more than 7% and less than or equal to 12% is classified as tar-rich coal (Jiang et al., 2020; Shi et al., 2022). This type of coal is an important way to increase oil and gas supply (one tonne of tar-rich coal can yield approximately 10% oil and 500 m3 of combustible gas (Marshall et al., 2015; Chen et al., 2017; Li et al., 2022; Ma et al., 2022), thereby realizing clean and efficient utilization of coal resources. Specifically, China is rich in tar-rich coal resources but faces the pressure of “poor oil and gas” energy, which has promoted the development of the coal-to-liquids industry (Wang et al., 2020; Wang et al., 2021; Liu et al., 2023a; Liu et al., 2023b; Liu and Li, 2023). The subversive idea of deep fluidization mining is to realize the local fluidization of solid resources in deep earth, form liquefied, gasification, electrochemical, biological, and mixed fluidization resources, and efficiently and intelligently transfer them to the surface in the form of fluidization. The subversive theory and technical conception of deep-ground fluidized mining break through the limitation of the traditional mining depth of coal solid mineral resources, and fundamentally subvert the mining mode of reliable resources. Oil-rich coal’s oil and gas properties ensure in-situ conversion in fluidized mining technology. The fluidized mining technology of deep coal seams has also been deeply studied (Zhang et al., 2023; Zhang et al., 2023; Li et al., 2023). Oil-rich coal has been one of the important ways to guarantee national energy security in China. However, more than 80% of coal is directly combusted for power generation, result in a massive wastage of precious oil resources (Xu et al., 2015; Ju et al., 2021). Moreover, only a few coal samples were tested for tar production during past geological explorations, limiting the study and large-scale development of tar-rich coal (Fu et al., 2023; Wang et al., 2023). Thus, it is essential to explore the mathematical relationship between tar yield and the geological evaluation index of tar-rich coal to predict the tar yield.
In the study of the tar-rich coal in oil-rich coal mining areas, some scholars have summarized the mathematical relationship between tar yield and coal seam thickness, industrial analysis, macrolithotype and micro-composition, ash content, actual density (Shi et al., 2022). Furthermore, a prediction model for the tar yield of low-rank coal in Shenfu Southern mining area was established using multiple linear regression and other mathematical methods, and the multiple correlation coefficient reached 0.8 (Guo et al., 2021). A general relationship exists between tar yield and these parameters, but the Pearson correlation coefficient is low, indicating a complex nonlinear relationship. Thus, a machine learning method is suitable for investigating the relationship between tar yield and other geological evaluation indices of coal. With the progress of science and technology, the technique of machine learning is more and more applied to the geological coal industry such as gas outburst prediction (Wu et al., 2020; Gao et al., 2023; Zhu et al., 2023), coal ash softening temperature prediction (Liang et al., 2020), coal gangue identification (Wang et al., 2022), coal dust wettable identification (Zheng et al., 2023), coal seam impact risk assessment (Zhang et al., 2022), etc. It has become a new research hotspot in coal geological engineering practice to mine the relationship between various nonlinear big data through machine learning algorithms to realize data prediction. Based on the geological data, coal quality testing data and geophysical logging data of Huangling mining area in the past geological exploration stage, the relationship between tar-rich coal tar yield and geophysical logging data has been studied, and the calculation model of tar-rich coal tar yield and logging compensation density value has been established (Yan et al., 2022). Using logging data, BP neural network technology has been applied to predict coal tar yield (Zhao et al., 2021).
Although the above study can get a particular-pattern of tar yield, it is only a rough estimate. The research using the BP neural network method to predict the tar yield is still in the beginning stage. There are some problems, such as slow convergence speed and easy falling into the local optimum, so it can not realize the accurate prediction of the tar yield of the coal that has been mined before but has not been tested (Zhang et al., 2022; Li et al., 2022). In this paper, we established the prediction model of PSO-BP, which combines the PSO algorithm and BP neural network based on the geological evaluation index of tar-rich coal. In this paper, the particle swarm optimization algorithm (PSO) is used to optimize the BP network connection weights and thresholds to overcome the defects of BP network. Based on the measured coal quality data in the past, the PSO-BP tar yield prediction model was established to predict the coal tar yield. The convergence speed and prediction accuracy are significantly improved compared with the traditional BP network.
2 Materials and methods
2.1 Experimental data
Samples of coal were obtained from coal seam 2–2 in oil-rich coal mining areas, which have high calorific value, rich tar, low ash, low sulfur, and low phosphorus. The coals were analyzed according to ISO 17247:2013 (Coal-Ultimate analysis) and ISO 17246:2010 (Coal-Proximate analysis). Proximate analysis used an automatic analyser to determine the moisture (Mad), ash (Ad), volatile matter (Vdaf), and fixed carbon (FCad) content of coal samples. The ultimate analysis of coal was performed to determine the elemental content of C,H and S. The seven geological evaluation indices [volatile matter (Vdaf), ash (Ad), moisture (Mad), fixed carbon (FCad), Sulfur (St,d), hydrogen (Hdaf) and carbon (Cdaf)] and tar yield values of 52 coal samples were used for this research. These seven coal quality indicators are the external manifestation of the essential nature of coal. From the analysis results of these seven coal quality indicators, the types of coal, processing and utilization ways and mining technologies can be related and corresponding policies can be adopted for efficient mining.
Some studies show that with the increase of volatile matter, the coal tar yield shows a weak, increasing trend. The moisture content in coal decreases with the increase in coal grade, and the moisture content also affects the tar yield. The effect of ash content on tar yield is reflected in that clay minerals in ash composition are positively correlated with tar. In contrast carbonate minerals are negatively correlated with tar yield (Du and Li, 2022). Tar yield is also closely carbon structure of the carbon in coal. Carbon content (Cdaf) and hydrogen content (Hdaf) determine the H/C atomic ratio of coal, which indicate the key hydrogen-rich structure or the distribution type of hydrogen and oxygen elements in coal (Liu et al., 2016; Li et al., 2022), which plays a more critical role in tar yield. The migration of sulfur content (St,d) during pyrolysis also affects the tar yield. In addition, as the most widely tested items in coal, these seven indices have been generally recorded in the previous exploration results. The selection of these seven indices to predict the coal tar yield of great significance to realize the full utilization of the previous exploration results.
2.2 BP neural network
The BP network has a simple structure, is easy to use, and has broad applicability (Hinton et al., 2006). The design of the BP neural network is shown in Figure 1, which is composed of an input layer, a hidden layer and an output layer. The layers are fully connected to each other (Wu et al., 2020; Wang et al., 2022). The input layer is the normalized value of each coal geological evaluation index, and the output layer is the value of tar yield to be predicted.

FIGURE 1. BP neural network structure for predicting tar yield.
2.3 Particle swarm optimization (PSO) algorithm
Although BP neural network has excellent self-learning, high fault tolerance, good generalization performance, and other advantage, but could be better, there are some things that could be improved. Given the main defect of slow convergence speed, many researchers focus on combination with other intelligent algorithms. The combination with different intelligent algorithms is mainly combined with genetic algorithm (GA) and Particle Swarm Optimization (PSO) algorithm. We introduce PSO to improve the convergence speed and accuracy of the tar yield prediction model.
Based on previous research, the PSO algorithm can obtain the optimal global value and assign it to the weight and threshold of the BP neural network, which can overcome some of the defects of the BP neural network (Li et al., 2022; Zhu et al., 2023). PSO is an algorithm that searches for the best solution by simulating the movement and flocking of birds. The algorithm randomly initializes a flock of birds over the search space, where each bird is called a “particle.” These “particles” fly with a certain velocity and find the best global location after some iterations. The steps of the PSO algorithm are as follows (Moazen et al., 2023; Song et al., 2023; Yin et al., 2023).
Step 1. Initialize the particle swarm (there are n particles): assign a random initial location and velocity to each particle.
Step 2. Calculate the fitness value according to the objective function of the optimization problem.
Step 3. Compare the fitness value of the particle’s current location with its historical best location (pbest). If the fitness value of the current location is better, the place location is replaced.
Step 4. Compare the fitness value of the particle’s current location with its global best location (gbest). If the fitness value of the current location is better, the gbest is replaced.
Step 5. Update the velocity and location of each particle according to Eq. 1 and Eq. 2.
Step 6. The global optimum is output if the stopping criteria are achieved, Otherwise, the algorithm goes back to Step 2.
2.4 Random forest regression
Random forest is a supervised machine learning method that integrates decision trees as individual learners. It further introduces randomness into the training process of decision trees, so that it has excellent anti-overfitting and anti-noise ability. The random forest algorithm performs the following steps.
1) Extract a training set from the original sample. Each round uses Bootstrapping to extract n training examples from the original sample set (with replacement sampling). A total of k extractions are made.
2) One training set obtains a model at a time, resulting in k models from k training sets.
3) For the regression problem, calculate the mean of the above model as the final result.
3 The establishment of a tar yield prediction model
3.1 Structure design of BP neural network
Firstly, the node number of the input and output layers of the BP network is determined according to the actual problem. Then the most appropriate hidden layer number and node number are determined on the premise of ensuring the accuracy of the algorithm. As for the number of hidden layers, the three-layer BP network of a single hidden layer can complete the nonlinear mapping of any dimension (Hinton et al., 2006; Liang et al., 2020; Zhang et al., 2022). Thus, the network structure of a single hidden layer is adopted. As for the number of nodes in the hidden layer, too many nodes may lead to a massive amount of computation, while too few nodes may reduce the model’s accuracy (Tang et al., 2023; Xie et al., 2023). Thus, the number of hidden layer nodes is usually determined according to the empirical formula, as shown in Eq. 3:
Where H, I and O are the nodes of the network’s hidden layer, input layer and output layer respectively. B is a natural number from (0,10).
3.2 The structure of particles and populations
Based on the particle population of training sample data, the mapping relationship between the weight and threshold of the BP network and the particle dimension of PSO is established. Suppose the number of neurons in the input layer, hidden layer and output layer of the BP network is I, H and O respectively, the spatial dimension of PSO particles is d=I×H+H×O+O, which corresponds to the number of weights and thresholds in the BP neural network.
3.3 Construction of fitness function
The mean square error calculation formula of BP neural network output is used as the fitness function of PSO algorithm, as shown in Eq. 4.
Where yi is the i-th actual output value of the network; y′i is the expectation value of the i-th.
3.4 Design of PSO-BP neural network model
The steps of weight and threshold of BP neural network optimized based on particle swarm optimization are as follows. The algorithm flow of the PSO-BP model is shown in Figure 2.
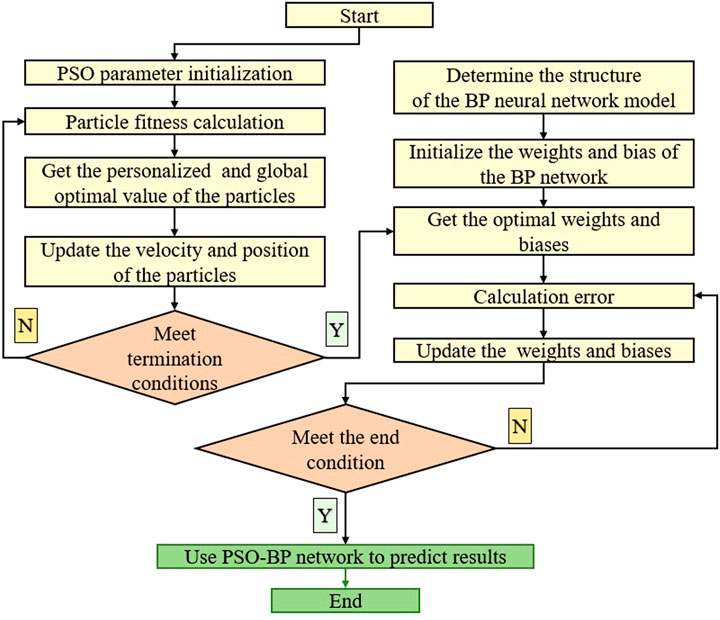
FIGURE 2. Flow of PSO-BP model algorithm.
Input: Training sample set.
Step 1. Initialize network parameters.
1) Set the learning parameters of the BP network. These include the activation function, training function, learning rate (lr), goal error (goal), and maximum iterations (epochs), which are determined based on the training sample data.
2) Set the parameters of the PSO algorithm. The parameters in the particle swarm are initialized, including the number(n) of particles, their initial location (xi) and velocity (vi) of particles, acceleration constants (c1, c2), inertia weight (w), optimal personalized value (pbest) and global optimal value (gbest).
Step 2. Iteratively update particle locations, velocities, individual optimal values, and global optimal values.
1) Calculate the fitness value F(x) of each particle based on Eq. 4, and then calculate the pbest and gbest.
2) Update the location and velocity of particles based on Eq. 1 and Eq. 2, and then update the pbest and gbest.
Step 3. Evaluate whether one of the following conditions is met. If yes, go to Step 4; otherwise, Step 2.
1) The training errors of the network meet the accuracy requirements.
2) The training frequency of the network reaches the maximum number of iterations.
Step 4. Output the global optimum (gbest) and assign the weight and threshold to the network. The algorithm ends.
Output: A trained BP neural network. This illustration belongs to 3.5.
3.5 The structure of random forest
The establishment of random forest model is inseparable from the combination of decision trees. Similar to the flowchart of the tree structure, a decision tree is a recursive process from top to bottom. It starts from the tree’s root node, selects the optimal features in different internal nodes, determines the corresponding branch according to the test output, and the final result comes from the nodes of the leaf of the decision tree (Figure 3).
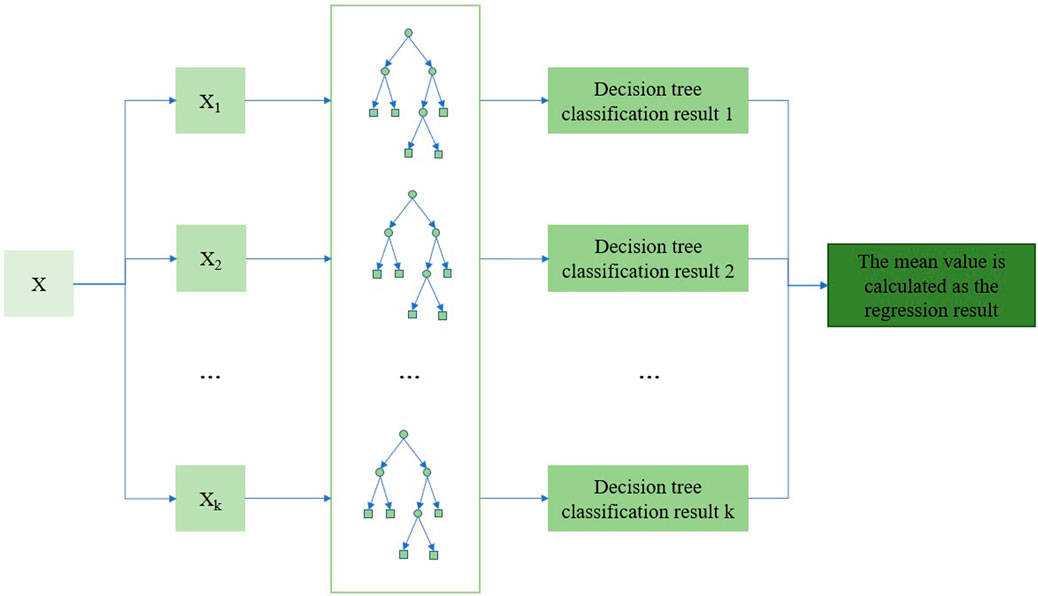
FIGURE 3. Random forest principle for predicting tar yield.
4 The studying and training of the tar yield prediction model
4.1 Learn parametric sample selection
We collected 52 coal quality analysis data of coal seam 2–2 in oil-rich coal mining areas, and used the data set random partition function in the python language sci-kit-learn machine learning library to take 40 coal quality analysis data as the training data set of the model, and the other 12 coal quality analysis data as the test data set of the model. The industrial analysis and elemental analysis data of 40 groups of coal samples are used as training dataset for the model. The dataset includes seven geological evaluation indices [volatile matter (Vdaf), ash (Ad), moisture (Mad), fixed carbon (FCad), Sulfur (St,d), Hydrogen (Hdaf), and carbon (Cdaf)] and tar yield values of 40 coal samples used as the model output parameters. Part of the original training sample data is shown in Table 1. The statistical data of the actual training sample and the correlation coefficients with the tar yield are shown in Table 2.
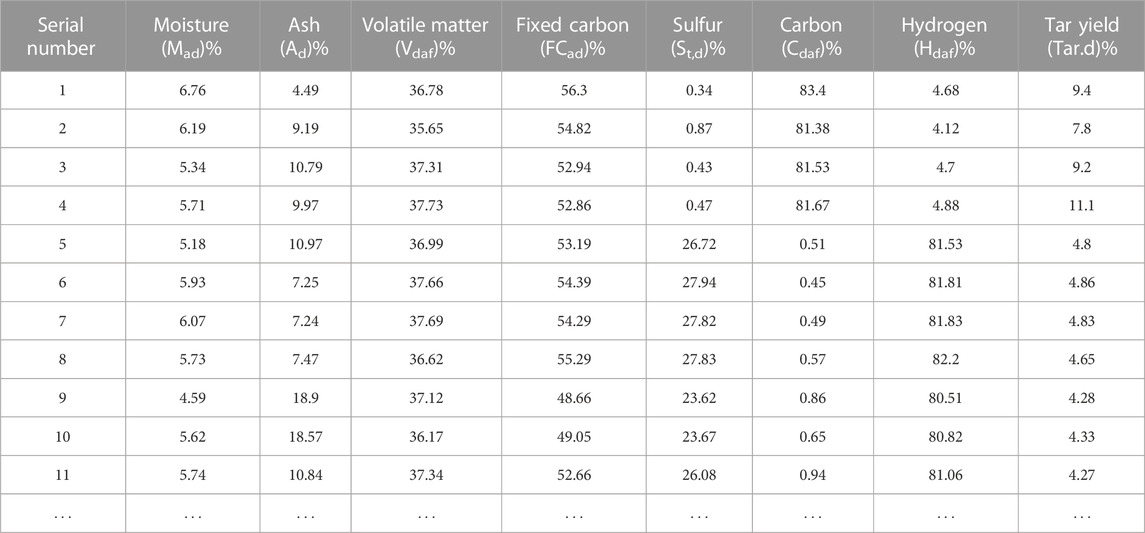
TABLE 1. Original training sample data (partial data).
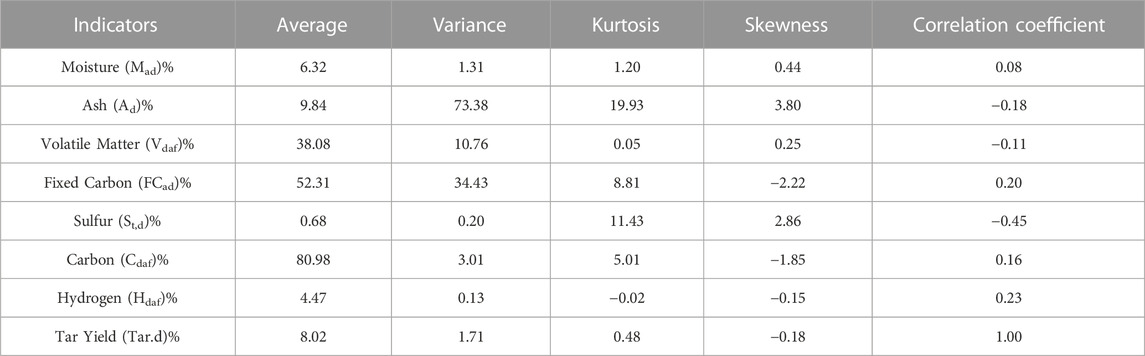
TABLE 2. Statistical data of various coal quality indicators.
4.2 Preprocessing training data
If the geological evaluation indices of coal with significant differences are directly input to the model, the prediction accuracy will be reduced and the convergence speed will be slow. Therefore, the z-score standardized method was adopted to map the input sample data to the same magnitude, as shown in Eq. 5:
Where
4.3 Select and set model parameters
4.3.1 Select studying and training parameters of BP networks
Based on the practical problem, the number of nodes in the input and output layers of the BP neural network was determined to be 7 and 1 respectively. These values were then substituted into Eq. 3 to calculate that H ranged from 2 to 13. After repeated tests, the optimal number of hidden layer nodes was determined to be 4. The target error goal was 0.25, the learning rate was set to 0.005, and the maximum number of iterations was set to epochs = 3000. The activation function for the hidden layer was selected as the Sigmoid function, a smooth function biased towards derivative and can map any input to the range of [0,1]. The BP neural network’s iterative training and optimization process is shown in Figure 4.
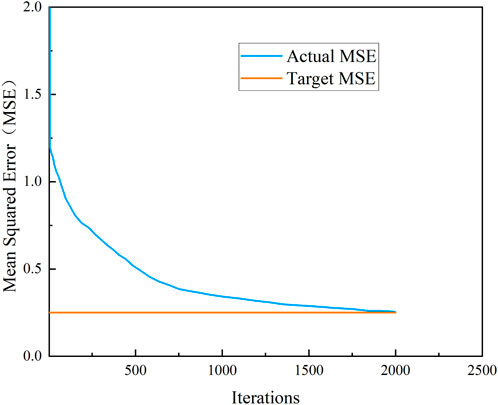
FIGURE 4. BP neural network iterative training optimization process.
4.3.2 Set the PSO algorithm parameters
The number of particles generally ranges from 20 to 200. A large number of particles leads to a robust global optimization ability of the algorithm but also increases the amount of computation and slows down the convergence speed. Thus, based on the complex nonlinear relationship between the input and output of the model, the number of particles was set to 50 to obtain the global optimum.
The inertia weight w affects the global and local search ability of particles. The more oversized w is, the more conducive it is to global search; the smaller w is, the more conducive it is to local search. Therefore, the value of w was set to 0.1.
The acceleration constants c1 and c2 are the weights that adjust the role of their experience and social experience in their motion. The fixed c1 and c2 are only limited to the application of some problems and cannot be generalized to all problem domains. In general, c1 + c2 ≤ 4, and c1 = c2 = 1.49445 is commonly used.
To balance the algorithm’s running speed and the practical problem’s needs, the maximum of iterations was set to 30 (Li et al., 2022).
4.3.3 Set the random forest parameters
To establish a reliable tar yield prediction model, it is necessary to adjust the parameters of the random forest regression algorithm to obtain the optimal algorithm parameters.
The most crucial algorithm parameter is the number of decision trees. A small number of decision trees will not make the effect of the model entirely play, and a large number of decision trees will not only reduce the training and prediction speed of the model, but also cause the problem of over-fitting. In this problem, when the number of decision trees is greater than 50, the accuracy performance of the model almost stops improving. Therefore, the value 50 is selected as the optimal this paper’s random forest regression algorithm in this paper.
Parameters such as max tree depth, max min leaf nodes, and max number of features have little impact on the random forest regression model, and we keep the default Settings in the scikit-learn machine learning library.
4.4 Comparison of model training speed
The original training data in Table 1 were imported into the BP and PSO-BP models for training after standardized processing. The training times required for both models to achieve the target accuracy requirements were obtained. The iterative training process of the PSO-BP neural network is shown in Figure 5. The random forest model is not iterative, so we don't compare its training speed.
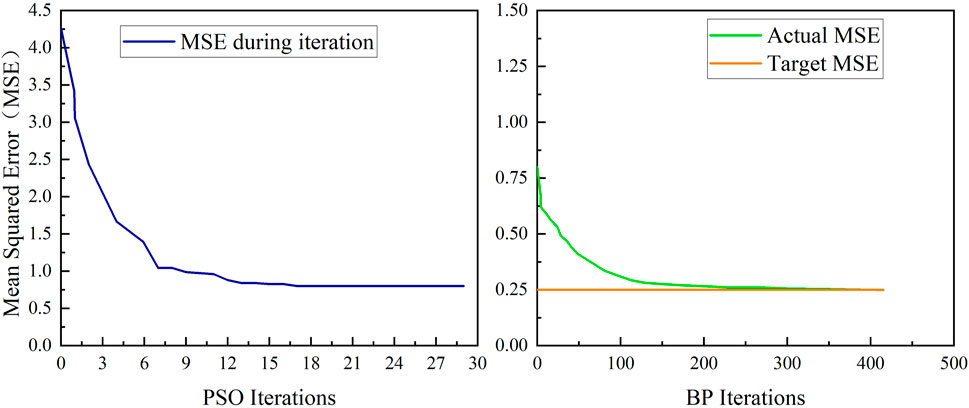
FIGURE 5. PSO-BP neural network iterative training process.
It can be seen from Figure 5 that the PSO-BP prediction model needs about 400 iterations to meet the accuracy requirements, while the BP neural network prediction model needs about 2000 iterations. Therefore, the training speed of the PSO-BP prediction model was about five times faster than the BP prediction model when meeting exact same accuracy requirements. It indicates that the BP network optimized by the PSO algorithm overcomes the problem of slow convergence speed, and improves the training speed.
5 Practical engineering project
In engineering practice, the model’s generalization ability is more important than the fitting performance. To test the prediction performance and universality of the tar yield prediction model, we used three models of BP neural network, PSO-BP, and random forest to predict the tar yield values of the 12 test set data mentioned above and compared them with the measured values.
The test set data are standardized and then imported into BP model and PSO-BP model respectively. Since the random forest model is not sensitive to the numerical magnitude, the test set brought into the random forest model does not need to be standardized. The comparison between the predicted and measured values of each model is shown in Figure 6, and the corresponding error is shown in Table 3.
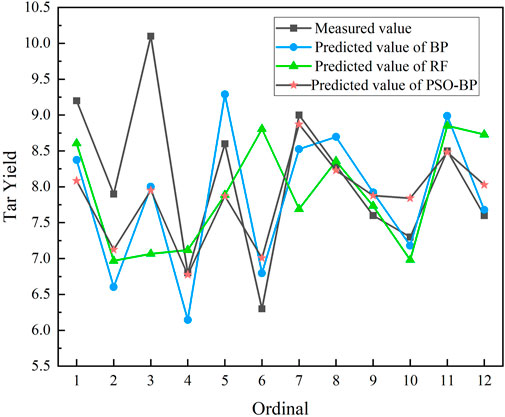
FIGURE 6. Comparison of predicted values and measured values of tar yield in each model.
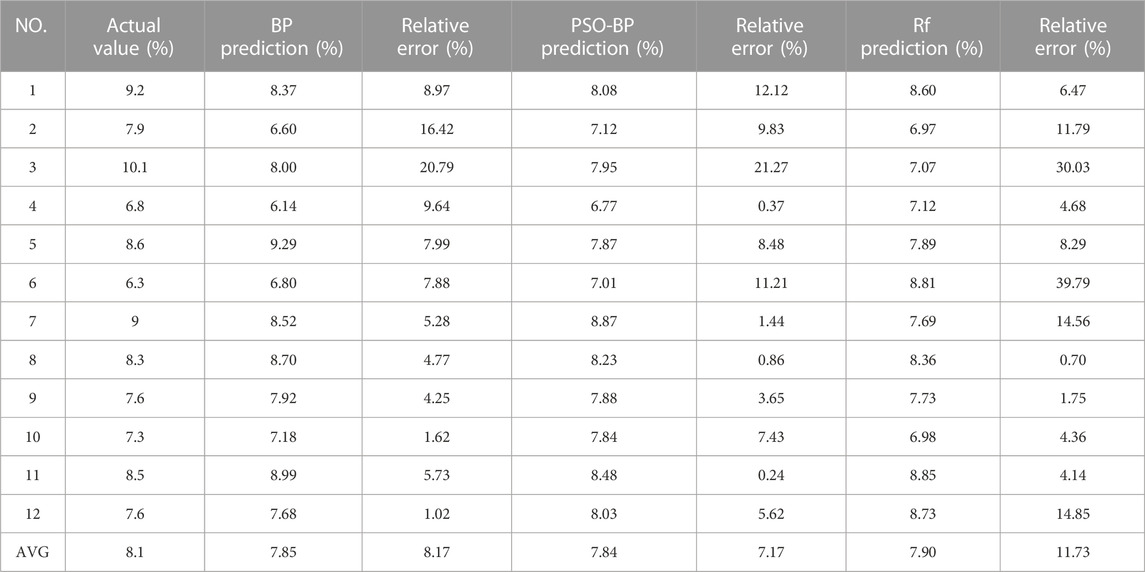
TABLE 3. Analysis of tar yield prediction deviation.
Figure 6 shows deviations between the predicted values of the three predictive models and the measured values. Notably, the PSO-BP network model is more accurate than the BP network and random forest model, with a better fitting effect and the predicted values are closer to the measured values. As shown in Table 3, the relative errors of the PSO-BP network model are minor. Compared with the BP network model, the PSO-BP tar yield prediction model has a more stable nonlinear fitting ability and more vital generalization ability. Compared with the random forest model, the results of the PSO-BP model are more accurate. The model is a simple and effective method for predicting the tar yield, indicating the nonlinear relationship between the geological evaluation index (industrial analysis and elemental analysis) and the tar yield index of coal.
6 Conclusion
Based on the three machine learning algorithms, a tar yield prediction model was constructed for seven geological evaluation indices of tar-rich coal in oil-rich coal mining areas. Following conclusions were drawn.
(1) The convergence speed of the PSO-BP model was about five times faster than that of the traditional BP network, thus overcoming the disadvantage of slow convergence speed of the BP network.
(2) The coal tar yield of the 2–2 coal seam in oil-rich coal mining areas was predicted, and verified, demonstrating the model’s easy implementation, high prediction accuracy, and strong generalization ability.
(3) The practical engineering project showed that the predicted values of the PSO-BP model were close to the measured values. The relative error of the PSO-BP model was smaller than that of the random forest model, and the average relative error of the 12 test samples was reduced by 4.56%. Therefore, the prediction accuracy and universality of the PSO-BP model were significantly improved compared to the random forest model, providing reliable data support and a new technical approach for coal tar yield prediction.
In conclusion, the PSO-BP prediction model provides reliable data support and a new technical approach for predicting coal tar yield.
Data availability statement
The original contributions presented in the study are included in the article/supplementary material, further inquiries can be directed to the corresponding author.
Author contributions
JQ: resources, investigation, supervision, project administration, funding acquisition, writing—review and editing. CW: methodology, coding, investigation, data processing, validation, visualization, writing—original draft, writing—review and editing. GS: Sample collection and data analysis. XL: investigation, data processing. SD: data processing. YJ: data processing. YZ: data processing. All authors contributed to the article and approved the submitted version.
Funding
The study was supported by the Science and Technology Research Program of Shaanxi Coal and Chemical Industry Group Co., Ltd. (No. 2021SMHKJ-A-J-0702).
Conflict of interest
Author GS was employed by Shaanxi Shanmei Caojiatan Mining Co., Ltd. The authors declare that this study received funding from Shaanxi Coal and Chemical Industry Group Co., Ltd. The funder had the following involvement in the study: sample collection and data analysis.
Publisher’s note
All claims expressed in this article are solely those of the authors and do not necessarily represent those of their affiliated organizations, or those of the publisher, the editors and the reviewers. Any product that may be evaluated in this article, or claim that may be made by its manufacturer, is not guaranteed or endorsed by the publisher.
References
Chen, J., Deng, C., Wang, H., and Sun, X. (2017). Main oil generating macerals for coal-derived oil: A case study from the jurassic coal-bearing turpan basin, NW China. Org. Geochem. 111, 113–125. doi:10.1016/j.orggeochem.2017.05.004
Du, Z. H., and Li, W. (2022). The catalytic effect from alkaline elements on the tar-rich coal pyrolysis. Catalysts 12, 376. doi:10.3390/catal12040376
Fu, D., Yu, Z., Gao, K., Duan, Z., Wang, Z., Guo, W., et al. (2023). Thermodynamic analysis on in situ underground pyrolysis of tar- rich coal: Secondary reactions. Acs Omega 8, 12805–12819. doi:10.1021/acsomega.2c08033
Gao, Y., Yu, Z., Chen, W., Yin, Q., Wu, J., and Wang, W. (2023). Recognition of rock materials after high-temperature deterioration based on SEM images via deep learning. J. Mater. Res. Technol. 25, 273–284. doi:10.1016/j.jmrt.2023.05.271
Guo, C., Wang, S. Q., Shi, Q. M., Qiao, J. W., Li, H. T., Zhang, W. G., et al. (2021). Chemical compositions and technological properties of low-rank coals in the south Shenfu mining area: Characteristics, relationship and practice. Coal Geol. Explor. 49, 87–99. doi:10.3969/j.issn.1001-1986.2021.01.009
Hinton, G. E., Osindero, S., and Teh, Y. W. (2006). A fast learning algorithm for deep belief nets. Neural Comput. 18, 1527–1554. doi:10.1162/neco.2006.18.7.1527
Jiang, H. X., Wang, M. Y., Li, Y., Jin, L. J., and Hu, H. Q. (2020). Integrated coal pyrolysis with steam reforming of propane to improve tar yield. J. Anal. Appl. Pyrolysis 147, 104805. doi:10.1016/j.jaap.2020.104805
Ju, Y., Zhu, Y., Zhou, H., Ge, S., and Xie, H. (2021). Microwave pyrolysis and its applications to the in-situ recovery and conversion of oil from tar-rich coal: An overview on fundamentals, methods, and challenges. Energy Rep. 7, 523–536. doi:10.1016/j.egyr.2021.01.021
Li, H. T., Cao, D. Y., Zou, X. Y., Zhu, Z. R., Zhang, W. G., and Xia, Y. (2022a). Raman spectroscopic characterization and surface graphitization degree of coal-based graphite with the number of aromatic layers. Spectrosc. Spectr. Analysis 42, 2616–2623. doi:10.3964/j.issn.1000-0593(2022)08-2616-08
Li, S. X., Shao, L. Y., Liu, J. S., Qin, L. Z., Kang, S. L., Eriksson, K. A., et al. (2022b). Oil generation model of the liptinite-rich coals: Palaeogene in the xihu sag, east China sea shelf basin. J. Petroleum Sci. Eng. 209, 109844. doi:10.1016/j.petrol.2021.109844
Li, X. L., Zhang, X. Y., Shen, W. L., Zeng, Q., Chen, P., Qin, Q., et al. (2023). Research on the mechanism and control technology of coal wall sloughing in the ultra-large mining height working face. Int. J. Environ. Res. Public Health 20 (2), 868. doi:10.3390/ijerph20010868
Li, Y., Zhou, L., Gao, P., Yang, B., Han, Y., and Lian, C. (2022c). Short-term power generation forecasting of a photovoltaic plant based on PSO-BP and GA-BP neural networks. Front. Energy Res. 9, 824691. doi:10.3389/fenrg.2021.824691
Liang, W., Wang, G., Ning, X., Zhang, J., Li, Y., Jiang, C., et al. (2020). Application of BP neural network to the prediction of coal ash melting characteristic temperature. Fuel 260, 116324. doi:10.1016/j.fuel.2019.116324
Liu, P., Le, J., Wang, L., Pan, T., Lu, X., and Zhang, D. (2016). Relevance of carbon structure to formation of tar and liquid alkane during coal pyrolysis. Appl. Energy 183, 470–477. doi:10.1016/j.apenergy.2016.08.166
Liu, S. M., and Li, X. L. (2023). Experimental study on the effect of cold soaking with liquid nitrogen on the coal chemical and microstructural characteristics. Environ. Sci. Pollut. Res. 30 (3), 36080–36097. doi:10.1007/s11356-022-24821-9
Liu, S. M., Sun, H. T., Zhang, D. M., Yang, K., Li, X., Wang, D., et al. (2023b). Experimental study of effect of liquid nitrogen cold soaking on coal pore structure and fractal characteristics. Energy 275 (7), 127470. doi:10.1016/j.energy.2023.127470
Liu, S. M., Sun, H. T., Zhang, D. M., Yang, K., Wang, D., Li, X., et al. (2023a). Nuclear magnetic resonance study on the influence of liquid nitrogen cold soaking on the pore structure of different coals. Phys. Fluids 35 (1), 012009. doi:10.1063/5.0135290
Ma, L., Mao, Q., Wang, C. a., Duan, Z., Chen, M., Yang, F., et al. (2022). Investigation of pyrolysis and mild oxidation characteristics of tar-rich coal via thermogravimetric experiments. Acs Omega 7, 25613–25624. doi:10.1021/acsomega.2c02786
Marshall, C., Large, D. J., Meredith, W., Snape, C. E., Uguna, C., Spiro, B. F., et al. (2015). Geochemistry and petrology of Palaeocene coals from Spitsbergen - Part 1: Oil potential and depositional environment. Int. J. Coal Geol. 143, 22–33. doi:10.1016/j.coal.2015.03.006
Moazen, H., Molaei, S., Farzinvash, L., and SabaeiPSO-Elpm, M. (2023). PSO-ELPM: PSO with elite learning, enhanced parameter updating, and exponential mutation operator. Inf. Sci. 628, 70–91. doi:10.1016/j.ins.2023.01.103
Shi, Q. M., Wang, S. M., Wang, S. Q., Guo, C., Cai, Y., Du, F. P., et al. (2022). Multi-source identification and internal relationship of tar-rich coal of the Yan'an Formation in the south of Shenfu. J. China Coal Soc. 47, 2057–2066. doi:10.13225/j.cnki.jccs.2021.1046
Song, Q., Yu, L., Li, S., Hanajima, N., Zhang, X., and Pu, R. (2023). Energy dispatching based on an improved PSO-aco algorithm. Int. J. Intelligent Syst. 2023, 1–17. doi:10.1155/2023/3160184
Tang, X., Xu, B., and Xu, Z. (2023). Reactor temperature prediction method based on CPSO-RBF-BP neural network. Appl. Sciences-Basel 13, 3230. doi:10.3390/app13053230
Wang, D., Ni, J., and Du, T. (2022). An image recognition method for coal gangue based on ASGS-CWOA and BP neural network. Symmetry-Basel 14, 880. doi:10.3390/sym14050880
Wang, S. M., Sun, Q., Qiao, J. W., and Wang, S. Q. (2020). Geological guarantee of coal green mining. J. China Coal Soc. 45, 8–15. doi:10.13225/j.cnki.jccs.YG19.1758
Wang, S., Shi, Q., Wang, S., Shen, Y., Sun, Q., Cai, Y., et al. (2021). Effects of glycated glutenin heat-processing conditions on its digestibility and induced inflammation levels in cells. J. China Coal Soc. 46, 1365–1377. doi:10.3390/foods10061365
Wang, Z., Yang, F., Fu, D., Ma, L., Duan, Z., Wang, Q., et al. (2023). Economic and heating efficiency analysis of double-shell downhole electric heater for tar-rich coal in-situ conversion. Case Stud. Therm. Eng. 41, 102596. doi:10.1016/j.csite.2022.102596
Wu, Y., Gao, R., and Yang, J. (2020). Prediction of coal and gas outburst: A method based on the BP neural network optimized by gasa. Process Saf. Environ. Prot. 133, 64–72. doi:10.1016/j.psep.2019.10.002
Xie, Y., Gao, C., Wang, P., Zhou, L., Zhang, C., and Qu, X. (2023). Research on vibration fatigue damage locations of offshore oil and gas pipelines based on the GA-improved BP neural network. Shock Vib. 2023, 1–18. doi:10.1155/2023/2530651
Xu, J., Yang, Y., and Li, Y. W. (2015). Recent development in converting coal to clean fuels in China. Fuel 152, 122–130. doi:10.1016/j.fuel.2014.11.059
Yan, H., Duan, Z., and Wang, J. (2022). Study on the relationship model between oil-rich coal tar yield and compensation density in huangling mining area. Coal Geol. China 34, 25–30. doi:10.3969/j.issn.1674-1803.2022.10.05
Yin, S., Jin, M., Lu, H., Gong, G., Mao, W., Chen, G., et al. (2023). Reinforcement-learning-based parameter adaptation method for particle swarm optimization. Complex and Intelligent Syst. doi:10.1007/s40747-023-01012-8
Zhang, H., Niu, F., Zhang, J., and Yu, X. (2022a). Prediction of three-dimensional fractal dimension of hematite flocs based on particle swarm optimization optimized back propagation neural network. Min. Metallurgy Explor. 39, 2503–2515. doi:10.1007/s42461-022-00684-z
Zhang, J. C., Li, X. L., Qin, Q. Z., Wang, Y., and Gao, X. (2023b). Study on overlying strata movement patterns and mechanisms in super-large mining height stopes. Bull. Eng. Geol. Environ. 82 (3), 142. doi:10.1007/s10064-023-03185-5
Zhang, K., Zhu, J., He, M., Jiang, Y., Zhu, C., Li, D., et al. (2022b). Research on intelligent comprehensive evaluation of coal seam impact risk based on BP neural network model. Energies 15, 3292. doi:10.3390/en15093292
Zhang, L. B., Shen, W. L., Li, X. L., Wang, Y., Qin, Q., Lu, X., et al. (2023a). Abutment pressure distribution law and support analysis of super large mining height face. Int. J. Environ. Res. Public Health 20 (1), 227. doi:10.3390/ijerph20010227
Zhao, J., Yan, H., Wang, J., and Wang, S. (2021). The Research on coal tar productivity prediction method based on logging information. Prog. Geophys. 2021, 1–10.
Zheng, H., Shi, S., Jiang, B., Zheng, Y., Li, S., and Wang, H. (2023). Research on coal dust wettability identification based on GA-BP model. Int. J. Environ. Res. Public Health 20, 624. doi:10.3390/ijerph20010624
Keywords: particle swarm optimization (PSO), BP neural network, machine learning, oil-rich coal, tar yield prediction
Citation: Qiao J, Wang C, Su G, Liang X, Dong S, Jiang Y and Zhang Y (2023) Application research on the prediction of tar yield of deep coal seam mining areas based on PSO-BPNN machine learning algorithm. Front. Earth Sci. 11:1227154. doi: 10.3389/feart.2023.1227154
Received: 22 May 2023; Accepted: 26 June 2023;
Published: 04 July 2023.
Edited by:
Xuelong Li, Shandong University of Science and Technology, ChinaReviewed by:
Lei Shi, China University of Mining and Technology, Beijing, ChinaYu Xuguang, Tangshan Vocational and Technical College, China
Copyright © 2023 Qiao, Wang, Su, Liang, Dong, Jiang and Zhang. This is an open-access article distributed under the terms of the Creative Commons Attribution License (CC BY). The use, distribution or reproduction in other forums is permitted, provided the original author(s) and the copyright owner(s) are credited and that the original publication in this journal is cited, in accordance with accepted academic practice. No use, distribution or reproduction is permitted which does not comply with these terms.
*Correspondence: Changjian Wang, Y2hhbmdqaWFuX3dhbmc2NkAxNjMuY29t