- 1College of Petroleum Engineering, China University of Petroleum, Qingdao, China
- 2Shengli Petroleum Administration Bureau, Dongying, China
- 3School of Engineering and Technology, China University of Geosciences, Beijing, China
During the operation of the drill string, it displays a degree of flexibility. Simultaneously, its dynamic properties, influenced by complex stress conditions, manifest nonlinearity and uncertainty. A comprehensive investigation into the dynamics of flexible drill strings is imperative for deep well drilling. This paper presents a model that simulates random interactions between a flexible drill string and the borehole wall, simplifying the actual drill string model using analogous principles. Dynamic simulation software is utilized for analysis, and an indoor experimental setup has been established. The results reveal that with a constant weight on bit (WOB), higher drill string rotational speeds correlate with increased susceptibility to buckling deformation. Additionally, the critical time for deformation onset exhibits a nearly linear relationship with rotational speed. Maintaining a constant rotational speed, an increase in WOB enhances the likelihood of buckling deformation. The experimental findings suggest a correlation between the drill string’s rotation frequency and the WOB.
1 Introduction
In the petroleum industry, the gradual depletion of shallow oil and gas resources has resulted in an increase in the number of deep and ultra-deep wells. Consequently, drill pipe failure accidents have become more frequent (Zhang and Zhu, 2020). Drill pipe failures primarily occur due to the intricate interplay of tensile, compressive, and torsional forces, as well as the impact of drilling fluids on the drill string during operation. The motion of the drill string is highly complex, typically involving coupled motions that include transverse, longitudinal, and torsional vibrations (Fang et al., 2022; Xie et al., 2023). The dynamic characteristics of the drill pipe can diminish drilling efficiency and cause wear. Given that the drill pipe’s radial dimension is significantly smaller than its axial length, it is typically modeled as an elongated flexible rod. Consequently, it is crucial to analyze the spatial orientation of downhole flexible drill columns and to examine their dynamic behavior under specific WOB and speeds (Arslan et al., 2014; Liu, 2014; Gao and Huang, 2015; Xue et al., 2015; Wang, 2016; Xue et al., 2019). The study of drilling string mechanics originated in the 1950s with Lubinsky’s development of the “second-order curved drill string theory” and the “pendulum drill string theory.” Both theories are formulated using the classical differential equation method (Lubinski, 1950; Lubinski and Woods, 1953; Lubinski and Woods, 1955). Subsequent research by D.W. Dareing and B.J. Livesay primarily focused on the vibration analysis of drill columns (Dareing and Livesay, 1968). Millherm and Apostal developed a dynamic finite element model of the bottom hole assembly (BHA) using D. Alembert’s principle. This model integrates inertial forces, friction, drilling forces, and drill column buoyancy (Millheim and Apostal, 1981a; Millheim and Apostal, 1981b). As the study of flexible drill pipe dynamics advances, the complexity of mathematical models increases, necessitating the development of numerical methods to tackle these challenges (Khulief and Al-Naser, 2005). Dykstra has made a significant contribution to the field by developing a nonlinear dynamic finite element model of the drill pipe (Dykstra, 1996; Dykstra et al., 2001). Mitchell and Allen supported the use of the finite element method for analyzing complex BHA assemblies and conducted extensive numerical investigations into downhole drilling tool motions. Advances in finite element methods and computer technology have been pivotal in driving research on drill pipe dynamics (Mitchell and Allen, 1987; Ritto, 2010; Omojuwa et al., 2014).
Experimental observation is a vital method for studying drill column dynamics. For instance, Zhang developed a model test rig for drilling columns (Zhang, 2001), and numerous researchers have performed related model test studies (Gao et al., 1996; Liu et al., 2000; Guan et al., 2003; Li et al., 2004; Li et al., 2017). In the investigation of flexible drill column dynamics, substantial efforts have been dedicated to determining the critical buckling load and its influencing factors (Gao and Miska, 2009; Gao and Miska, 2010; Huang and Gao, 2014; Qin et al., 2016; Zhu and Li, 2019). Salies et al. (1994) observed that high axial forces result in complex spiral buckling patterns in drilling tools. Cunha JC modeled the pipe string as a rod within a tube, noting that it buckles into a sinusoidal shape when the axial force exceeds a critical threshold (Cunha, 2003). Chen et al. comprehensively reviewed and analyzed the buckling deformation characteristics and patterns of flexible drill strings (Chen and Li, 2011; Chen and Fang, 2013; Fang et al., 2013). Liu et al. (2018) examined the post-buckling behavior of a long rod confined in a circular tube. These studies primarily emphasized the impact of axial load on drill column buckling. Additionally, friction on the drill column is recognized as a crucial factor affecting the critical buckling load (Jia et al., 2022). However, rotational speed is also a significant factor in determining the flexibility of the drill pipe, with fewer studies addressing this aspect. Furthermore, the friction between the drill column and the well wall is influenced by both the axial load and the rotational speed of the drill column.
To analyze the motion of a flexible drill string under varying conditions of axial force and rotational speed, a novel theoretical model is established. Given the high strength of the actual drill pipe material, it only exhibits flexible rod properties when there is a significant difference between axial and radial dimensions. However, this scenario is challenging to replicate in laboratory experiments. To overcome this, the principle of similarity is employed to create a drill pipe model suitable for both simulation and laboratory testing. The mathematical model is very complex and difficult to solve, but it is still possible to analyse the motion of the drill pipe under different drill weights and speeds by simulation. Concurrently, an experimental apparatus is designed to study this problem, and the experimental results are compared with the simulation outcomes to verify the model’s reliability. Finally, a dynamic simulation of an actual bottom hole assembly is performed. This simulation can analyze drill string vibrations during actual drilling operations and provide support for subsequent analyses.
2 Mathematical model
2.1 Basic assumptions
During the drilling process, the bit interacts with the rock through the combined action of weight on bit (WOB) and torque. The axial length of the drill pipe is usually several kilometres long, much larger than its radial dimensions. This disparity allows the drill pipe to bend easily under the influence of WOB and torque. Additionally, the drill pipe is constrained by the borehole wall during deformation. When the drill pipe bends beyond the borehole size, it inevitably contacts the borehole wall, complicating its buckling deformation. To simplify the model and study the nonlinear dynamics of drill pipe buckling, we made the following assumptions:
(1) The drill string remains in a linear elastic state, with plastic deformation being ignored;
(2) Before deformation, the drill string axis coincides with the borehole axis;
(3) The diameter of the borehole in any horizontal section is uniform and circular;
(4) The well wall is rigid and does not deform upon contact with the drill string.
2.2 Governing equations
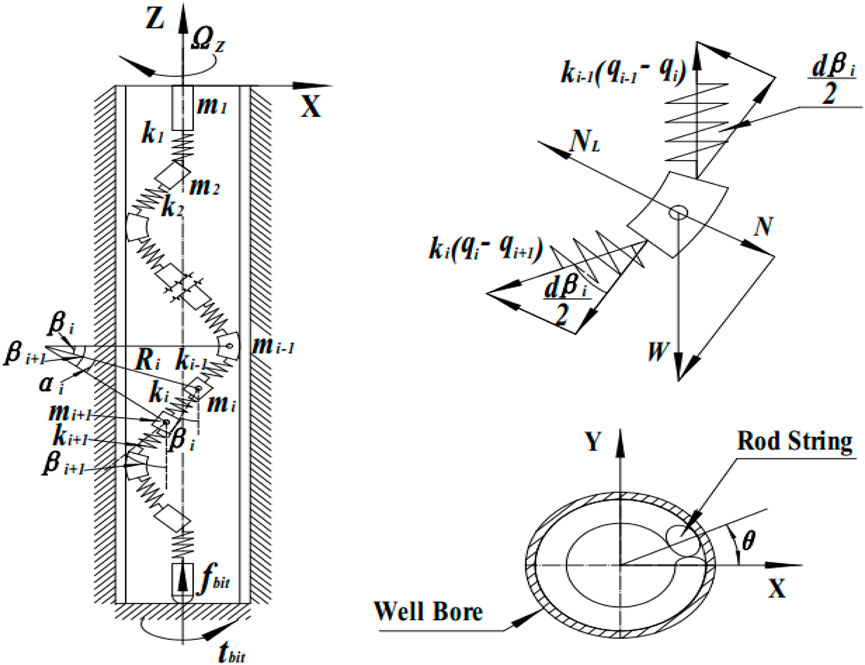
Numerous studies have shown that under the constraints of the wellbore, the drill pipe buckles as the axial load increases. As illustrated in Figure 1, the drill string can be considered as a series of infinitesimal modules connected by spring elements. To describe the characteristics of the drill string, a Cartesian three-dimensional coordinate system is introduced, with its origin positioned at the lower part of any concentric stabilizer. The concentric stabilizer reduces the impact of the upper drill string’s movement on the lower drill string, making the sections between the stabilizers relatively independent. The movement of each module can be represented by
Where Ri represents the radius of curvature of block mi; r represents the well bore radius; p represents the pitch of helical buckling; θ is the angle from initial position of strings.
The system can be solved by Euler—Lagrange equation in Eq. 2:
The Lagrange operator L can be derived from Eq. 3:
Where Fi represents the non-conservative force, Ti represents the kinetic energy and Ui represents the potential energy which can be described by Eq. 4:
Where mi represents the concentrated mass,
As shown in Figure 1,
Where
As the block
Note that
Where
The damping force
where
The boundary conditions for drill string movement are as follows: the upper end experiences tension and torque, while the bottom bit is subjected to WOB and torque. When the lateral displacement of the drill string exceeds the clearance between the drill string and the wellbore, it becomes constrained by the wellbore.
The friction force
Where
where
The uncertain interaction of the bit-rock
where
where
The equations presented indicate that the drilling tool experiences axial forces, torque, gravitational weight, and contact forces between the drill pipe and borehole wall, as well as between the drill bit and rock mass, leading to rotary motion. In this paper, a straight wellbore is assumed. When the combination of drilling tools and the interaction between the drill bit and rock body are constant, the main factors influencing the rotational state of the drilling tools are drilling pressure and rotational speed. Adjusting the drilling pressure and rotational speed alters the rotational speed of the drilling tools, which in turn changes the collision force between the drill pipe and the well wall. These variances lead to differences in the rotational state. The establishment and analysis of drill string dynamics model is helpful to the understanding of drill string motion. In addition, it also helps to guide the parameter selection and boundary conditions determination of subsequent numerical simulations and experiments.
3 Numerical analysis and experimental verification
3.1 Numerical analysis and experimental model
Advances in computer technology have led to the maturation of dynamic analysis and simulation for mechanical systems. During simulations, the Cartesian coordinate system of the cylinder’s center of mass and Euler angles or generalized Euler angles, which represent rigid body displacements, are typically used as generalized coordinates. The dynamic equation established using the Lagrange multiplier method is shown in Eq 17
Holonomic constraint is shown in Eq. 18
The non-holonomic constraint is shown in Eq. 19
Where
The application of numerical simulation can quickly adjust multiple model parameters, reducing the need for a large number of physical experiments, resulting in significant efficiency improvements. However, the reliability of the numerical simulation results is heavily dependent on the reasonable construction of the analysis model. In this study, relevant simulations are conducted by constructing a physical model that mirrors the simulation model and applying identical loading conditions. The simulation results are subsequently compared with experimental results to validate the reliability of the numerical simulation analysis.
3.1.1 Numerical analysis model
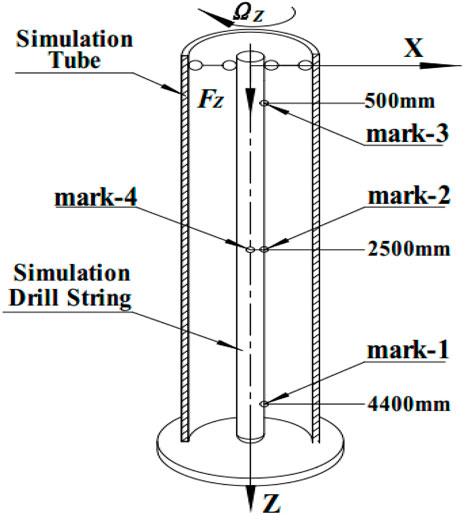
The dynamic simulation model of the drill string is established as shown in Figure 2. During the simulation and testing processes, the simulated borehole radius R is set to 90 mm. As the axial load increases, the simulated drill string will gradually bend. However, it will contact the borehole wall once the bending amplitude reaches a certain value. Under the constraints of the borehole wall, the simulated drill string exhibits a different motion pattern compared to free buckling. Numerical analysis can be employed to evaluate its motion state under various conditions.
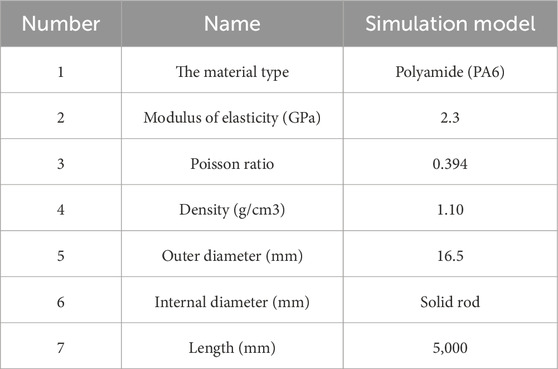
These parameters of the drill string model are presented in Table 1. When establishing a rigid-flexible coupling model, it is essential to refine the models of the well wall, drill bit, and bottom rock. Fixed pairs should be added between the well wall and the earth, as well as between the bit and the drill pipe. Additionally, parallel pairs should be included between the drill pipe and the well wall (Yang et al., 2021). Gravity load must be applied to the entire model, with contact forces added between the drill pipe and the well wall, and between the bottom rock and the drill bit. The bushing force between the bottom rock and the earth also needs to be incorporated. The STEP function is used to apply a unidirectional force and a single degree of freedom drive to the upper section of the drill pipe. The simulation time for the model is set to 30 s, with a step size of 200 steps. The Newmark method is employed to solve the model. A modal set is assigned to the flexible drill string. By using a combination of modal vectors and modal coordinates, the elastic displacement at any point on the object can be determined. The elastic displacements of all regions at each moment can be linearly combined to describe its deformation movement.
To investigate the impact of bit weight and rotational speed on drill pipe motion, various combinations of rotational speed and WOB parameters are selected for simulation. The detailed parameters are presented in Table 2 below. These conditions are selected based on the preceding theoretical analysis.
In this simulation, four reference points are selected for analysis and illustration, as depicted in Figure 2. These points include mark-1 (located at the outer wall of the drill string’s 4400 mm section), mark-2 (at the outer wall of the 2,500 mm section), mark-3 (at the outer wall of the 500 mm section), and mark-4 (at the center of the 500 mm section).
3.1.2 Experiment test device and principle
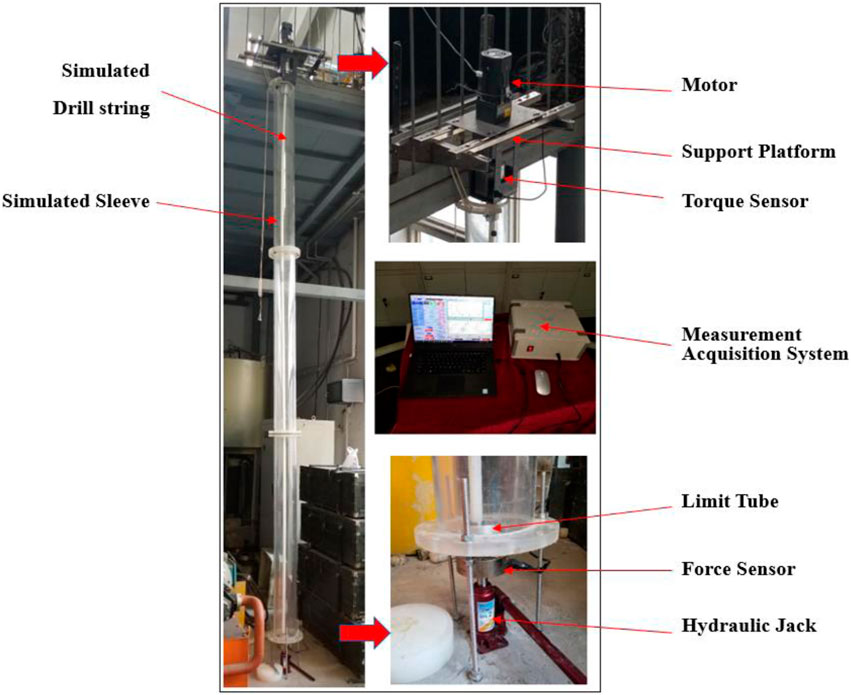
Based on the relevant parameters in the numerical simulation, a dynamic model test rig of the drill pipe was established. Thus, the motion state of the drill pipe under different conditions is analysed, and the test rig is shown in Figure 3.
The test bench consists of a motor, force and torque sensors, a hydraulic jack, a simulated drill string and sleeve, a measurement acquisition system, and relevant connection and limit firmware. The motor, which drives the rotation of the simulated drill string, can adjust the rotation speed by using an inverter. The torque sensor measures the real-time turning torque and speed of the simulated drill string. A force sensor, installed between the support and the hydraulic jack, measures and monitors the force supplied by the hydraulic system. This force is equivalent to the WOB provided in the simulation. Additionally, a high-speed camera is used to measure the buckling shape and motion trajectory of the drill string.
The length of the simulated drill string in this test device is 5 m, matching the dimensions of the software dynamics simulation model. The drill string is positioned along the central axis of the simulated wellbore, with its upper end fixed and connected to the torque sensor, serving as the fixed end. The lower end functions as the loading end. Upon axial compression, the simulated drill string deforms. The hydraulic jack applies the axial load, with the loading force determined by the pressure sensor. The loading end consists of a cylindrical pair, permitting vertical movement and rotation. The spatial movement and buckling of the simulated drill string are confined by the simulated wellbore. The test method and procedure are detailed in Table 3.
3.2 Result and analysis
3.2.1 Drillstring buckling and motion trajectory
Dynamic simulation allows for the acquisition of the trajectory of each point on the drill string. Due to the extensive number of simulations, only the results at each reference point under a rotation speed of 2 RPS and a WOB of 40 N are presented, as depicted in Figures 4 through 6.
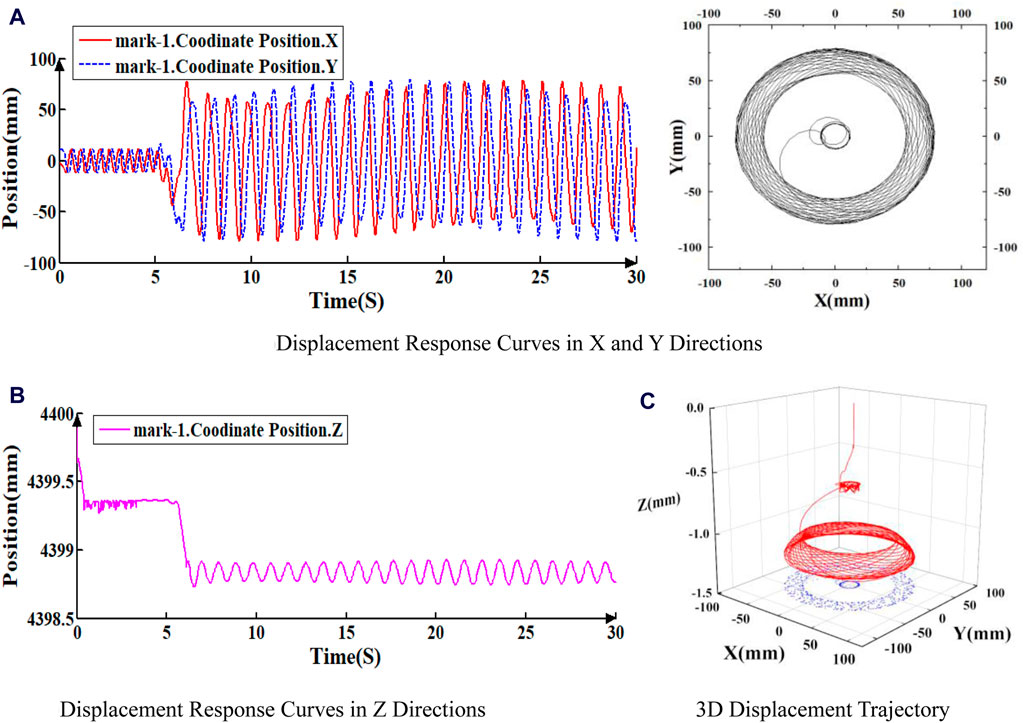
Figure 4. Displacement response curve of Mark-1 under 2RPS and 40N. (A) Displacement response curves in X and Y directions. (B) Displacement response curves in Z directions. (C) 3D displacement trajectory.
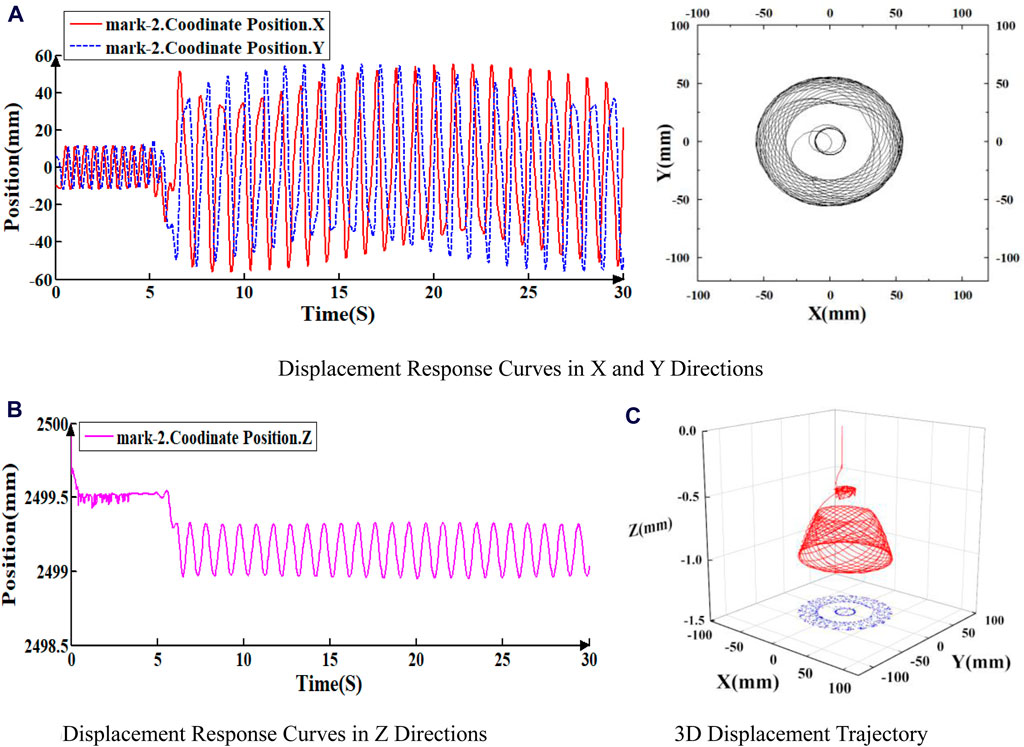
Figure 5. Displacement response curve of Mark-2 under 2RPS and 40N. (A) Displacement response curves in X and Y directions. (B) Displacement response curves in Z Directions (C) 3D Displacement trajectory.
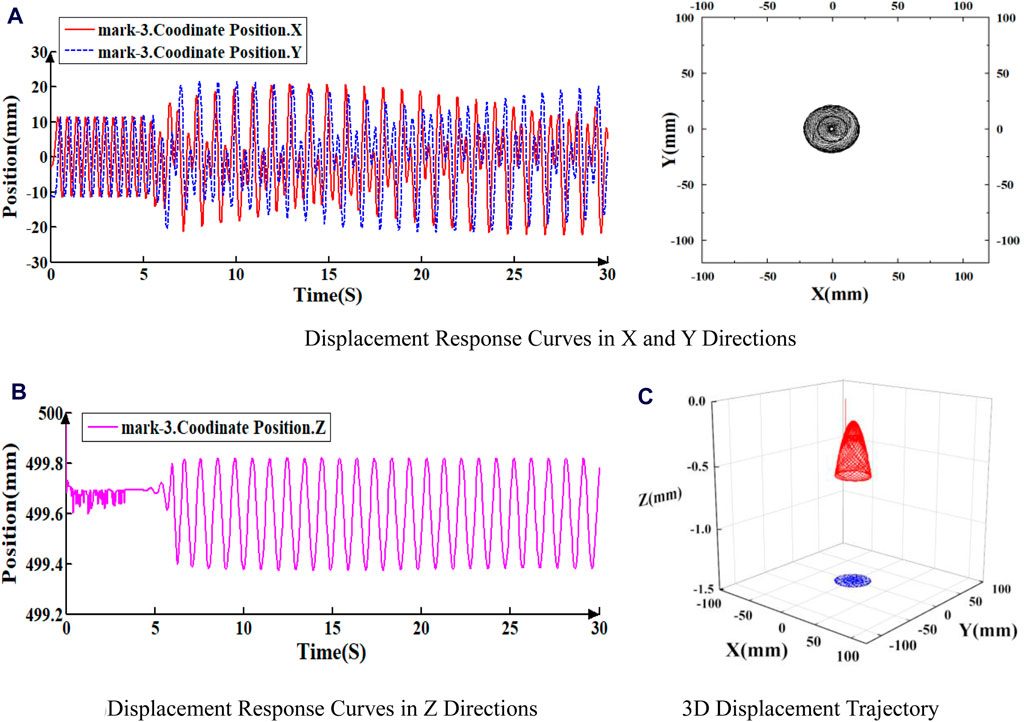
Figure 6. Displacement response curve of Mark-3 under 2RPS and 40N. (A) Displacement response curves in X and Y directions. (B) Displacement response curves in Z directions (C) 3D Displacement trajectory.
As illustrated in Figures 4 through 6, the displacement response curves and 3D displacement trajectories of the three points indicate that the drill string’s motion is unstable. Initially, the drill string exhibits slight fluctuations around its axis before rotating stably. However, at a specific moment (6.12 s in this instance), lateral vibrations commence, accompanied by periodic axial fluctuations, signifying the onset of buckling and whirling. Notably, the transverse vibration amplitude increases closer to the bit. The maximum horizontal displacement in the X and Y directions at point mark_3 is approximately 75 mm. At point mark_2, the maximum horizontal displacement in the X and Y directions is about 50 mm. At point mark_1, the maximum horizontal displacement in the X and Y directions is approximately 20 mm.
As depicted in Figure 7, a camera is employed to capture and record the movement trajectory of the drill string during the indoor experiment. Video editing software with track tracking functionality is used to outline the movement trajectory for each state of the drill string. A point on the outer wall of the cross-section at 2,500 mm on the simulated drill string is selected as point mark-2 for analysis. After curve processing and editing, the movement trajectory of the drill string within the wellbore profile is obtained, as shown in Figure 8.
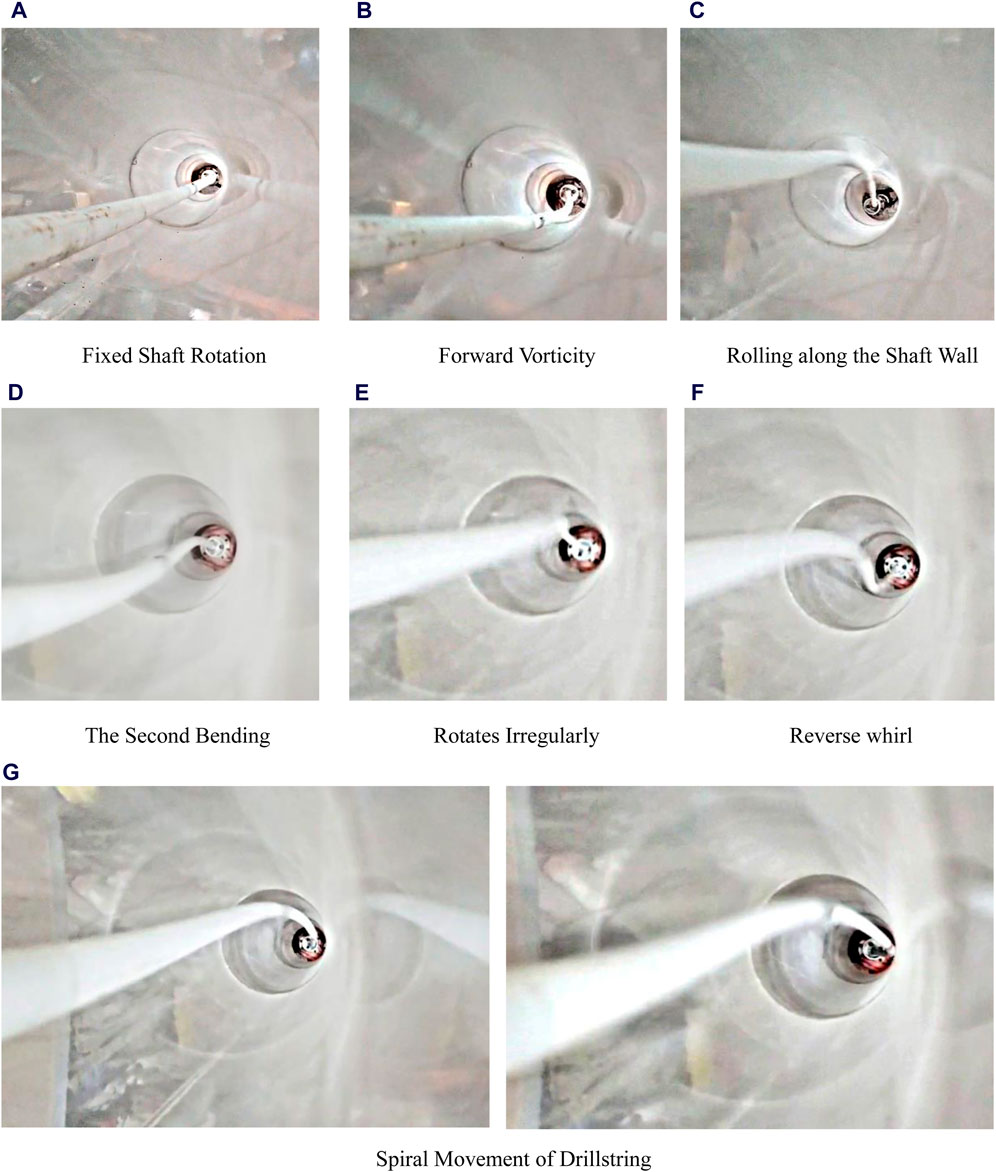
Figure 7. Buckling state of drillstring during movement. (A) Fixed shaft rotation. (B) Forward vorticity. (C) Rolling along the shaft wall. (D) The second bending. (E) Rotates irregularly. (F) Reverse whirl. (G) Spiral movement of drillstring.
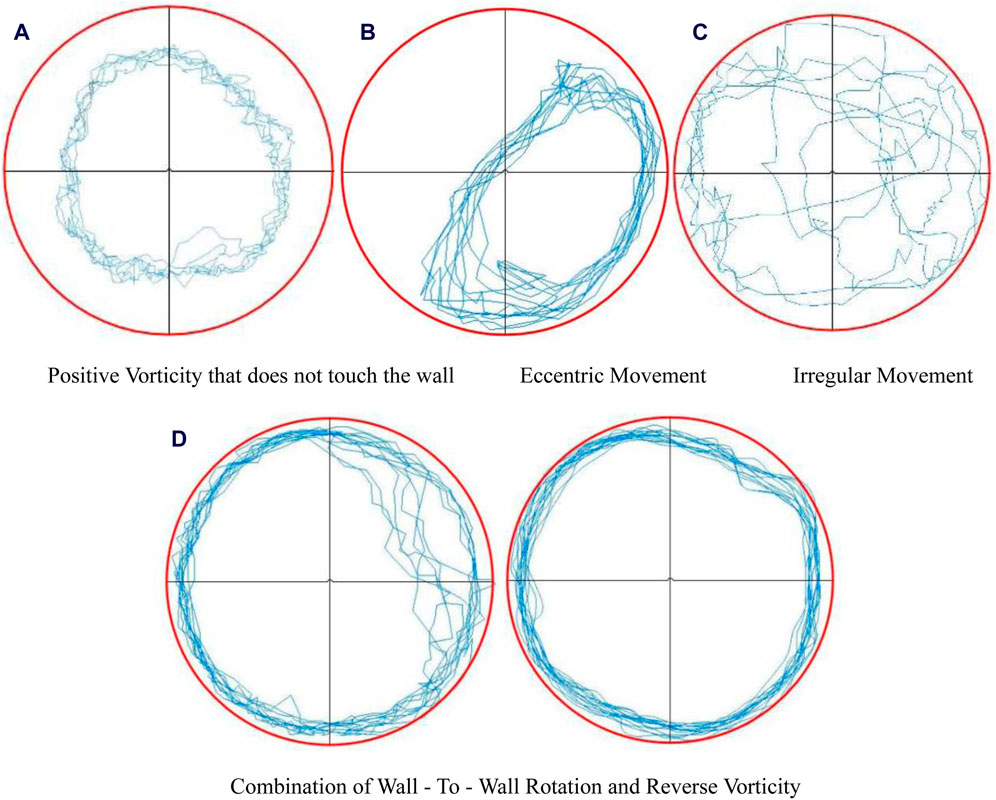
Figure 8. Trajectories of different drillstring motion states. (A) Positive vorticity that does not touch the wall. (B) Eccentric movement. (C) Irregular movement. (D) Combination of wall—to—wall rotation and reverse vorticity.
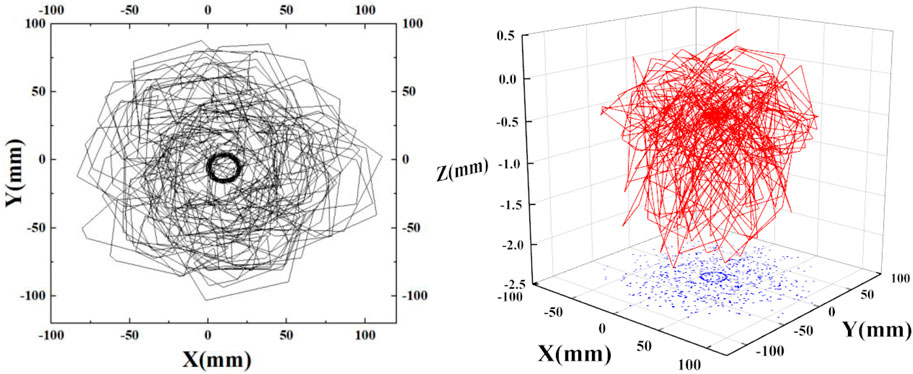
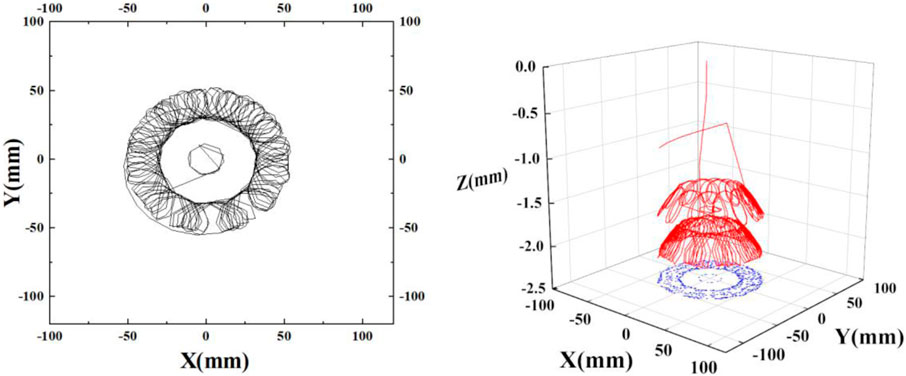
When the drill string rotates within the casing, its motion can include rotation around or near a fixed axis, forward eccentric whirl without contact with the well wall, wall-to-wall rolling, reverse whirl, irregular movement, and combinations of two or more of these movements. Actual observations revealed that the drill string maintained an eccentric motion, for some time after the rotation began. The drill string consistently oscillated in the lower right part of the wellbore. As the rotational speed increases, the drill pipe transitions to rolling against the wall and eventually into a state of irregular motion.
3.2.2 Influence of the rotation speed verification
To investigate the effect of rotation speed on the drill string’s motion, an axial pressure of 40N is applied to the drill string, and the rotation speed is varied at 1RPS, 2RPS, 3RPS, 4RPS, 5RPS, and 6RPS. The cross-section direction and 3D displacement trajectory of Mark-2 at 6RPS are depicted in Figure 9.
To determine the influence of rotation speed on the drill string’s movement, the Fourier transform is applied to the vibration signals of Mark-2 in the X-axis direction at various rotation speeds. The frequency domain response is presented in Figure 10.
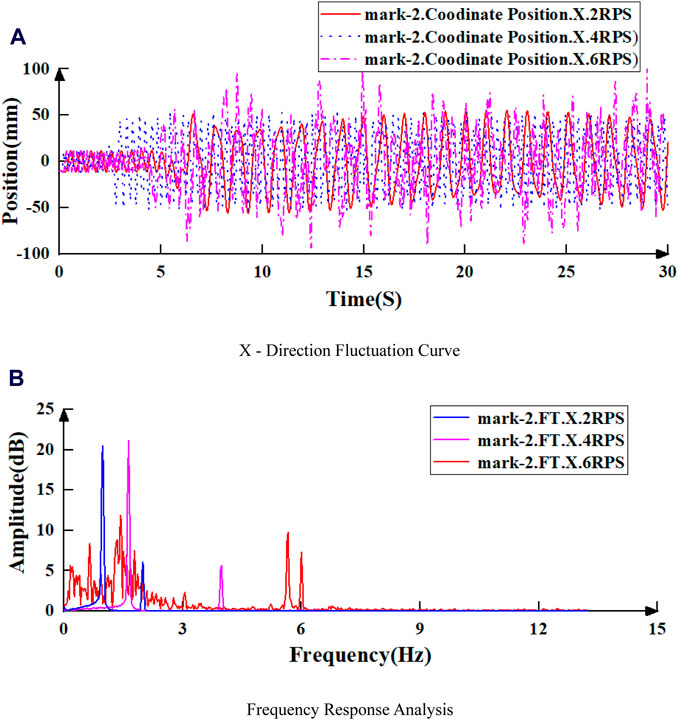
Figure 10. X-direction fluctuation and frequency response of Mark-2 under different rotary speed. (A) X-direction fluctuation curve. (B) Frequency response analysis.
Simultaneously, the critical time required for the drill pipe to change from spin to vortex and the rotational frequency of the drill pipe are recorded in the indoor experiments. These results are then analysed in comparison with the simulation results.
3.2.2.1 Influence of the rotation speed on buckling deformation of the drillstring
As shown in Figure 11, when the weight on bit is constant, the higher the rotational speed of the drill string, the easier it is to bend and deform. As rotation speed increases, the time required for the drill string to transition from fixed-axis or near-fixed-axis rotation to positive whirl decreases. When the speed approaches 0 RPS, the critical time becomes infinite because whirl cannot occur without rotation. At simulated speeds exceeding 6 RPS (equivalent to 129.6 RPM, which is close to the actual operating speed of the drill string), The rotation around its axis becomes difficult to observe. This is due to the extremely short interval between the steady rotating state and the whirl state.
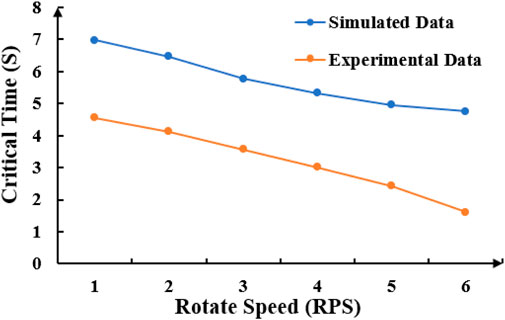
Figure 11. Critical time of drillstring rotation to forward vorticity with the change of rotation speed.
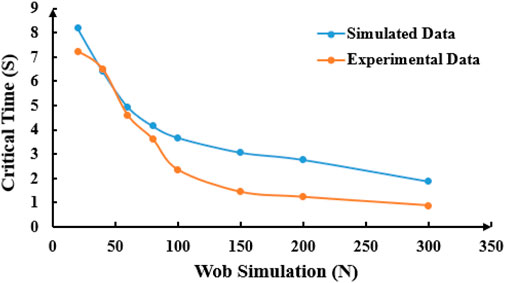
When the rotation speed is the same, the critical time for the drill pipe to enter the whirling state in the experiment is shorter than the simulation result. Two potential reasons may explain this discrepancy: ① The drill pipe in the experiment is made of PA6 with a length of 5 m. The flexibility of the rod is large and the wall thickness is small. Permanent flexural deformation, caused by drilling pressure and torque during rotation in the test, may have led to an offset in the drill pipe’s center of gravity in subsequent experiments. ② Material unevenness in the simulated drill pipe, stress defects during transportation, and loosening of device component connections may have increased susceptibility to eccentricity. These factors will result in the critical time of the drill pipe from rotation to whirling state in the experiment is less than the theoretical time.
3.2.2.2 Influence of the rotational speed on whirl frequency of drill string
As shown in Figures 12, 13, when WOB is constant, the swing frequency of drill pipe increases with the increase of rotational speed. When the test rotation speed exceeds 4 RPS, the drill string’s swing frequency markedly increases. However, in the simulation, the critical speed is identified as 5 RPS, which may be attributed to systematic experimental errors. When the rotation speed is below this range, the whirl frequency is approximately 0.5 times the rotation frequency, maintaining an approximately linear relationship.
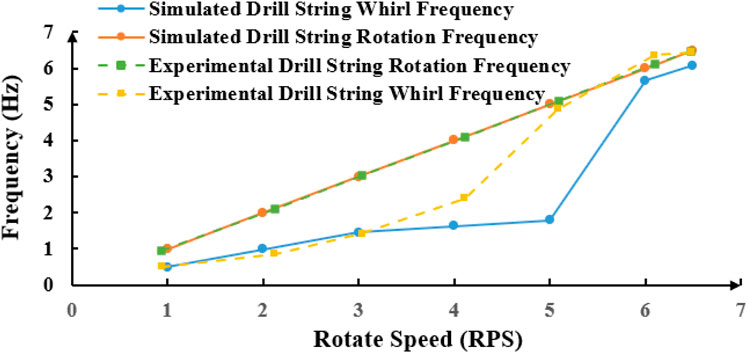
Figure 12. Relation curve of whirl frequency and rotation frequency with the change of rotation speed.
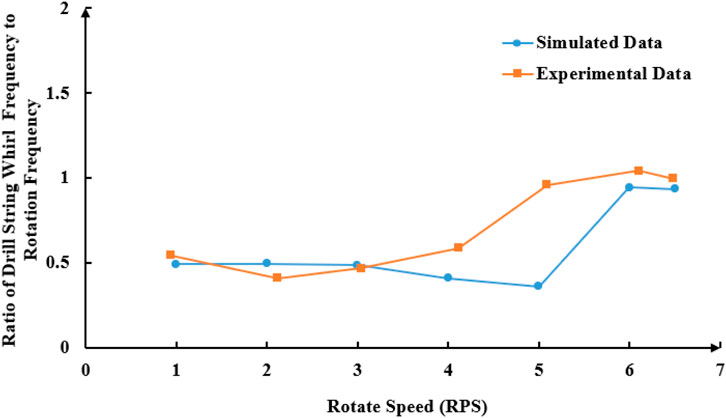
Figure 13. Relation of ratio of drill string whirl and rotation frequency changing with rotation speed.
From the experimental data, it can be seen that the rotational speed of the drill pipe is 86.4 r/min when the oscillation frequency surge occurs, and the rotational speed corresponding to the oscillation frequency surge in the simulation is 108 r/min (5*21.6 = 108 r/min). Similarly, the surge point of the ratio of the swing frequency to the rotation frequency of the drill pipe in the test corresponds to the rotation speed of 88.7 r/min. The relationship between the drill pipe swing frequency and the rotation frequency remains consistent before and after the surge point in both the test and simulation.
The earlier surge point of the oscillation frequency of the drill pipe in the test compared to the simulation can be attributed to two main reasons: ① In the simulation, the simplification of the drill pipe-wall-bit model and the software’s calculations reduce the friction between the drill pipe and the well wall, ignore air resistance, and overlook both the stress defects of the drill pipe and the energy loss in power transmission. These factors contribute to a larger surge speed in the simulation.② The simulated drill pipe is made of PA6, the weaknesses of PA6 are more likely to be magnified during rotation compared to an actual seamless steel pipe. As a result, the measured surge speed in the test is smaller.
3.2.3 Influence of the WOB verification
To investigate the impact of the WOB on the motion of the drill string, various WOB values of 20N, 40N, 60N, 100N, 150N, 200N, and 300N are applied to the drill string sequentially. The rotation speed is maintained at 2 RPS. Figure 14 illustrates the cross-section direction and 3D displacement trajectory of Mark-2 under a WOB of 300N.
To assess the impact of WOB on the movement of point Mark-2, a Fourier transform is applied to the movement curve of Mark-2 along the X-axis under different WOB values, as depicted in Figure 15.
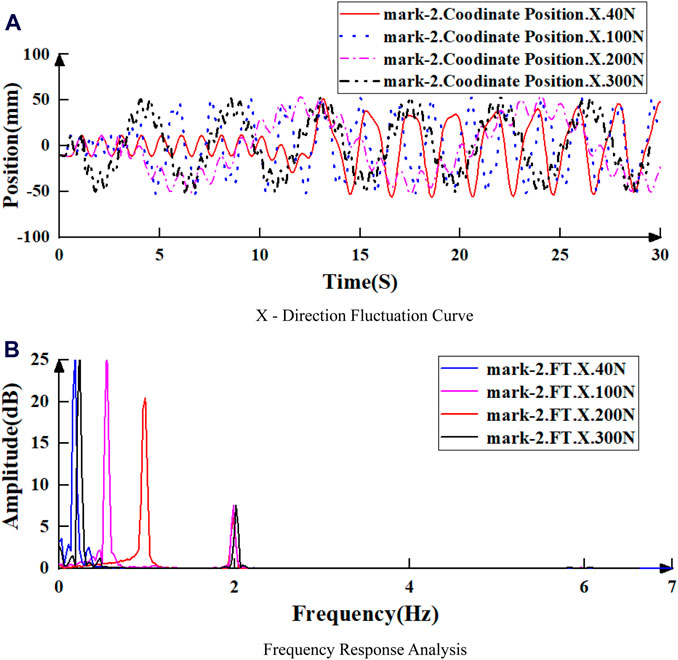
Figure 15. X-direction fluctuation and frequency response of Mark-2 under different WOB. (A) X-direction fluctuation curve. (B) Frequency response analysis.
The critical time at which the drillstring transitions from a rotation state to a whirling state, along with the whirl frequency of the drillstring are recorded, and these results are compared with the simulation results.
3.2.3.1 Influence of the WOB on buckling deformation of the drillstring
The critical time of drill string rotation to whirl under different WOB conditions is shown in Figure 16. Under specific drillstring rotational speeds, a higher WOB renders the drillstring more susceptible to buckling deformation. When the WOB is low, an increase in WOB significantly affects the critical time for buckling; however, as the WOB increases, the critical time tends to stabilize. Additionally, comparison with simulation results reveals a high degree of agreement between experimental and simulated data, particularly at lower WOB levels.
3.2.3.2 Influence of the WOB on whirl frequency of the drill string
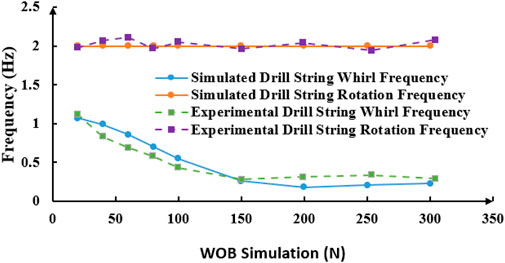
As shown in Figures 17, 18, when the WOB is less than 150N, the oscillation frequency of the drillstring decreases as the WOB increases. When the WOB exceeds 150N, the whirl frequency of the drillstring remains stable without significant change. There is no clear relationship between the rotation frequency and whirl frequency of the drillstring and changes in WOB.
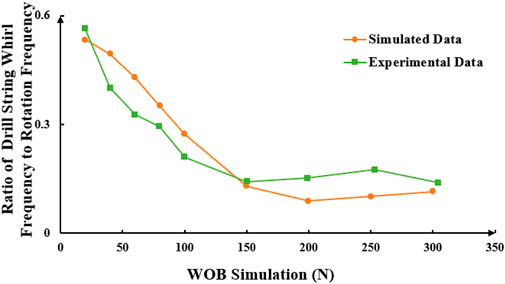
Figure 18. Relation curve of the ratio of drill string whirl and rotation frequency with the change of WOB.
Experimental testing of drillstring dynamics enables observation of the drillstring’s actual motion under varying speeds and WOB conditions. A comparison with simulation analysis results reveals strong consistency between experimental and simulated data. This consistency underscores the reliability of the simulations, providing a robust foundation for subsequent research and analysis.
4 The numerical analysis of bottom hole assembly (BHA)
The actual movement of the drillstring within the borehole is constrained by the borehole wall, rendering its motion more complex under the influence of the WOB and rotation speed. Despite the drillstring’s relatively high rigidity, it exhibits flexible rod characteristics only when the length-to-diameter ratio is significant and the loading force is substantial. Consequently, the feasibility of deriving motion laws through experimental analysis is limited. The introduction of numerical analysis methods is crucial for elucidating the actual motion laws of the drillstring in the borehole.
In this instance, a segment of the actual bottom hole assembly (BHA) is selected for analysis, focusing on its movement patterns under the prevailing drilling parameters, which are detailed in Table 4. This analysis is critical for understanding the actual movement dynamics of the drill string’s lower section.
4.1 Speed and displacement response curve analysis
The velocity and displacement response curves of the near bit marker 22.6 m away from the bit and the far bit marker 475 m away from the bit are analyzed and compared. The rotational speed is set at 50 revolutions per minute (r/min), and the weight on bit (WOB) is 160 kN, as depicted in Figure 19.
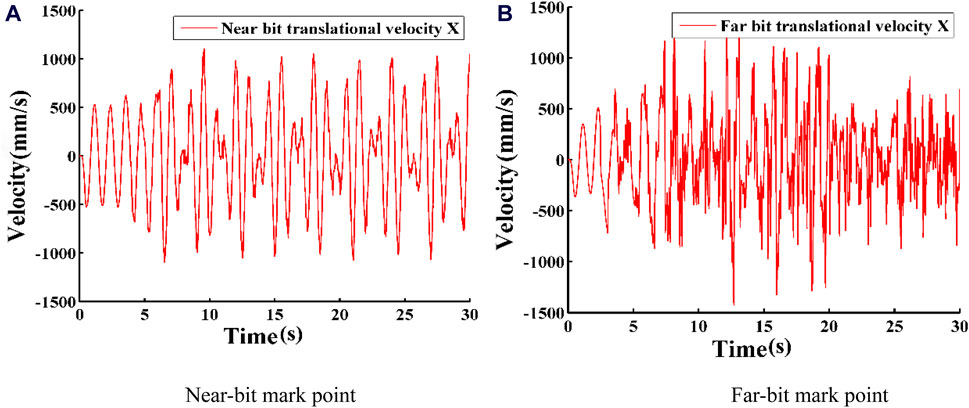
Figure 19. Transverse velocity curves at different positions. (A) Near-bit mark point. (B) Far-bit mark point.
The velocity response curves of two points are shown in Figure 20. When the drill pipe rotates on or near the fixed axis, the velocity of the Near-bit mark point in the horizontal plane ranges from approximately −0.5 m/s to 0.53 m/s. After the drill pipe starts whirling, this velocity changes to about −1.104 m/s to 1.097 m/s. For the Far-bit mark point, the velocity ranges from −0.363 m/s to 0.506 m/s when rotating on or near the fixed axis, and from −1.429 m/s to 1.258 m/s after the drill pipe begins to whirl. It can be observed that the rotational velocity is similar at different locations along the drillstring. When whirl occurs in the drilling tool, the velocity increment at the far-bit marker point is less than the velocity increment at the near-bit marker point. Additionally, the near-bit mark point shows an instantaneous reversal in velocity, indicating the presence of torsional motion in the drill pipe.
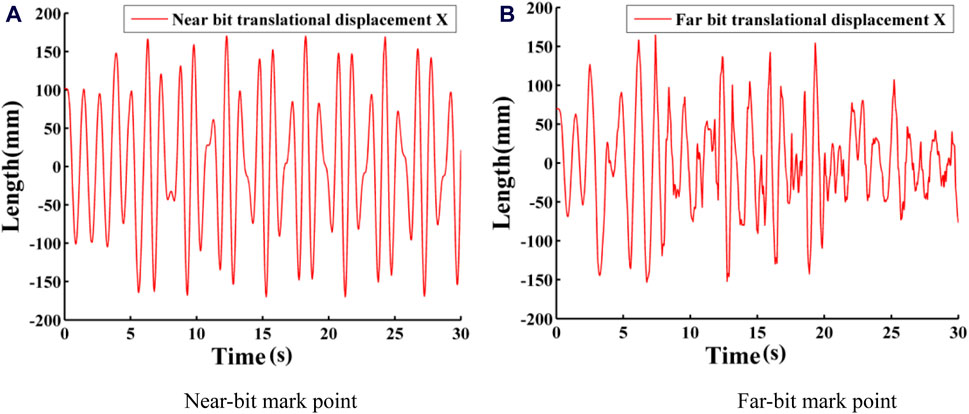
Figure 20. Lateral displacement response curves at different positions. (A) Near-bit mark point. (B) Far-bit mark point.
As shown in Figures 19, 20, the drill rod is initially in an unstable state when it begins to rotate. It achieves steady rotation at 1.44 s. At 3.51 s, the drill rod experiences periodic lateral vibrations. These vibrations become more pronounced, with greater amplitude, as the measurement points approach the bottom.
The analysis of the aforementioned data indicates that under the influence of comprehensive external forces, the drill pipe’s rotation transitions from a fixed or near-fixed axis to a positive whirling motion. It then shifts to irregular rotation and eventually to a spiral buckling instability state. This entire motion is accompanied by transverse, longitudinal, torsional, forward, and reverse whirl and vibration couplings in multiple directions.
4.2 Influence of the WOB verification
In order to investigate the effect of WOB on the vibration of drilling tools, the displacement response curves and cross-section displacements at the near drill marking point 22.6 m away from the drill bit are analysed in comparison with each other. The rotation speed is 50 r/min, and the WOB is set to 100, 150, and 200 kN, as illustrated in Figure 21.
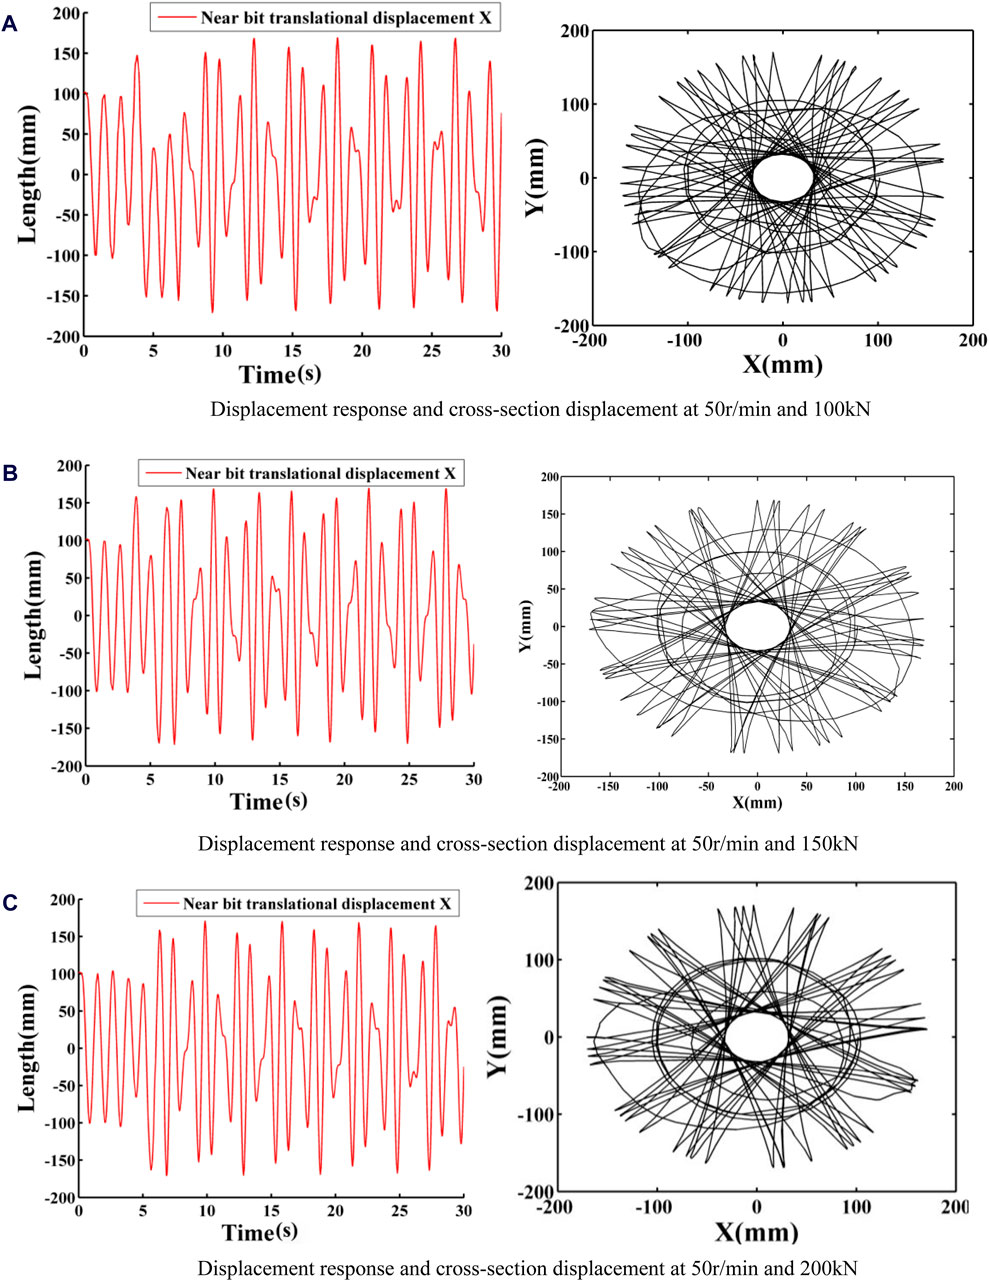
Figure 21. Lateral displacement and section trajectory of the Near-bit mark point under different WOB. (A) Displacement response and cross-section displacement at 50 r/min and 100 kN. (B) Displacement response and cross-section displacement at 50 r/min and 150 kN. (C) Displacement response and cross-section displacement at 50 r/min and 200 kN.
The lateral displacement response curves for the three conditions are shown in Figure 21. All curves fluctuate between −150 mm and 150 mm, with differences only in the form of fluctuation, while the overall movement trend remains consistent. Analysis of the cross-sectional trajectory indicates that, at a constant rotation speed, the WOB has minimal effect on the vibration of the drillstring.
4.3 Influence of the rotation speed verification
When the WOB is 180 kN, the vibration trajectories of the drill string section experiencing severe vibration at rotation speeds of 40, 60, 80, and 100 r/min are shown in Figure 22.
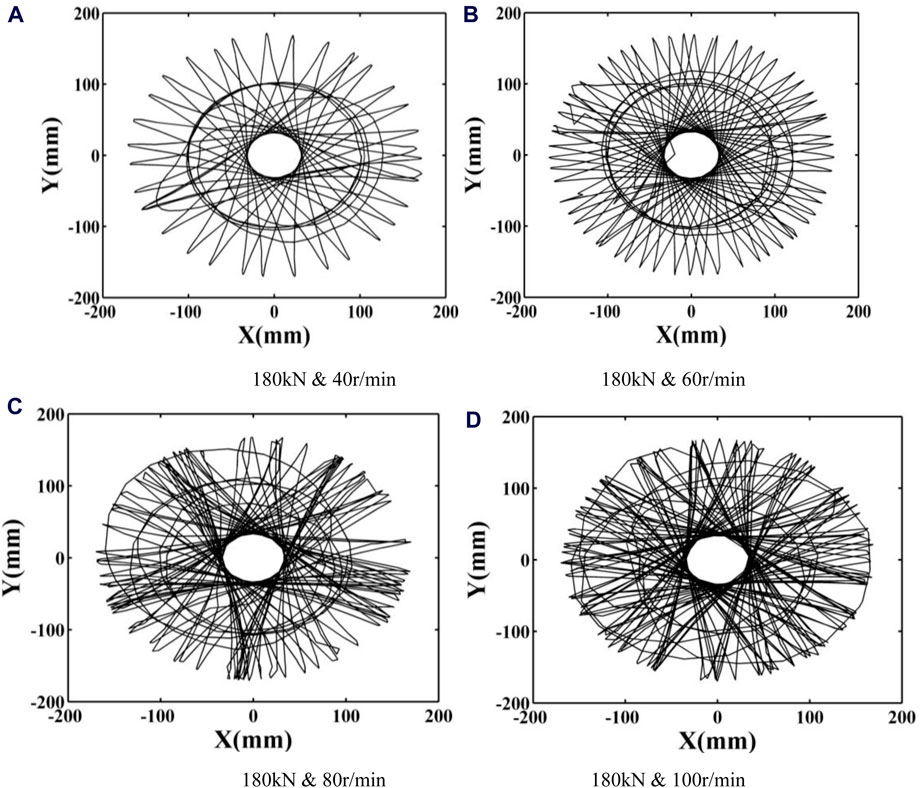
Figure 22. Section trajectory of the Near-bit mark point under different rotation speed. (A) 180 kN and 40 r/min (B) 180 kN and 60 r/min. (C) 180 kN and 80 r/min (D) 180 kN and 100 r/min.
Figure 22 shows that rotation speed significantly influences the vibration of the drilling tool. The whirl at 100 r/min is more severe than at other speeds, resulting in a more disordered and chaotic trajectory. Thus, with a consistent WOB, the vibration of the drilling tool becomes more complex as the rotation speed increases.
5 Conclusion and discussion
In the actual drilling process, the drill string exhibits nonlinear dynamic characteristics of flexible rods under complex loads. This paper establishes a mathematical model of a flexible drill string to describe its motion. However, due to the complexity of the mathematical model, finding analytical solutions is challenging. Therefore, a dynamic simulation method is employed to perform numerical analysis of the drill string motion. And flexible similarity is used to develop a drill string model suitable for both simulation and laboratory testing. Through dynamic simulation and testing, the following conclusions are drawn:
(1) When the drill string rotates within the casing, it exhibits various motion patterns including rotation around a fixed or nearly fixed axis, forward eccentric whirl without well wall contact, wall-to-wall rolling, reverse whirl, and combinations of these with irregular motion.
(2) When the weight on bit is fixed, increasing the rotational speed heightens the risk of buckling deformation. There is a direct, linear correlation between rotational speed and the propensity for buckling deformation. As the rotational speed increases, the oscillation frequency of the drill pipe also increases. Notably, when the rotational speed is between 4 and 5 rps (equivalent to 86.4 to 108 r/min on-site), a significant surge in the drill pipe’s oscillation frequency is observed. Below this speed threshold, the oscillation frequency maintains a consistent linear relationship with speed, at approximately half the rotational frequency. Beyond this range, the oscillation frequency tends to match the rotational frequency. It is crucial to consider that elevated oscillation frequencies can lead to increased cyclic alternating stress, which in turn heightens the likelihood of fatigue fractures in the drill pipe.
(3) At a constant speed, higher WOB increases the likelihood of buckling deformation. Under low WOB conditions, an increase in bit weight significantly affects the buckling deformation of the drill string. The results show that when the WOB is 20 N, the critical time for drilling tool vortex formation is 7.24 s. When the WOB is 300 N, the critical time is 0.89 s. A critical WOB threshold has been determined. When the bit weight is less than 150 N, the drill string rotation frequency decreases with increasing bit weight, and the variation amplitude gradually decreases. When WOB is greater than 150 N, the rotational frequency and amplitude of the drilling column remain stable and do not change significantly. When the WOB is 20 N, the vortex frequency of the drilling tool is 1.12 Hz. At 150 N, the vortex frequency is 0.28 Hz, and at 300 N, it is 0.29 Hz.
(4) When the rotating speed is constant, the influence of bit weight on drill pipe vibration is minimal. At a rotational speed of 50 r/min and a WOB of 100–200 kN, the vibration of the bottom drilling tool shows little variation with changes in drilling pressure. However, when the drilling pressure is constant, the vibration of the drilling tools becomes more complex as the rotational speed increases. At a rotational speed of 40–100 r/min and a WOB of 180 kN, the trajectory of the drilling tools becomes more chaotic with increasing rotational speed.
Data availability statement
The original contributions presented in the study are included in the article/supplementary material, further inquiries can be directed to the corresponding author.
Author contributions
JC: Data curation, Methodology, Software, Writing–original draft. DZ: Conceptualization, Project administration, Supervision, Writing–review and editing. QX: Investigation, Methodology, Writing–review and editing. JW: Investigation, Writing–review and editing. LH: Methodology, Writing–review and editing. FG: Data curation, Writing–review and editing. CW: Software, Validation, Writing–original draft. JQ: Formal Analysis, Validation, Writing–review and editing.
Funding
The author(s) declare that financial support was received for the research, authorship, and/or publication of this article. The author(s) disclosed receipt of the following financial support for the research, authorship and/or publication of this article: Natural Science Foundation of China (42072341, 51704264) and the Fundamental Research Funds for the Central Universities (2-9-2018-096).
Conflict of interest
The authors declare that the research was conducted in the absence of any commercial or financial relationships that could be construed as a potential conflict of interest.
Publisher’s note
All claims expressed in this article are solely those of the authors and do not necessarily represent those of their affiliated organizations, or those of the publisher, the editors and the reviewers. Any product that may be evaluated in this article, or claim that may be made by its manufacturer, is not guaranteed or endorsed by the publisher.
References
Arslan, M., Ozbayoglu, E. M., Miska, S., Yu, M., Takach, N., and Mitchell, R. F. (2014). Buckling of buoyancy-assisted tubulars. SPE Drill. Complet 29 (04), 372–385. doi:10.2118/159747-pa
Chen, J. S., and Fang, J. (2013). Deformation sequence of a constrained spatial buckled beam under edge thrust. Int. J. Non-Linear Mech. 55 (10), 98–101. doi:10.1016/j.ijnonlinmec.2013.05.001
Chen, J. S., and Li, H. C. (2011). On an elastic rod inside a slender tube under end twisting moment. J. Appl. Mech. 78 (4), 041009. doi:10.1115/1.4003708
Cunha, J. C. (2003). “Buckling of tubulars inside wellbores: a review on recent theoretical and experimental works[C],” in Proceedings of the SPE production and operations symposium (Oklahoma City, Oklahoma: Society of Petroleum Engineers). doi:10.2118/80944-MS
Dareing, D. W., and Livesay, B. J. (1968). Longitudinal and angular drill-string vibrations with damping. J. Eng. Industry 90 (4), 671–679. doi:10.1115/1.3604707
Dykstra, M. W., Neubert, M., Hanson, J. M., and Meiners, M. J. (2001). Improving drilling performance by applying advanced dynamics models. SPE 67697. doi:10.2118/67697-MS
Fang, J., Li, S. Y., and Chen, J. S. (2013). On a compressed spatial elastica constrained inside a tube. Acta Mech. 224 (11), 2635–2647. doi:10.1007/s00707-013-0889-z
Fang, P., Ding, S., Yang, K., Li, G., and Xiao, D. (2022). Dynamics characteristics of axial–torsional–lateral drill string system under wellbore constraints. Int. J. Non-Linear Mech. 146, 104176. doi:10.1016/j.ijnonlinmec.2022.104176
Gao, D. L., Gao, B. K., and Geng, R. P. (1996). Analysis of drillstring vortex characteristics. Oil Drill. Prod. Technol. 18 (6), 9–13. doi:10.13639/j.odpt.1996.06.002
Gao, D. L., and Huang, W. J. (2015). A review of down-hole tubular string buckling in well engineering. Petroleum Sci. 12 (3), 443–457. doi:10.1007/s12182-015-0031-z
Gao, G., and Miska, S. (2009). Effects of boundary conditions and friction on static buckling of pipe in a horizontal well. SPE J. 14 (04), 782–796. doi:10.2118/111511-pa
Gao, G., and Miska, S. (2010). Effects of friction on post-buckling behavior and axial load transfer in a horizontal well. SPE J. 15 (04), 1104–1118. doi:10.2118/120084-pa
Guan, Z. C., Jin, Y. X., and Wang, Y. F. (2003). Experimental research on motion behavior of bottom drillstring in straight hole. Acta Pet. Sin. 24 (6), 102–106. doi:10.3321/j.issn:0253-2697.2003.06.022
Huang, W., and Gao, D. (2014). Helical buckling of a thin rod with connectors constrained in a cylinder. Int. J. Mech. Sci. 84, 189–198. doi:10.1016/j.ijmecsci.2014.04.022
Jia, P., Zhou, B., Xue, S., Zhang, Y., Zhu, X., and Sun, F. (2022). A dynamic method for post buckling analysis of drill string in vertical wells. J. Pet. Sci. Eng. 214, 110334. doi:10.1016/j.petrol.2022.110334
Khulief, Y. A., and Al-Naser, H. (2005). Finite element dynamic analysis of drillstrings. Finite Elem. Analysis Des. 41 (13), 1270–1288. doi:10.1016/j.finel.2005.02.003
Li, T. C., and Li, X. Z. (2014). Resemblance and principles of similarity[M]. Harbin: Harbin Institute of Technology Press, 9.
Li, Z. F., Wang, C. J., Tian, W. C., and Xie, J. (2017). Three principles of drillstring mechanics and qualitative simulation experiments. Acta Pet. Sin. 38 (2), 227–233. doi:10.7623/syxb201702010
Li, Z. F., Zhang, Y. G., Hou, X. T., Liu, W. D., and Xu, G. Q. (2004). Analysis of longitudinal and torsion vibration of drillstring. Eng. Mech. 21 (6), 203–210. doi:10.3969/j.issn.1000-4750.2004.06.034
Liu, J. P., Zhong, X. Y., Cheng, Z. B., Feng, X. Q., and Ren, G. X. (2018). Buckling of a slender rod confined in a circular tube: theory, simulation, and experiment. Int. J. Mech. Sci., 140. doi:10.1016/j.ijmecsci.2018.03.008
Liu, Q. Y., Ma, D. K., and Zhong, Q. (2000). A drilling string torsional vibration model and its solution. Acta Pet. Sin. 21 (2), 78–82. doi:10.3321/j.issn:0253-2697.2000.02.015
Liu, Y. X. (2014). Research of drillstring dynamics with consideration of fluid-structure interaction[D]. Qindao, China: China University of Petroleum, 5.
Lubinski, A. (1950). A study of the buckling of rotary drilling string. Drill. Prod. Pract., 178–214.
Lubinski, A., and Woods, H. B. (1953). Factors affecting the angle of inclination and dog-legging in rotary bore holes. Drill. Prod. Pract., 222–242.
Lubinski, A., and Woods, H. B. (1955). Use of stabilizers in controlling hole deviation. Drill. Prod. Pract., 165–182.
Millheim, K. K., and Apostal, M. C. (1981a). The effect of bottom hole assembly dynamics on the trajectory of a bit. J. Petroleum Technolgy 33 (12), 2323–2338. doi:10.2118/9222-pa
Millheim, K. K., and Apostal, M. C. (1981b). How BHA dynamics affect on bit trajectory. World oil. 92 (6), 183–205.
Mitchell, R. F., and Allen, M. B. (1987)“Case studies of BHA vibration failure,” in Paper presented at the SPE Annual Technical Conference and Exhibition, Dallas, Texas. doi:10.2118/16675-MS
Omojuwa, E. O., Osisanya, S., and Ahmed, R. (2014). “Influence of dynamic drilling parameters on axial load and torque transfer in extended-reach horizontal wells[C],” in SPE annual technical conference and exhibition (Amsterdam, Netherlands: Society of Petroleum Engineers). doi:10.2118/170672-MS
Qian, B. Y., Ju, B. L., and Ri, Z. D. (2017). The research of post-buckling about slender rod string in wellbore based on energy method and experiment. J. Petroleum Sci. Eng. 156, 732–739. doi:10.1016/j.petrol.2017.06.046
Qin, X., Gao, D., and Chen, X. (2016). Effects of initial curvature on coiled tubing buckling behavior and axial load transfer in a horizontal well. J. Pet. Sci. Eng. 150, 191–202. doi:10.1016/j.petrol.2016.12.007
Ritto, T. (2010). Numerical analysis of the nonlinear dynamics of a drill-string with uncertainty modeling. Paris.Université Paris Est. 17 (5), 273–300.
Ritto, T. G., Escalante, M. R., Sampaio, R., and Rosales, M. (2013). Drill-string horizontal dynamics with uncertainty on the frictional force. J. Sound Vib. 332 (1), 145–153. doi:10.1016/j.jsv.2012.08.007
Ritto, T. G., and Soize, C. (2012). Stochastic drill-string dynamics with uncertainty on the imposed speed and on the bit-rock parameters. Int. J. Uncertain. Quantification 2 (2), 111–124. doi:10.1615/int.j.uncertaintyquantification.v2.i2.30
Ritto, T. G., Soize, C., and Sampaio, R. (2009). Non-linear dynamics of a drill-string with uncertain model of the bit rock interaction. Int. J. Non-linear Mech. 44 (8), 865–876. doi:10.1016/j.ijnonlinmec.2009.06.003
Ritto, T. G., Soize, C., and Sampaio, R. (2010a). Robust optimization of the rate of penetration of a drill-string using a stochastic nonlinear dynamical model. Comput. Mech. 45 (5), 415–427. doi:10.1007/s00466-009-0462-8
Ritto, T. G., Soize, C., and Sampaio, R. (2010b). Stochastic dynamics of a drill-string with uncertain weight-on -hook. J. Braz. Soc. Mech. Sci. Eng. 32 (3), 250–258. doi:10.1590/s1678-58782010000300008
Salies, J. B., Azar, J. J., and Sorem, J. R. (1994). “Experimental and mathematical modeling of helical buckling of tubulars in directional wellbores[C],” in Proceedings of the international petroleum conference and exhibition of Mexico (Veracruz, Mexico: Society of Petroleum Engineers). doi:10.2118/28713-MS
Wang, M. J. (2016). Drillstring dynamic characteristics analysis and dynamic safety evaluation for ultra-deep well[D]. Shanghai: Shang Hai University, 6.
Xie, D., Wu, Q., Xi, Y., and Huang, Z. (2023). Global modelling of nonlinear spatiotemporal dynamics of a drill-string with multiple regenerative effects. Appl. Math. Model. 114, 114–132. doi:10.1016/j.apm.2022.09.037
Xue, Q. L., Leung, H., Huang, L., Zhang, R., Liu, B., Wang, J., et al. (2019). Modeling of torsional oscillation of drillstring dynamics. Nonlinear Dyn. 96, 267–283. doi:10.1007/s11071-019-04789-x
Xue, Q. L., Leung, H., Wang, R., Liu, B., Huang, L., and Guo, S. (2015). The chaotic dynamics of drilling. nonlinear Dyn. 83 (4), 2003–2018. doi:10.1007/s11071-015-2461-y
Yang, C., Du, J., Cheng, Z., and Wu, Y. (2021). A highly efficient beam-in-beam large sliding contact method for flexible multibody dynamics. Comput. Mech. 67 (1), 1155–1175. doi:10.1007/s00466-021-01984-9
Zhang, Z., and Zhu, X. (2020). Failure analysis and improvement measures of step transition zone of drill pipe joint. Eng. Fail. Anal. 109, 104211. doi:10.1016/j.engfailanal.2019.104211
Zhao, D. P., Hovda, S., and Sangesland, S. (2016). Abnormal down hole pressure variation by axial stick-slip of drillstring. J. Petroleum Sci. Eng. 145, 194–204. doi:10.1016/j.petrol.2016.04.004
Keywords: drillstring, flexible multibody dynamics, collision, nonlinear, simulation, experimental
Citation: Cao J, Zou D, Xue Q, Wang J, Huang L, Guo F, Wang C and Qu J (2024) Analysis on the dynamics of flexible drillstring under different drilling parameters. Front. Earth Sci. 12:1396784. doi: 10.3389/feart.2024.1396784
Received: 06 March 2024; Accepted: 23 July 2024;
Published: 22 August 2024.
Edited by:
Hongye Feng, Chinese Academy of Geological Sciences, ChinaReviewed by:
Xin Du, University of Science and Technology of China, ChinaHongye Feng, Chinese Academy of Geological Sciences, China
Copyright © 2024 Cao, Zou, Xue, Wang, Huang, Guo, Wang and Qu. This is an open-access article distributed under the terms of the Creative Commons Attribution License (CC BY). The use, distribution or reproduction in other forums is permitted, provided the original author(s) and the copyright owner(s) are credited and that the original publication in this journal is cited, in accordance with accepted academic practice. No use, distribution or reproduction is permitted which does not comply with these terms.
*Correspondence: Deyong Zou, MzcxMjE0NzY2QHFxLmNvbQ==; Qilong Xue, eHFsQGN1Z2IuZWR1LmNu
 Jifei Cao
 Deyong Zou1*
 Qilong Xue