- 1Key Laboratory of Mountain Hazards and Surface Process, Institute of Mountain Hazards and Environment, Chinese Academy of Sciences, Chengdu, Sichuan, China
- 2College of Civil Engineering, Sichuan Agricultural University, Dujiangyan, China
- 3PowerChina Kunming Engineering Co., Ltd., Kunming, China
- 4College of Civil Engineering, Southwest Jiaotong University, Chengdu, Sichuan, China
Introduction: Dams formed by landslides may produce disastrous floods after dam outbursts. However, understanding of the influence of the inflow rate on the breaching characteristics of landslide dams is still at an early stage; in particular, the relationship between breaching width and depth are still unclear.
Methods: In this paper, we present the results of a series of laboratory tests that assessed seven inflow rates (1, 1.5, 2, 2.5, 3, 3.5, and 4 L/s).
Results and discussion: The results show that breaching characteristics for different inflow rates are similar and that there are three breach stages for different inflow rates. The peak discharge gradually increases as the inflow rate increases. With increasing inflow rate, the breach depth and width both increase. The ratio of breach width to breach depth increases from less than 1 to 1 progressively with increasing inflow rate. The breaching width and depth can be expressed by the function
1 Introduction
Excessive rainfall, earthquakes, and reservoir water level fluctuations often cause landslides (Azadi et al., 2022; Qiu et al., 2024; Zhu et al., 2024; Ye et al., 2024), which can fall into river channels, choke rivers, and form landslide dams (Takahashi, 2007). More than 50% of landslide dams are broken by overtopping, and 85% fail within 1 year of formation (Costa and Schuster, 1988). Hazardous flooding may occur after the failure of these dams. For example, the Tangjiashan landslide dam (volume of 2 × 10⁷ m³) was the largest of 260 landslide dams triggered by the Wenchuan earthquake. Twenty-seven days after its formation, the dam breached, with a peak discharge of 6,500 m³/s, resulting in a flash flood downstream (Liu et al., 2010). At least 2,423 people died in the 1933 flood caused by the failure of the large Diexi landslide dam on a river in Central China (Costa and Schuster, 1988). Understanding the breaching characteristics of landslide dams can help prevent flood outbursts.
Previous studies have focused on the process of breach development, the mechanism of failure, the development of dam breach (Hanisch, 2002; Zech et al., 2008; Pickert et al., 2011; Rozov, 2003; Cao et al., 2011a; Cao et al., 2011b; Dou et al., 2014), the calculation of the peak flow of a flood, and the simulation and prediction of flood routing (Singh and Quiroga, 1987; Fread, 1988; Walder and O’Connor, 1997; Macchione, 2008; Belikov et al., 2010; Ma and Fu, 2012; Fan et al., 2012). These studies have focused mostly on the dam failure process, including the evolution characteristics of breach discharge, the influence of the gradation of materials or initial moisture of materials on the landslide dam’s breaching, and the changing characteristics of the breach. For example, the European Union launched the IMPACT project (Morris and Hassan, 2005) and the FLOOD site project (Morris et al., 2009), which combine large-scale (dam height of 4–6 m) field tests and small-scale flume tests for a detailed study of the impact of dam type, dam shape, and material composition (i.e., grain size gradation, density, moisture content, and cohesion) on the process of dam failure. Coleman et al. (2002) conducted a series of non-cohesive sand embankment overtopping tests to obtain a formula describing the geometry and dimensions of a breach. Javadi and Mahdi (2014) analyzed the failure mechanism of an impermeable rockfill dam and determined the critical water level at which the dam would overtop and the associations between the critical water level, dam height, upstream slope angle, downstream slope angle, and gravel size. Asghari Tabrizi et al. (2016) tested uniform sand with different degrees of compaction and established a dimensionless equation for the variation in breach size over time. Bento et al. (2017) conducted dam failure tests on a cohesive soil dam, observed the failure process with particle image velocimetry, and obtained a prediction formula for the hydrograph curve. Jiang and Wei (2019) studied the impact of the initial moisture content on the process of dam failure, focusing on the relationships between the initial moisture content and the failure discharge and erosion rate.
Although the characteristics of a breach and the magnitude of the resulting flood are well known to be controlled by many factors, these studies have focused on dam size and geometry, sediment characteristics, and initial water moisture. Inflow rate is an important factor in the failure process. Rifai et al. (2017) conducted experiments to investigate the impact of the inflow rate on the process of dam failure and reported that as the inflow rate increased, the time for a breach to develop significantly decreased. However, the quantitative relationships between the inflow rate and hydraulic parameters of a breach, such as the relationship between the inflow rate and breach discharge and the relationship between the inflow rate and breach size, are still unclear. This approach is unfavorable for fully understanding the mechanism of dam failure and predicting the hydraulic parameters of dam failure.
The characteristics of breach development can be characterized as the relationship between breaching width and depth, as shown by previous research, and can be characterized with a function. For example, Coleman et al. (2002) revealed that the relationship between breach width and depth can be described by a parabolic equation through experimental observations. Jiang et al. (2018), Jiang and Wei (2019), and Jiang et al. (2021) measured the breach width and depth during the failure process of a landslide dam model in the laboratory and reported that an exponential function existed between these two parameters. They also analyzed the influence of the mean diameter of materials on the coefficient of the breach width–depth function. Unfortunately, some questions remain unclear, such as whether there is a similar function type between breach depth and width for different inflow rates. What is the relationship between the coefficient of the breach width–depth function and the inflow rate?
In this work, we aim to improve the understanding of the influence of inflow rate conditions on the breach characteristics of landslide dams when triggered by overtopping. Thus, the relationships between breach parameters, such as peak discharge and breach sizes, and the inflow rate can be clearly described. With a series of flume tests, we analyzed the influences of the inflow rate on the breach discharge hydrographs, peak discharge, breach depth, and breach width. We discussed the relationship between breach width and breach depth. Finally, we investigated the relationship between the parameters of the breaching width‒depth functions and the inflow rate.
2 Experimental setup and procedure
2.1 Experimental materials
This experiment uses sediment prepared in a manual configuration. We collected gravel, coarse sand, fine sand, and clay materials and divided them into nine groups based on particle size: 2–3 cm, 1–2 cm, 0.5–1 cm, 0.2–0.5 cm, 0.1–0.2 cm, 0.05–0.1 cm, 0.025–0.05 cm, 0.0075–0.025 cm, and <0.0075 cm. We mixed the particles of different groups and stirred them well. Particles of different sizes differed in color; for example, the gravel was black, coarse sand was white, and clay was dark yellow; thus, observing the movement of different soil particles during experiments was convenient (Figure 1A).
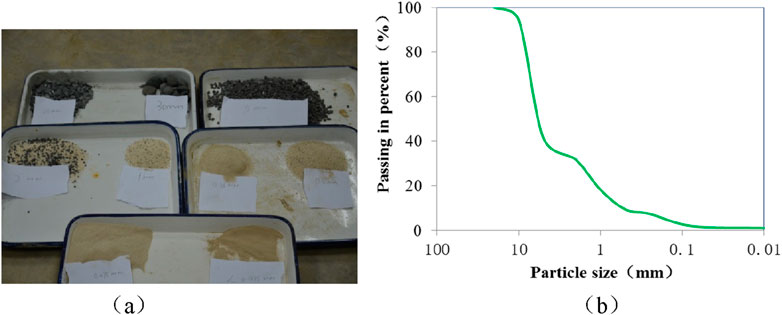
Figure 1. Experimental materials: (A) photograph of particles of different sizes and (B) particle size distributions of the soil.
The largest particle diameter in the experimental materials was 2 cm, the median diameter D50 was 4.8 mm, and the non-uniform coefficient 12.0. To measure the proportion of those particles with diameters less than 5 mm, we adopted the pycnometer method; otherwise, the suspending weight method was adopted. The moisture content and dry density were 7.82% and 1.72 g/cm³, respectively. The gradation curves are shown in Figure 1B.
2.2 Experimental setup
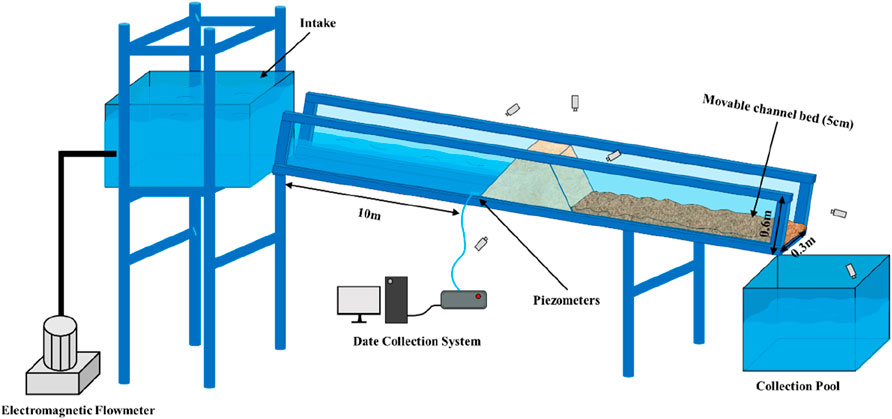
The experiments were carried out in a flume that was 15 m long, 0.3 m wide, and 0.6 m deep, with an adjustable slope angle of 0–30°, set to 1°. The flume was made of tempered glass with scales on both sides to facilitate the recording of the height of the breach bottom at different times during the experiment. The inflow rate was controlled by an electromagnetic flowmeter, and the measurement error was within ± 0.01 L/s. Different dam shapes led to differences in length along the channel. We set the upstream slope toe of the dam at 10 m from the tank. The inflow rates were set as 1 L/s (T-1), 1.5 L/s (T-2), 2 L/s (T-3), 2.5 L/s (T-4), 3 L/s (T-5), 3.5 L/s (T-6), and 4 L/s (T-7).
Cameras were deployed in front of the flume and on the dam crest to record changes in breaches during the dam failure process. A ruler was set at the dam crest. With the recorded video and the ruler, the breach width was obtained. We also set cameras at the top and both sides of the dam to record the bottom of the breach and measure the breach depth. A piezometer buried in front of the dam was used to collect water pressure data automatically. With the water pressure data, the water depth before the dam can be calculated based on hydrostatic pressure characteristics. Then, the outflow discharge was calculated using the water level difference between adjacent moments based on the water volume balance of the lake. The experimental setup were shown as Figure 2.
2.3 Experimental parameter settings
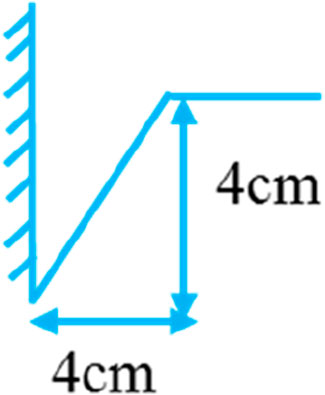
The slope angles upstream and downstream were set at 30° and 20°, respectively; the width of the dam crest was W=30 cm; and the initial dam height was Hb=30 cm. We preset an initial triangular breach at one side of the dam. Both depth and width were 4 cm (Figure 3).
3 Experimental results
3.1 General features
The results show that the breaching characteristics of the dams in the tests were similar. The overtopping process in all the experiments had three identical phases. Taking T1 as an example for analyzing the breaching process of a landslide dam (Figure 4), the main characteristics of the three phases are explained as follows.

Figure 4. Images of dam and flow at different times for T-1, showing that overtopping erosion is the dominant factor for dam failure.
3.1.1 Phase I: slow development stage (0–140 s)
After the flow overtopped the initial breach, it began eroding the bottom and slope of the breach. We observed that the water moved down, carrying a small amount of sediment at the same time. Only small sediment particles were carried away because of the shallow water depth, slow velocity, and weak carrying capacity of the outflow water. Therefore, the sediment at the breach of the dam crest was dominated by the movement of the suspended load. When the flow was transported downstream, the flow velocity increased, and its erosion ability was enhanced, resulting in the formation of a narrow gully at the downstream slope. In addition, a small amount of sediment with a relatively large diameter was carried away and accumulates at the downstream slope, forming an obvious slope turning point. The breach slope collapsed intermittently on a small scale, and the breach shape at this stage was that of a rectangle, according to observations of Rozov (2003).
3.1.2 Phase II: rapid expansion stage (140–280 s)
As more sediment accumulated, the turning point developed upstream. When a certain amount of sediment had accumulated, it slid downward suddenly; then, the downstream slope became steep and the rate of outflow increased suddenly. Then, significant backward erosion occurred. With backward erosion at the upstream slope, the height of the upstream breach suddenly declined and the difference in height between the water surface and breach crest increased, leading to a sudden increase in outflow discharge. At this stage, more breach slopes lost their stability, and the scale of the unstable slope was larger than in Phase I. The average angle of the breach slope was less than 90°, and the shape of the breach was similar to that of a trapezoid. Among all the stages, the deepening and widening of the breach at this stage was the most rapid.
3.1.3 Phase III: rebalancing of the movement of water and sand (280–320 s)
After a rapid decrease in the water level in front of the dam, the outflow discharge gradually decreased and its carrying capacity gradually weakened. It then formed a coarse layer protecting the lower particles from being washed away. The motion of water and sand reached a new balance, indicating the end of the failure process. The frequency of breach slope slide occurrence was low, and the shape of the breach was that of a trapezoid.
3.2 Influence of inflow rate on discharge
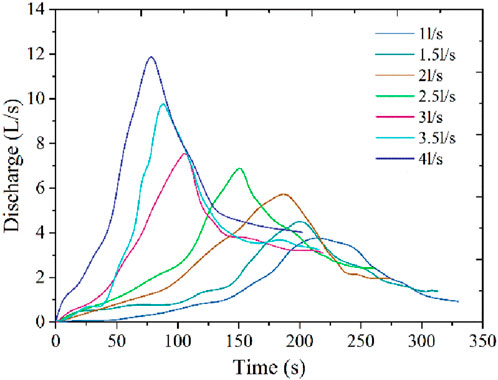
The breach discharge hydrographs with different inflow rates are shown in Figure 5. This shows that when the flow was slow, the curve looks fat. As the flow increased, the rate of decline and growth rate increased, and the curve became thin. At the same time, the breaching time was shortened, and it reached the peak discharge earlier after the inflow rate increased. Under different inflow rate conditions, every 0.5 L/s, large differences in the breaching time and peak discharge arriving time were observed. The difference between 2.5 and 3 L/s reached a maximum, differing by 40 s in breach time and 45 s in peak discharge arrival time.
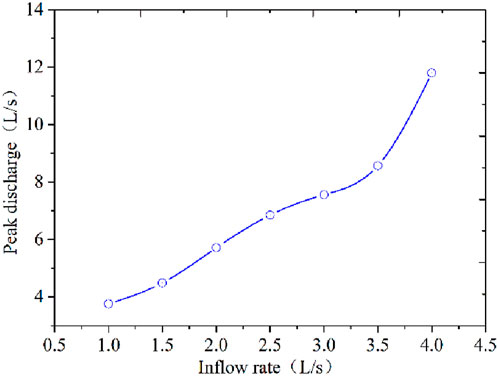
As shown in Figure 6, the peak discharge increased with increasing inflow discharge but does not follow a linear relationship. For example, when the inflow discharge increased from 1 to 2 L/s, the peak discharge increased by approximately 2 L/s; however, when the inflow discharge increased from 3 to 4 L/s, the peak discharge increased by approximately 5 L/s. For the seven inflow rates, the corresponding maximum peak discharge was nearly three times the minimum discharge.
3.3 Influence of inflow rate on breach depth and width
Figure 7 shows the longitudinal profiles of the dam with inflow rates of 1, 2, 3, and 4 L/s. Under different inflow rates, the failure process remained characterized by slowly overtopped flow, backward erosion, and rebalancing of sediment and water. However, the difference is that the breach time for each phase was shortened in accordance with the increase in the inflow rate. This means that the incision rate increased with increasing inflow rate. The breach depths increased most rapidly during the backward erosion process under these four conditions. When the inflow rate was low (e.g., 1 and 2 L/s), the bottom of the breach was tortuous, exhibiting a distinct slope break point. However, many breakpoints may occur at the bottom of the breach at the same time. When the inflow rate increased to 3 or 4 L/s, the sinuosity at the bottom of the breach decreased and the slope break point remains, but its number decreased at the same point.
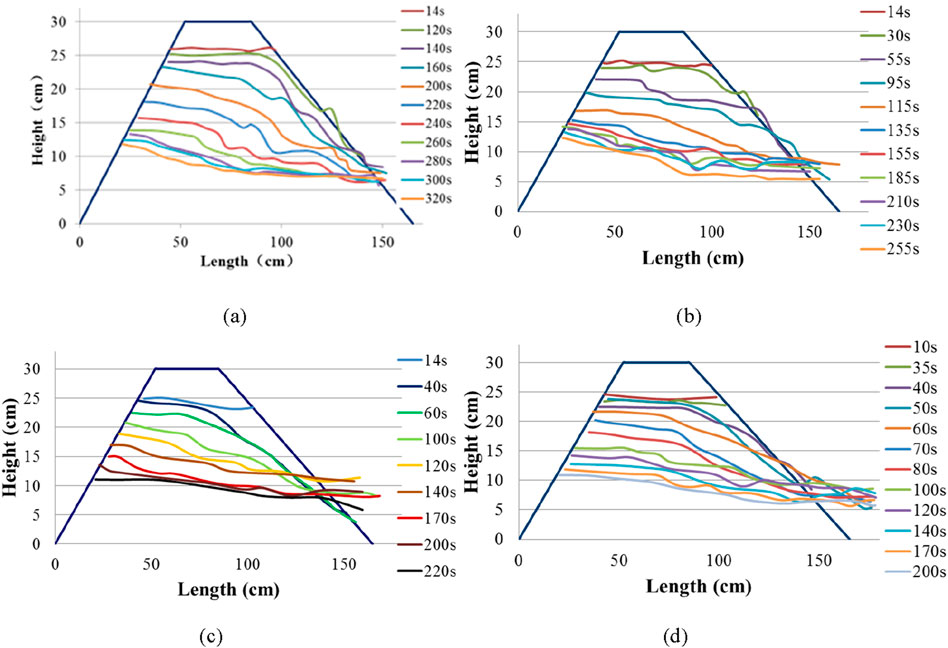
Figure 7. Temporal breach development for inflow rates at different times: (A) inflow rate of 1 L/s, (B) inflow rate of 2 L/s, (C) inflow rate of 3 L/s, and (D) inflow rate of 4 L/s.
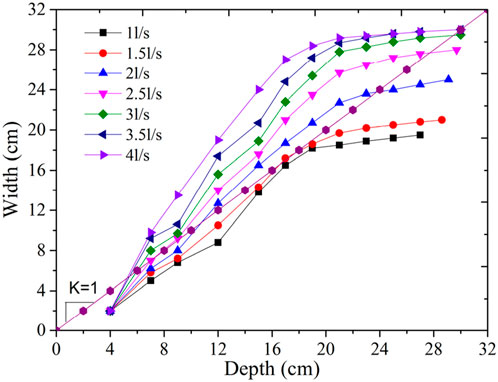
Figure 8 shows the relationships between breach width and depth under different inflow rate conditions. The whole curve can be divided into two parts. First, when the breach depth was less than a certain value (e.g., the breach depth is less than 22 cm for an inflow rate of 2 L/s), the curve was steeper, and the ratio of the width to depth increased with increasing inflow rate. Second, when the breach depth exceeded that value, the breach width tended to reach a certain value, although the depth increases. When the inflow rate was less (such as 1 and 2 L/s in this experiment), the curve was located below the straight line with a slope of K = 1, indicating that the breach widening rate is less than the breach incision rate throughout the whole failure process. Once the breach depth increased, it increased faster than the width. When the inflow rate increases (e.g., 2, 2.5, 3, 3.5, and 4 L/s), the curve was essentially above a straight line with a slope of K = 1. In this case, we deduced that the rate of breach widening was greater than that of breach incision widening. This suggests that breach widening increased with increasing inflow rate, as shown in Figures 7, 8. Simultaneously, with increasing inflow rate, the curve gradually approached a straight line after dam failure. The breach width and depth gradually increased at the same level as the inflow rate.
3.4 The relationship between breach depth and width
Based on the breach width and depth curves (Figure 9), the breach width and depth all fit the following equation:
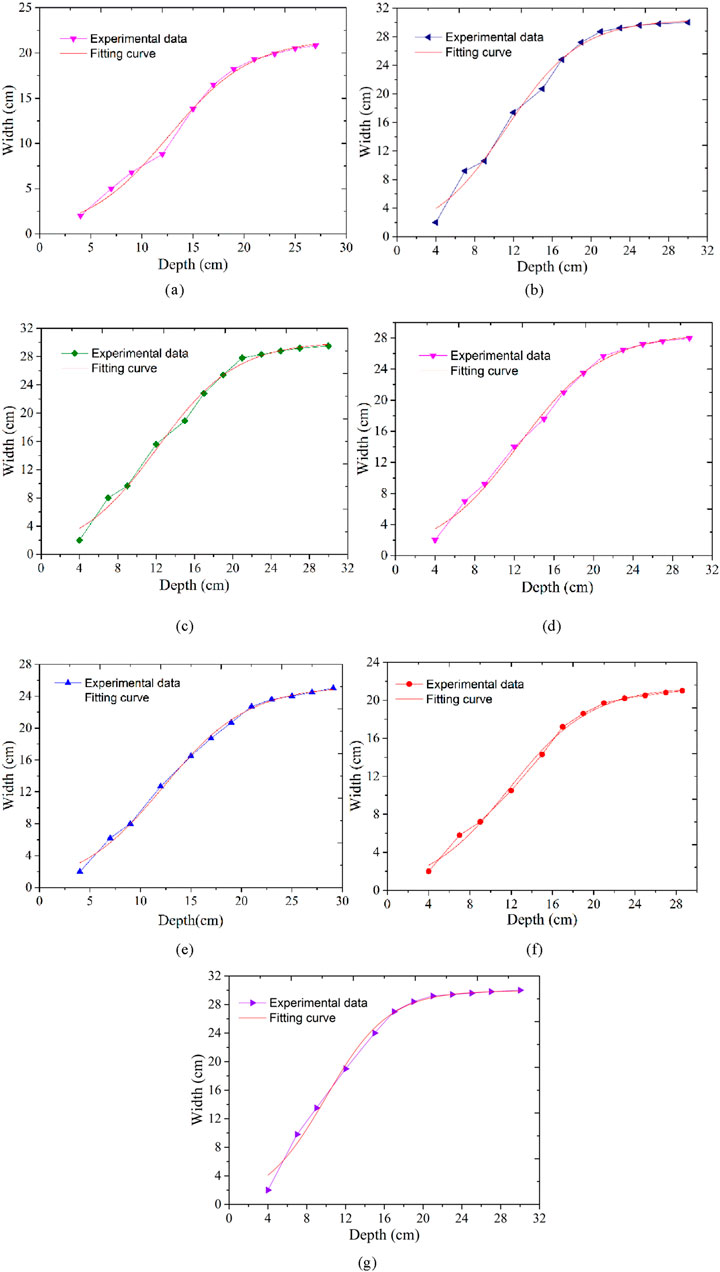
Figure 9. Comparison of the experimental data with fitting curves: (A) Test T-1,
W is the breach width (cm), D is the breach depth (cm), and ζ (cm), k, and D0 (cm) are parameters. ζ is the possible maximum breaching width. k is the shape parameter, which represents the steepness or deceleration of the curve, reflecting the width expansion rate of the breach. If the absolute value of k is larger, the breaching width expands faster; in contrast, the width expands more slowly. D0 is the corresponding depth of the breach when it reaches half of the maximum breaching width.
The influence of the inflow rate on parameters ζ, k, and D0 is shown in Figure 10. The value of ζ increases with qin, and D0 decreases with qin. The parameter k in Equation 1 controls the shape of the equation, which decreases with qin. The relationships between k and qin can be described by Equation 2.
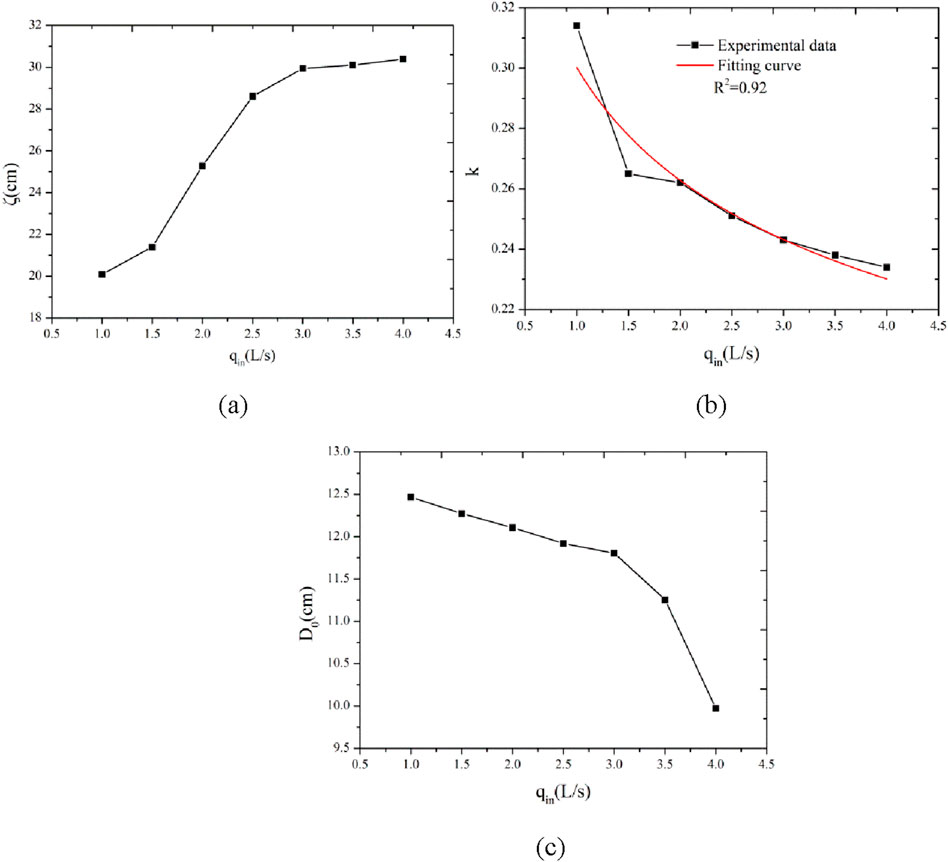
Figure 10. Variation in the parameters in Equation 1 with inflow rates (A–C).
4 Discussion
The dam models all started with initial breaches at one side of the dam. When the water overtopped, the breach on the dam side was eroded, and the other side of the breach close to the glass of the flume was not erodible. Thus, the location of the initial breach in the tests corresponded to a one-sided breach in the field. From another perspective, the dam set up in the tests could be considered half of the complete dam, symmetrical to the initial breach.
The landslide dam models established in the laboratory are much smaller than landslide dams in the field. However, the failure characteristics of landslide dams with different inflow rates are still valuable for real-world applications. Equations 1, 2 need more data for validation because landslide dams in the field have more complex dam structures than models in the laboratory.
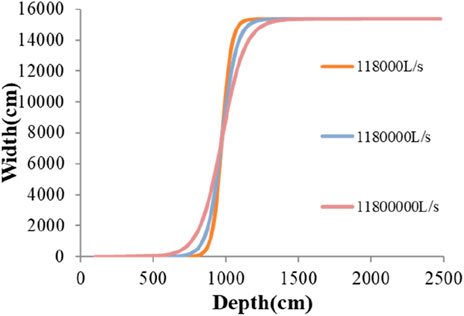
The parameter k in Equation 1 reflects the shape of the curve. Based on the measured data from the Tangjiashan landslide dam (Chen et al., 2014), we analyzed the influence of the inflow rate on parameter k. In the analysis process, we kept ζ and D0 constant and used the regression Equation 2 to calculate k under different conditions. Figure 11 shows three orders of magnitude of inflow rates vs. breach width and depth. This indicates that the shapes of the curves are different; however, the difference in k is small for significantly different inflow rates. This means that the coefficient k could be taken as a constant value for different inflow rates as other conditions are the same when predicting the landslide dam breach size.
5 Conclusion
In this work, we studied in detail how the inflow rate affects the breaching characteristics of landslide dams. This research focused on the breaching process, breach hydrographs, and relationship between breach width and depth under different inflow rates.
The failure process for landslide dams is similar for different inflow rates. The process can be divided into three stages. Backward erosion plays a dominant role in the entire failure process.
Peak discharge increases with increasing inflow rate, while the breaching time decreases with increasing inflow rate. Breach width and depth both increase with increasing inflow rate. The breaching width-to-depth ratio also increases with increasing inflow rate. In addition, the ratio tends to be 1 after dam failure because of the increased inflow rate.
The breach width and depth follow the formula
Data availability statement
The raw data supporting the conclusions of this article will be made available by the authors, without undue reservation.
Author contributions
XJ: conceptualization, investigation, methodology, software, visualization, writing–original draft, and writing–review and editing. ZZ: formal analysis, validation, visualization, and writing–original draft. HD: investigation and writing–original draft.
Funding
The author(s) declare that financial support was received for the research, authorship, and/or publication of this article. This work was supported by the Second Tibetan Plateau Scientific Expedition and Research Program (Grant No. 2019QZKK0906), National Natural Science Foundation of China (Grant No. 42177149), and PowerChina Technology Project (DJ-ZDXM-2019-45).
Conflict of interest
Authors XJ and ZZ were employed by PowerChina Kunming Engineering Co., Ltd.
The remaining author declares that the research was conducted in the absence of any commercial or financial relationships that could be construed as a potential conflict of interest.
Publisher’s note
All claims expressed in this article are solely those of the authors and do not necessarily represent those of their affiliated organizations, or those of the publisher, the editors, and the reviewers. Any product that may be evaluated in this article, or claim that may be made by its manufacturer, is not guaranteed or endorsed by the publisher.
References
Asghari Tabrizi, A., Elalfy, E., Elkholy, M., Chaudhry, M. H., and Imran, J. (2016). Effects of compaction on embankment breach due to overtopping. J. Hydraulic Res. 55 (2), 236–247. doi:10.1080/00221686.2016.1238014
Azadi, A., Esmatkhah Irani, A., Azarafza, M., Hajialilue Bonab, M., Sarand, F. B., and Derakhshani, R. (2022). Coupled numerical and analytical stability analysis charts for an earth-fill dam under rapid drawdown conditions. Appl. Sci. 12 (9), 4550. doi:10.3390/app12094550
Belikov, V. V., Vasil’eva, E. S., and Prudovskii, A. M. (2010). Numerical modeling of a breach wave through the dam at the Krasnodar reservoir. Power Technol. Eng. Former. Hydrotech. Constr. 44 (4), 269–278. doi:10.1007/s10749-010-0176-2
Bento, A. M., Amaral, S., Viseu, T., Cardoso, R., and Ferreira, R. M. L. (2017). Direct estimate of the breach hydrograph of an overtopped earth dam. J. Hydraulic Eng. 143 (6), 06017004. doi:10.1061/(asce)hy.1943-7900.0001294
Cao, Z., Yue, Z., and Pender, G. (2011a). Landslide dam failure and flood hydraulics. Part I: experimental investigation. Nat. hazards 59 (2), 1003–1019. doi:10.1007/s11069-011-9814-8
Cao, Z., Yue, Z., and Pender, G. (2011b). Landslide dam failure and flood hydraulics. Part II: coupled mathematical modelling. Nat. hazards 59 (2), 1021–1045. doi:10.1007/s11069-011-9815-7
Chen, Z., Ma, L., Yu, S., Chen, S., Zhou, X., Sun, P., et al. (2014). Back analysis of the draining process of the Tangjiashan barrier lake. J. Hydraulic Eng. 141 (4), 05014011. doi:10.1061/(asce)hy.1943-7900.0000965
Coleman, S. E., Andrews, D. P., and Webby, M. G. (2002). Overtopping breaching of noncohesive homogeneous embankments. J. Hydraulic Eng. 128 (9), 829–838. doi:10.1061/(asce)0733-9429(2002)128:9(829)
Costa, J. E., and Schuster, R. L. (1988). The formation and failure of natural dams. Geol. Soc. Am. Bull. 100 (7), 1054–1068. doi:10.1130/0016-7606(1988)100<1054:tfafon>2.3.co;2
Dou, S. T., Wang, D. W., Yu, M. H., and Liang, Y. J. (2014). Numerical modeling of the lateral widening of levee breach by overtopping in a flume with 180° bend. Nat. Hazards Earth Syst. Sci. 14 (1), 11–20. doi:10.5194/nhess-14-11-2014
Fan, X., Tang, C. X., Van Westen, C. J., and Alkema, D. (2012). Simulating dam-breach flood scenarios of the Tangjiashan landslide dam induced by the Wenchuan Earthquake. Nat. hazards earth Syst. Sci. 12 (10), 3031–3044. doi:10.5194/nhess-12-3031-2012
Fread, D. L. (1988). BREACH, an erosion model for earthen dam failures. Hydrologic Research Laboratory. Silver Spring, Maryland: National Weather Service, NOAA.
Hanisch, J. (2002). “Usoi landslide dam in Tajikistan - the world's highest dam: first stability assessment of the rock slopes at Lake Sarez,” in Proceedings Landslides, Proc., 1st European Conf. on Landslides, Prague, 24–26 June, 2002, 189–197.
Javadi, N., and Mahdi, T. F. (2014). Experimental investigation into rockfill dam failure initiation by overtopping. Nat. hazards 74, 623–637. doi:10.1007/s11069-014-1201-9
Jiang, X., Huang, J., Wei, Y., Zhipan, N., Fenghui, C., Zuyin, Z., et al. (2018). The influence of materials on the breaching process of natural dams. Landslides 15 (2), 243–255. doi:10.1007/s10346-017-0877-9
Jiang, X., and Wei, Y. (2019). Natural dam breaching due to overtopping: effects of initial soil moisture. Bull. Eng. Geol. Environ. 78, 4821–4831. doi:10.1007/s10064-018-01441-7
Jiang, X., Xu, W., Chen, X., Chen, H., and Zhang, C. (2021). Experiments on the characteristics of breach variations due to natural dam overtopping. Environ. Earth Sci. 80 (10), 373–415. doi:10.1007/s12665-021-09652-0
Liu, N., Chen, Z., Zhang, J., Lin, W., Chen, W., and Xu, W. (2010). Draining the Tangjiashan barrier lake. J. Hydraulic Eng. 136 (11), 914–923. doi:10.1061/(asce)hy.1943-7900.0000241
Ma, H., and Fu, X. (2012). Real time prediction approach for floods caused by failure of natural dams due to overtopping. Adv. Water Resour. 35, 10–19. doi:10.1016/j.advwatres.2011.08.013
Macchione, F. (2008). Model for predicting floods due to earthen dam breaching. I: formulation and evaluation. J. Hydraulic Eng. 134 (12), 1688–1696. doi:10.1061/(asce)0733-9429(2008)134:12(1688)
Morris, M. W., and Hassan, A. M. (2005). IMPACT: breach formation technical report (WP2). Munich: HR Wallingford Ltd.
Morris, M. W., Hassan, M., Kortenhaus, A., Geisenhainer, P., Visser, P. J., and Zhu, Y. (2009). Modelling breach initiation and growth. HR Wallingford 1 (5), 175–185. doi:10.1201/9780203883020.ch67
Pickert, G., Weitbrecht, V., and Bieberstein, A. (2011). Breaching of overtopped river embankments controlled by apparent cohesion. J. Hydraulic Res. 49 (2), 143–156. doi:10.1080/00221686.2011.552468
Qiu, H., Su, L., Tang, B., Yang, D., Ullah, M., Zhu, Y., et al. (2024). The effect of location and geometric properties of landslides caused by rainstorms and earthquakes. Earth Surf. Process. Landforms 49 (7), 2067–2079. doi:10.1002/esp.5816
Rifai, I., Erpicum, S., Archambeau, P., Violeau, D., Pirotton, M., El Kadi Abderrezzak, K., et al. (2017). Overtopping induced failure of noncohesive, homogeneous fluvial dikes. Water Resour. Res. 53 (4), 3373–3386. doi:10.1002/2016wr020053
Rozov, A. L. (2003). Modeling of washout of dams. J. Hydraulic Res. 41 (6), 565–577. doi:10.1080/00221680309506889
Singh, V. P., and Quiroga, C. A. (1987). A dam-breach erosion model: I. Formulation. Water Resour. Manag. 1 (3), 177–197. doi:10.1007/bf00429942
Takahashi, T. (2007). Debris flow: mechanics, prediction and countermeasures. London, UK: Taylor and Francis Group press.
Walder, J. S., and O'Connor, J. E. (1997). Methods for predicting peak discharge of floods caused by failure of natural and constructed earthen dams. Water Resour. Res. 33 (10), 2337–2348. doi:10.1029/97wr01616
Ye, B., Qiu, H., Tang, B., Liu, Y., Liu, Z., Jiang, X., et al. (2024). Creep deformation monitoring of landslides in a reservoir area. J. Hydrology 632, 130905. doi:10.1016/j.jhydrol.2024.130905
Zech, Y., Soares-Frazão, S., Spinewine, B., and Le Grelle, N. (2008). Dam-break induced sediment movement: experimental approaches and numerical modelling. J. Hydraulic Res. 46 (2), 176–190. doi:10.1080/00221686.2008.9521854
Keywords: landslide dam, breach characteristics, inflow rate, breach width, breach depth
Citation: Jiang X, Zhang Z and Deng H (2024) Influences of inflow rates on the breach characteristics of landslide dams. Front. Earth Sci. 12:1484093. doi: 10.3389/feart.2024.1484093
Received: 21 August 2024; Accepted: 16 September 2024;
Published: 01 October 2024.
Edited by:
Haijun Qiu, Northwest University, ChinaReviewed by:
Mohammad Azarafza, University of Tabriz, IranJiangcheng Huang, Yunnan University, China
Copyright © 2024 Jiang, Zhang and Deng. This is an open-access article distributed under the terms of the Creative Commons Attribution License (CC BY). The use, distribution or reproduction in other forums is permitted, provided the original author(s) and the copyright owner(s) are credited and that the original publication in this journal is cited, in accordance with accepted academic practice. No use, distribution or reproduction is permitted which does not comply with these terms.
*Correspondence: Xiangang Jiang, anhnamltQDE2My5jb20=
 Xiangang Jiang
 Zongliang Zhang3