 Xiao-Bo Peng
 Wen-Jie Ren
 Tian-Qi Li3*
 Ying-Ying Xue
- 1Jiangsu Earthquake Risk Prevention Center, Earthquake Administration of Jiangsu Province, Nanjing, China
- 2Institute of Geotechnical Engineering, Nanjing Tech University, Nanjing, China
- 3School of Mechanical Engineering, Jiangnan University, Wuxi, China
The variations in seismic response between deep soft soil sites with different shear wave velocities were not fully understood. This study focuses on the seismic response of deep soft soil sites in the lower reaches of the Yangtze River, China. A nonlinear dynamic finite element model was developed for two representative deep soft soil sites with borehole profiles and the shear wave velocity tested by the single borehole method. Two nonlinear cyclic constitutive models are used and thus compared through the site seismic response. To accurately calibrate the nonlinear cyclic model parameters, resonant column tests were conducted on 21 soil samples collected from the two boreholes. The results show that the peak ground acceleration (PGA) under low-frequency (Liuan) input motion was higher for soft soil sites compared to that under medium- and high-frequency (Kobe and Nahanni) input motions. The PGA amplification factor for deep soft soil sites under different input motions can be approximated by an exponential function. The peak ground acceleration tends to be lower as the equivalent shear wave velocity (Vse) decreases. The shapes of the spectral acceleration were similar for the two sites, despite a substantial difference in the Vse between them. Additionally, a crossover point was observed in the spectral acceleration for the two sites. The period corresponding to this crossover point increased with increasing intensity of input motions, indicating that the sites became softer with higher intensity and thus generally exhibited a longer characteristic period of the spectral acceleration. This paper also highlights the significance of selecting nonlinear constitutive models and the precise calibration of model parameters in the seismic response analysis of deep soft soil sites, providing a scientific basis for future similar site analyses.
1 Introduction
Soil is a stratified geological body formed through long and complex geological processes. Due to differences in formation environments, the dynamic properties of soil layers within a site exhibit significant heterogeneity (Shiuly, 2019). Deep soft soil deposits are widely distributed in the downstream plains of rivers, which are densely populated, economically developed, and home to significant infrastructure. In the event of a strong earthquake, this area could suffer substantial economic losses and casualties, making seismic safety for deep soft soil sites a critical concern. Existing studies indicate that variations in local soil conditions can lead to significant differences in site seismic responses. Particularly for deep soft soil sites, there are still differing perspectives on seismic response (Zahoor et al., 2024). Thus, studying the impact of soft soil sites on seismic response is of great theoretical and practical importance for seismic microzonation and disaster mitigation in the area of earthquake engineering (Shiuly et al., 2014; Shiuly and Narayan, 2012).
Currently, scholars have conducted several numerical analyses on the seismic response of soft soil sites. (Pires, 1996). emphasized that the constitutive model in seismic response analysis of soft soil sites needs to account for the damping characteristics of soils under large strain conditions. (Villalobos and Romanel, 2019). found that soft soil sites typically reduce short-period spectral accelerations while increasing long-period accelerations. However, (Sun et al., 2019), found that soft soil interlayers do not always reduce peak acceleration within soil layers, as this is highly influenced by the frequency of the input seismic motion. (Cavalieri et al., 2021). analyzed the impact of soil-structure interaction effects on the seismic response of soft soil sites. (Silahtar, 2023). discovered that the spectral accelerations for soft soil sites exceeded the requirements of the Turkish Building Earthquake Code. Xiao et al. (2022) observed that soft soil sites exhibit a more significant weakening effect on peak ground acceleration compared to bedrock sites. Qiao et al. (2023) explored the influence of soil type on site seismic response but assumed the soil profile to be a uniform and single ideal layer. These prior studies have primarily focused on shallow soft soil layers (less than 100 m), leaving limited research on the seismic response of deep soft soil layers exceeding 100 m. While Zhang et al. (2023) examined the seismic response of deep soft soil layers in the Shanghai area, they did not clarify how the parameters for the nonlinear constitutive model were calibrated. Chen et al. (2013) pointed out the need to fully consider the effects of large, distant earthquakes on deep soft soil sites, and further research is needed on the differences in seismic response among deep soft soil sites with varying equivalent shear wave velocities.
Seismic response analysis of soil layers is essential for the seismic safety evaluation of major projects, as the scientific accuracy of these results is critical for earthquake-resistant design. In recent developments, deep learning techniques have been applied to compute site seismic responses (Choi et al., 2024). However, in engineering practice, the most widely used method for seismic response calculation of soil layers at present is the one-dimensional seismic response analysis (Ansal et al., 2024; Shiuly et al., 2017). The one-dimensional seismic response analysis method is divided into frequency-domain equivalent linear methods and time-domain nonlinear methods. Studies have shown that the differences between these two methods can become significant under large strain of soils (Chen et al., 2022; Yee et al., 2013; Kaklamanos et al., 2015; Kim et al., 2016). While many studies have applied the frequency-domain equivalent linear method to site seismic response analysis, there has been less application of time-domain nonlinear methods to deep soft soil sites. The existing time-domain nonlinear methods need improvement when calculating the seismic response of soft soil sites under high-intensity seismic inputs (Griffiths et al., 2016), particularly regarding the damping characteristics of soil under low and high strain conditions (Phillips and Hashash, 2009; Yniesta et al., 2017), which involves the crucial issue of selecting an appropriate nonlinear model. (Groholski et al., 2016). stressed that inaccuracies in the soil maximum shear stress described by the nonlinear constitutive model could lead to underestimation or overestimation of seismic response. Therefore, nonlinear constitutive models require careful calibration of model parameters in seismic response analysis.
This study focuses on the seismic response of deep soft soil sites in the lower reaches of the Yangtze River, China. A nonlinear dynamic finite element model was developed for two representative deep soft soil sites with borehole profiles and shear wave velocity tested using the single borehole method. According to the “GB 50011-2010: Code for Seismic Design of Buildings,” these two deep soft soil sites are classified as Type IV, but their shear wave velocities differ significantly. Two nonlinear cyclic constitutive models were used and compared through site seismic response analysis. To accurately calibrate the nonlinear cyclic model parameters, resonant column tests were conducted on 21 soil samples collected from the two boreholes. This paper discusses in detail the effects of model selection, input seismic intensity and frequency, and the average equivalent shear wave velocity on seismic response of deep soft soil sites. The main objective of this study is to investigate the seismic response of deep soft soil sites with varying equivalent shear wave velocities (Vse), using a nonlinear dynamic finite element model and calibrated constitutive models. By comparing the seismic responses under different input motions, the study aims to provide a scientific basis for seismic site analysis and improve the understanding of how Vse affects peak ground acceleration (PGA) and spectral characteristics of deep soft soil sites.
2 Finite element modeling of two soft soil sites
A nonlinear dynamic finite element model was developed using borehole profiles and resonant column tests to calibrate the parameters of two constitutive models (Wakai and Ugai, 2004; Hardin and Drnevich, 1972). The following sections present the site configuration, governing equation, nonlinear cyclic constitutive models, and input seismic motions.
2.1 Site configurations
The borehole data were obtained, from the lower reaches of the Yangtze River, near Haimen, China. The profile of the two selected typical boreholes, ZK1 and ZK2, is shown in Figure 1. The boreholes revealed that the upper soil layers with a thickness of several tens of meters mainly consist of mud, silty sand, silty soil with interlayers of muddy silty clay, muddy clay with interlayers of silty soil, and silt with fine sand layers. The lower layers are mostly fine sand and gravelly medium to coarse sand, with some areas containing thick silty clay. The depth of the ZK1 and ZK2 boreholes reached 150 m. Table 1 shows that the overburden thickness of the ZK1 and ZK2 boreholes is 111.5 m and 95 m, respectively. The calculation domain and the shear wave velocity tested by the single borehole method for two soft soil sites are provided in Figure 1. The equivalent shear wave velocity for these two boreholes was calculated to be 147.6 m/s and 123.2 m/s. According to the “Code for Seismic Design of Buildings” (GB50011-2010), both the ZK1 and ZK2 boreholes are classified as soft soil sites (Class IV).
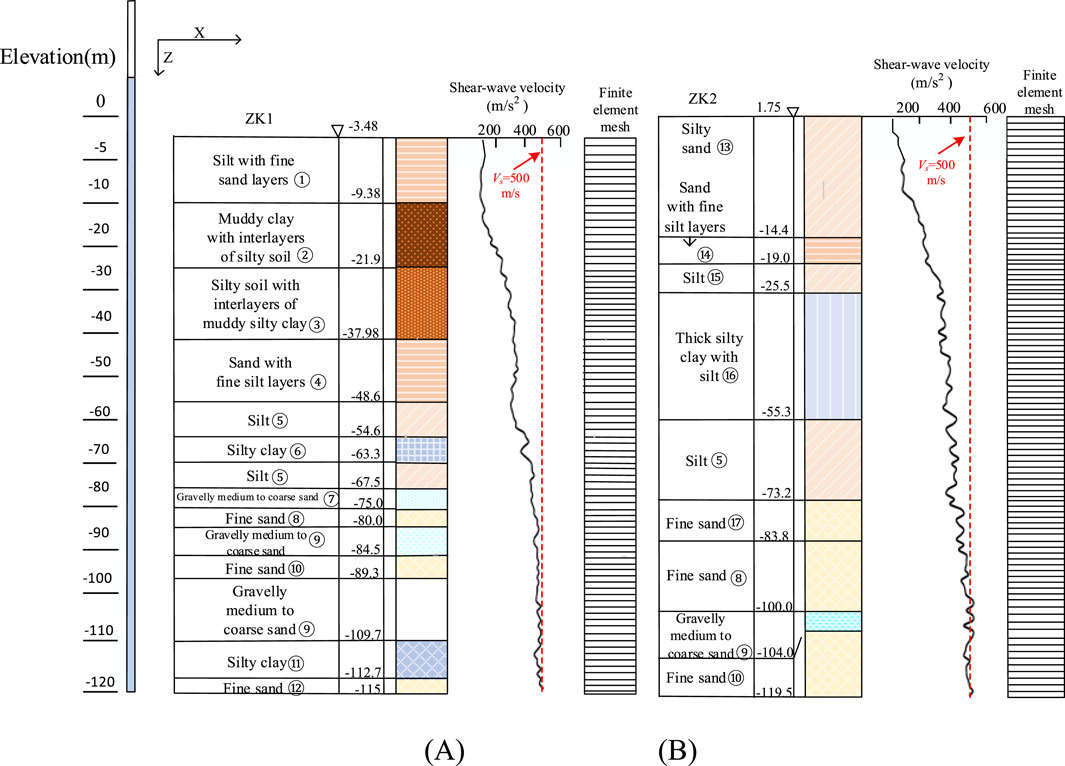
Figure 1. Profiles of typical boreholes and shear wave velocity: (A) ZK1 and (B) ZK2.

Table 1. The equivalent wave velocity and site classification of two soft soil deposits.
2.2 Governing equation for the dynamic response
A finite element model was established in the fully coupled dynamic effective stress finite element analysis software called UWLC (Cai et al., 2002; Forum 8 Co. Ltd, 2005; Xu et al., 2021; Xu et al., 2023a; Xu et al., 2024; Xue et al., 2023), which enables both effective stress and total stress analyses. In this study, the total stress analysis method was used for the site seismic response analysis, and the governing equation for the seismic response is given by Equation 1 (Biot, 1956; Pastor et al., 1990):
where M is the mass matrix, C is Rayleigh damping matrix, K is the stiffness matrix, u is the displacement vector, and fu is the external load vector. The mass coefficient and stiffness coefficient in Rayleigh damping matrix were calculated using a damping ratio of 0.03 at two frequencies (f1 = 0.5 Hz and f2 = 5 Hz) (Wakai and Ugai, 2004; Xu et al., 2023a).
In the finite element (FE) analysis, a static analysis should be performed to provide the initial stress for the site’s seismic response. In the dynamic analysis, Multi-Point Constraints (MPC) boundaries were applied to the lateral sides of the FE model, which is fixed at the bottom.
2.3 Nonlinear cyclic constitutive models
This study employed two nonlinear cyclic constitutive models, the Ugai and Wakai model (Wakai and Ugai, 2004) and the Hardin and Drnevich model (Hardin and Drnevich, 1972), to simulate the nonlinear and hysteretic behavior of the soil. The two models and the differences between these two models are discussed in detail as follows.
2.3.1 Hardin and Drnevich (1972) model
Nonlinear cyclic constitutive models generally consist of backbone and hysteretic curves. The backbone curve of Hardin and Drnevich (1972) model, describing the relationship between the shear stress τ and the shear strain γ, was described by Equation 2:
where G0 are τf are the initial shear modulus and shear strength of soils, which are given by Equations 3, 4, respectively:
where G0,r m, c, φ, and Rf are four model constants, Pa is the standard atmospheric pressure and was taken as 100 kPa in this study, Θ is Lode angle. G0 is determined by
The hysteretic curve of Hardin and Drnevich (1972) model is also described by Equation 5:
2.3.2 Ugai and Wakai (2004) model
The backbone curve of the Wakai and Ugai, 2004 (UW) model is the same as that of the Hardin and Drnevich (1972) (HD) model, but the hysteresis curve of the UW model differs from that of the HD model and is given by Equation 6:
where b and n are two model constants that can be used to accurately control the damping ratio of soils (Xu et al., 2023b). When
The effectiveness of the HD model in dynamic analysis has been validated by simulating the acceleration data measured at the Wildlife site. The results show that the simulated peak ground acceleration and the peak values of the surface acceleration response spectrum match well with the observed data. A detailed description of the model can be found in the literature (Xu et al., 2013; Xu et al., 2014). Similarly, the UW model has also been proven effective in site seismic response analysis and seismic slope failure analysis (Wakai et al., 2010; Iino et al., 2024).
The Hardin and Drnevich (1972) model is a classic dynamic constitutive model, but it tends to overestimate soil damping under large strains. In contrast, the UW model introduces two parameters, b and n, which address this issue and allow for precise control of soil damping. In this study, a comparative analysis of the differences between the UW model and HD model results was conducted based on accurately calibrated model parameters.
2.3.3 Model calibration
To accurately calibrate the nonlinear model parameters, resonant column tests were conducted on 21 soil samples collected from the two (ZK1 and ZK2) boreholes. The testing instrument used was the GZZ-50 resonant column apparatus, which operates based on the principle of torsional free vibration. The test process and data acquisition are controlled by a computer, ensuring high testing accuracy. The test procedure follows (ASTM D4015-15, 2015). Figures 2, 3 shows the experimental normalized shear modulus (G/Gmax)- shear strain (γ) and the damping ration (λ) – shear strain (γ) curves of various soils at the ZK1 and ZK2 boreholes, respectively. The UW model parameters calibrated based on the test data are shown in Table 2. By adjusting the model parameters, the simulated modulus and damping curves were fitted to the experimental values with an R-squared value greater than 0.94. The simulation results using the model parameters are plotted in Figures 2, 3, where it can be seen that the model simulations agree well with the experimental results.
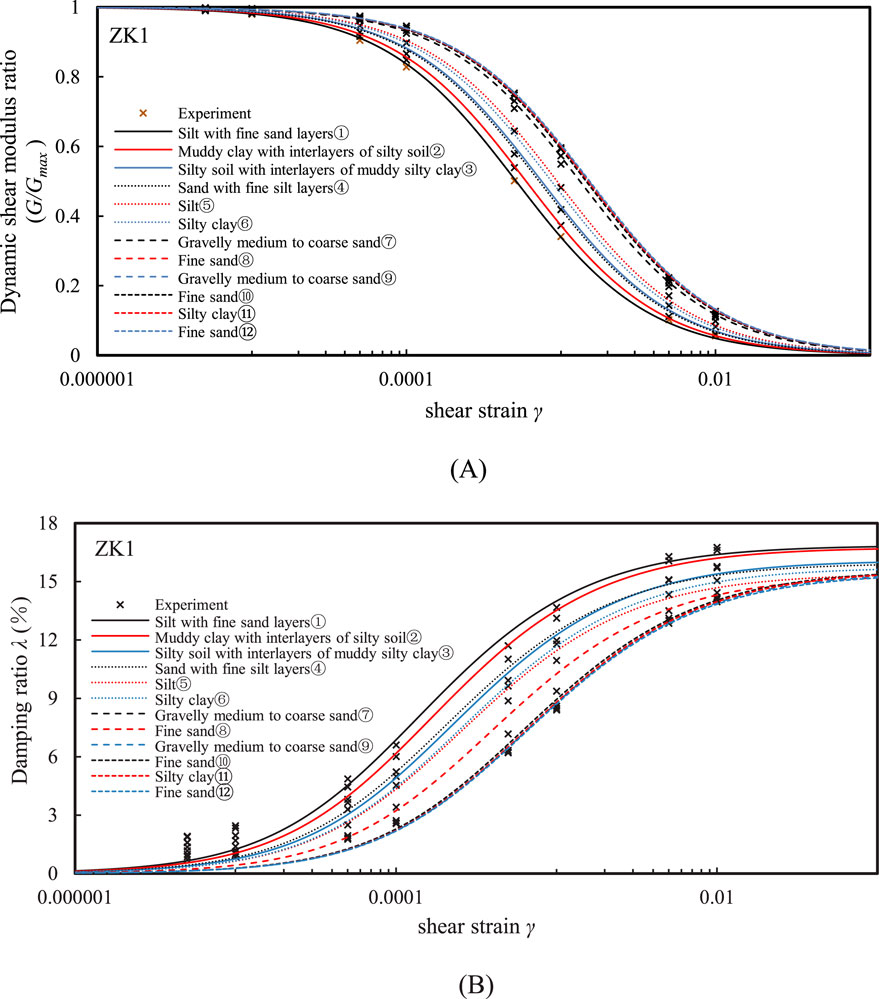
Figure 2. Comparison between the measured and simulated (A) G/Gmax - γ and (B) λ - γ curves for different soils at ZK1 borehole.
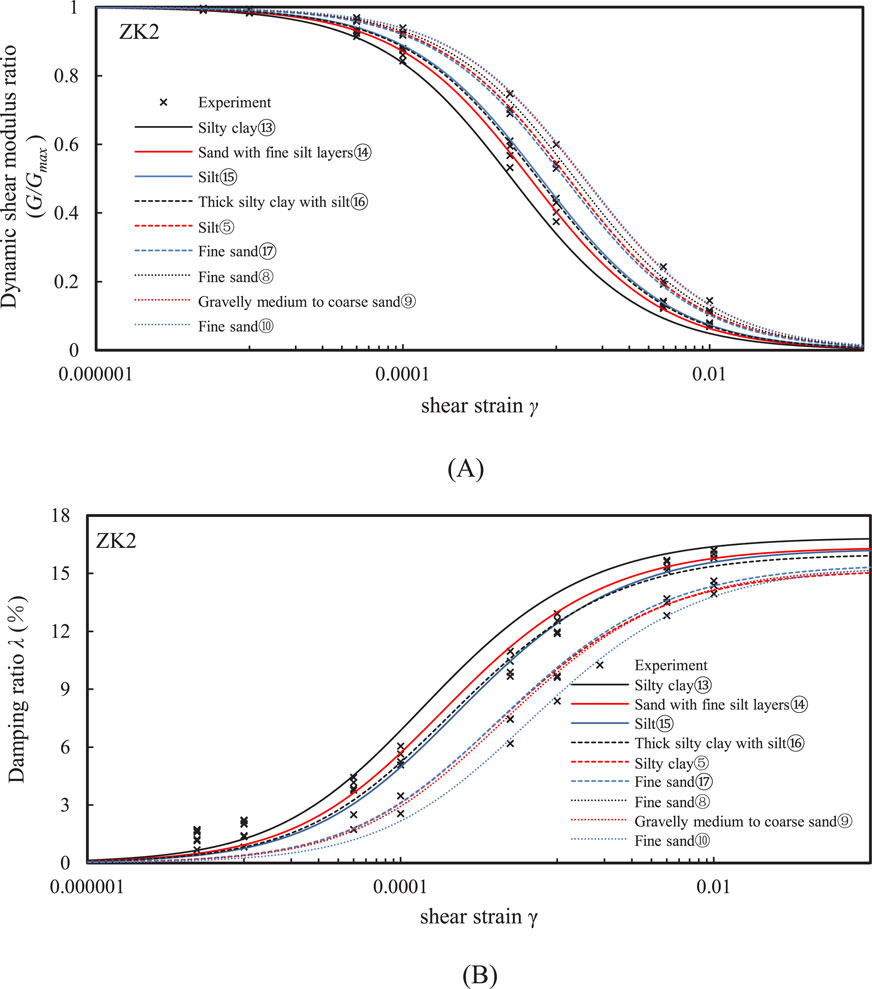
Figure 3. Comparison between the measured and simulated (A) G/Gmax - γ and (B) λ - γ curves for different soils at ZK2 borehole.
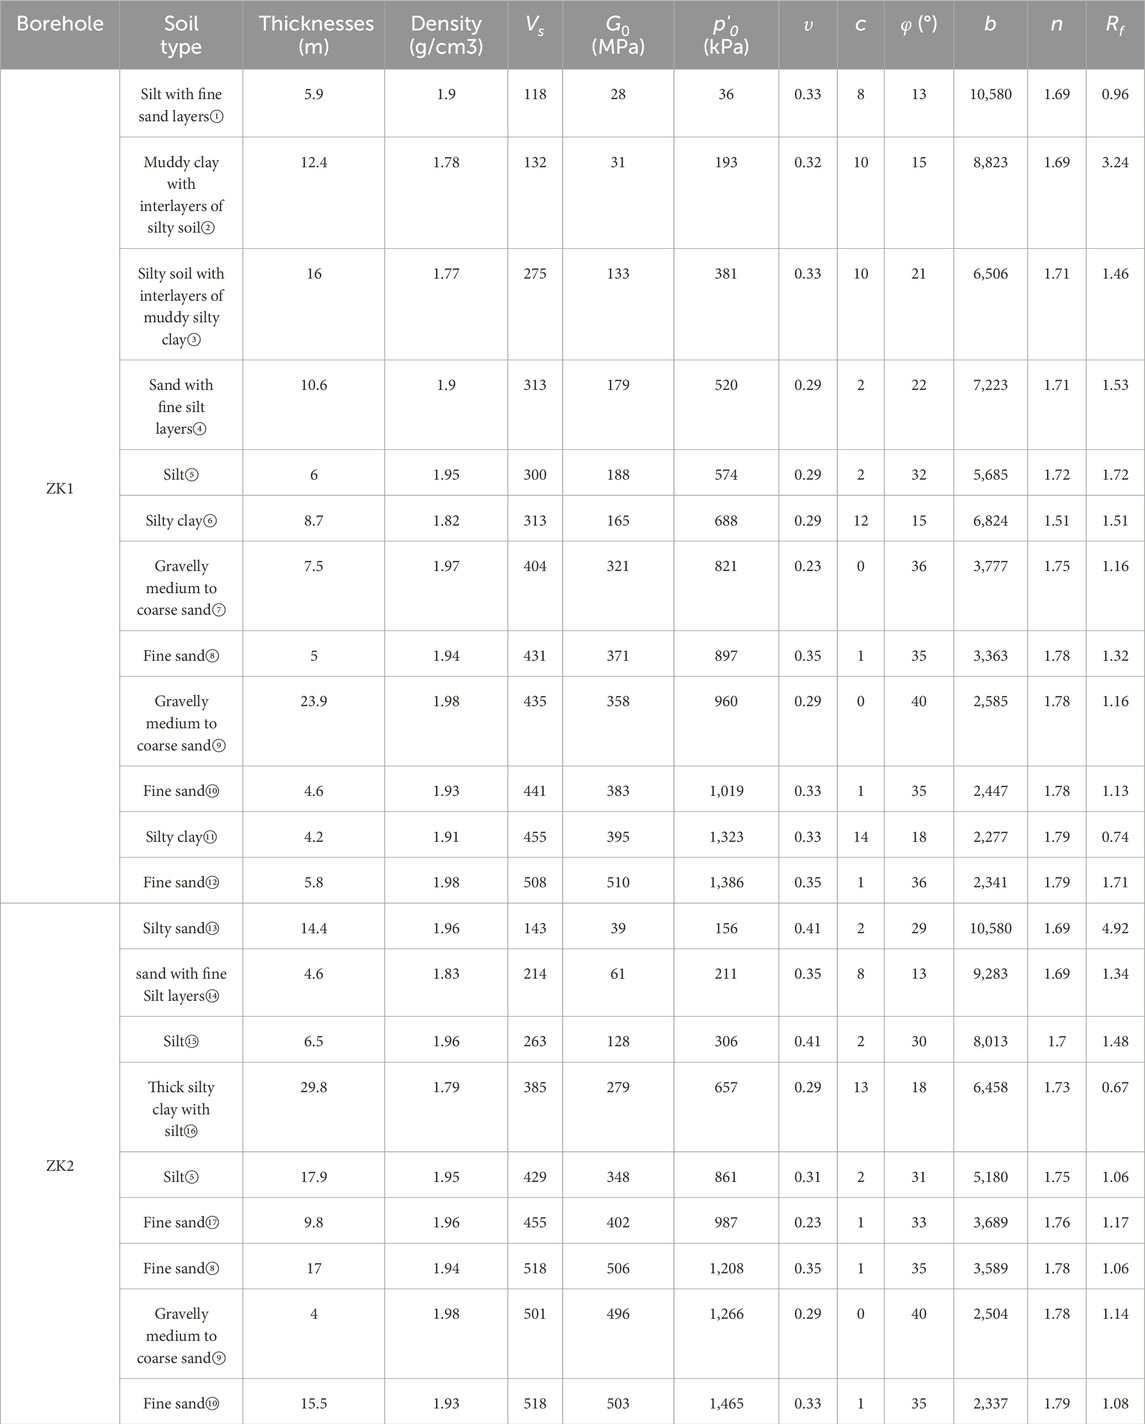
Table 2. Soil properties and model parameters of different soils.
2.4 Input seismic motions
Considering the impact of the spectral characteristics of input motions on site seismic response, this study selected three input motions with distinctly different frequency characteristics: the Liuan input motion, which is rich in low-frequency components; the Kobe input motion, which has a uniform frequency distribution; and the Nahanni input motion, which is rich in high-frequency components. Figure 4 shows the acceleration time history curves and Fourier amplitude for the Liuan, Kobe, and Nahanni input motions with peak horizontal acceleration of 0.1 g. It can be seen that the Liuan, Kobe, and Nahanni input motions represent low-frequency, medium-frequency, and high-frequency waves, respectively.
3 Results and discussions
This study focuses on the impact of input motion frequency, horizontal input motion amplitude, and equivalent shear wave velocity on the seismic response of soft soil sites (see Table 3), including peak ground acceleration (PGA), peak ground acceleration (PGA) amplification factor, acceleration response spectrum, and Fourier spectrum. The PGA amplification factor is defined as the ratio of PGA to PHA, where PHA is the peak horizontal acceleration of input motions.
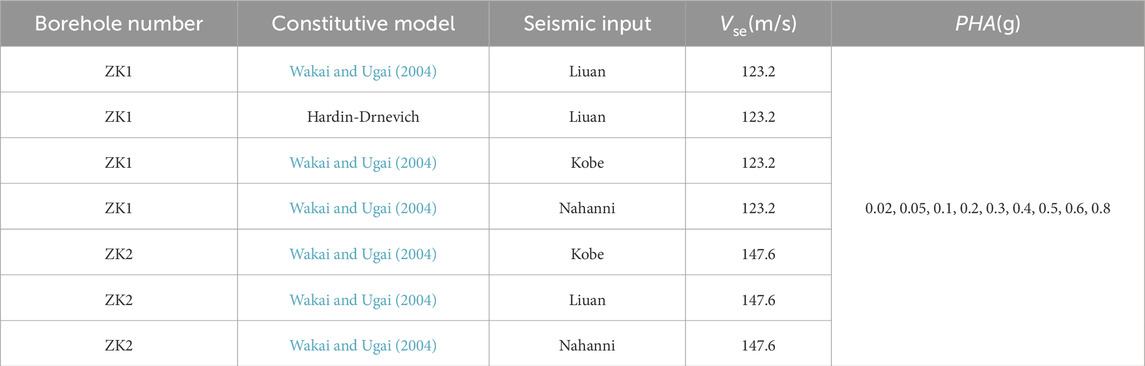
Table 3. Detail of the cases in parametric studies.
The effect of input motion frequency is investigated by inputting seismic motions with three distinctly different frequency components, as shown in Figure 4. The PHA of input motions was adjusted to 0.02 g, 0.05 g, 0.1 g, 0.2 g, 0.3 g, 0.4 g, 0.5 g, 0.6 g, and 0.8 g in the finite element analyses.
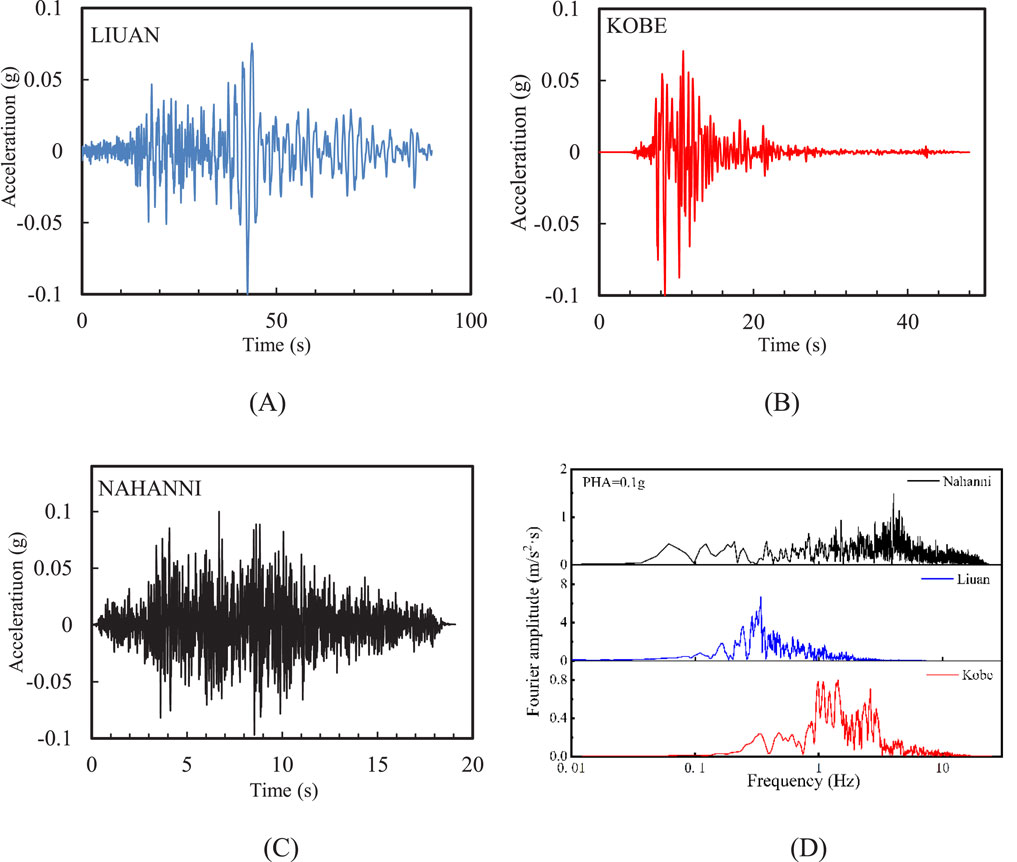
Figure 4. Three input motions with significantly different frequency components: horizontal acceleration of (A) Kobe (B) Liuan (C) Nahanni; (D) Fourier amplitude.
Both soft soil sites are classified to Class IV according to GB50011–2010, but they differ significantly in the equivalent shear wave velocity shown in Table 1. Therefore, the effect of equivalent shear wave velocity is studied by comparing the seismic responses of these two soft soil sites. Although both the Wakai and Ugai (2004) (UW) model and the Hardin and Drnevich (1972) (HD) model can simulate the behavior of soil under cyclic loading and unloading conditions, there is a significant difference in the damping characteristics of the soils simulated by the two models. This study investigated the influence of nonlinear model selection on the seismic response of soft soil sites.
3.1 Comparison between the results using two constitutive models
Figure 5 shows the comparison between the peak ground acceleration (PGA) and the PGA amplification factor at the ground surface using two constitutive models under different input motions. The configuration of the ground is from the ZK1 borehole. As the peak horizontal acceleration (PHA) of input motions increased, the PGA calculated by both models showed an increasing trend. However, when the PHA exceeded approximately 0.1 g, the rate of increase in PGA became less pronounced, and after PHA reached 0.5 g, a decreasing trend was observed. At PHA = 0.02 g, the PGA calculated using the UW model was higher than that from the HD model. But as PHA increased further, the PGA from the UW model became significantly lower than that from the HD model. Additionally, the difference in PGA between the two models grew as PHA increased. This indicates that the choice of constitutive models can introduce systematic biases in the seismic response of sites. To avoid this issue, it is recommended that some resonant column tests be conducted in seismic safety assessments to rigorously calibrate the parameters of constitutive models.
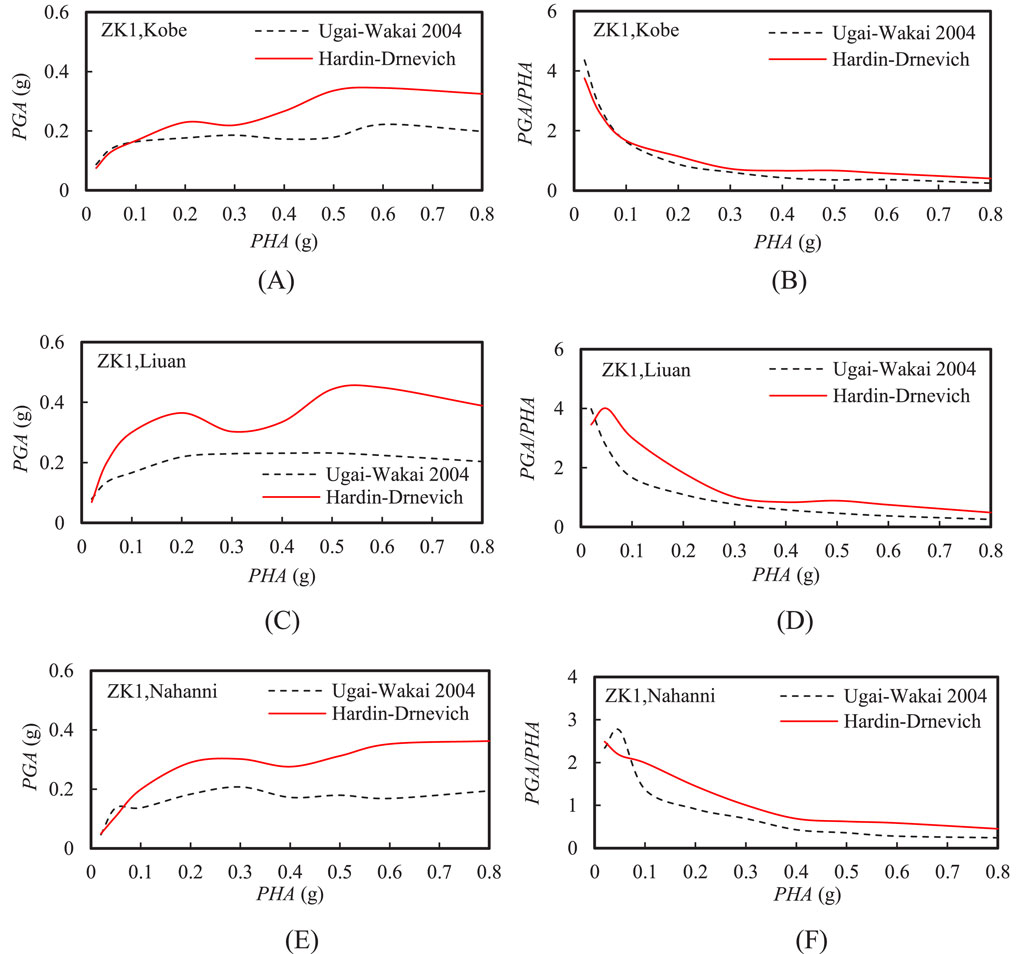
Figure 5. Comparison between the peak ground acceleration (PGA) and acceleration amplification factor at the ground surface using two constitutive models under different input motions: (A) PGA and (B) PGA/PHA under Kobe input motion; (C) PGA and (D) PGA/PHA under Liuan input motion; (E) PGA and (F) PGA/PHA under Nahanni input motion.
Figure 5 also shows that the PGA amplification factor shows a gradually decreasing trend as the PHA increased. However, the difference in the PGA amplification factors calculated by the two constitutive models under low-frequency and high-frequency waves was much greater than that under medium-frequency waves. Additionally, the rate at which the PGA amplification factor decreased with increasing PHA varied depending on the input motion. Under high-frequency input motion, the PGA amplification factor was smaller, but its rate of decrease was the slowest. In contrast, the rate of decrease in the PGA amplification factor was fastest under medium-frequency input motion. Overall, when PHA exceeded 0.3 g, the PGA amplification factor for soft soil sites tended to stabilize, with all amplification factors falling below 1. The minimum PGA amplification factors calculated by the HD model and the UW model were approximately 0.45 and 0.25 respectively.
Figure 6 shows the comparison between the acceleration response spectra at the ground surface using two nonlinear constitutive models at various PHAs. In this study, a uniform damping ratio of 5% was used for the calculation of the acceleration response spectra. It can be observed that the dominant periods of the response spectra obtained from the HD model and the UW model were nearly identical, both around 3 s. However, as PHA increased, the difference in spectral acceleration (Sa) at these dominant periods between the two models became more pronounced. In the long-period range of the response spectrum, such as beyond 5 s, the spectral accelerations calculated by the UW model were higher than those from the HD model, despite the HD model generally yielding higher PGA values. Due to the larger soil damping simulated by the HD model compared to the UW model, the shear strain in the soil calculated by the HD model is smaller, leading to an overestimation of the soil’s shear modulus. This explains that the HD model produced a higher short-period response in the acceleration response spectrum. Therefore, the HD model tends to be conservative for short-period structures, but for long-period structures, it may still underestimate the seismic effects.
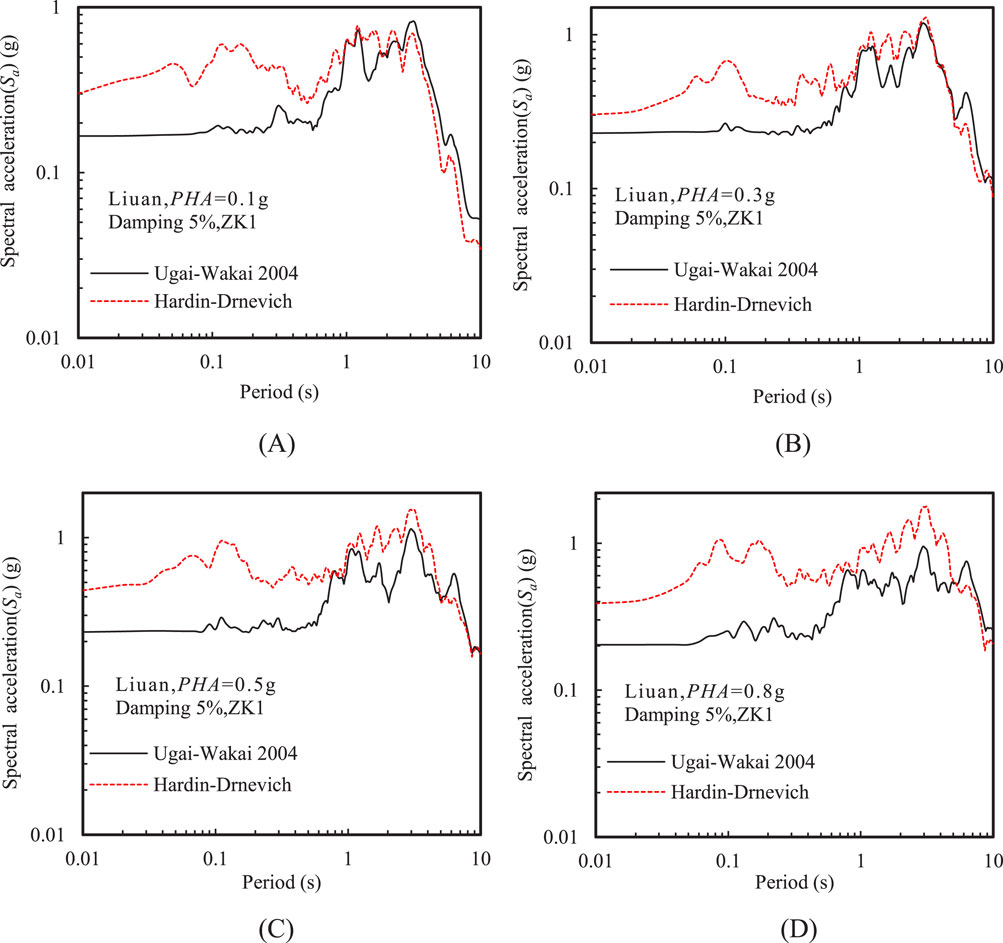
Figure 6. Acceleration response spectra at the ground surface using two nonlinear constitutive models at various PHAs: (A) PHA= 0.1 g, (B) PHA = 0.3 g, (C) PHA = 0.5 g, and (D) PHA = 0.8 g (Liuan input motion).
Figure 7 further shows that Fourier amplitude of the ground acceleration calculated by the HD model was significantly higher than those calculated by the UW model at 0.2 Hz, while for frequencies below 0.2 Hz, the trend of Fourier amplitude is reversed. This also accounts for the higher PGA amplification factor obtained with the HD model and the elevated long-period spectral acceleration observed with the UW model.
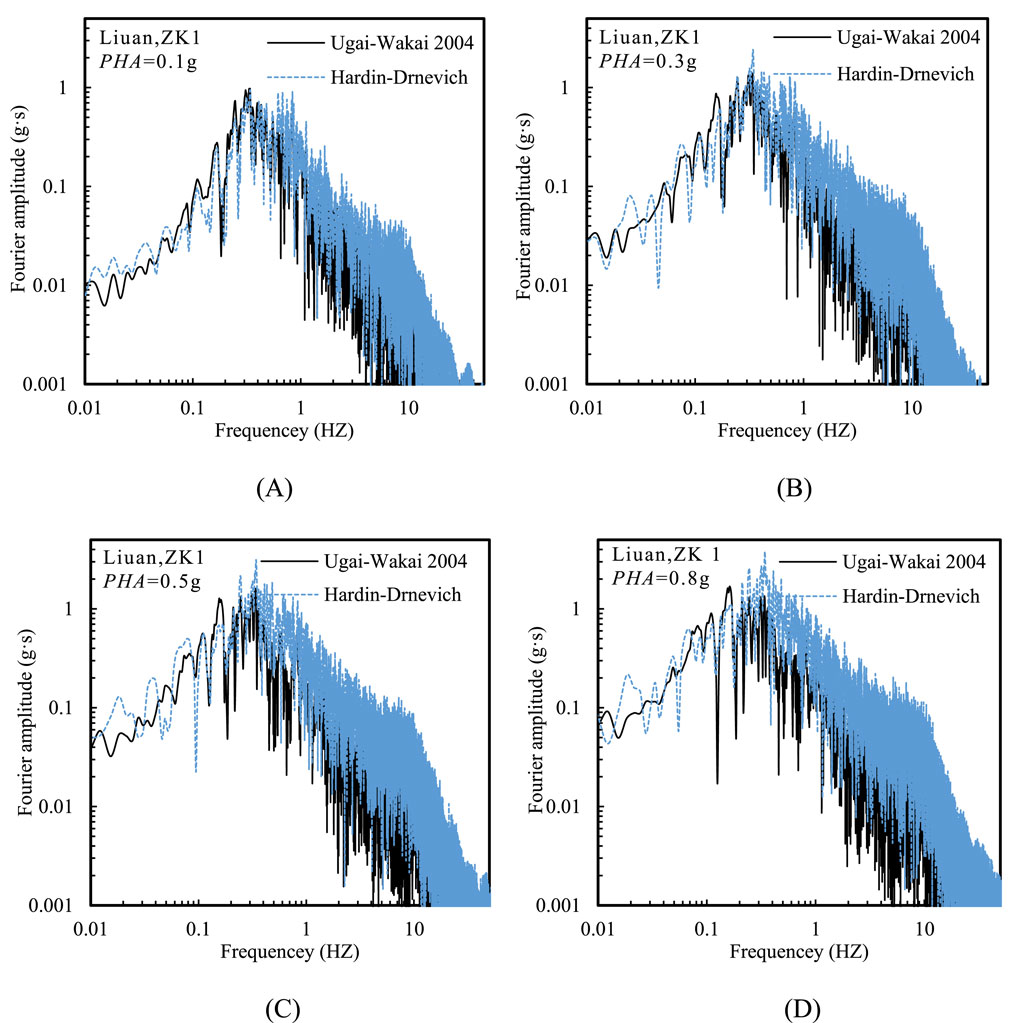
Figure 7. Fourier amplitude at the ground surface using two nonlinear constitutive models at various PHAs: (A) PHA = 0.1 g, (B) PHA = 0.3 g, (C) PHA = 0.5 g, and (D) PHA = 0.8 g (Liuan input motion).
3.2 Effect of input motion frequency
Given that a deep soft soil site might result in a stronger response to long-period seismic motions, the UW model was selected for subsequent calculations and analyses. Figure 8 shows the effect of input motion frequency on the PGA and acceleration amplification factor (PGA/PHA). Overall, the PGA under low-frequency (Liuan) input motion was higher for soft soil sites compared to that under medium- and high-frequency (Kobe and Nahanni) input motions. When PHA was below 0.05 g, the PGA amplification factor under high-frequency seismic motion was significantly lower than under low-and medium-frequency input motions. However, when PHA exceeded 0.05 g, the differences in the PGA amplification factors for different input motions were not significant. The PGA amplification factor for the soft soil site under different input motions can be approximated by an exponential function, as shown by Equation 7:
where a1, a2, and a3 are fitting parameters and were taken as 3.90, −10.48, and 0.38, respectively. Moreover, the PGA amplification factors from the two references were given in Figure 8B. The range of PGA amplification factors calculated in this study was quite similar to the results obtained for deep soft soil sites by Zhang et al. (2023). In contrast, Tang et al. (2024) observed higher PGA amplification factors for soft soil sites in their shaking table tests, likely due to the shallower soft soil layer in their model (equivalent to a prototype depth of 75 m). Therefore, the effect of soft soil thickness on site seismic response requires careful consideration.
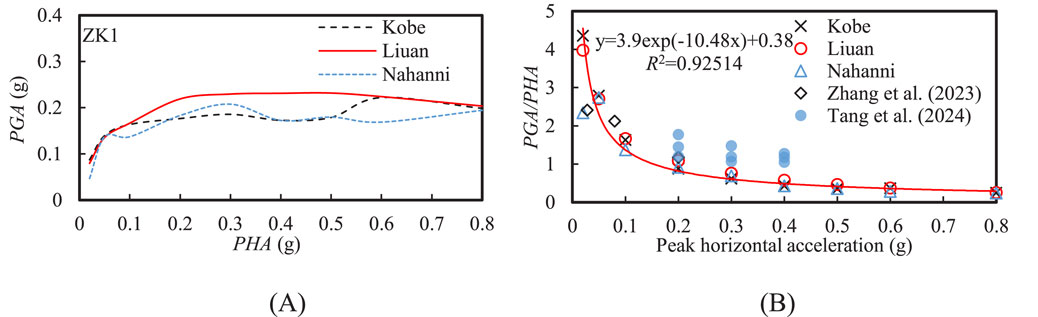
Figure 8. Effect of input motion frequency on the (A) peak ground acceleration (PGA) and (B) acceleration amplification factor (PGA/PHA) at the ground surface.
Figure 9 shows the effect of input motion frequency on the amplification factor (Sa/PGA) of the spectral acceleration at various PHAs. A noticeable amplification zone forms around 1 s in the acceleration response spectra under different input motions. As the PHA increased, the amplification zone expanded and shifted towards the long-period region. Overall, the amplification factor in the period range above 1 s gradually increased with increasing PHA. This is because the nonlinearity of the soil layer intensifies as the input intensity increases.
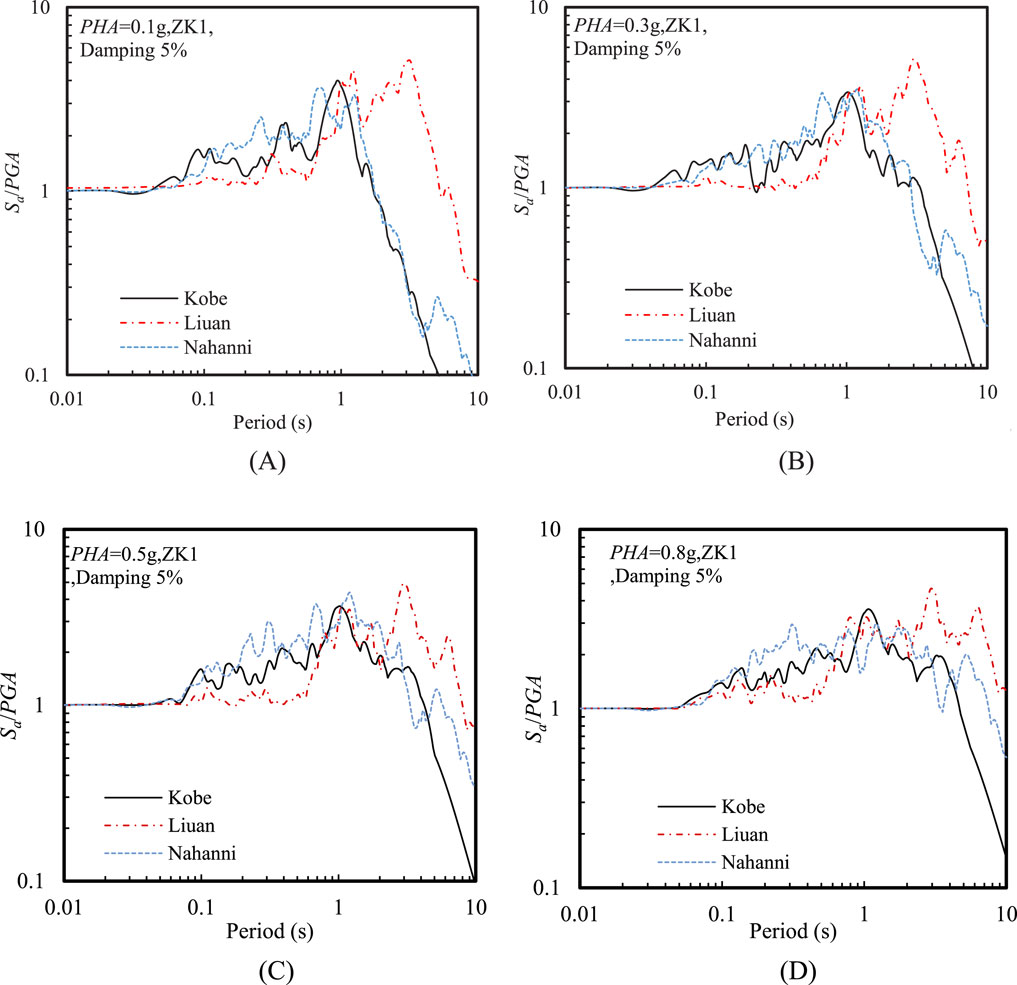
Figure 9. Effect of input motion frequency on the amplification factor of acceleration response spectra at the ground surface at various PHAs: (A) PHA = 0.1 g, (B) PHA = 0.3 g, (C) PHA = 0.5 g, and (D) PHA = 0.8 g.
Additionally, it is particularly noteworthy that the shapes of the spectral acceleration amplification factor (Sa/PGA) under high- and medium-frequency input motions were similar, while their shapes differ significantly from those dominated by low-frequency input motions. The amplification factor under low-frequency (Liuan) seismic motion was generally above 2 for periods longer than 1 s, and there was a noticeable peak around 3 s with a value of approximately 5. In contrast, the amplification factors for medium- and high-frequency seismic motions were generally below 2 at around 2 s. This indicates that Liuan input motion, with abundant low-frequency components, may be close to the natural frequency of soft soil sites, leading to a resonance effect. This resonance effect was particularly evident when the PHA was relatively high.
Figure 10 shows that under low-frequency (Liuan) seismic motion, the low-frequency components of the ground acceleration Fourier amplitude had higher values, while under high-frequency (Nahanni) seismic motion, the high-frequency components exhibited higher values. Moreover, under mid-frequency (Kobe) seismic motion, the Fourier amplitude of ground acceleration below 0.2 Hz was the lowest, due to the minimal spectral value in this frequency range for the Kobe input motion (see Figure 4). Additionally, as PHA increased, the Fourier amplitude of ground acceleration below 1 Hz under high-frequency (Nahanni) seismic motion gradually rise, approaching the results seen under low-frequency (Liuan) seismic motion. This is because a higher PHA enhanced the nonlinearity of soils, resulting in increased spectral accelerations in the long-period range.
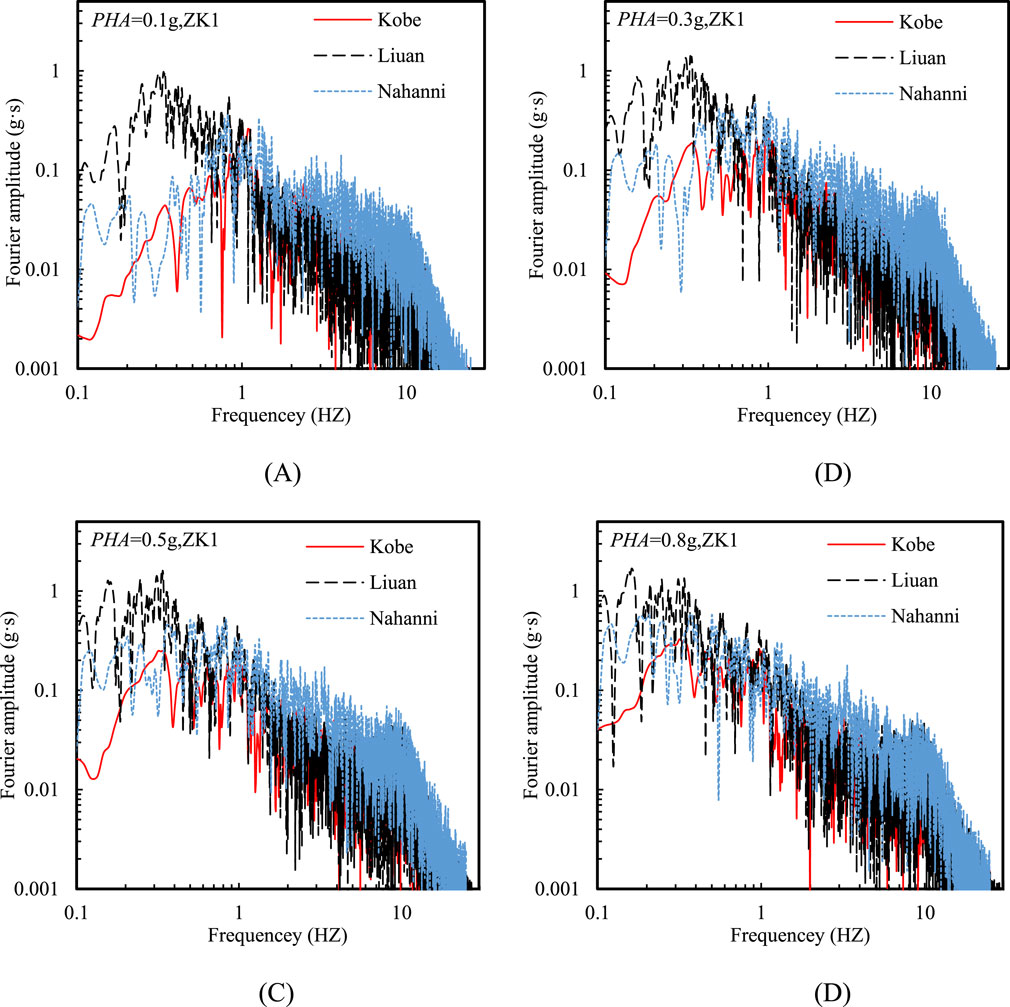
Figure 10. Effect of input motion frequency on Fourier amplitude at the ground surface at various PHAs: (A) PHA = 0.1 g, (B) PHA = 0.3 g, (C) PHA = 0.5 g, and (D) PHA = 0.8 g.
3.3 Effect of shear wave velocity
To study the impact of equivalent shear wave velocity (Vse) on the seismic response of the same site classification, this study selected the ZK2 borehole with Vse = 147.6 m/s for comparison. The Vse of the ZK2 borehole was much higher than the Vse of the ZK1 borehole (123.2 m/s), as shown in Table 1.
Figure 11 illustrates that the variation pattern in PGA for the two sites with increasing PHA was quite similar. However, in general, as PHA increased, the PGA and the amplification factor for the site with a lower Vse were relatively smaller. Figure 12 reveals that the shapes of the spectral acceleration were similar for the two sites, despite a substantial difference in the Vse between them. Additionally, a crossover point was observed in the spectral acceleration for the two sites. When T was less than the period corresponding to this crossover point, the spectral accelerations were lower for the site with a lower Vse. In contrast, when T exceeded the period of the crossover point, the spectral accelerations become relatively higher for the site with a lower Vse. Moreover, the spectral acceleration crossover point signifies the transition in seismic response characteristics between the two sites. This point shifts to longer periods as input motion intensity increases, indicating that the sites became softer with higher PHA and thus generally exhibited a longer characteristic period in the acceleration response spectrum.
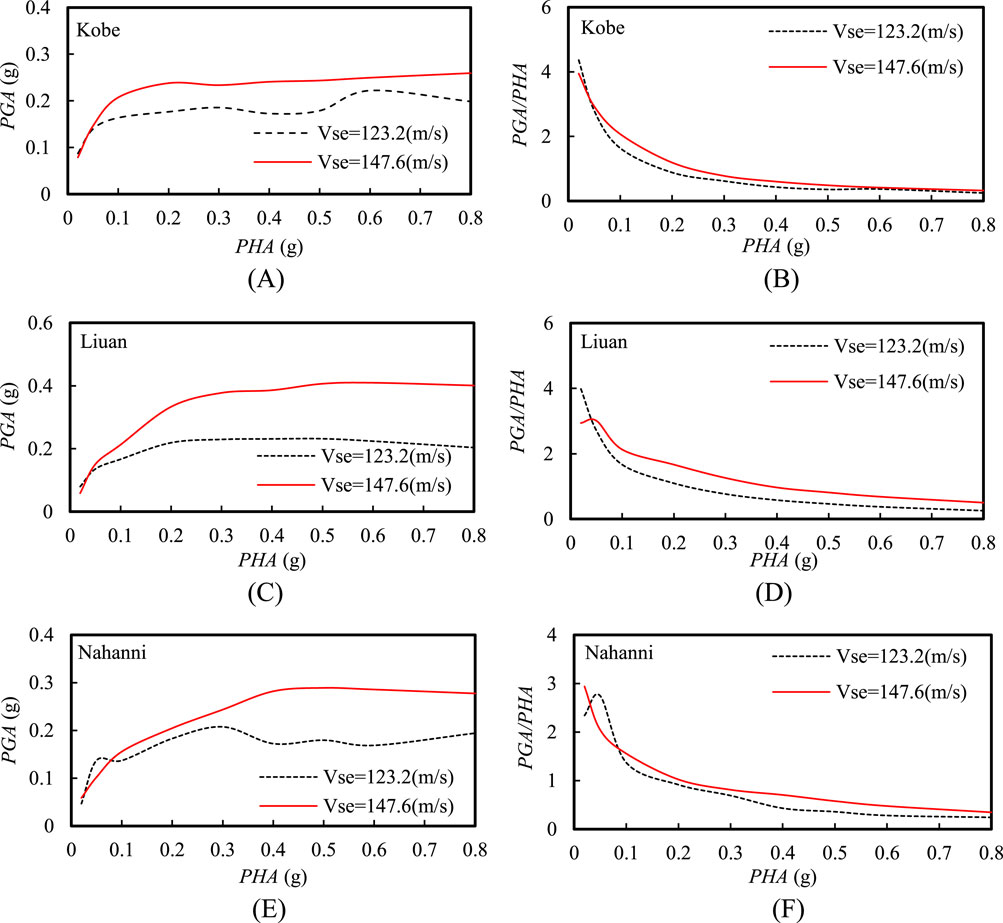
Figure 11. Effect of equivalent shear wave velocity on the peak ground acceleration (PGA) and acceleration amplification factor at the ground surface under different input motions: (A) PGA and (B) PGA/PHA under Kobe input motion; (C) PGA and (D) PGA/PHA under Liuan input motion; (E) PGA and (F) PGA/PHA under Nahanni input motion.
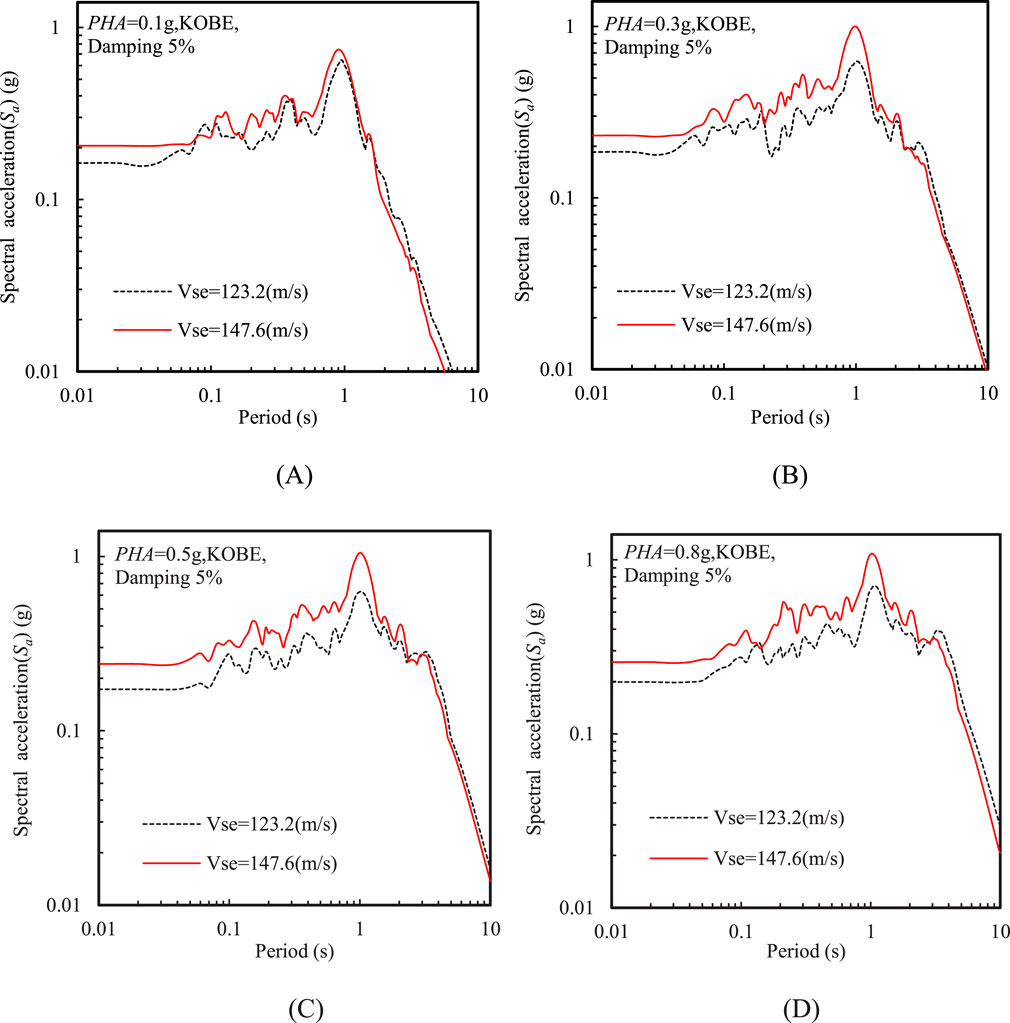
Figure 12. Effect of equivalent shear wave velocity motion frequency on acceleration response spectra at the ground surface at various PHAs: (A) PHA = 0.1 g, (B) PHA = 0.3 g, (C) PHA = 0.5 g, and (D) PHA = 0.8 g (Kobe input motion).
Figure 13 provides a comparison of Fourier amplitude of ground acceleration for the two soft soil sites under the same input motion. The variation in Fourier amplitudes with frequency was fundamentally consistent with the variation in spectral acceleration with period. Specifically, the soft soil site with a higher Vse showed higher Fourier amplitudes in the high-frequency range, while the Fourier amplitudes were lower in the relatively low-frequency range.
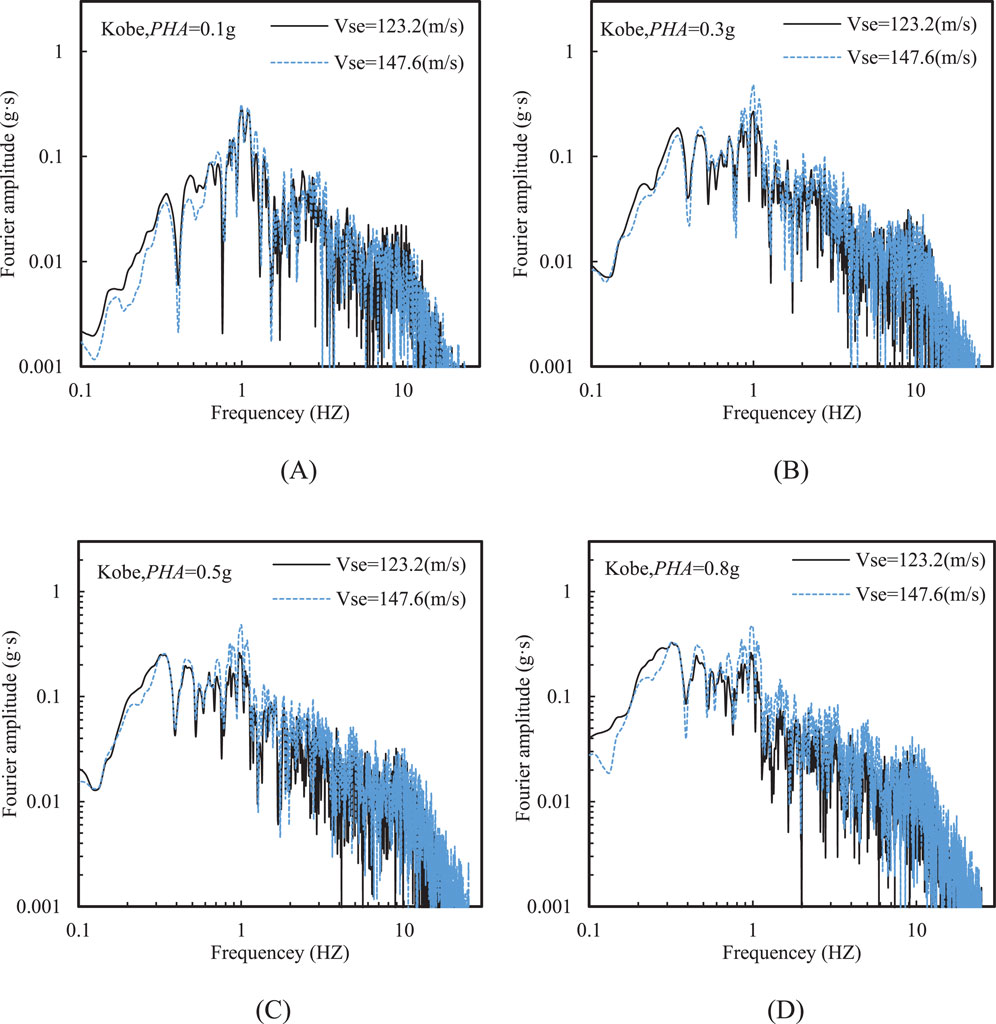
Figure 13. Effect of equivalent shear wave velocity motion frequency on Fourier amplitude at the ground surface at various PHAs: (A) PHA = 0.1 g, (B) PHA = 0.3 g, (C) PHA = 0.5 g, and (D) PHA = 0.8 g (Kobe input motion).
4 Conclusion
Seismic response of two deep soft soil sites were numerically investigated with model parameters accurately calibrated from resonant column tests. Two nonlinear constitutive models, i.e., Wakai and Ugai (2004) and Hardin and Drnevich (1972) models, were compared in this study. From the numerical results, some implications can be found:
(1) Both the HD and UW models reflect similar dominant periods of the response spectra at the ground surface. Generally, the HD model tends to give higher spectral acceleration within short-period range, but the UW model may better capture the stronger seismic response in the long-period range.
(2) The PGA under low-frequency (Liuan) input motion was higher for soft soil sites compared to that under medium- and high-frequency (Kobe and Nahanni) input motions. The PGA amplification factor for the soft soil site under different input motions can be approximated by an exponential function.
(3) The peak ground acceleration tends to be lower as the equivalent shear wave velocity decreases. The shapes of the spectral acceleration were similar for the two sites, despite a substantial difference in the Vse between them. Additionally, a crossover point was observed in the spectral acceleration for the two sites. the period corresponding to this crossover point increased with increasing PHA, indicating that the sites became softer with higher PHA and thus generally exhibited a longer characteristic period in the acceleration response spectrum.
The scope of this study is limited to two specific deep soft soil sites, which may not represent all deep soft soil conditions, further research using field data or full-scale testing is needed to ensure broader applicability of the findings. The findings of this study suggest that the selection of appropriate nonlinear constitutive models and the accurate calibration of model parameters are essential for reliable seismic response analysis of deep soft soil sites. The results provide a scientific basis for improving seismic hazard assessments and site-specific analyses, particularly in regions with deep soft soil conditions similar to those in the lower reaches of the Yangtze River, China.
Data availability statement
The raw data supporting the conclusions of this article will be made available by the authors, without undue reservation.
Author contributions
X-BP: Conceptualization, Funding acquisition, Writing–original draft. W-JR: Software, Writing–original draft. T-QL: Funding acquisition, Writing–review and editing. Y-YX: Data curation, Writing–original draft. X-ST: Supervision, Writing–review and editing. L-YX: Funding acquisition, Supervision, Writing–original draft.
Funding
The author(s) declare that financial support was received for the research, authorship, and/or publication of this article. This work was supported by Jiangsu Earthquake Administration Scenario Earthquake Construction and Application Innovation Team (Grant No. 2022-03) and the National Natural Science Foundation of China (Grant No. 52378345).
Conflict of interest
The authors declare that the research was conducted in the absence of any commercial or financial relationships that could be construed as a potential conflict of interest.
Publisher’s note
All claims expressed in this article are solely those of the authors and do not necessarily represent those of their affiliated organizations, or those of the publisher, the editors and the reviewers. Any product that may be evaluated in this article, or claim that may be made by its manufacturer, is not guaranteed or endorsed by the publisher.
References
Ansal, A., Tönük, G., and Sadegzadeh, S. (2024). Site response analysis in performance based approach. Soil. Dyn. Earthq. Eng. 178, 108480. doi:10.1016/j.soildyn.2024.108480
ASTM D4015-15 (2015). Standard test methods for modulus and damping of soils by the resonant-column method. West Conshohocken: ASTM International.
Biot, M. A. (1956). Theory of propagation of elastic waves in a fluid-saturated porous solid. II. Higher frequency range. J. Acoust. Soc. Am. 28 (2), 179–191. doi:10.1121/1.1908241
Cai, F., Hagiwara, T., Imamura, S., and Ugai, K. (2002). “2D Fully coupled liquefaction analysis of sand ground under tank,” in Proceedings of the 11th JEES, 819–824. doi:10.1093/treephys/22.12.819
Cavalieri, F., Correia, A. A., and Pinho, R. (2021). Variations between foundation-level recordings and free-field earthquake ground motions: numerical study at soft-soil sites. Soil. Dyn. Earthq. Eng. 141, 106511. doi:10.1016/j.soildyn.2020.106511
Chen, G. X., Xia, G. X., Wang, Y. Z., and Jing, D. D. (2022). One-dimensional nonlinear analysis of seismic response characteristics of the seabed in the Qiongzhou Strait. Eng. Mech. 39 (05), 75–85. doi:10.6052/j.issn.1000-4750.2021.03.0167
Chen, G. X., Zhan, J. Y., Liu, J. D., and Li, X. J. (2013). Parameter study on ground motion design of deep soft site under far-field large earthquake. Chin. J. Geotech 35 (9), 1591–1599. doi:10.16285/j.rsm.2013.11.019
Choi, Y., Nguyen, H. T., Han, T. H., Choi, Y., and Ahn, J. (2024). Sequence deep learning for seismic ground response modeling: 1D-CNN, LSTM, and transformer approach. Appl. Sci. 14 (15), 6658. doi:10.3390/app14156658
Forum 8 Co Ltd (2005). “Finite element fully coupled dynamic effective stress analysis program (UWLC),” in Electrical manual 2005. Product Info: dynamic effective stress analysis for ground(UWLC). forum8.co.jp).
Griffiths, S. C., Cox, B. R., and Rathje, E. M. (2016). Challenges associated with site response analyses for soft soils subjected to high-intensity input ground motions. Soil Dyn. Earthq. Eng. 85, 1–10. doi:10.1016/j.soildyn.2016.03.008
Groholski, D. R., Hashash, Y. M., Kim, B., Musgrove, M., Harmon, J., and Stewart, J. P. (2016). Simplified model for small-strain nonlinearity and strength in 1D seismic site response analysis. J. Geotech. Geoenviron 142. doi:10.1061/(ASCE)GT.1943-5606.0001496
Hardin, B. O., and Drnevich, V. P. (1972). Shear modulus and damping in soils: design equations and curves. J. Soil Mech. Found. 98, 667–692. doi:10.1061/JSFEAQ.0001760
Iino, H., Li, Y., and Wakai, A. (2024). A wide-area risk re-evaluation for seismic slope failures in 2008 Iwate-Miyagi Nairiku Earthquake. JGSSP 10 (31), 1194–1199. doi:10.3208/jgssp.v10.OS-20-07
Kaklamanos, J., Baise, L. G., Thompson, E. M., and Dorfmann, L. (2015). Comparison of 1D linear, equivalent-linear, and nonlinear site response models at six KiK-net validation sites. Soil. Dyn. Earthq. Eng. 69, 207–219. doi:10.1016/j.soildyn.2014.10.016
Kim, B., Hashash, Y. M., Stewart, J. P., Rathje, E. M., Harmon, J. A., Musgrove, M. I., et al. (2016). Relative differences between nonlinear and equivalent-linear 1-D site response analyses. Earthq. Spectra 32, 1845–1865. doi:10.1193/051215EQS068M
Pastor, M., Zienkiewicz, O. C., and Chan, A. (1990). Generalized plasticity and the modelling of soil behaviour. Int. J. Numer. Anal. Met. 14, 151–190. doi:10.1002/nag.1610140302
Phillips, C., and Hashash, Y. M. (2009). Damping formulation for nonlinear 1D site response analyses. Soil. Dyn. Earthq. Eng. 29, 1143–1158. doi:10.1016/j.soildyn.2009.01.004
Pires, J. A. (1996). Stochastic seismic response analysis of soft soil sites. Nucl. Eng. Des. 160, 363–377. doi:10.1016/0029-5493(95)01114-5
Qiao, F., Bo, J., Chang, C., Wang, L., and Shen, C. (2023). Comparative study of the seismic response characteristics of three special soils. Appl. Sci. 13 (20), 11375. doi:10.3390/app132011375
Shiuly, A. (2019). Performance of buildings using site specific ground motion of Kolkata, India. IJGEE 10 (1), 17–29. doi:10.4018/IJGEE.2019010102
Shiuly, A., Kumar, V., and Narayan, J. P. (2014). Computation of ground motion amplification in Kolkata megacity (India) using finite-difference method for seismic microzonation. Acta Geophys. 62, 425–450. doi:10.2478/s11600-013-0169-2
Shiuly, A., and Narayan, J. P. (2012). Deterministic seismic microzonation of Kolkata city. Nat. Hazards 60, 223–240. doi:10.1007/s11069-011-0004-5
Shiuly, A., Sahu, R. B., and Mandal, S. (2017). Site specific seismic hazard analysis and determination of response spectra of Kolkata for maximum considered earthquake. J. Geophys 14 (3), 466–477. doi:10.1088/1742-2140/aa5d3b
Silahtar, A. (2023). Evaluation of local soil conditions with 1D nonlinear site response analysis of Arifiye (Sakarya District), Turkey. Nat. Hazards 116 (1), 727–751. doi:10.1007/s11069-022-05695-z
Sun, Q., Dias, D., and e Sousa, L. R. (2019). Impact of an underlying soft soil layer on tunnel lining in seismic conditions. Tunn. Undergr. Sp. Tech. 90, 293–308. doi:10.1016/j.tust.2019.05.011
Tang, Y., Chen, Q., Zhao, Z., Hong, N., and Liu, Y. (2024). Shaking table model test for seismic response of soft soil site. IOP Conf. Ser. Earth Environ. Sci. 1334 (1), 012054. doi:10.1088/1755-1315/1334/1/012054
Villalobos, M. A., and Romanel, C. (2019). “Seismic response of a soft soil deposit using non-linear and simplified models,” in Earthquake geotechnical engineering for protection and development of environment and constructions (Boca Raton, Florida: CRC Press), 5547–5554.
Wakai, A., and Ugai, K. (2004). A simple constitutive model for the seismic analysis of slopes and its applications. Soils Found. 44, 83–97. doi:10.3208/sandf.44.4_83
Wakai, A., Ugai, K., Onoue, A., Kuroda, S., and Higuchi, K. (2010). Numerical modeling of an earthquake-induced landslide considering the strain-softening characteristics at the bedding plane. Soils Found. 50 (4), 533–545. doi:10.3208/sandf.50.533
Xiao, M., Cui, J., Li, Y. D., and Nguyen, V. Q. (2022). Nonlinear seismic response based on different site types: soft soil and rock strata. Adv. Civ. Eng. 2022 (1), 5370369. doi:10.1155/2022/5370369
Xu, L. Y., Cai, F., Wang, G. X., Ugai, K., Wakai, A., Yang, Q. Q., et al. (2013). Numerical assessment of liquefaction mitigation effects on residential houses: case histories of the 2007 Niigata Chuetsu-offshore earthquake. Soil Dyn. Earthq. Eng. 53, 196–209. doi:10.1016/j.soildyn.2013.07.008
Xu, L. Y., Chen, W. Y., Cai, F., Song, Z., Pan, J. M., and Chen, G. X. (2023a). Response of soil–pile–superstructure–quay wall system to lateral displacement under horizontal and vertical earthquake excitations. B Earthq. Eng. 21 (2), 1173–1202. doi:10.1007/s10518-022-01572-z
Xu, L. Y., Liu, L., Cai, F., Chen, W. Y., and Chen, G. X. (2023b). A practical framework for assessing the effect of cyclic softening of clays on the lateral response of single piles. Ocean. Eng. 288, 115933. doi:10.1016/j.oceaneng.2023.115933
Xu, L. Y., Song, C. X., Chen, W. Y., Cai, F., Li, Y. Y., and Chen, G. X. (2021). Liquefaction-induced settlement of the pile group under vertical and horizontal ground motions. Soil. Dyn. Earthq. Eng. 144, 106709. doi:10.1016/j.soildyn.2021.106709
Xu, L. Y., Wang, G. X., Cai, F., and Ugai, K. (2014). Fully coupled dynamic analysis of seismic response of liquefiable site. Earthq. Eng. Struct. Dyn. 34 (6), 136–144.
Xu, L. Y., Xi, J. P., Cai, F., Chen, W. Y., and Chen, G. X. (2024). Dynamic response of subsea tunnel in liquefiable layered seabed under combined earthquake and wave action. Ocean. Eng. 301, 117595. doi:10.1016/j.oceaneng.2024.117595
Xue, Y. Y., Wang, X. G., and Cai, F. (2023). Effect of inclined pile on seismic response of bridge abutments undergoing liquefaction—induced lateral displacement: case study of Nishikawa bridge in the 2011 Great East Japan earthquake. Front. Mater. 10. doi:10.3389/fmats.2023.1185210
Yee, E., Stewart, J. P., and Tokimatsu, K. (2013). Elastic and large-strain nonlinear seismic site response from analysis of vertical array recordings. J. Geotech. Geoenviron 139, 1789–1801. doi:10.1061/(ASCE)GT.1943-5606.0000900
Yniesta, S., Brandenberg, S. J., and Shafiee, A. (2017). ARCS: a one dimensional nonlinear soil model for ground response analysis. Soil. Dyn. Earthq. Eng. 102, 75–85. doi:10.1016/j.soildyn.2017.08.015
Zahoor, F., Satyam, N., and Rao, K. S. (2024). A comprehensive review of the nonlinear response of soil deposits and its implications in ground response analysis. Indian Geotech. 54 (3), 781–799. doi:10.1007/s40098-023-00798-1
Keywords: deep soft soil site, nonlinear cyclic constitutive model, model calibration, finite element analysis, resonant column test
Citation: Peng X-B, Ren W-J, Li T-Q, Xue Y-Y, Tao X-S and Xu L-Y (2024) Seismic response of deep soft soil sites with varying shear wave velocities. Front. Earth Sci. 12:1488519. doi: 10.3389/feart.2024.1488519
Received: 30 August 2024; Accepted: 18 September 2024;
Published: 01 October 2024.
Edited by:
Faming Huang, Nanchang University, ChinaReviewed by:
Liguo Jin, China Earthquake Administration, ChinaIshwer Datt Gupta, Central Water and Power Research Station, India
Amit Shiuly, Jadavpur University, India
Copyright © 2024 Peng, Ren, Li, Xue, Tao and Xu. This is an open-access article distributed under the terms of the Creative Commons Attribution License (CC BY). The use, distribution or reproduction in other forums is permitted, provided the original author(s) and the copyright owner(s) are credited and that the original publication in this journal is cited, in accordance with accepted academic practice. No use, distribution or reproduction is permitted which does not comply with these terms.
*Correspondence: Xiao-Bo Peng, eGlhb2JvX3BlbmdAMTYzLmNvbQ==; Tian-Qi Li, bGl0aWFucWlAamlhbmduYW4uZWR1LmNu; Ling-Yu Xu, eHVsaW5neXUyMDA4QDEyNi5jb20=