 Xiu Wang
 Guwang Liu
 Anjian Wang
 Chonghao Liu1,2
- 1Institute of Mineral Resources, Chinese Academy of Geological Sciences, Beijing, China
- 2Research Center for Strategy of Global Mineral Resources, Chinese Academy of Geological Science, Beijing, China
Copper, a crucial strategic mineral, is extensively utilized across various sectorsglobally. However, the drivers of copper resource consumption (CRC) vary by country, influenced by their developmental stages, population sizes, and industrial levels. This study employs the Logarithmic Mean Divisia Index (LMDI) model to analyze the CRC of eight representative countries from 1997 to 2022, revealing distinct trends between developed and developing nations. The result shows, developed countries exhibited a decreasing CRC trend, attributable primarily to the intensity effect, whereas developing countries experienced an increase, predominantly driven by economic growth. Additionally, the structural effect in developed countries acted as a constraint on CRC growth, contrasting with its initial promotional role in developing countries before it became a restraining factor. This study is essential for crafting effective strategic policies for copper resources and ensuring their sustainable global development.
1 Introduction
Copper is an important strategic mineral resource known for its good ductility, thermal conductivity, and electrical conductivity (Chodankar et al., 2020). As a crucial material foundation for socio-economic development, copper is widely used in various fields such as electronic information, new energy, national defense, and technological advancement (Sverdrup et al., 2014; Ouyang et al., 2021). The global distribution of copper resources is uneven. According to data from the United States Geological Survey, the global copper reserves will be 1 billion tons in 2023. Countries with abundant copper resources mainly include Chile (190 million tons), Peru (120 million tons), Australia (100 million tons), Russia (80 million tons), Mexico (53 million tons), and the United States (50 million tons). At present, copper has become the third most consumed industrial metal globally, following iron and aluminum (Zhang et al., 2024). As one of the important material foundations for economic development, there is a strong global demand for copper resources. However, as a non-renewable resource, how to achieve efficient use and sustainable development of global copper resources is a matter of concern. If the driving factors of CRC (copper resource consumption) in different countries can be identified, policy adjustments can be made to improve the efficiency of copper resource utilization. However, due to the differences in economic levels, population size, policy environment, and industrialization levels among different countries (Song et al., 2021), there are also differences in the amount of CRC and its driving factors. Even within the same country, the amount of CRC and the main driving factors may vary at different times. Therefore, it is extremely necessary to clarify the differences in the driving factors of CRC in countries at different stages of development. This study provides references for countries to formulate their own copper resource strategic policies to improve the global efficiency of copper resource utilization, which is of great significance for the sustainable development of global copper resources (Agnolucci et al., 2017).
Previous studies have focused their research on the driving factors of fossil fuel consumption (Kurniawan et al., 2020; Bu et al., 2020; Wang X. et al., 2022; Li et al., 2024) and the field of carbon emissions (Liao et al., 2019; Yang et al., 2020; Wang Y. et al., 2022; Zhao et al., 2023). Some studies have also addressed the driving factors of water resource consumption (Fan et al., 2019; Cai et al., 2022). However, there are relatively fewer studies focusing on the driving factors related to mineral resources. Some scholars have studied the driving forces of metal consumption globally or in a specific country, and found that economic effects, consumption intensity, scale effects, etc. are the main driving forces for promoting metal consumption (Song et al., 2019; Liu et al., 2020; Karakaya et al., 2021; Islam et al., 2024), while technological progress can inhibit metal consumption (Huang et al., 2020). However, this type of research has strong geographical limitations, mainly focusing on one country or the world, and using multiple metals as research objects, lacking comparative research on the consumption driving forces of a single metal mineral in different countries. Scholars have also conducted research on the relationship between mineral resource consumption in different regions and their respective economic development and environmental sustainability, their findings underscore the dual-edged sword of mineral-based industrialization, which, while spurring economic growth in these regions, also carries substantial environmental repercussions (Zhou et al., 2024). There are also some studies on the consumption factors of a specific mineral, but the relevant research focuses on predicting future demand based on historical trend research (Elshkaki et al., 2016; Guo and Cao, 2024). Overall, previous studies on the driving factors of mineral resource consumption covers a wide range of mineral resources, but lack research on the driving factors of specific mineral species.
In terms of research methods, the decomposition method is commonly used for studying driving factors, including the Index Decomposition Analysis (IDA) and Structural Decomposition Analysis (SDA), with the SDA using input-output tables as the data source (Wang et al., 2019; Wu et al., 2022). In comparison, the IDA method requires less data, as time series data can meet its requirements (Shao et al., 2016; Liu et al., 2022). The Logarithmic Mean Divisia Index (LMDI) model is a factor decomposition method developed from the Index Decomposition Analysis (IDA), which has the advantages of completely decomposable factors and no residual terms (Ma and Stern, 2008). It is currently widely used in the study on driving factors of fossil fuel consumption (Achour and Belloumi, 2016; Hasan and Liu, 2022; Chong et al., 2023), carbon emissions (Cansino et al., 2015; Yang et al., 2020; Zhang et al., 2022; Jain and Rankavat, 2023), and water resource consumption (Li et al., 2019; Ling et al., 2023), but less utilized on mineral resource consumption.
Review of previous studies suggests, that there is currently very little research on the differences in consumption driving factors of mineral resources, especially for a single mineral species. And the application of the LMDI model in driving factor-related research has been widely recognized. Although the LMDI model has a certain degree of simplification when dealing with the decomposition of complex multi-factor driving forces, the driving factors of CRC in this study are relatively specific, which can avoid the inherent limitations of the model. Therefore, This study selects the United States, France, Germany, Australia, Japan, Russia, India, and China, a total of eight countries, as the research subjects for CRC. The eight countries are the major copper resource-consuming countries in the world, and distributed in several economically developed continents around the world, and their CRC accounted for nearly 80% of the global total consumption in 2022. Moreover, these countries include both developed and developing countries, which aligns with the analytical dimensions of this study, which provides an important guarantee for comparing the driving factors of CRC between countries at different stages of development in this study. This study takes the CRC in eight typical countries worldwide as the research object, statistically analyzes the historical consumption characteristics of copper resources in each country from 1997 to 2022, and applies the LMDI model to analyze and study the differences in the driving factors of CRC in each country. Subsequently, it puts forward countermeasures and suggestions for the sustainable development of global copper resources.
The main innovations of this study is the use of the simplification advantage of the LMDI model in the decomposition of multiple driving forces to analyze the driving factors of CRC in typical countries, and to compare and analyze the decomposition results from the perspectives of developed and developing countries. This study aims to achieve two important purposes: (1) to clarify the historical trend of CRC in typical countries and the differences in the driving factors of CRC between developed and developing countries, and (2) to identify the core driving factors and propose targeted recommendations to provide a reference for the sustainable development of global copper resources.
The remainder of this study is organized as follows. Section 2 specifies the methodology model and the data sources used in the study. Section 3 discusses the empirical results. Finally, section 4 provides the summary conclusions and targeted policy recommendations.
2 Methodology and data sources
This study begins with a statistical analysis of the historical characteristics of CRC in eight typical global copper-consuming countries from 1997 to 2022. It then employs the LMDI model to analyze and study the differences in the driving factors of CRC for each country. Finally, it puts forward strategic recommendations for the sustainable development of global copper resources. The technical route is depicted in Figure 1.
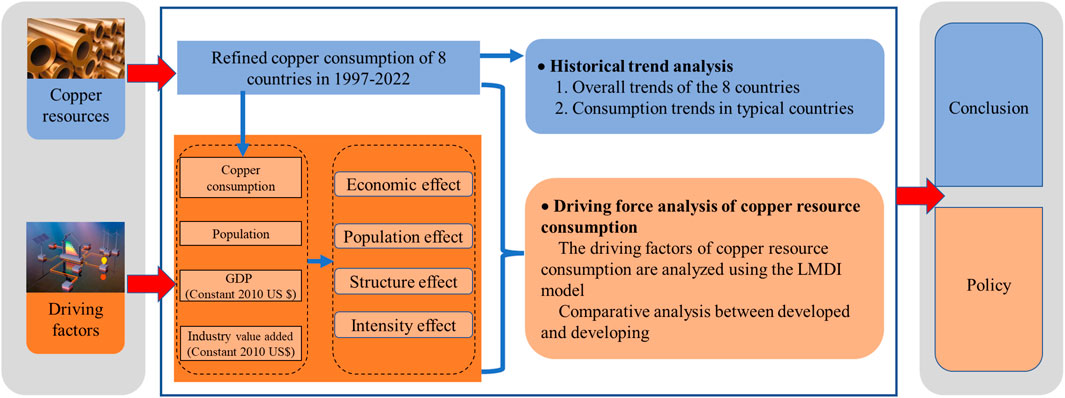
Figure 1. The flowchart of the methodology.
2.1 Methodology
The LMDI model is a factor decomposition method developed from the IDA, which analyzes driving factors using the logarithmic mean method (Yamaji et al., 1993; Zhang and Ang, 2001; Jiang et al., 2020). Based on the literature review, this study adopts the research path proposed by (Ang, 2005) and applies the LMDI model to decompose the driving factors of CRC in eight countries into four aspects: population effect, economic effect, structural effect, and intensity effect for study.
The general IDA characteristic equation is expressed as:
In the equation, the variable of interest X is decomposed into n factors (
The LMDI model comes in two forms: additive decomposition and multiplicative decomposition, with the additive form being more user-friendly and interpretable (Zhao et al., 2016). Therefore, this study employs the additive decomposition form, which leads to the following formula:
where
According to formula 1, copper resource consumption (CRC) can be broken down as follows:
where
According to the additive decomposition form of formula 2, CRC can be expressed as follows:
According to formula 3, each driving factor formula based on LMDI decomposition can be expressed as follows:
According to formulas 4–9, the contribution rate of each driving factor to the change of CRC in each country during 1997–2022 is
2.2 Data sources
The CRC data for the eight countries from 1997 to 2022 comes from the World Bureau of Metal Statistics. The CRC data involved in this study are all refined copper consumption data. Refined copper, as the largest consumer category of copper resources, has a clear correlation between its consumption and economic growth (Crowson, 2007), which ensures the credibility of the research results.
As a bulk metal, copper consumption is closely related to the country’s population, industrial development, and economic development. Therefore, based on the literature review and the availability of data, this study has selected four driving factors for CRC: population effect, economic effect, structural effect, and intensity effect. Table 1 provides a description of the four driving factors. The required population data, GDP data, and industrial value-added data for the research all come from the World Bank Open Data. Table A1 lists all the abbreviations used in this study.
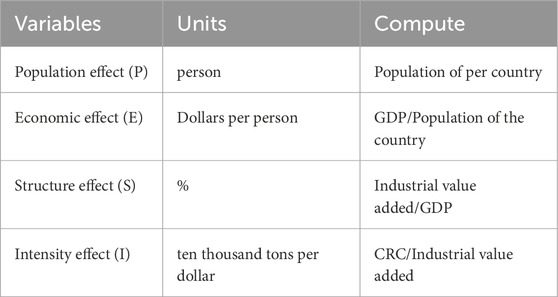
Table 1. Description of driving factors of the CRC.
3 Results and discussion
3.1 Copper resource consumption
From a global perspective of CRC, the total consumption of copper resources worldwide has generally shown a continuous increasing trend from 1997 to 2022. Similarly, the total consumption of copper resources by eight countries, which account for nearly 80% of the global total consumption, has also shown a trend of year-on-year growth (Figure 2). Among these, the total consumption of the eight countries showed a decline followed by a rapid increase in the years 2001, 2015, and 2021, while the global consumption of copper resources only experienced a slight decline in 2001 and 2019, with an upward trend in all other years (Figure 3). It is noteworthy that the decline in CRC by the eight countries and the global consumption in 2001 was significantly higher than in other years of decline, which may be a result of the economic downturn caused by the global financial crisis in 2000 (Yuan et al., 2010; Bekhet et al., 2016).
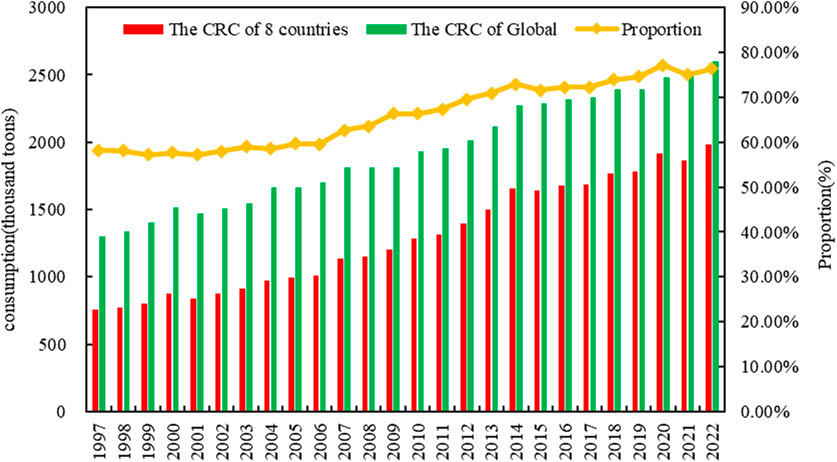
Figure 2. The CRC of global and 8 countries during 1997-2022.
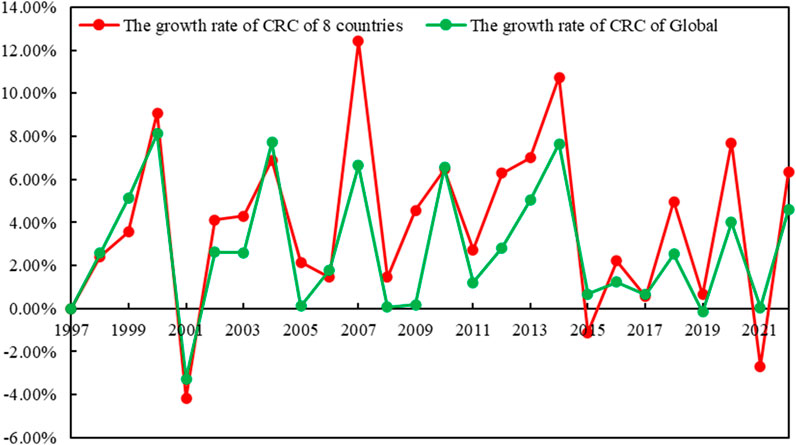
Figure 3. The growth rate of CRC of global and 8 countries during 1997-2022.
Table 2 and Figure 4 present the trends in CRC by the eight countries from 1997 to 2022. The overall trend of CRC in developed countries is gradually decreasing, but the extent of change is generally small. There are certain differences in CRC among different developed countries at various stages. The CRC of the United States, France, and Australia all reached their peaks around the year 2000, after which the CRC began to decline, stabilizing at a lower level around 2010. Although the overall consumption of copper resources in Germany and Japan from 1997 to 2022 showed a downward trend, the overall decline was not significant. The CRC in Russia also declined rapidly after reaching peak in 2008. Both China and India showed continuous upward trends in CRC from 1997 to 2022, with China’s increase (1,068.6%) being much higher than that of India (306.6%). The differences in the historical trends of CRC between developed and developing countries are mainly due to the fact that developed countries, after completing their own industrialization, have seen the demand for bulk metals reach a peak and then begin to decline, while developing countries, due to their incomplete industrialization, are still in a phase of continuous growth in demand for bulk metals such as copper (Dong et al., 2019). This study will provide further analysis and discussion on these consumption patterns in the following sections.
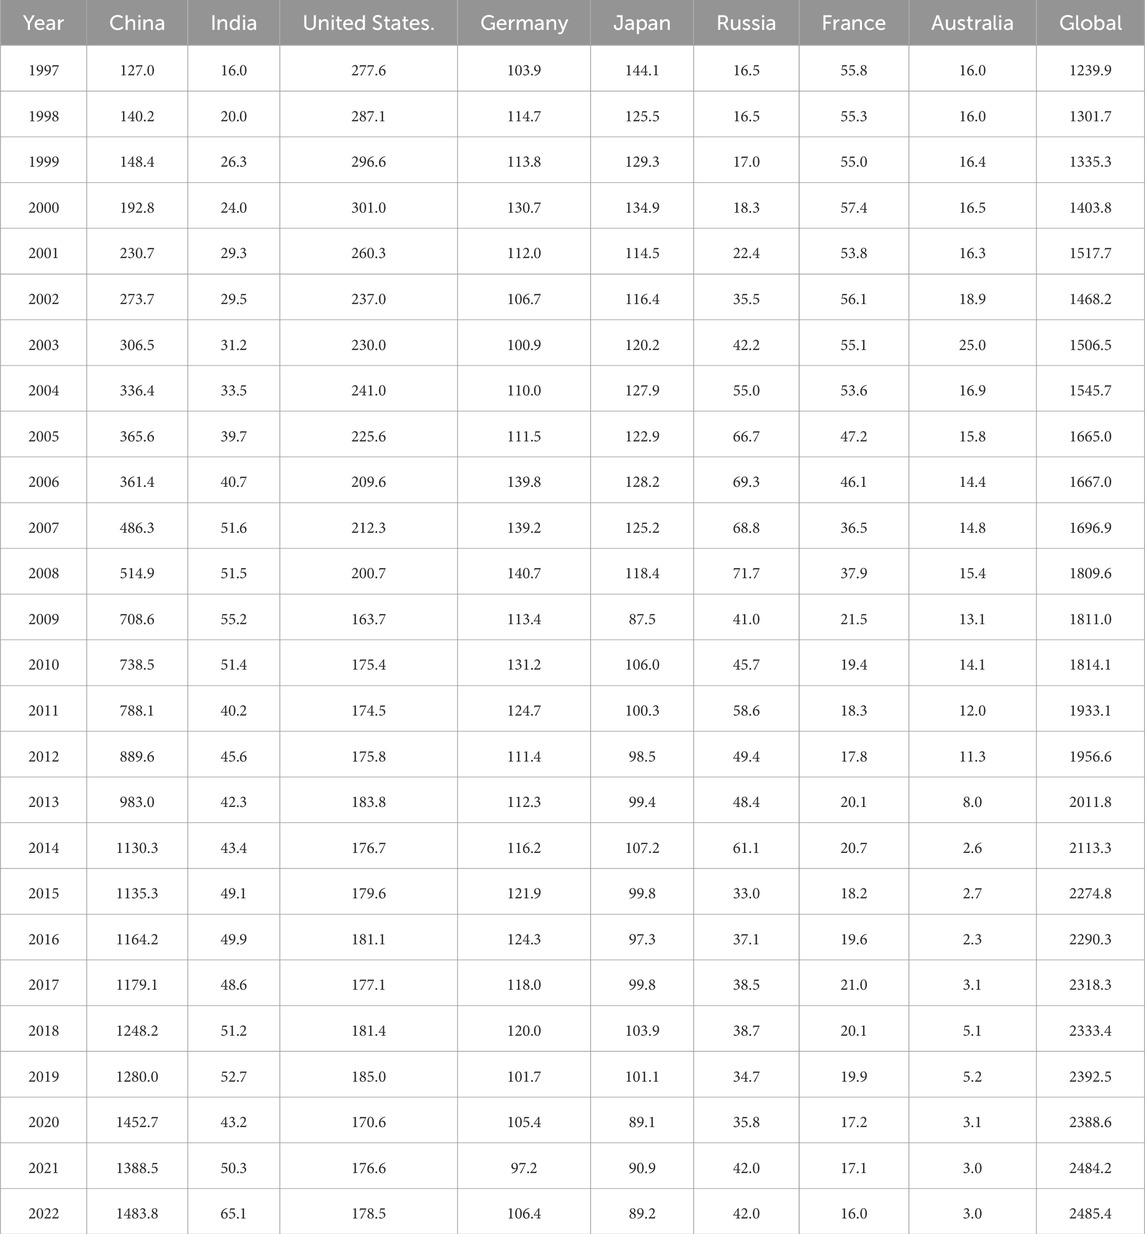
Table 2. The CRC of global and 8 countries during 1997–2022 (Unit: Thousand tonnes).
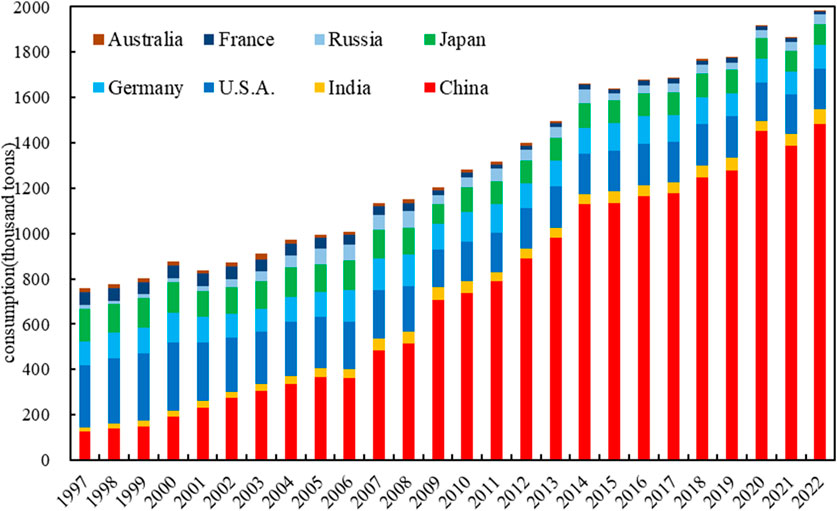
Figure 4. The trends of CRC in different countries during 1997-2022(unit: Thousand tonnes).
3.2 Driving factor analysis
According to the decomposition results of CRC drivers in 8 countries by LMDI model, there are obvious differences in CRC drivers in different countries at different stages. This study makes a comparative analysis of the driving factors of CRC in developed and developing countries.
3.2.1 Developed country
The intensity effect (I) has the largest contribution rate to the change in CRC in developed countries and is the main factor promoting the decline in CRC. As shown in Figure 5, in the years when CRC in developed countries decreased, the contribution rate of the intensity effect was generally the highest, which was most evident in France and Australia. For instance, during the three consecutive phases of declining CRC in France from 2003–2007, 2009–2012, and 2018–2022, the contribution rate of the intensity effect was basically maintained at around 65%, peaking at 91% in 2007. During the continuous decline in CRC in Australia from 2004–2006 and 2011–2014, the contribution rate of the intensity effect was maintained at around 75%, reaching a high of 92% in 2014. Similarly, during the continuous decline in CRC in the United States from 2001–2003, the contribution rate of the intensity effect was between 66% and 75%. The main reason the intensity effect promotes the decline in CRC in developed countries is due to the advanced copper production technology in developed countries, which reduces the amount of metal required per unit of output (Guzmán et al., 2005), while advanced manufacturing technology extends the service life of copper-related products (Despeisse and Ford, 2015). Additionally, the recycling of scrap copper further improves the efficiency of copper resource utilization (Wang et al., 2018; He and Small, 2022), leading to a decrease in demand for CRC (Bonnin et al., 2013). Unlike other developed countries, Russia’s intensity effect has facilitated an increase in CRC in most years. This is because Russia’s economic development, unlike that of other developed countries, mainly relies on heavy industry, and the output per unit of industrial added value has a higher demand for bulk metal resources such as copper (Plotnikov and Vertakova, 2014).
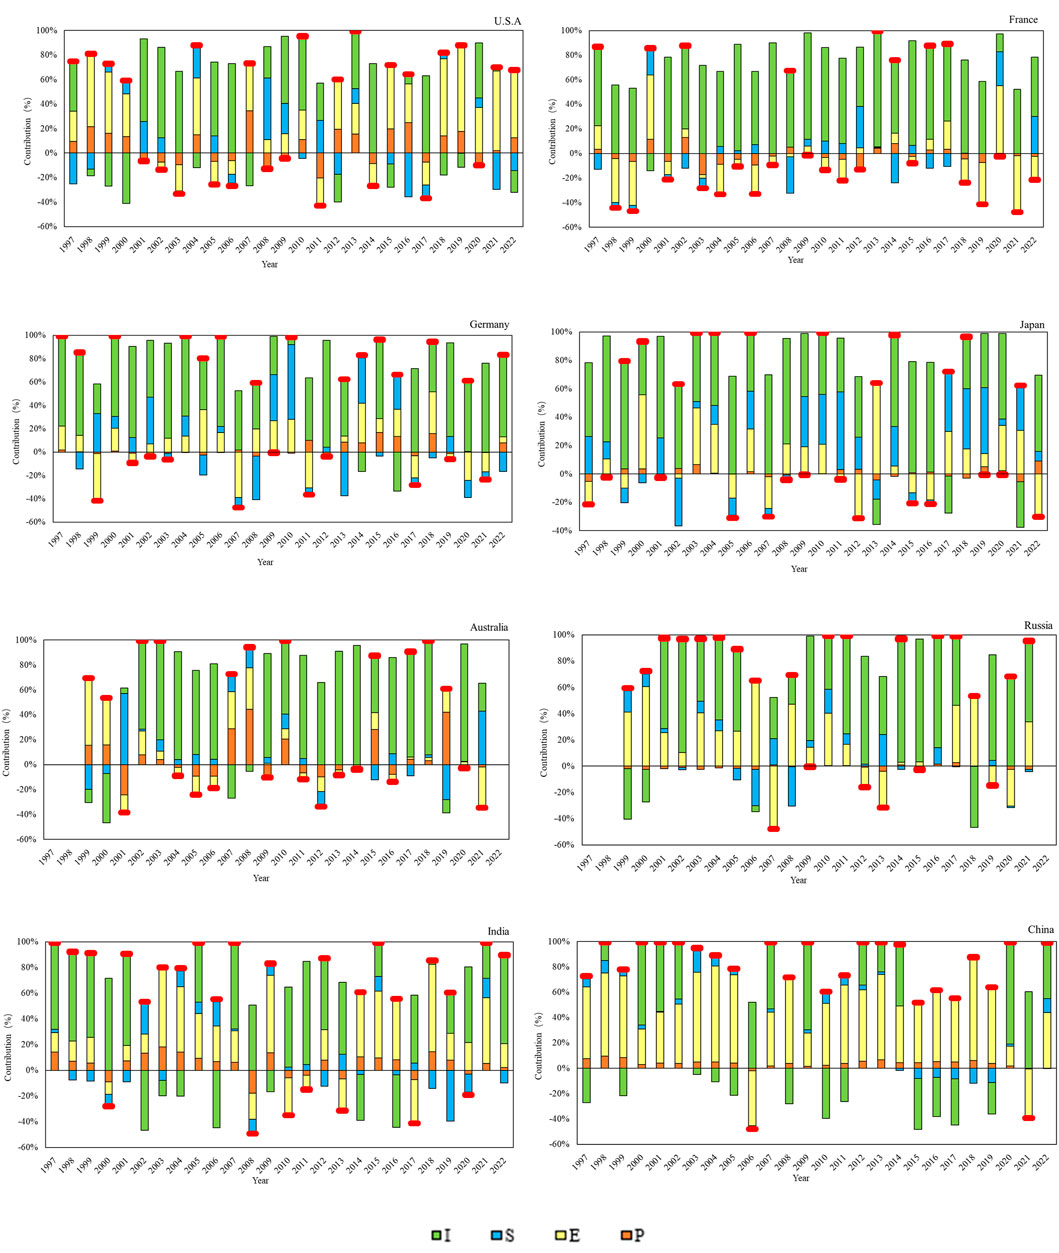
Figure 5. Decomposition of driving factors of the CRC in different countries during 1997-2022. Note: Red on the top indicates increased consumption and vice versa.
The economic effect (E) has a certain pulling effect on CRC in some developed countries. Among them, the economic effect on the CRC of the United States is the most evident. In the years when the United States’ CRC increased, the contribution rate of the economic effect was generally around 40%, peaking at 60% in 2010 (Figure 5). In addition to the United States, the economic effect also has a certain pulling effect on the CRC of Germany and Japan, but the pulling effect is not strong. The economic effect has no obvious pulling effect on the CRC of other developed countries. This is mainly because the economic development models of different developed countries vary, and the degree of dependence on industry in economic development is different (Koch and Schwarzbauer, 2021; Sokol et al., 2023). For example, industrial powerhouses such as the United States, Germany and Japan have relatively high demands for copper resources per capita economic growth, while the European developed countries with smaller populations and relatively lower dependence on industry in economic development have relatively lower demands for copper resources per capita economic growth. Therefore, the economic effect has a certain pulling effect on the CRC of developed countries with stronger industries.
The structural effect (S) has an inhibitory effect on the growth of CRC in developed countries. As shown in Figure 5, the structural effect is basically characterized by a positive contribution rate in years when CRC decreases and a negative contribution rate in years when it increases. Among them, the United States during the three phases of continuous increase in CRC from 1997–1998, 2015–2016, and 2021–2022, the structural effect was a negative contribution rate, being the main factor inhibiting the increase in CRC. During the phases of continuous decline in CRC from 2001–2002 and 2008–2009, the structural effect was a positive contribution rate, being the main factor in the decline of CRC. This phenomenon is also quite typical in countries such as Germany, Japan, France and Australia. This is mainly because, with the continuous improvement and development of industry and economy in developed countries, the demand for CRC per unit of industrial added value required by GDP is decreasing, due to the continuous advancement of technology and the diversification of economic development in developed countries (Simaee et al., 2024), which is an aspect that developing countries should pay attention to and strengthen.
The population effect (P) is not significant in developed countries’ CRC. The population generally has a promoting effect on the growth of CRC and an inhibitory effect on the reduction of consumption, but the contribution rate is not high. The impact of the population effect on the CRC of developed countries is significantly lower than that of the other three influencing factors.
3.2.2 Developing country
The economic effect (E) has a significant pulling effect on the CRC of developing countries. For both China and India, the economic effect has a positive contribution rate in the years when the CRC increased from 1997 to 2022, and a negative contribution rate in the years when it decreased, except for India in 2020, which was positive. The economic effect has a more pronounced pulling effect on China’s CRC growth than on India’s. The contribution rate of the economic effect to China’s CRC growth is generally around 50%, peaking at 81% in 2018, while for India, it is basically around 30%, peaking at 69% in 2018 (Figure 5). Due to the rapid economic development of developing countries, especially after entering the 21st century, the rapid increase in urbanization has led to a large number of infrastructure construction projects, and the improvement of per capita GDP has a high dependency on the demand for basic materials (Wang et al., 2021; Meka’a et al., 2024), especially for the demand for bulk metal mineral resources such as copper. Therefore, the economic effect has become the main driving force for the growth of CRC in developing countries during the research period.
The structural effect (S) has shifted from promoting to inhibiting the growth of CRC in developing countries. Although the structural effect has a limited contribution rate to the CRC of China and India, both around 15%, overall, during the research period, the structural effect has shifted from promoting to inhibiting the growth of CRC in both China and India. The turning point for China occurred in 2015, and for India in 2012. This is because, as typical developing countries, during the early stages of rapid economic development, the level of industrialization was relatively low, and there was still a significant gap in related technological levels compared to developed countries, belonging to an extensive development model (Zhou et al., 2024). Therefore, the demand for copper resources required for each unit of GDP corresponding to industrial added value was large, promoting the consumption of copper resources. With the continuous development of the industrialization process in developing countries, their technology and industrial technology have also been innovated and improved. As major manufacturing countries, China and India (Lautier, 2024) have also seen a corresponding increase in the utilization rate of copper resources. Therefore, the intensity effect has shifted from promoting to inhibiting the growth of CRC in developing countries.
The population effect (P) has a weak pulling effect on the growth of CRC in developing countries. The population effect has a pulling effect on the growth of CRC in both China and India, but the contribution rate is not high. For China, it is around 5%, peaking at 10% in 1998, and for India the pulling effect is slightly higher than that of China, with a contribution rate around 10%, peaking at 18% in 2004 (Figure 5). Although China and India are typical populous countries in the world, during the research period, the population structure of the two countries was still dominated by the agricultural population, which does not have a high demand for the consumption of mineral resources such as copper. Therefore, the large population has not become the main factor driving the consumption of copper resources (Irandoust, 2022). With the rapid economic development of the two countries and the gradual increase in the urbanization rate, more people will migrate to urban life (Gu et al., 2024), which will drive the increase in demand for the consumption of metal mineral resources (Christmann, 2018), and the contribution rate of the population effect to the growth of CRC will increase accordingly in the future.
The intensity effect (I) shows an alternating pattern of pulling and inhibiting effects on the growth of CRC in developing countries. The intensity effect has an alternating pattern of pulling and inhibiting effects on the growth of CRC in both China and India, but overall, the pulling effect is stronger than the inhibiting effect (Figure 5). For example, in the years when India’s CRC increased, the pulling contribution rate of the intensity effect is mostly around 60%, and for China mostly around 50%. The inhibiting contribution rate of the intensity effect on the growth of CRC in both China and India is around 30%, which is because that the two countries have not yet completed the industrialization process, and the current completion of each unit of industrial added value still heavily relies on the consumption of bulk metal mineral resources such as copper (Yang et al., 2023). However, the industrial technology of the two countries is also seeking continuous breakthroughs and technological progress (Yang et al., 2017), and technological progress is often a fluctuating process. With the phased progress of industrial technology, the amount of copper resources required to create each unit of industrial added value in China and India has also decreased. Therefore, in some years, the intensity effect has also appeared to inhibit the growth of CRC.
3.3 Discussion
The second industrial revolution in developed countries such as the United States began as early as the beginning of the 19th century and generally ended by the end of the 20th century (Wang et al., 2014). Therefore, the industrialization of developed countries has essentially been completed, coupled with advanced industrial technology and a sound secondary resource recycling and utilization system (Li et al., 2022), which has led to an increase in the utilization rate of copper resources in developed countries while the demand is also decreasing. This is also the reason why the intensity effect is the main driving force behind the decline in CRC in developed countries. Additionally, the diversification of economic development drivers in some developed countries has also reduced the proportion of the industrial economy (Mora and Olabisi, 2023; Simaee et al., 2024), which in turn has reduced the demand for copper resources in economic development. This is also the reason why the economic effect has a pulling effect on the CRC of some developed countries. Developing countries, on the other hand, are still in the late stages of industrialization during this phase, and their economic development still heavily relies on the consumption of raw materials (Lautier, 2024). Concurrently, these countries, exemplified by China, have achieved significant milestones in the realm of energy transformation. The swift expansion of clean energy sources, including new energy vehicles, photovoltaic systems, and wind power, has led to an increased demand for copper resources. This surge in demand has set the CRC on a steady incline in developing countries, underscoring the pivotal role of copper in fueling their sustainable energy ambitions and industrial growth. This leads to the result that the economic effect is the main driving factor for the growth of CRC in developing countries. At the same time, due to the lagging industrial technology and secondary recycling behind developed countries (Carcamo and Niebles, 2022; Shovon et al., 2024), the structural effect has an early promotional role on the growth of CRC in developing countries, and the intensity effect also has a promotional role in some years of CRC growth. However, as the industrialization process in developing countries continues to improve, with breakthroughs in related technologies and continuous optimization of the industrial structure (Haraguchi et al., 2019; Wang et al., 2023), the structural effect has shifted from promoting to inhibiting the growth of CRC in developing countries, and the intensity effect has also inhibited the growth of CRC in some years. Although the population of China and India far exceeds that of developed countries, the large proportion of agricultural population in developing countries means that the population effect is not an absolute factor in the growth of CRC in developing countries.
There are notable disparities in the driving factors of CRC among nations at varying stages of development. Copper is one of the essential raw materials for a country to complete industrialization. During the research period of this study, developed countries have generally completed industrialization, and their demand for copper resources is lower than that of developing countries that have not yet completed industrialization. However, due to differences in national conditions, there are also certain differences in the driving factors of CRC in different countries. As is well known, among developed countries, the United States has the largest manufacturing industry and a higher demand for copper resources than other developed countries. Due to its advanced technological level, the continuous improvement of copper resource utilization has led to a continuous decline in the copper resources required per unit of industrial added value. Therefore, the intensity effect is the main driving factor for the decline in CRC in the United States. European countries such as France and Germany place greater emphasis on efficiency and environmental protection in resource utilization. At the same time, their economic development is relatively less dependent on industry, and their per capita economic growth also has a relatively low demand for copper resources. Therefore, the intensity effect and economic effect are the main driving factors for the decline in their CRC. As an island nation with scarce resources, Japan heavily relies on imports for the utilization of copper resources. Therefore, frugality and high efficiency are its main pursuits, leading to a continuous decline in the demand for copper resources in its industrial added value. The main driving factors for the slight decrease in CRC are intensity effects and structural effects. As a major military and industrial power in the world, Russia has a huge consumption of copper resources. Coupled with the stimulation of military conflicts on its military production, the current and future intensity and structural effects will be the main driving factors for the increase in its CRC. Although China is a developing country, it is an important industrial power in the world. Its economic development requires a huge demand for various resources, and CRC plays an important role in the industrialization process. Therefore, economic and intensity effects are the main driving factors driving China’s CRC. Although India is a populous country, it is currently in the early stages of industrialization with low levels of relevant technology and belongs to an extensive development model. Therefore, economic effects are the main driving factor for the growth of CRC, and the intensity effect alternates between driving and restraining CRC with the phased improvement of its technological level. Clarifying the driving factors of CRC in countries at different stages of development is of great significance for relevant countries to reduce resource consumption, formulate copper resource policies, and achieve sustainable development of the industry.
3.4 Limitations
This study conducts an overall comparative analysis from the perspectives of developed and developing countries. Therefore, in the selection of driving factors, we have taken into account the commonalities among countries with different levels of development. As a result, some factors were not included in the discussion. For example, the environmental impact of copper mining was not considered. In China, copper resources are mainly concentrated in the Qinghai-Tibet Plateau region. However, the ecological environment of this area is extremely fragile, and national environmental protection policies impose strong constraints on mineral resource development. Overall, however, as an important bulk mineral, the environmental constraints on copper mining have relatively minor impacts on the consumption volume of copper resources.
Additionally, this study employs the LMDI model to conduct a decomposition analysis of CRC factors. The advantage of this model is its ability to handle complex multi-factor influences. However, the model also has its own limitations, namely, that it to some extent ignores the interactions between different factors, which is inevitable.
Furthermore, this study primarily focuses on the analysis of driving factors based on historical consumption data and does not involve quantitative predictions of future consumption trends. It can only qualitatively predict that developing countries, mainly China and India, will be the main growth points for global CRC in the future.
4 Conclusions and implications
4.1 Conclusions
This study presents an in-depth analysis of CRC across eight diverse countries from 1997 to 2022, using the LMDI model to evaluate the driving forces behind CRC from the vantage points of both developed and developing nations. The historical consumption trends reveal a noteworthy pattern: developed countries have experienced a declining trend in CRC over the past two and a half decades, whereas developing countries have experienced a contrasting upward trend. The intensity effect stands out as the predominant factor behind the reduced CRC in developed countries, whereas in developing countries, it waxes and wanes, sometimes fostering and at other times curbing CRC. The economic effect is identified as the key impetus behind the escalating CRC in developing countries, contrasted with a less pronounced influence in developed countries. The structural effect is observed to have played a role in containing the rise of CRC in developed countries, and it appears to be undergoing a transition from an accelerant to a decelerant in the context of developing countries. The population effect is noted to have a modest influence on pulling CRC upward in developing countries, whereas its role in developed countries is considered to be of little consequence.
4.2 Policy implications
For any country, maintaining economic growth while reducing resource consumption is an eternal pursuit and also a necessary condition for the sustainable development of global resources. Based on the research of the driving factors of CRC in global typical countries, this study puts forward the following suggestions for relevant countries to refer to when formulating their own policies related to the sustainable development of copper resources.
1) In the process of industrialization, developing countries should strive to improve the utilization rate of copper resources from the perspectives of policy guidance, corporate financial support, and the establishment of technology exchange platforms at the government level. At the same time, as the high-end technology industry and new energy markets in developing countries develop rapidly, especially the rapid development of China’s new energy vehicles, photovoltaic, and wind power industries, their demands for copper resources are bound to increase. Developing countries can take this opportunity to carry out technical breakthroughs in related fields, thereby improving the utilization rate of copper in high-end industries and new energy markets to reduce the use of copper resources. Moreover, they can learn from the secondary recycling technology of developed countries to enhance their own secondary resource recycling capabilities.
2) Developed countries also need to increase financial support to promote further technological innovation, which is very important for slowing down resource depletion and improving resource efficiency, Russia should pay special attention to this. Relevant studies have shown that improving resource efficiency not only helps economic growth but also can create job opportunities and is beneficial to the sustainable development of the national ecological environment (Chen et al., 2023; Xiong et al., 2023). In addition, developed countries should provide more help to developing countries, just like India, in terms of technology and capital to help them quickly reach the peak of CRC and provide technical and experiential assistance in the field of secondary recycling.
3) Both developed and developing countries can seek new green economic growth points to achieve a diversified economic development model for the country, thereby reducing the dependence on the consumption of copper resources and other non-renewable resources. In addition, a CRC tax can be introduced at the national level, and the utilization rate of copper resources by enterprises can be monitored. Enterprises that fall below a certain threshold need to pay corresponding taxes, which will be contributed to constrain some enterprises from wasting or over-consuming copper resources.
4) In addition to the above suggestions, specific recommendations for the eight countries selected in this study are as follows: The United States, France, and Germany should increase their science and technology investments, improve resource efficiency and recycling, and share their expertise with other countries. Australia, being rich in copper, should reduce mining and smelting losses, use copper more efficiently, and diversify its economy. Japan, with limited copper resources, should improve copper utilization and recycling and support its mining companies in global resource development. Russia should boost funding for tech innovation, especially for renewable energy, and enhance copper use efficiency in the new energy sector. India and China, as developing nations, should learn from developed countries to improve copper efficiency and recycling and innovate in tech to strengthen copper’s role in clean energy and sustainable development.
Data availability statement
The original contributions presented in the study are included in the article/supplementary material, further inquiries can be directed to the corresponding author.
Author contributions
XW: Writing – original draft, Writing – review and editing, Conceptualization, Data curation, Formal Analysis, Methodology, Software, Visualization. GL: Conceptualization, Methodology, Project administration, Resources, Writing – review and editing. AW: Funding acquisition, Project administration, Supervision, Validation, Writing – review and editing. CL: Project administration, Software, Visualization, Writing – review and editing. QL: Funding acquisition, Resources, Validation, Writing – review and editing.
Funding
The author(s) declare that financial support was received for the research and/or publication of this article. The authors express their sincere thanks for the support from the Basic Science Center Project for National Natural Science Foundation of China [Grant numbers 72088101, the Theory and Application of Resource and Environment Management in the Digital Economy Era].
Conflict of interest
The authors declare that the research was conducted in the absence of any commercial or financial relationships that could be construed as a potential conflict of interest.
Publisher’s note
All claims expressed in this article are solely those of the authors and do not necessarily represent those of their affiliated organizations, or those of the publisher, the editors and the reviewers. Any product that may be evaluated in this article, or claim that may be made by its manufacturer, is not guaranteed or endorsed by the publisher.
References
Achour, H., and Belloumi, M. (2016). Decomposing the influencing factors of energy consumption in Tunisian transportation sector using the LMDI method. Transp. Policy 52, 64–71. doi:10.1016/j.tranpol.2016.07.008
Agnolucci, P., Flachenecker, F., and Söderberg, M. (2017). The causal impact of economic growth on material use in Europe. J. Environ. Econ. Polic. 6 (4), 415–432. doi:10.1080/21606544.2017.1325780
Ang, B. W. (2005). The LMDI approach to decomposition analysis: a practical guide. Energy Policy 33 (7), 867–871. doi:10.1016/j.enpol.2003.10.010
Bekhet, H. A., Abdullah, T. A. R. T., and Yasmin, T. (2016). Measuring output multipliers of energy consumption and manufacturing sectors in Malaysia during the global financial crisis. Procedia Econ. Finance 35, 179–188. doi:10.1016/S2212-5671(16)00023-X
Bonnin, M., Azzaro-Pantel, C., Pibouleau, L., Domenech, S., and Villeneuve, J. (2013). Development and validation of a dynamic material flow analysis model for French copper cycle. Chem. Eng. Res. Des. 91 (8), 1390–1402. doi:10.1016/j.cherd.2013.03.016
Bu, Y., Wang, E. D., Bai, J. H., and Shi, Q. B. (2020). Spatial pattern and driving factors for interprovincial natural gasconsumption in China: based on SNA and LMDI. J. Clean. Prod. 263, 121392. doi:10.1016/j.jclepro.2020.121392
Cai, W. J., Jiang, X. H., Sun, H. T., He, J. Y., Deng, C., and Lei, Y. X. (2022). Temporal and spatial variation and driving factors of water consumption in the middle Heihe river basin before and after the implementation of the 97water diversion scheme. Agr Water manage. 269, 107727. doi:10.1016/j.agwat.2022.107727
Cansino, J. M., Sánchez-Braza, A., and Rodríguez-Arévalo, M. L. (2015). Driving forces of Spain׳s CO2 emissions: a LMDI decomposition approach. Renew. Sustain. Energy Rev. 48, 749–759. doi:10.1016/j.rser.2015.04.011
Carcamo, E. A. B., and Niebles, R. P. (2022). Opportunities and challenges for the waste management in emerging andfrontier countries through industrial symbiosis. J. Clean. Prod. 363, 132607. doi:10.1016/j.jclepro.2022.132607
Chen, T. Q., Zhang, Y., Jiang, C. L., and Li, H. (2023). How does energy efficiency affect employment? Evidence from Chinese cities. Energy 280, 128071. doi:10.1016/j.energy.2023.128071
Chodankar, N. R., Ji, S. H., Han, Y. K., and Kim, D. H. (2020). Dendritic nanostructured waste copper wires for high-energy alkaline battery. Nano-Micro Lett. 12, 1–12. doi:10.1007/s40820-019-0337-2
Chong, C. H., Zhou, X. Y., Zhang, Y. C., Ma, L. W., Bhutta, M. S., Li, Z., et al. (2023). LMDI decomposition of coal consumption in China based on the energyallocation diagram of coal flows: an update for 2005–2020 with improvedsectoral resolutions. Energy 285, 129266. doi:10.1016/j.energy.2023.129266
Christmann, P. (2018). Towards a more equitable use of mineral resources. Nat. Resour. Res. 27 (2), 159–177. doi:10.1007/s11053-017-9343-6
Crowson, P. (2007). The copper industry 1945-1975. Resour. Policy 32 (1), 1–18. doi:10.1016/j.resourpol.2007.03.004
Despeisse, M., and Ford, S. (2015). “The role of additive manufacturing in improving resource efficiency and sustainability,” in IFIP International Conference on Advances in Production Management Systems, 01 January 2015 (Cham: Springer).
Dong, D., Tukker, A., and Voet, E. V. D. (2019). Modeling copper demand in China up to 2050: a business-as-usual scenario based on dynamic stock and flow analysis. J. Ind. Ecol. 23 (6), 1363–1380. doi:10.1111/jiec.12926
Elshkaki, A., Graedel, T. E., Ciacci, L., and Reck, B. K. (2016). Copper demand, supply, and associated energy use to 2050. Glob. Environ. Change 39, 305–315. doi:10.1016/j.gloenvcha.2016.06.006
Fan, J. L., Wang, J. D., Zhang, X., Kong, L. S., and Song, Q. Y. (2019). Exploring the changes and driving forces of water footprints in China from 2002 to 2012: a perspective of final demand. Sci. Total Environ. 650, 1101–1111. doi:10.1016/j.scitotenv.2018.08.426
Gu, X. Y., Tang, X. Y., Chen, T., and Liu, X. T. (2024). Predicting the network shift of large urban agglomerations in China using the deep-learning gravity model: a perspective of population migration. Cities 145, 104680. doi:10.1016/j.cities.2023.104680
Guo, S. B., and Cao, F. G. (2024). Decomposition of factors affecting copper consumption in major countries in light of green economy and its trend characteristics. Resour. Policy 98, 105313. doi:10.1016/j.resourpol.2024.105313
Guzmán, J. I., Nishiyama, T., and Tilton, J. E. (2005). Trends in the intensity of copper use in Japan since 1960. Resour. Policy 30 (1), 21–27. doi:10.1016/j.resourpol.2004.09.006
Haraguchi, N., Martorano, B., and Sanfilippo, M. (2019). What factors drive successful industrialization? Evidence and implications for developing countries. Struct. Change Econ. D. 49, 266–276. doi:10.1016/j.strueco.2018.11.002
Hasan, M. M., and Liu, K. (2022). Decomposition analysis of natural gas consumption in Bangladesh using an LMDI approach. Energy Strateg. Rev. 40, 100724. doi:10.1016/j.esr.2021.100724
He, R., and Small, M. J. (2022). Forecast of the U.S. Copper demand: a framework based on scenario analysis and stock dynamics. Environ. Sci. Technol. 56 (4), 2709–2717. doi:10.1021/acs.est.1c05080
Huang, J. B., Chen, X., and Song, Y. (2020). What drives embodied metal consumption in China’s imports and exports. Resour. Policy 69, 101862. doi:10.1016/j.resourpol.2020.101862
Irandoust, M. (2022). Industrial growth versus agricultural growth in eight post-communist countries. Struct. Change Econ. D. 62, 529–537. doi:10.1016/j.strueco.2022.06.008
Islam, M. M., Sohag, K., and Mariev, O. (2024). Mineral import demand-driven solar energy generation in China: a threshold estimation using the counterfactual shock approach. Renew. Energ 221, 119764. doi:10.1016/j.renene.2023.119764
Jain, S., and Rankavat, S. (2023). Analysing driving factors of India’s transportation sector CO2emissions: based on LMDI decomposition method. Heliyon 9, e19871. doi:10.1016/j.heliyon.2023.e19871
Jiang, S., Zhu, Y., He, G., Wang, Q., and Lu, Y. (2020). Factors influencing China’s non-residential power consumption: estimation using the Kaya–LMDI methods. Energy 201, 117719. doi:10.1016/j.energy.2020.117719
Karakaya, E., Sarı, E., and Alataş, S. (2021). What drives material use in the EU? Evidence from club convergence and decomposition analysis on domestic material consumption and material footprint. Resour. Policy 70, 101904. doi:10.1016/j.resourpol.2020.101904
Koch, P., and Schwarzbauer, W. (2021). Yet another space: why the Industry Space adds value to the understanding of structural change and economic development. Struct. Change Econ. D. 59, 198–213. doi:10.1016/j.strueco.2021.08.019
Kurniawan, R., Trencher, G. P., Edianto, A. S., Setiawan, I. E., and Matsubae, K. (2020). Understanding the multi-faceted drivers of increasing coal consumption in Indonesia. Energies 13 (14), 3660. doi:10.3390/en13143660
Lautier, M. (2024). Manufacturing still matters for developing countries. Struct. Change Econ. D. 70, 168–177. doi:10.1016/j.strueco.2024.02.002
Li, J. H., Eheliyagoda, D., Geng, Y., Yang, Z. M., and Zeng, X. L. (2022). Examining the influence of copper recycling on prospective resource supply and carbon emission reduction. Fundam. Res. 5, 740–747. doi:10.1016/j.fmre.2022.09.022
Li, M. G., Liu, X. X., and Yang, M. (2024). Analyzing the regional inequality of renewable energy consumption and its driving factors: evidence from China. Renew. Energ 223, 120043. doi:10.1016/j.renene.2024.120043
Li, Y. J., Wang, S. G., and Chen, B. (2019). Driving force analysis of the consumption of water and energy in China basedon LMDI method. Energy Procedia 158, 4318–4322. doi:10.1016/j.egypro.2019.01.790
Liao, C. Y., Wang, S. G., Fang, J. K., Zheng, H. B., Liu, J. F., and Zhang, Y. Y. (2019). Driving forces of provincial-level CO2 emissions in China’s power sector based on LMDI method. Energy Procedia 158, 3859–3864. doi:10.1016/j.egypro.2019.01.860
Ling, M. H., Yang, Y. Q., Li, S., and Lv, C. M. (2023). Evolution and driving forces of water use structures in China. J. Clean. Prod. 427, 139263. doi:10.1016/j.jclepro.2023.139263
Liu, B. Y., Zheng, X. Z., Zhang, Q., Pan, X. Z., and McLellan, B. (2020). Drivers of global metal footprint during 1995–2013. J. Clean. Prod. 256, 120467. doi:10.1016/j.jclepro.2020.120467
Liu, Y. S., Yang, M., Cheng, F. Y., Tian, J. Z., Du, Z. Q., and Song, P. B. (2022). Analysis of regional differences and decomposition of carbonemissions in China based on generalized divisia index method. Energy 256, 124666. doi:10.1016/j.energy.2022.124666
Ma, C., and Stern, D. I. (2008). China's changing energy intensity trend: a decomposition analysis. Energ Econ. 30 (3), 1037–1053. doi:10.1016/j.eneco.2007.05.005
Meka’a, C. B., Fotso, S. R., and Kamdem, B. R. G. (2024). Investments in basic public infrastructure and their effects oneconomic growth in a developing country: the case of Cameroon. Heliyon 10, e26504. doi:10.1016/j.heliyon.2024.e26504
Mora, J., and Olabisi, M. (2023). Economic development and export diversification: the role of trade costs. Int. Econ. 173, 102–118. doi:10.1016/j.inteco.2022.11.002
Ouyang, X., Chen, J., and Du, K. (2021). Energy efficiency performance of the industrial sector: from the perspective of technological gap in different regions in China. Energy 214, 118865. doi:10.1016/j.energy.2020.118865
Plotnikov, V., and Vertakova, J. (2014). Manufacturing industry in Russia: problems, status, prospects. Int. Conf. Appl. Econ. 14, 499–506. doi:10.1016/s2212-5671(14)00739-4
Shao, S., Liu, J. H., Geng, Y., Miao, Z., and Yang, Y. C. (2016). Uncovering driving factors of carbon emissions from China’s mining sector. Appl. Energ 166 (15), 220–238. doi:10.1016/j.apenergy.2016.01.047
Shovon, S. M., Akash, F. A., Rahman, W., Rahman, M. A., Chakraborty, P., Hossain, H. M. Z., et al. (2024). Strategies of managing solid waste and energy recovery for adeveloping country – a review. Heliyon 10, e24736. doi:10.1016/j.heliyon.2024.e24736
Simaee, N., Ghazimoory, S., and Maleki, A. (2024). Identifying patterns of countries’ industrial diversification. Extr. Industries Soc. 17, 101372. doi:10.1016/j.exis.2023.101372
Sokol, A., Pangsy-kania, S., and Bieganska, J. (2023). Do cultural industries have an impact on sustainable development inEU countries? J. Clean. Prod. 428, 139400. doi:10.1016/j.jclepro.2023.139400
Song, Y., Cheng, J. H., Zhang, Y. J., Dai, T., and Huang, J. B. (2021). Direct and indirect effects of heterogeneous technical change on metal consumption intensity: evidence from G7 and BRICS countries. Resour. Policy 71, 101995. doi:10.1016/j.resourpol.2021.101995
Song, Y., Huang, J. B., Zhang, Y. J., and Wang, Z. P. (2019). Drivers of metal consumption in China: an input-output structuraldecomposition analysis. Resour. Policy 63, 101421. doi:10.1016/j.resourpol.2019.101421
Sverdrup, H. U., Ragnarsdottir, K. V., and Koca, D. (2014). On modelling the global copper mining rates, market supply, copper price and the end of copper reserves. Resour.Conserv. Recycl. 87, 158–174. doi:10.1016/j.resconrec.2014.03.007
Wang, A. J., Wang, G. S., Chen, Q. S., Yu, W., Yan, K., and Yang, H. (2014). S-Curve model of relationship between energy consumption and economic development. Nat. Resour. Res. 24 (1), 53–64. doi:10.1007/s11053-014-9234-z
Wang, C., Kim, Y. S., and Kim, C. Y. (2021). Causality between logistics infrastructure and economic development in China. Transp. Policy 100, 49–58. doi:10.1016/j.tranpol.2020.10.005
Wang, M. X., Liang, Y. N., Yuan, M., Cui, X. D., Yang, Y. Q., and Li, X. (2018). Dynamic analysis of copper consumption, in-use stocks and scrap generation in different sectors in the U.S. 1900–2016. Resour. Conserv. Recy 139, 140–149. doi:10.1016/j.resconrec.2018.07.022
Wang, Q., Song, X. X., and Liu, Y. (2019). China’s coal consumption in a globalizing world: insights from MultiRegional Input-Output and structural decomposition analysis. Sci. Total Environ. 711, 134790. doi:10.1016/j.scitotenv.2019.134790
Wang, S. H., Tian, W. Q., and Lu, B. B. (2023). Impact of capital investment and industrial structure optimization from theperspective of “resource curse”: evidence from developing countries. Resour. Policy 80, 103276. doi:10.1016/j.resourpol.2022.103276
Wang X., X., Fan, F. Y., Liu, C. H., Han, Y. W., Liu, Q. Y., and Wang, A. J. (2022). Regional differences and driving factors analysis of carbon emissions from power sector in China. Ecol. Indic. 142, 109297. doi:10.1016/j.ecolind.2022.109297
Wang Y., Y., Liu, Y. Z., Huang, L. Q., Zhang, Q. Y., Gao, W., Sun, Q., et al. (2022). Decomposition the driving force of regional electricity consumption in Japan from 2001 to 2015. Appl. Energ 308, 118365. doi:10.1016/j.apenergy.2021.118365
Wu, Y. M., Huang, H., Hong, J. K., Wang, X. Z., Wu, Y. D., and Wu, Y. B. (2022). Transfer patterns and driving factors of China’s energy use in trade:Evidence from multiregional input–output analysis and structuraldecomposition analysis. Energy Rep. 8, 10963–10975. doi:10.1016/j.egyr.2022.08.239
Xiong, W., Jiang, M. Z., Tashkhodjaev, M., and Pashayev, Z. (2023). Greening the economic recovery: natural resource market efficiency as a key driver. Resour. Policy 86, 104268. doi:10.1016/j.resourpol.2023.104268
Yamaji, K., Matsuhashi, R., Nagata, Y., and Kaya, Y. (1993). A study on economic measures for CO2 reduction in Japan. Energy Policy 21 (2), 123–132. doi:10.1016/0301-4215(93)90134-2
Yang, J., Cai, W., Ma, M. D., Li, L., Liu, C. H., Ma, X., et al. (2020). Driving forces of China’s CO2 emissions from energy consumption basedon Kaya-LMDI methods. Sci. Total Environ. 711, 134569. doi:10.1016/j.scitotenv.2019.134569
Yang, X. D., Liu, X., Ran, Q. Y., and Razzaq, A. (2023). How does natural resource dependence influence industrial greentransformation in China? Appraising underlying mechanisms forsustainable development at regional level. Resour. Policy 86, 104191. doi:10.1016/j.resourpol.2023.104191
Yang, Z. B., Shao, S., Yang, L. L., and Liu, J. H. (2017). Differentiated effects of diversified technological sources on energy-savingtechnological progress: empirical evidence from China's industrial sectors. Renew. Sustain. Energy Rev. 72, 1379–1388. doi:10.1016/j.rser.2016.11.072
Yuan, C. Q., Liu, S. F., and Xie, N. M. (2010). The impact on Chinese economic growth and energy consumption of the Global Financial Crisis: an input–output analysis. Energy 35, 1805–1812. doi:10.1016/j.energy.2009.12.035
Zhang, F. Q., and Ang, B. W. (2001). Methodological issues in cross-country/region decomposition of energy and environment indicators. Energ Econ. 23 (2), 179–190. doi:10.1016/S0140-9883(00)00069-4
Zhang, L., Wang, L., Wang, M. M., and Yuan, Z. W. (2024). Multilevel analysis of copper resource reallocation in the anthroposphere through international trade. Resour. Policy 88, 104434. doi:10.1016/j.resourpol.2023.104434
Zhang, W. S., Xu, Y., Wang, C., and Steeets, D. G. (2022). Assessment of the driving factors of CO2 mitigation costs of householdbiogas systems in China: a LMDI decomposition with cost analysismodel. Renew. Energ 181, 978–989. doi:10.1016/j.renene.2021.09.093
Zhao, Q. F., Gao, W. J., Su, Y., and Wang, T. (2023). Carbon emissions trajectory and driving force from the constructionindustry with a city-scale: a case study of Hangzhou, China. Sustain Cities Soc. 88, 104283. doi:10.1016/j.scs.2022.104283
Zhao, X. R., Zhang, X., and Shao, S. (2016). Decoupling CO2 emissions and industrial growth in China over 1993-2013: the role of investment. Energy Econ. 60, 275–292. doi:10.1016/j.eneco.2016.10.008
Zhou, Y. B., Liu, Y. Y., and Niu, J. J. (2024). Role of mineral-based industrialization in promoting economic growth:Implications for achieving environmental sustainability and social equity. Resour. Policy 88, 104396. doi:10.1016/j.resourpol.2023.104396
Appendix
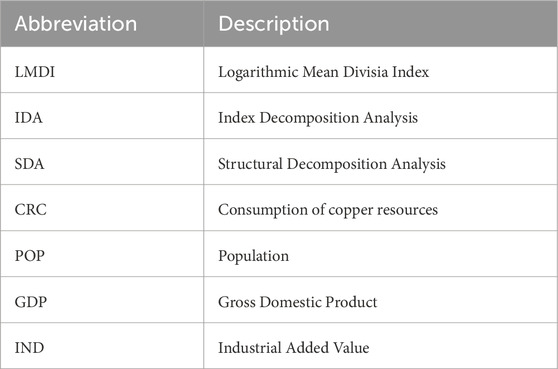
TABLE A1. The abbreviations in this study.
Keywords: copper resource, driving factor, LMDI model, developed, developing
Citation: Wang X, Liu G, Wang A, Liu C and Liu Q (2025) Driving force analysis of the consumption of copper resources in typical countries on LMDI method. Front. Earth Sci. 13:1436408. doi: 10.3389/feart.2025.1436408
Received: 23 May 2024; Accepted: 21 May 2025;
Published: 02 June 2025.
Edited by:
Guochang Wang, Saint Francis University, United StatesReviewed by:
Ellen B. Stechel, Arizona State University, United StatesYanjing Zhou, China Electronic Information Industry Development, China
Bo Chen, China Geological Survey, China
Zhaoshuai Pan, Beijing Institute of Technology, China
Guochang Xu, National Institute for Environmental Studies (NIES), Japan
Copyright © 2025 Wang, Liu, Wang, Liu and Liu. This is an open-access article distributed under the terms of the Creative Commons Attribution License (CC BY). The use, distribution or reproduction in other forums is permitted, provided the original author(s) and the copyright owner(s) are credited and that the original publication in this journal is cited, in accordance with accepted academic practice. No use, distribution or reproduction is permitted which does not comply with these terms.
*Correspondence: Guwang Liu, bGd3MTEwQDEyNi5jb20=