 Yunyin Mo
 Qiang Han2*
- 1Key Laboratory of South China Sea Meteorological Disaster Prevention and Mitigation of Hainan Province, Meteorological Disaster Prevention Technology Center of Hainan Province, Haikou, China
- 2Public Meteorological Service Center of CMA, National Early Warning Center, Beijing, China
The prompt, wide, and effective dissemination of warnings through early warning systems can allows more valuable time for disaster prevention and mitigation. However, due to the limited resources and channel bandwidth of early warning systems, the most urgent warnings may be delayed released when there are multiple pending warnings. To solve this problem, a prioritization algorithm for multi-hazard warning release is proposed. We identified several important attributes of warnings through the analysis of historical data and standardized them, resulting in six priority indicators for early warning issuance. By using entropy method to weight these indicators and combining them into a priority score, the priority of the warning is determined. We conducted retrospective tests on a list of pending warnings that occurred in Guangdong Province on 15 December 2023 and a list of pending warnings that occurred in Jiangxi Province on 23 March 2023. The results showed that this provides an effective method for managing queue systems. In the case of multiple warnings queued to be issued, it can provide an objective and quantitative queuing basis, avoiding biased conclusions drawn from artificial weighted calculation method or single attribute calculations. The algorithm is proved to be indicative when the abnormal warnings occur and improve the timeliness of emergency warning release. In a specific instance, there may be identical values for a certain attribute, resulting in the same score for the indicator determined based on that attribute, and consequently, that indicator does not play a role in the algorithm.we can omit that indicator from the formula to reduce computational load.
1 Introduction
In the context of global warming (Climate Change Center of China Meteorological Administration, 2023; IPCC, 2023a; WMO, 2023b), extreme weather events such as high temperatures, heatwaves, heavy rainfall, typhoons, and blizzards are on the rise (Shakoor et al., 2022; Huihui et al., 2023; Bubeck et al., 2019; Zhu et al., 2021), leading to increasingly severe disasters and impacts (WMO, 2023a; WMO, 2021; CRED, 2023). The prompt, wide, and effective issue of warnings to organizations and citizens in areas where disasters may occur through early warning systems (United Nations Office for Disaster Risk Reduction and World Meteorological Organization, 2023) plays significant role in adapting to climate change. The Secretary-General of the United Nations released the Early Warnings for All Executive Action Plan at the UNFCCC COP27 (United Nations Framework Convention on Climate Change Conference of the Parties 27th session) meeting, calling on the United Nations and over 150 relevant organizations worldwide to take action to provide early warning to everyone on Earth by the end of 2027 to combat increasingly extreme and dangerous weather (WMO, 2023; ESCAP, 2023a; IPCC, 2023b). The timely release of early warning not only allows more valuable time for disaster prevention and reduction but also is important in ensuring public safety and maintaining social stability (UNDRR, 2023a; Cao et al., 2021). The main dissemination channels include SMS (Short Message Service), radio, television, Twitter, display screens, websites, Weibo, WeChat, apps, Beidou, etc., (WMO, 2013; Yunyin et al., 2019).Using SMS to disseminate warnings will take much longer time if the audience size is large (Gao et al., 2012). For example, the SMS green channel in Jiangsu Province can send up to 8000 messages by second (Shi, 2012), ranking first in China. However, when the SMS green channel is launched, the target audience reached 4.7 million people in Jiangsu Province, and it will take at least 10 min to complete the transmission. To solve the priority problem of issuing one piece of warning to multiple affected areas, a refined emergency early warning releasing method based on crowd density by SMS was proposed (Cao and Liu, 2018). This method classifies the priority levels of each urban area according to crowd density, and then areas with higher crowd density will have priority access to warning messages. Liu et al. (2021) proposed a warning transmission method, which defines the areas covered by warnings as multiple disaster-bearing entities. Based on the secondary and derivative levels of the disaster, the degree of the disaster exposure for each entity will be estimated. Consequently, the disaster-bearing entities are in a priority order.To solve the problem of a single warning being disseminated to multiple recipients, Xiao (2013) established the hierarchy of the audience types and disaster areas, developing the priority order of the warning recipients based on the degree of disaster exposure and the hierarchy of the audience types.
The above studies have effectively explored the priority of warning release and achieved positive results. However, those studies draw attention to the priority of the audience when one piece of warning is released, instead of focusing on the priority order among multiple warnings. Currently, most early warning systems in China tend to adopt a method of “the first submitted warnings releasing first”, that is to say, the warnings release only depends on when they hit the system (Chen et al., 2019). The pending warning has to be in line if the previous warning release takes longer time, which may lead to the delay of urgent warning release, or even is resulted in significant economic losses and casualties in extreme cases. Additionally, some early warning systems use the severity of the warning as the priority when issuing warnings, but the problem is that the prioritization is typically applied when the event types of warning are the same. For warnings of different event types, they are often prioritized depending on the time they hit the system or relying on subjective human prioritization (Liu and Chen, 2016). When multiple warnings are ready to be issued, to determine their release priority, we should take warning attributes into consideration, such as the event type, the severity, the sent time, the effective time, the expiry time, and the sender (China Meteorological Administration, 2008; National Early Warning Information Release Center, 2015; State Council, 2024). For example, in the northwestern region of China, when an “extreme” warning for strong winds (the event type is strong winds and the severity is “extreme”) and a severe warning for heavy rain (the event type is heavy rain and the severity is “severe”) are issued at the same time. The severe warning of heavy rain might be priotritized even though the warning of strong winds has a higher severity level. The reason is the local government has years of experience preventing strong winds (Qian, 2009; Su et al., 2012), while heavy rain happens less frequently, a severe warning for heavy rain might sometimes reach the defense extreme (Han et al., 2019; Huang et al., 2019; Pan et al., 2021). However, there is no such an objective and quantitative ranking method to horizontal compare between multiple warnings considering the attributes of warnings comprehensively.
To address this problem, this paper proposes a multi-hazard warning release priority algorithm. Starts from the early warning, the algorithm standardizes the attributes of various dimensional of the warning based on historical data analysis, so that they can be compared in the same dimension. When there are multiple pending warnings to be released, this priority algorithm can provide an objective and quantitative basis for prioritization, ensuring that warnings with higher priority will be released first, thereby further enhancing the effectiveness of disaster prevention and mitigation efforts.
2 Data
An early warning message is composed of the following attributes: a unique identifier, sender, senderCode, sendTime, status, msgType, source, scope, restriction, addresses, code, secClassification, note, references, Language, category, eventType, responseType, urgency, severity, certainty, audience, eventCode, effective, onset, expires, senderName, headline, description, Instructions, area, resource, etc., (General Administration of Quality Supervision, 2018). The eventType denotes the type of the subject event of the warning message. The severity denotes the severity of the subject event of the warning message. The msgType denotes the natures of the warning message, which are Alert, Update, or Cancel. Alert represents initial information requiring attention by targeted recipients. Update represents that the earlier message identified in references get updated or are superseded. Cancel represents the cancellation of the earlier message identified in references (ITU, 2023). Update is further subdivided into Upgrade, Downgrade, and Continue. Upgrade indicates that the severity of the earlier message identified in references is increasing. Downgrade indicates that the severity of the earlier message identified in references is decreasing. Continue means that the severity of the earlier message identified in references has not changed (Shen et al., 2022; Baike Baidu, 2024).
The data used in this paper is sourced from the early warning system of the China Meteorological Administration, covering the entire year of 2023. To ensure data quality and algorithm accuracy, we have established strict data filtering standards. Specifically, Given the presence of testing warnings in the original dataset, which may interfere with the accuracy of algorithm results, data filtering rules were established to remove all testing warnings. On this basis, by performing uniqueness verification on the identifier field in the dataset and using data deduplication algorithm to further eliminate duplicate records, a warning dataset containing 676157 valid records was finally constructed.
Table 1 presents the distribution of warning messages in terms of severity and msgType released by the national meteorological departments in 2023. As can be seen from the table, the severity levels of warning messages are red, orange, yellow, and blue, and the number of warnings under each levels varies widely. The number of warnings at yellow level is the most, reaching 378,237, followed by warnings at blue. The red level warning has the lowest number of 10,648. In terms of msgTypes of warning release, there are Alert, Continue, Upgrade, Downgrade, and Cancel. The Alert has the highest number of releases, totaling 309,472, followed by Cancel, and the Upgrade has the least amount of warnings of 3,438.
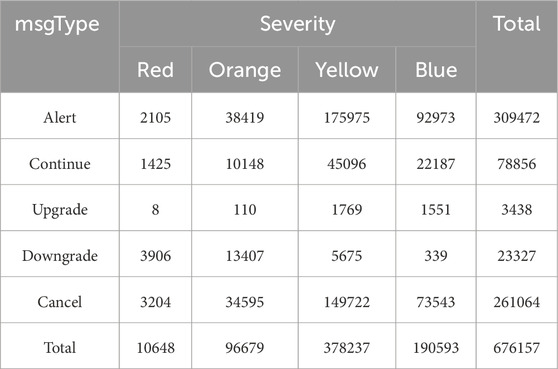
Table 1. Distribution of warnings in terms of severity and msgType in China in 2023.
Figure 1A shows the distribution of warning messages released at the national and provincial levels in 2023. There is a significant variation in the number of warnings issued by different provinces, and there is no linear pattern. Provinces like Yunnan, Hebei, Guizhou, Jiangxi, Fujian, Neimenggu, and Henan issue a large number of warnings, all exceeding 30,000. On the other hand, Tibet, Tianjin, Shanghai, Beijing, Ningxia, Chongqing, and Hainan issue fewer warnings, all falling short of 10,000.
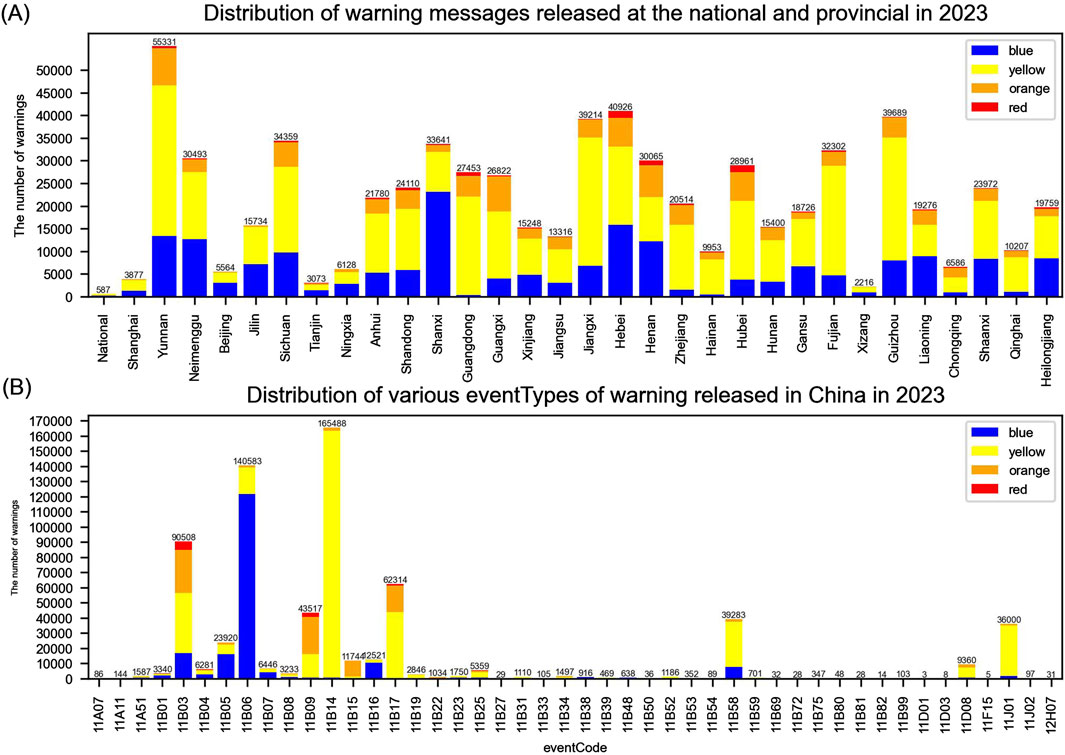
Figure 1. Distribution of warnings in terms of sender and eventType in China in 2023, categorized by color: blue, yellow, orange, and red.
The correspondence between eventType and eventCode (Henan Provincial Quality and Technical Supervision Bureau, 2011) is shown in Table 2. Figure 1B illustrates the distribution of various eventTypes released in China in 2023. As is demonstrated in the graph, there were 46 eventTypes issued in 2023. The data for each eventType shows a large disparity, some of which has a large number while others occurs quite a few, demonstrating an uneven distribution with significant differences. EventTypes such as landslide, agricultural disasters, mountain collapse were issued very rarely, the number of which is no more than 10. On the other hand, eventTypes like thunder, strong wind, heavy rain, fog, high temperature, thunderstorm with strong wind, icy road, cold wave, frost, hail were issued more frequently, all exceeding 10,000, and thunder and strong wind warnings both surpass 100,000.
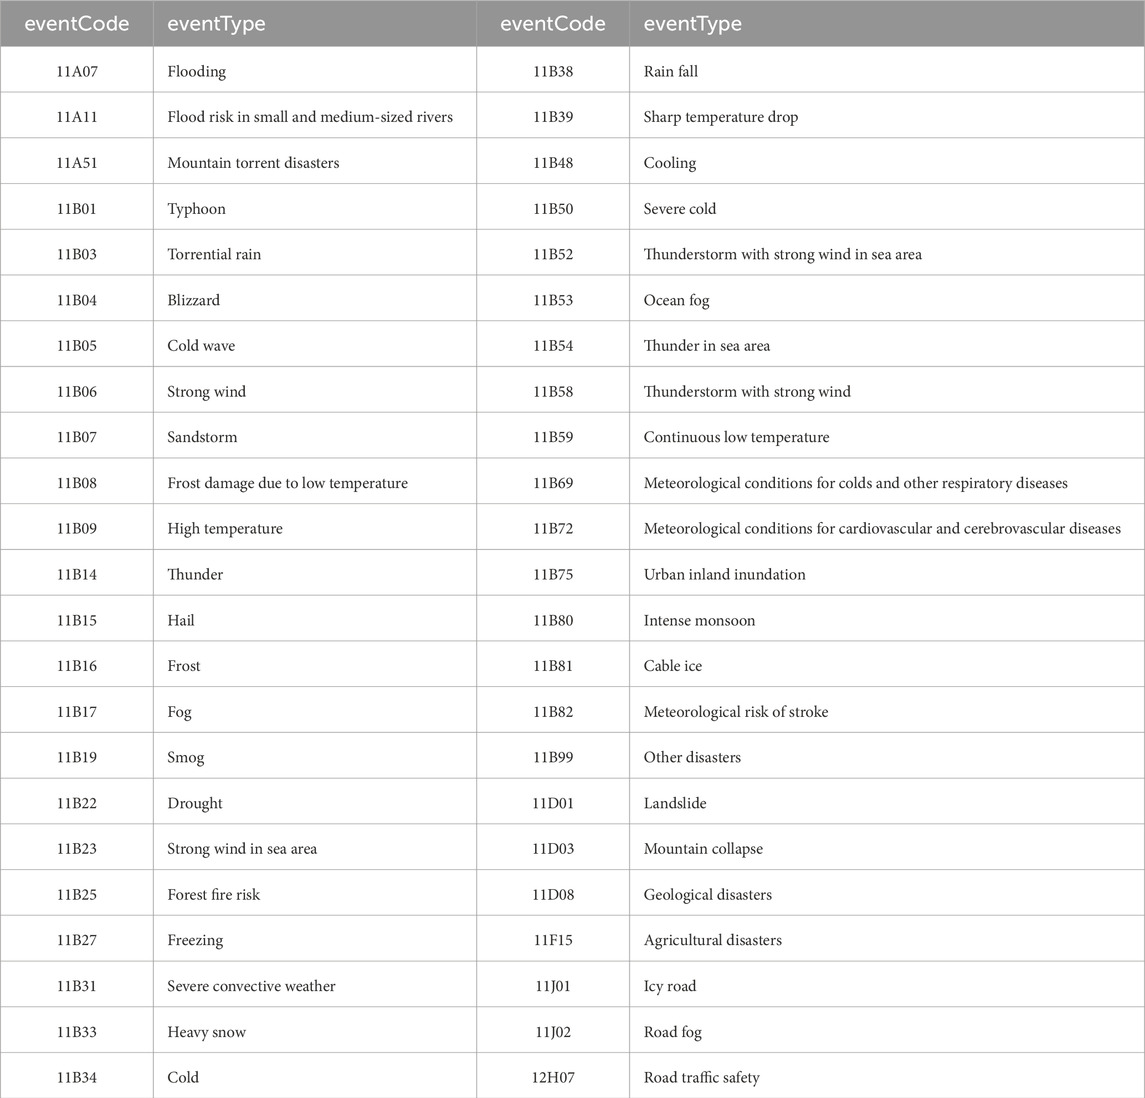
Table 2. The correspondence between eventType and eventCode.
3 Methods
The priority of warning dissemination is intrinsically linked to the attributes of the warning. To establish an objective and quantitative methodology for determining the priority of multi-hazard warning dissemination, a systematic analysis of the values of all attributes of early warnings issued in China was conducted. Our analysis demonstrates that not all warning attributes influence the transmission priority, and furthermore, not all attributes maintain comparative significance.
Specifically, certain attributes serve functional roles without impacting prioritization. The “identifier” attribute serves solely as a unique number or string assigned by the sender to identify a warning. The “Language” attribute indicates the language code of the warning. The “note” attribute provides an explanation for the cancellation of the warning, while the “references” attribute lists the identifiers of warnings referenced in the current warning. The “senderName” attribute identifies the issuer of the warning. However, none of these attributes influence the transmission priority of the warning.
A number of attributes, including “source,” “scope,” “restriction,” “addresses,” “code,” “secClassification,” “category,” “responsiveType,” “certificate,” “urgency,” “Instructions,” and “resource,” are not required during the warning issuance process. As a result, these attributes consistently exhibit NULL values in the warning dataset, rendering them irrelevant for comparative analysis.
Other attributes, while providing specific information, either duplicate or can be derived from other attributes. For instance, the “description” attribute contains textual descriptions of the event, offering an extended human-readable explanation of the hazard or triggering event. However, this information can also be inferred from other attributes. Similarly, the “headline” attribute serves as the warning title but provides redundant information that can be obtained from other attributes. The “area” attribute, which denotes the geographic region affected by the warning, can be derived from the “sender” attribute. Likewise, the “senderCode” attribute duplicates the function of the “sender” attribute, while the “eventCode” attribute replicates the function of the “eventType” attribute. Finally, the “status” attribute, which indicates whether the warning is actual or a test, loses comparative significance since all values for this attribute are ‘actual.'
Through a systematic evaluation of these attributes, we identified the core attributes that are critical for determining warning propagation priority. These key attributes include “sender,” “SendTime,” “msgType,” “eventType,” “severity,” “effective,” “onset,” and “expires.” These attributes provide essential information for prioritization and represent the fundamental characteristics necessary for objective comparison in multi-hazard warning dissemination scenarios.
By removing the dimensions of the comparable attributes in the warning and standardizing and normalizing each attribute differently based on historical data analysis, we determine the priority indicators for the release of warnings. The weights of each indicator are determined through the entropy method (Xiong et al., 2013). In the case of multiple pending warnings, based on the Multi-Criteria Decision Analysis (MCDA) evaluation method (Xie et al., 2020), a weighted calculation of the warning priority indicators is conducted to obtain the comprehensive score of each warning. Finally, the release priority of each warning is determined according to the comprehensive score, ensuring that high-priority warnings are sent out automatically first. The specific priority algorithm for multi-hazard warning dissemination is as follows:
L(X) represents the priority of warning X in the multi-hazard warning release queue; n represents the number of the pending warnings. L(X) is composed of various warning priority indicators and adjusted weight coefficients. The smaller the value of L(X), the higher the priority.
3.1 MCDA evaluation method
MCDA evaluation method is a decision support technology that comprehensively considers multiple attributes. By systematically evaluating and comparing the performance of different attributes, it helps decision makers make the best choice in complex decision-making situations. MCDA evaluation method has been widely used in various fields, such as engineering, environmental management, urban planning, economic evaluation and so on (Qiao et al., 2023; Dai et al., 2022; Zhang, 2009).
MCDA evaluation method first defines the decision objectives and identifies all relevant attributes that affect the decision. Next, quantifiable indicators are defined for each attribute. Then, the weight of each standard is determined through expert scoring, questionnaire or consistency discussion to reflect its relative importance. In the scoring stage, each indicator of each option is scored, which can be quantitative or qualitative. Finally, using the calculation formula (such as the weighted summation formula), the score of each indicator is multiplied by its weight and summed to obtain the comprehensive score of each option. According to the comprehensive score, the options are sorted, and the option with the highest score is selected as the optimal decision.
The specific calculation formula of MCDA varies with different methods and application scenarios, but a basic weighted summation formula can be summarized as follows:
S is the comprehensive score of an option, n is the number of indicators, Wi is the weight of the ith indicator, and Si is the score of the ith indicator of an option.
3.2 Early warning priority indicators
L(X) includes six early warning priority indicators, which are: P(X) represents the msgType indicator; E(X) represents the eventType indicator; Ta(X) is the indicator for the lead time of warning, which refers to the interval between the sent time and the expected occurrence time; Tc(X) is the indicator for the duration of warning, which refers to the interval between the expected occurrence time and the expected expiration time; S(X) represents the sender indicator; G(X) represents the severity indicator. The definitions of each warning priority indicator are as follows:
3.2.1 Indicator P(X)
According to historical experience, when issuing a Cancel warning, the impact of the disaster has already been resolved. Therefore, when there are Cancel warnings in the pending release list, their priority should be set to the lowest. When publishing an Alert or Upgrade warning, it indicates that the disaster may have impact or the impact may be escalated, and it is necessary to release the warning to the public as soon as possible. Therefore, their priority should be higher than others. For Continue or Downgrade warnings, although the disaster continues, the warning has already been released earlier and people are well acknowledged, so that the urgency of the release is not as high as that of the Alert or Upgrade. Therefore, their priority should be higher than that of the Cancel but lower than that of the Alert or Upgrade. Therefore, the indicator P(X) is set, as shown in Formula 3, with the smaller the value, the higher the priority. The indicator P(X) ensures that the Alert or Upgrade warnings are released first, followed by the Continue or Downgrade warnings, and finally the Cancel warnings.
3.2.2 Indicator E(X)
According to historical data, various eventTypes of warnings within a certain temporal and spatial range show significant differences in terms of statistics, some of which have very small values, while others are very large. Figure 2 illustrates the distribution of eventTypes by region in china in 2023. The figure shows that the distribution of eventTypes across regions is uneven and the differences are substantial. There is a wide variation in the eventTypes and number of warnings issued by different regions. In Guangdong Province, eventTypes such as heavy rain and thunderstorm with strong wind are issued more frequently, while eventTypes like icy road, mountain collapse, and strong monsoon are issued very rarely. In Jiangxi Province, thunder warnings are issued more often, while flood risk in small and medium-sized rivers, blizzard, forest fire risk, and agricultural disasters are issued very infrequently. Hebei Province sees a higher frequency of strong wind and thunder warnings, with forest fire risk and icy road being rarely issued. Heilongjiang Province issues strong wind, icy road and thunderstorm with strong wind more frequently. Yunnan Province has a higher occurrence of thunder, strong wind, heavy rain and geological disasters, with flood risk in small and medium-sized rivers and frost damage due to low temperature being less common. Shanxi Province issues strong wind, thunderstorm with strong wind, icy road, fog, and heavy rain more often, while eventTypes like freezing and frost damage due to low temperature are issued very rarely.
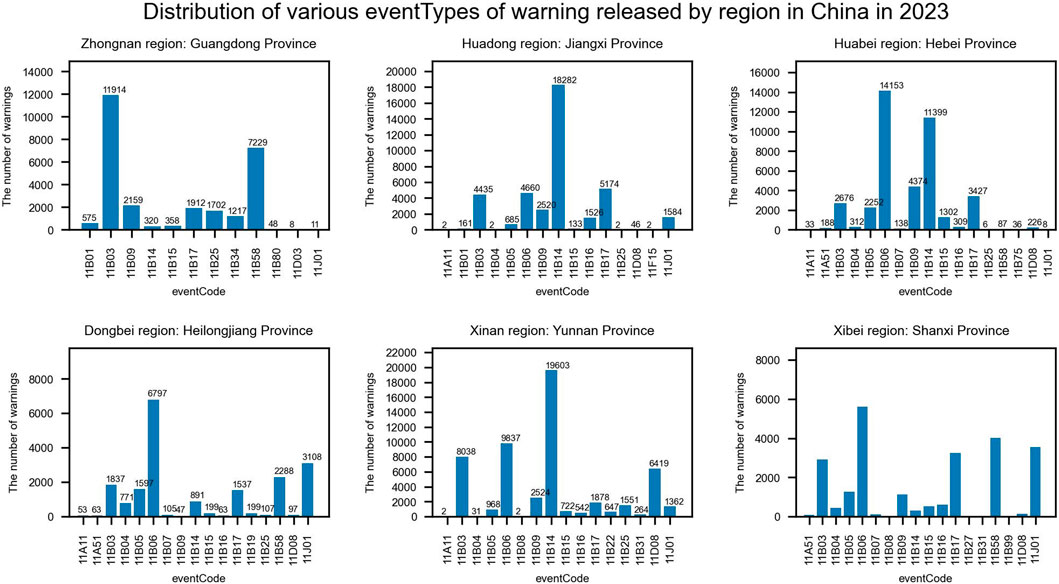
Figure 2. Distribution of various eventTypes of warning released by region in China in 2023.
Based on historical experience, for common eventTypes, the prevention measures are in place due to rich experiences, and the losses caused by the events are correspondingly reduced. Therefore, the release priority for these eventTypes should be lower than that for eventTypes that have never appeared or rarely appeared. Therefore, the indicator E′(X) is set as shown in Formula 4. E′(X) represents the proportion of warnings of the eventType X in the total number of warnings. The smaller the value of E′(X), the higher the priority.
Xe represents the event type of warning X; NUMe(Xe) represents the number of warnings of the same event type as warning X within the statistical range; Xi represents warning i, SUMe(Xi) represents the total number of all warnings within the statistical range.
To avoid abnormal impacts on the calculation results due to extremely large or small values, the logarithmic function is used for standardization processing.
If a eventType that has never appeared in a certain region, compared to Formula 4, the result value calculated through Formula 5 will sharply decrease, which can provide a good indication for abnormal eventTypes.
3.2.3 Indicator Ta(X)
According to the time effect requirements of early warning, the smaller the lead time of warning, the higher the priority for releasing. Therefore, setting the indicator Ta(x), as shown in Formula 8, the smaller the value of Ta(x), the higher the priority. The statistical analysis of warning data for 2023 shows that the lead time of warning for specific eventTypes within a certain temporal and spatial range has a normal distribution characteristic. The mean-zero normalization method can be used to process the warning data, ensuring that the processed data still conforms to the normal distribution with μ = 0 and σ = 1.99.7% of the processed data is distributed between [−3,3], and data outside this range is considered to have a lead time of 3 or −3. When the lead time of warning is less than the average, that is, when the lead time of warning is negative, the priority significantly increases. In other words, the shorter the lead time of warning, the higher the priority of releasing, which satisfies the requirements for the time effect of warnings.
Xta represents the lead time of warning X; Xtai represents the lead time of the i-th warning within the statistical range; u (Xta) represents the average lead time of warnings of the same eventType as warning X within the statistical range; σ(Xta) represents the standard deviation of the lead time of warnings of the same eventType as warning X within the statistical range; m represents the number of warnings of the same eventType as warning X within the statistical range, excluding the Cancel msgType.
Warnings with the Cancel msgType do not have the lead warning time. When the msgType of warning X is Cancel, Ta(X) is set to 1.
3.2.4 Indicator Tc(X)
From the perspective of the audience’s attention time effect, the more severe the warning, the shorter the duration of the warning, which requires more attention. As a result, it has a higher spreading effect. In this case, the indicator Tc(X) is set, as shown in Formula 9, with the smaller the value of Tc(X), the higher the priority.
Based on the statistical analysis of the warning data in 2023, the results indicate that the duration values for specific eventTypes within a certain temporal and spatial range are relatively concentrated, with most of which are within 24 h. In response to this situation, a deviation standardization method is used to process the data. The values that go beyond 24 h will be treated specifically, which will be set to 1, and the values of warning duration will be kept within the range [0, 1].
Xtc represents the duration of warning X; Xtci represents the duration of the i-th warning within the statistical range; m represents the number of warnings of the same eventType as warning X within the statistical range, excluding the Cancel msgType.
Warnings of the Cancel msgType do not have warning duration. When the msgType of warning X is Cancel, Tc(X) is set to 1.
3.2.5 Indicator S(X)
According to historical experience, the priority of releasing warnings of the same eventType and severity usually decreases from national to provincial, from provincial to municipal, and from municipal to county in sequence. This is because national-level warnings typically have a broader impact range and affect a larger population than provincial-level warnings, and provincial warnings have larger impact than municipal-level warnings, and so on down to the county-level.
Figure 3 shows the release of warnings by provincial-level and municipal-level senders in Hainan Province in 2023, while Figure 4 shows the release of warnings by provincial-level, municipal-level, and county-level senders in Guangdong Province in 2023. According to the statistical analysis results, whether in provinces like Hainan, which have two levels of senders, or in provinces like Guangdong, which have three levels of senders, the numbers of warnings released by the same level of senders is mostly at the same magnitude. The number of warnings released by different levels of senders is varies widely. The warnings released at national-level are fewer than those at provincial-level and lower levels, and provincial-level warnings are fewer than those at the municipal-level and lower levels, and municipal-level warnings are fewer than those at county-level. Moreover, there is no linear pattern. Therefore, the indicator S′(X) is set, as shown in Formula 10. S′(X) represents the proportion of the number of warnings released by the sender of warning X to the total number of warnings released by the sender of warning X and by its subordinate senders within the statistical range. The smaller the value of S′(X), the higher the priority. This aligns with the rule that the priority of releasing warnings decreases sequentially from national-level to provincial-level, from provincial-level to municipal-level, and from municipal-level to county-level.
Xs represents the sender of warning X; NUMs (Xs) represents the total number of warnings released by Xs within the statistical range; Xi represents the i-th subordinate sender of Xs; SUMs (Xi) represents the total number of warnings released by all subordinate senders of Xs within the statistical range.
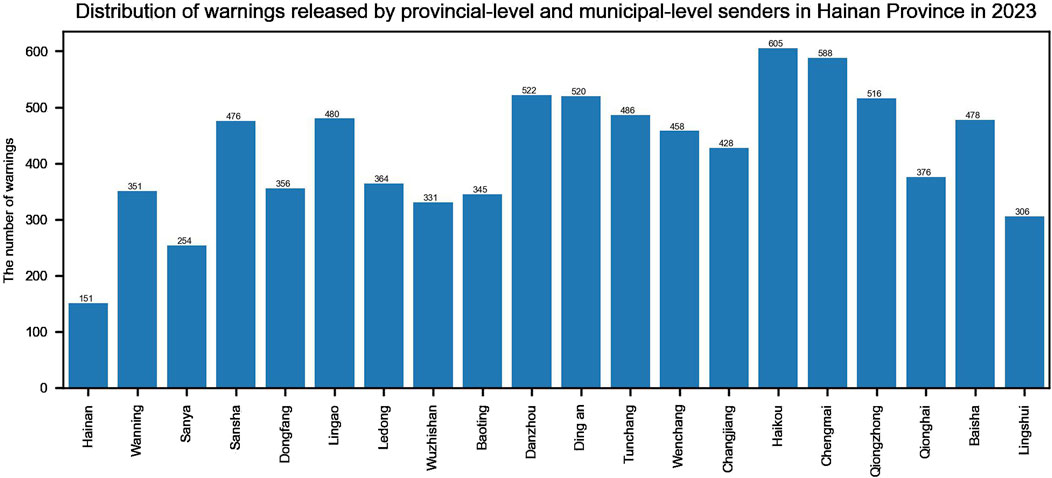
Figure 3. Distribution of warnings released by provincial-level and municipal-level senders in Hainan Province in 2023.
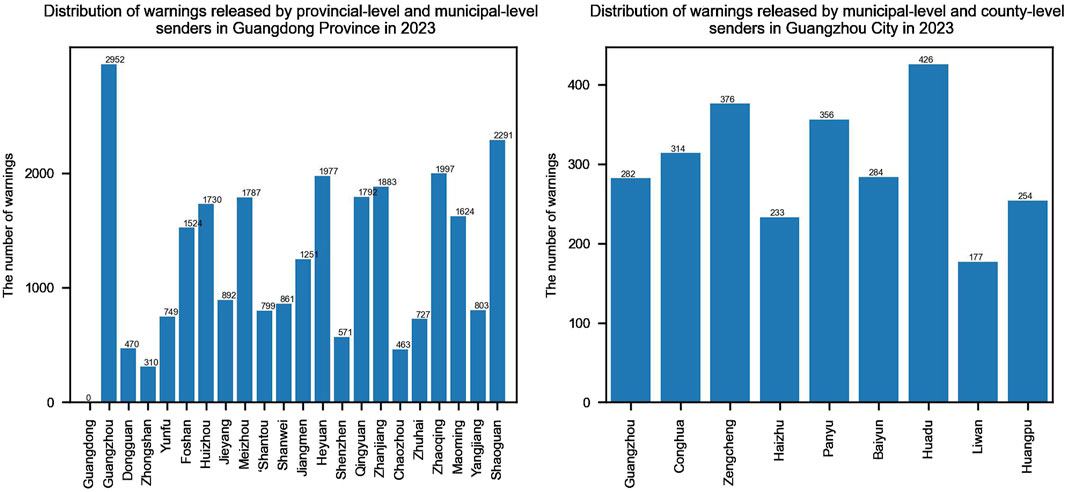
Figure 4. Distribution of warnings released by provincial-level,municipal-level and county-level senders in Guangdong Province in 2023.
To avoid abnormal impacts on the calculation results due to extremely large or small values, the logarithmic function is used for normalization processing.
When other indicators and weights are relatively close, the indicator S(X) can ensure that warnings from higher-level senders are given priority for release, thereby improving the timeliness of warnings from these higher-level senders.
3.2.6 Indicator G(X)
The classification criteria for the severity of emergencies are typically established by the State Council or the department determined by the State Council, categorized based on factors such as the degree of social harm and the scope of impact. They are divided into four levels from high to low: extreme, severe, moderate, and minor, represented by colors red, orange, yellow, and blue, respectively. From Table 1, it can be seen that the number of warnings at each severity is greatly differentiated. In 2023, there were 10,648 red warnings, 96,679 orange warnings, 378,237 yellow warnings, and 190,593 blue warnings issued. The yellow and blue warnings are much more numerous than the red and orange warnings, without an order of magnitude, and the values exhibit a bimodal distribution. According to the classification criteria for the severity of emergencies, the warnings with higher-level severity should be given priority to release if other data indicators and weights are relatively close, and the priority of releasing warnings should decrease in order from red to blue. Therefore, the indicator G′(X) is set, as shown in Formula 12, representing the proportion of the number of warnings at the severity of warning X to the total number of warnings at a severity lower than or equal to that of X within the statistical range. The smaller the value of G′(X), the higher the priority.
Xg represents the severity of warning X; NUMg(Xg) represents the number of warnings with the severity of Xg within the statistical range; SUMg(Xi) represents the total number of warnings with a severity lower than or equal to Xg within the statistical range.
According to historical experience, in cases that other indicators and weights are relatively close, and the severity is also the same, the priority of Alert warning release should be higher than that of Upgrade warning release, because the Alert warning has not been released before. The priority of releasing Continue warnings should be lower than that of Downgrade warnings, as the severity of the warning has not changed. Therefore, an adjustment coefficient f for msgType is added to the Formula 13 to meet the order f (Alert) < f (Upgrade) < f (Downgrade) < f (Continue) < f (Cancel). The specific value of f can be adjusted based on historical analysis, or experience. Additionally, to avoid abnormal impacts on the calculation results due to extremely large or small values, a non-linear function log is used for normalization processing.
If other indicators and weights are relatively close, the indicator G(X) satisfies the rule that the priority of releasing warnings should decrease in order from red to blue. This enhances the warning effect of higher-level severity warnings. Furthermore, if the severity of the warning changes, the adjustment coefficient f will adaptively adjust, further enhancing the objectivity and timeliness of the warning release.
3.3 Weight coefficient
To adapt to the different actual business scenarios in various regions, multiple adjustment coefficients are used to regulate the weights between variables. α1, α2, α3, α4, α5 are the weight coefficients for the indicators E(X), Ta(X), Tc(X), S(X), G(X), respectively. There are two ways to determine the weight coefficients: one is to obtain them based on historical experience; the other is to calculate the information entropy of each indicator using the entropy method, based on the historical data within the temporal and spatial range, and then taking the reciprocal of the information entropy as the weights of the indicators. The smaller the information entropy, the greater the utility value of the information, resulting in a greater weight for the indicator (Mehmet et al., 2023).
Information entropy is an objective measurement method based on the characteristics of data itself. It allocates weights by calculating the uncertainty of data distribution, reducing the influence of subjective judgments and preferences on weight allocation, which is more reliable than judgments based on historical experience (Zhu, 2011; Jun et al., 2018). Information entropy can automatically adjust weight coefficients based on the characteristics of data, making weight allocation more flexible and adaptable to changes in data, and providing more accurate weight coefficients (Zhang and Chen, 2007).
The process of calculating information entropy involves determining all possible values of a random variable and their respective probabilities, and then substituting these probabilities into the information entropy formula to perform summation operations (Guo, 2013). The specific formula for calculating information entropy is shown in Formula 14.
X represents the random variable, n is the number of all possible values of X,p (xi) is the probability of the value xi.
In this paper, the information entropy method is applied to determine the weight coefficients. Using the warning data from Guangdong Province in 2023 as the historical reference, the final calculated weights for E(X), Ta(X), Tc(X), S(X) and G(X) are 0.38, 0.04, 0.02, 0.22, and 0.34, respectively.
4 Algorithm flow
The conduct flow of the multi-hazard warning release priority algorithm is shown in Figure 5.
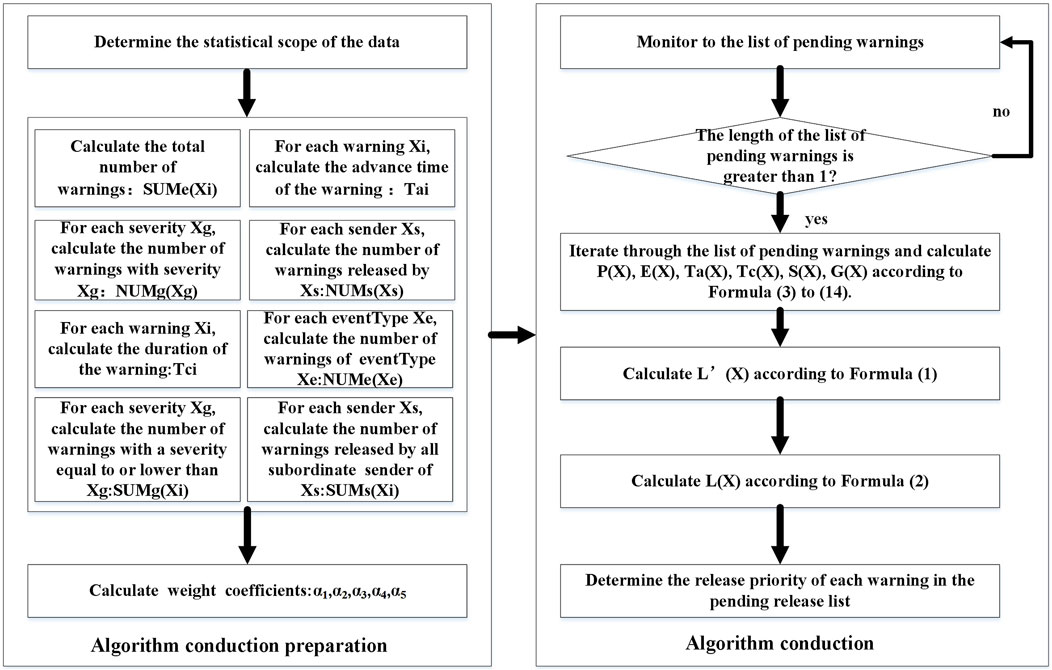
Figure 5. The conduction flow of the multi-hazard warning release priority algorithm.
Before starting to perform the algorithm, it is necessary to prepare the environment for algorithm conduction, as follows:
(1) Determine the observation time frame of the data. Typically, the historical warning data from a year of the early warning system is selected as the observation window. Alternatively, it can be determined based on the local business reality and the temporal range and spatial range of the historical data.
(2) To accelerate the conduction speed of the algorithm, after determining the observation window, the followings should be pre-calculated: the total number of warnings SUMe(Xi), the lead time of each warning Ta, the duration of each warning Tc, the number of warnings of each eventType NUMe(Xe), the number of warnings of each severity NUMg(Xg), and the number of warnings issued by each sender NUMs (Xs). For each severity Xg, the number of warnings with a severity equal to or lower than Xg will be calculated, represented by SUMg(Xi). For each sender Xs, the number of warnings released by all subordinate senders of Xs will be calculated, represented by SUMs (Xi).
(3) Based on the historical warning data within the statistical range, the entropy value method is applied to calculate the weight coefficients α1, α2, α3, α4, α5.
Once the input data is ready, the algorithm will be performed and the list of pending warnings will be monitored. When there are multiple pending warnings, traverse the list of pending warnings and P(X), E(X), Ta(X), Tc(X), S(X), G(X) will be computed according to Formulas 3–14. Then, L′(x) will be calculated using Formula 1. After all L′(X) are calculated, L(X) will be calculated using Formula 2. Finally, the priority of each warning in the list of pending warnings will be determined, based on the L(X) results. If the L(X) results are the same, the priority will be determined by the arrival time of the warning at the release means. The earlier arrivals, the higher priority.
5 Result and discussion
To validate the effectiveness of the proposed algorithm, we utilized the 2023 warning data from Guangdong Province as a historical reference. We applied the algorithm to the dataset presented in Table 3, which comprises a list of pending warnings, and evaluated its performance against two alternative methods: one prioritizing warning dissemination based on the time of issuance, and another based on the severity of the warning. The comparison results are summarized in Table 3. As shown in Table 3, PRI1 represents the priority determined by our proposed multi-hazard warning dissemination algorithm, PRI2 denotes the priority based on the time of issuance, and PRI3 indicates the priority based on the severity of the warning. The results show that:
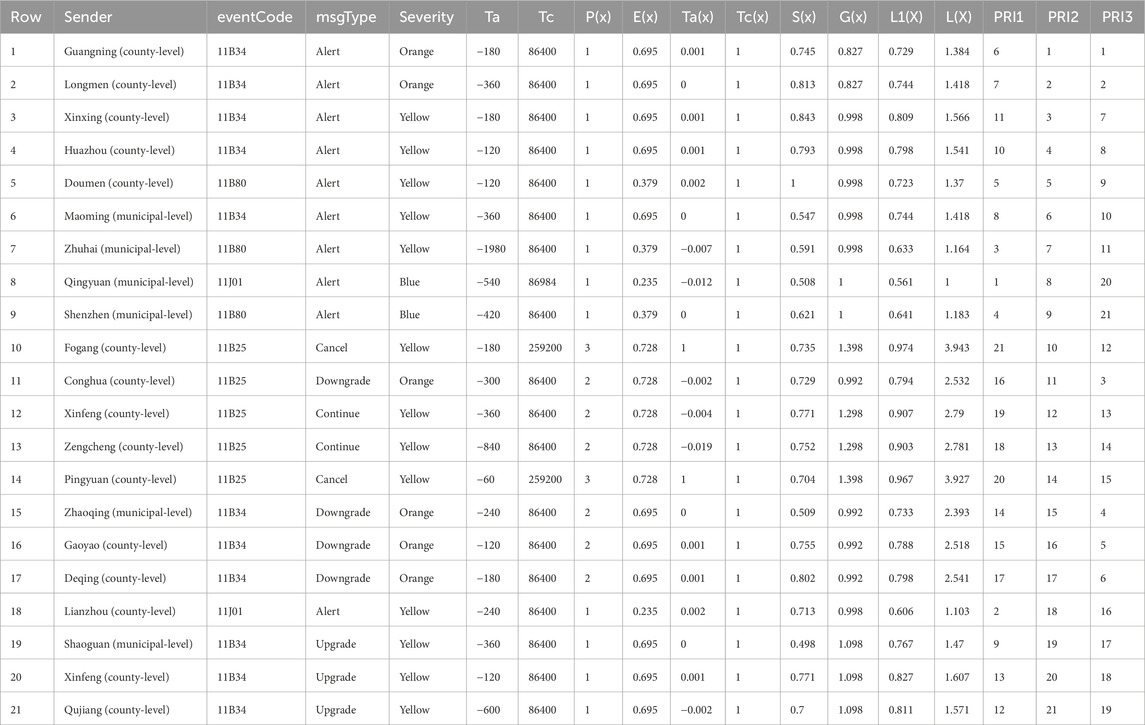
Table 3. The execution results of multi-hazard warning release priority algorithm on the warnings waiting to be issued in Guangdong Province.
(1) The proposed algorithm prioritizes road icing events highest, followed by strong monsoon events. As illustrated in Figure 2A, road icing and strong monsoon events exhibit relatively low occurrence frequencies in Guangdong Province compared to cold events and forest fire risk. However, when such events do occur, they often have significant consequences. Our algorithm ensures that warnings of uncommon eventTypes receive higher priority, serving as a reliable indicator for unusual warnings when unprecedented eventTypes occur in a specific region. In contrast, prioritization methods that rely solely on the time of issuance or the severity of the warning do not guarantee that warnings of uncommon eventTypes will receive the necessary priority.
(2) According to the algorithm, Alert and Upgrade warnings are assigned the highest priority, followed by Continue and Downgrade warnings, with Cancel warnings receiving the lowest priority. This indicates that, to some extent, the algorithm ensures that unknown events are prioritized for release. Conversely, prioritization methods that rely solely on the time of issuance or the severity of the warning do not consider the msgType of the warning and cannot ensure that unknown events are prioritized for release.
(3) From Table 3, the first, second, and sixth rows show that orange cold warnings are prioritized over yellow cold warnings when the msgTypes of the warnings are identical. This demonstrates that when other data indicators and weights are relatively close, the algorithm adheres to the principle that the priority of warning release should decrease in the sequence of red, orange, yellow, and blue. This effect aligns with the prioritization method based solely on the severity of the warning.
(4) The fourth and sixth rows of Table 3 reveal that the yellow cold warning issued by Maoming holds a higher priority than that issued by its subordinate sender, Huazhou. This indicates that the algorithm ensures that, when other data indicators and weights are relatively similar, warnings from higher-level senders are prioritized for release, thereby improving the timeliness of warnings from these higher-level senders. In contrast, prioritization methods that rely solely on the time of issuance or the severity of the warning do not achieve the same effect.
(5) Comparing the 21st and 20th rows of Table 3, the algorithm demonstrates that when the lead time of a warning is less than the average, the Ta(X) value becomes negative, thereby increasing the priority of the warning. This reflects the time effect of warning, where shorter lead times result in higher release priority. Prioritization methods that rely solely on the time of issuance or the severity of the warning do not replicate this outcome.
During March 22 to 26, 2023, Ganzhou City in Jiangxi Province suffered severe hail damage, resulting in economic losses exceeding 100 million (CMA, 2024). To further validate the effectiveness of the proposed Algorithm, we selected the 2023 warning data from Jiangxi Province as a historical reference. We implemented the Algorithm and assessed its performance using a list of pending early warnings related to the severe convective weather event. The results of this evaluation are presented in Table 4. The results indicate that the effectiveness of the Algorithm in Jiangxi Province is similar to that observed in Guangdong Province, successfully ensuring the priority issuance of the emergency “hail” warning. This further demonstrates the universality and reliability of the Algorithm.
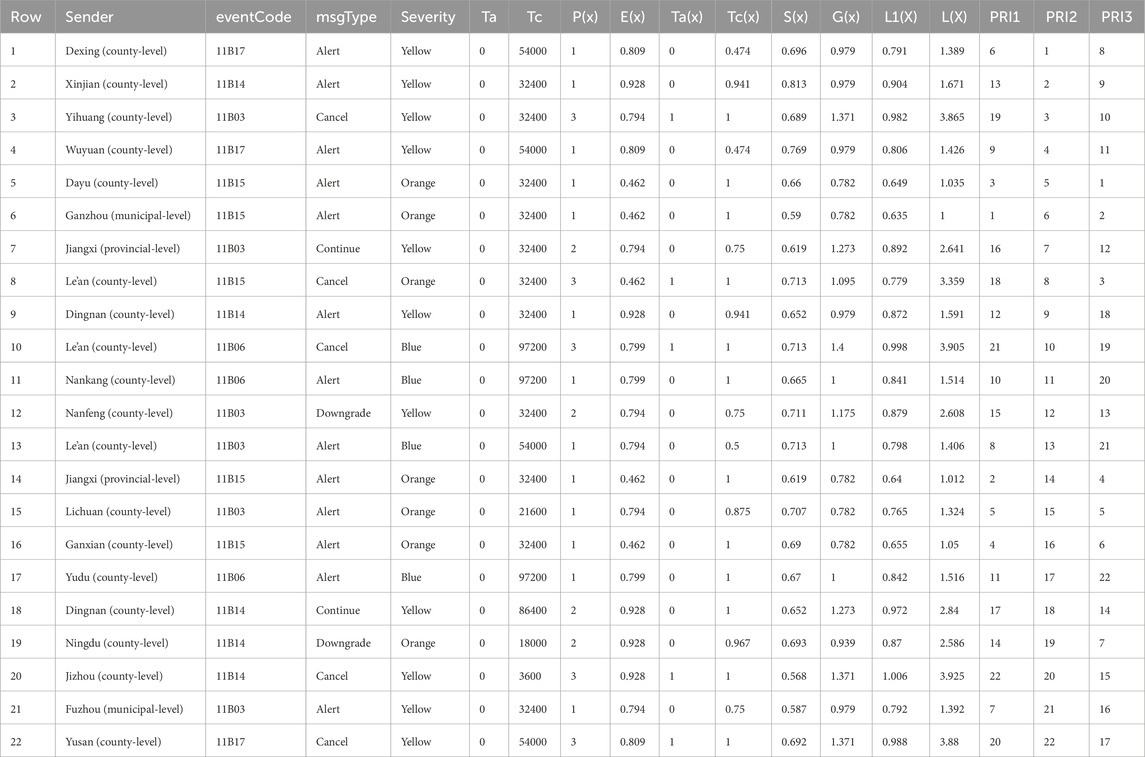
Table 4. The execution results of multi-hazard warning release priority algorithm on the warnings waiting to be issued in Jiangxi Province.
The scores of the six indicators for each warning in the pending list of warnings are calculated based on the values of comparable attributes of the warning, such as msgType, eventType, sendTime, effective, expires, severity, and sender. In a specific instance, there may be identical values for a certain attribute, resulting in the same score for the indicator determined based on that attribute, and consequently, that indicator does not play a role in the algorithm. As seen in Table 3, due to the identical values of the attribute “expires” for all warnings, the values of Tc and Tc(x) are the same, causing Tc(x) to not function within the algorithm. However, Table 4 demonstrates that all six indicators contribute to the algorithm. Therefore, when performing calculations and finding identical values for a particular indicator, we can omit that indicator from the formula to reduce computational load.
6 Conclusion
This paper statistically analyzes the frequency of each attribute of warnings based on historical data. After normalizing the attributes of different dimensions of warnings such as the msgType, the eventType, the lead time, the duration, the severity, and the sender, six warning priority indicators are obtained, including P(X), E(X), Ta(X), Tc(X), S(X), and G(X). By using the entropy method to weigh the warning priority indicators, a method for calculating the priority of warning release is obtained. After algorithm test, the following conclusions have been drawn:
(1) The algorithm avoids the biased conclusions drawn from artificial weighting calculations or single attribute calculations, which is a comprehensive, quantitative, and objective judgment. (2) The algorithm clarifies the priority order for issuing multiple warnings and improves the timeliness of emergency warning issuance. (3) When a new eventType that has never seen before occurs in a certain region, the result calculated by the algorithm will rapidly decrease. The algorithm plays a good role in alerting the occurrence of abnormal warnings. (4) The algorithm takes into account the time effect of warnings, and warnings with higher spreading effects will be released first. (5) The algorithm calculates weights based on the information entropy of various warning priority indicators within the statistical range, which also provides some objective guidance for the calculation results.
The algorithm can be applied to the national-level early warning system in China, as well as at the provincial, municipal, or county levels. The specific level or agency system to which it is applied depends on which level or institution’s historical data is chosen as the reference when executing the algorithm.Subsequently, based on the actual business in various regions, the various warning priority indicators will be further optimized, and the weight coefficients will be adaptively adjusted through various methods such as comprehensive evaluation or benefit evaluation to meet the actual business needs of different regions.
Data availability statement
The raw data supporting the conclusions of this article will be made available by the authors, without undue reservation.
Author contributions
YM: Conceptualization, Data curation, Methodology, Software, Writing – original draft. QH: Conceptualization, Funding acquisition, Methodology, Project administration, Writing – review and editing. YS: Conceptualization, Methodology, Writing – review and editing. JL: Validation, Writing – review and editing, Visualization. JZ: Validation, Visualization, Writing – review and editing.
Funding
The author(s) declare that financial support was received for the research and/or publication of this article. China Meteorological Administration Youth Innovation team plan (CMA2023QN02). The Joint Research Project for Meteorological Capacity Improvement (No. 23NLTSQ014). Hainan Provincial Natural Science Foundation of China (No. 421QN370).
Conflict of interest
The authors declare that the research was conducted in the absence of any commercial or financial relationships that could be construed as a potential conflict of interest.
The reviewer ZM declared a shared affiliation with the authors QH, YS, JZ to the handling editor at time of review.
Publisher’s note
All claims expressed in this article are solely those of the authors and do not necessarily represent those of their affiliated organizations, or those of the publisher, the editors and the reviewers. Any product that may be evaluated in this article, or claim that may be made by its manufacturer, is not guaranteed or endorsed by the publisher.
References
Baike Baidu (2024). Measures for the issuance of meteorological disaster warning by national meteorological centre. Available online at: https://baike.baidu.com/item/%E4%B8%AD%E5%A4%AE%E6%B0%94%E8%B1%A1%E5%8F%B0%E6%B0%94%E8%B1%A1%E7%81%BE%E5%AE%B3%E9%A2%84%E8%AD%A6%E5%8F%91%E5%B8%83%E5%8A%9E%E6%B3%95/3642311?fr=ge_ala (Accessed September 14, 2024).
Bubeck, P., Dillenardt, L., Alfieri, L., Feyen, L., Thieken, A. H., and Kellermann, P. (2019). Global warming to increase flood risk on European railways. Springer Netherlands: Springer Science and Business Media LLC.
Cao, C., and Liu, D. (2018). A precise SMS warning system and method for sudden events based on crowd density. Guangdong CN201711245542.5.
Cao, Z., He, S., Sun, C., and Liu, L. (2021). Design and Implementation of new-generation cloud service platform for national emergency early warning Science. Technol. Eng. 21 (4), 1483–1488. doi:10.3969/j.issn.1671-1815.2021.04.034
Chen, S., Xiang, L., and Xiang, L. (2019). The application of targeted technology in the release of early warning information. Comput. Appl. 39 (z1), 88–92.
China Meteorological Administration (2008). Measures for the issuance and dissemination of meteorological disaster warning signals. Bull. State Counc. People's Repub. China (7), 35–42.
Climate Change Center of China Meteorological Administration (2023). Blue book on climate change in China 2023. Beijing: Science Press.
CMA (2024). Major weather and climate events since 2023 and prediction of future climate trends in Jiangxi Province. Available online at: http://jx.cma.gov.cn/zwxx/tqdt/202307/t20230721_5663045.html (Accessed September 14, 2024).
CRED (2023). 2022 disasters in numbers. Available online at: https://reliefweb.int/report/world/2022-disasters-numbers.
Dai, Z., Simin, X., Xue, W., Li, M., Hu, J., and Liao, X. (2022). Suggestions on application of multi criteria decision analysis to clinical comprehensive evaluation of traditional Chinese patent medicines and simple preparations. Chin. J. Traditional Chin. Med. 47 (12), 3155–3160. doi:10.19540/j.cnki.cjcmm.20220310.502
ESCAP (2023a). Disaster risk reduction working group for priority 1: early warnings for all, early warnings for all in asia and the pacific: opportunities for action. Available online at: https://g20drrwg.preventionweb.net/media/86863/download?startDownload=true.
Gao, G., Gou, X., Ma, X., and Wang, S. (2022). A targeted release scheme for emergency warning SMS based on cellular communication. Meteorol. Technol. 50 (1), 59–65. doi:10.13448/j.cnki.jalre.2019.205
General Administration of Quality Supervision (2018). Inspection and quarantine of the people's Republic of China emergency information exchange protocol Part 1: warning information: GB/T 35965.1-2018.
Guo, H. (2013). Research on feature weight algorithm based on information entropy theory. Comput. Eng. Appl. 49 (10), 140–146. doi:10.3778/j.issn.1002-8331.1301-0023
Han, L., Qiang, Z., Yang, Y., Jia, J., and Zhang, L. (2019). The comprehensive loss characteristics of major meteorological disasters in Gansu Province under the background of climate change. Resour. Environ. Arid Areas 33 (7), 107–114. doi:10.13448/j.cnki.jalre.2019.205
Henan Provincial Quality and Technical Supervision Bureau (2011). Henan emergency platform system data specification Part 2: information resource classification and coding: DB41/T 682.2-2011.
Huang, Y., Wang, B., Huang, W., Duan, B., and Yang, X. (2019). Research progress of rainstorm in northwest China Rainstorm Disaster. arXiv 38 (5), 515–525.
Huihui, C., Rong, L., Gao, Y., Li, N., and Wang, S. (2023). Study on the precipitation details and disaster process of the “July 20” extreme extremely heavy rainstorm in Zhengzhou. Disaster Sci. 38 (2), 114–120. doi:10.3969/j.issn.1000-811X.2023.02.017
IPCC (2023a). “Sections,” in Climate change 2023: synthesis report. Contribution of working groups I, II and III to the sixth assessment report of the intergovernmental panel on climate change core writing team. Editors H. Lee, and J. Romero (Geneva, Switzerland: IPCC), 35–115. doi:10.59327/IPCC/AR6-9789291691647
IPCC (2023b). Synthesis report of the IPCC sixth assessment report (AR6) [R/OL]. Available online at: https://report.ipcc.ch/ar6syr/pdf/IPCC_AR6_SYR_LongerReport.pdf (Accessed March 28, 2023).
ITU (2024). Common alerting protocol (CAP 1.2). Available online at: https://www.itu.int/en/ITU-D/Emergency-Telecommunications/Documents/2020/T-RECX.1303bis-201403-.pdf (Accessed June 14, 2024).
Jun, D., Honghui, Y., Zhiguang, L., and Zhijun, W. (2018). Determination of mine safety weights based on rough set conditional information entropy. Min. Res. Dev. 38 (7), 85–87. doi:10.13827/j.cnki.kyyk.2018.07.018
Liu, X., and Chen, H. (2016). Wang yantong design and implementation of a comprehensive meteorological warning information release platform based on mobile SMS. Mod. Electron. Technol. 39 (21), 29–31. doi:10.16652/j.issn.1004-373x.2016.21.007
Liu, Y., Su, G., Yuan, H., Chen, T., and Huang, Q. (2021). Method and device for sending warning information. Beijing CN202010136590.6.
Mehmet, K., Lokman, K., and Hasan, D. (2023). Analysis of the financial performances of banks with the TOPSIS method weighed by Entropy. Towards Industry 5.0: Selected Papers from ISPR 2022. Antalya, Turkey: Springer, 75–85.
National Early Warning Information Release Center (2015). Interpretation of the management measures for the operation of the national emergency early warning information release system (trial). Beijing: Meteorological Publishing House.
Pan, H., Chen, B., and Peijun, S. (2021). Temporal and spatial pattern and influencing factors of rainstorm and flood disaster in China. Acta Geogr. Sin. 76 (5), 1148–1162. doi:10.11821/dlxb202105008
Qian, Z. (2009). Railway gale disaster and its prevention and control measures in northwest China. China Railw. (3), 1–4. doi:10.3969/j.issn.1001-683X.2009.03.001
Qiao, L., Yuanyuan, L., Xie, Y., and Cui, X. (2023). Clinical comprehensive evaluation of chicken bone grass capsules based on multi criteria decision model. Chin. Herb. Med. 54 (16), 5312–5320. doi:10.7501/j.issn.0253-2670.2023.16.020
Shakoor, A., Farooq, T. H., Arif, M. S., and Shahzad, S. M. (2022). Floods wreak havoc in Pakistan: a deadly reality of climate change exposing frailty of global response efforts. Ecol. Inf. Int. J. ecoinformatics Comput. Ecol. 72, 101877. doi:10.1016/j.ecoinf.2022.101877
Shen, P., Yu, X., Zheng, X., Wei, W., and Zhong, C. (2022). Intelligent monitoring of thunderstorm and gale warning signals in Guangdong province. Guangdong Meteorol. 44 (3), 85–88. doi:10.3969/j.issn.1007-6190.2022.03.022
Shi, L. (2012). Technical scheme for high-speed SMS release system in public event warning area. Inf. Technol. Inf. (05), 50–53. doi:10.3969/j.issn.1672-9528.2012.05.12
State Council (2024). Emergency response law of the people's Republic of China. Available online at: https://www.gov.cn/yaowen/liebiao/202406/content_6960130.htm (Accessed September 14, 2024).
Su, Z., Wang, X., Lu, X., and Li, Y. (2012). “The impact of major meteorological disasters in Ningxia and countermeasures for disaster prevention and reduction,” in Proceedings of the 29th annual conference of the Chinese meteorological society, 1–9.
UNDRR (2023a). Words into action: a guide to multi-hazard early warning systems (public review version). Available online at: https://www.preventionweb.net/publication/words-action-guidelines-multi-hazard-early-warning-systems.
United Nations Office for Disaster Risk Reduction and World Meteorological Organization (2023). Global status of multi-hazard early warning systems. Geneva, Switzerland.
WMO (2013). WMO-No. 1109. Guidelines for implementation of common alerting protocol (CAP)-Enabled emergency alerting. Available online at: https://library.wmo.int/doc_num.php?explnum_id=343.
WMO (2021). “Atlas of mortality and economic losses from weather, climate and water extremes (1970–2019),” in State of the global climate 2023 (Geneva: WMO).
WMO (2023). Early warnings for all executive action plan [R/OL]. Available online at: https://library.wmo.int/doc_num.php?explnum_id=11426 (Accessed March 28, 2023).
WMO (2023a). Atlas of mortality and economic losses from weather, climate and water-related hazards. 2022 update. Fullscreen Storymap. Available online at: https://public.wmo.int/en/resources/atlas-of-mortality.
WMO (2023b). “WMO-No. 1316,” in State of the global climate 2022. Available online at: https://library.wmo.int/index.php?lvl=notice_display&id=22265#.ZEurbi_ML0r.
Xiao, Y. (2013). Research on monitoring and warning methods and information release platforms for debris flow. Chengdu: Chengdu University of Technology.
Xie, Y., Wang, X., and Zhong, J. (2020). Research on priority of medical equipment scrapping based on multi criteria decision analysis. China Med. Equip. 35 (12), 142–144+154. doi:10.3969/j.issn.1674-1633.2020.12.035
Xiong, J., Hongtao, Q., Jianhua, L., and Zhang, L. (2013). Method for determining the weight of security risk assessment indicators based on information entropy. J. Syst. Sci. 21 (02), 82–84+89.
Yunyin, M., Xun, L., Liang, C., Shenghong, W., and Cairong, Y. (2019). Research and implementation of middleware based system docking technology. Comput. Technol. Dev. 29 (07), 170–174. doi:10.3969/j.issn.1673-629X.2019.07.034
Zhang, H. (2009). Yang Qingsheng Rural tourism development layout and new rural construction based on MCDA. Hum. Geogr. 24 (03), 75–79.
Zhang, Y., and Chen, X. (2007). Xiong zhongyang research on feature word weight adjustment algorithm based on information gain. Comput. Eng. Appl. 43 (35), 159–161. doi:10.3321/j.issn:1002-8331.2007.35.048
Zhu, H. (2011). Chen nenghua improvement of the method for determining the weight of rough set conditional information entropy. Statistics Decis. Mak. (8), 154–156.
Keywords: warning dissemination, prioritization algorithm, multi-hazard, early warning, priority indicators
Citation: Mo Y, Han Q, Song Y, Li J and Zhao J (2025) Research on prioritization algorithm for multi-hazard warning dissemination. Front. Earth Sci. 13:1455528. doi: 10.3389/feart.2025.1455528
Received: 27 June 2024; Accepted: 03 June 2025;
Published: 30 June 2025.
Edited by:
Tong Jiang, Nanjing University of Science and Technology, ChinaReviewed by:
Amany Abdel-Rahman Mohamed, Zagazig University, EgyptEl-Sayed Ewis Omran, Suez Canal University, Egypt
Zhanshan Ma, China Meteorological Administration, China
Copyright © 2025 Mo, Han, Song, Li and Zhao. This is an open-access article distributed under the terms of the Creative Commons Attribution License (CC BY). The use, distribution or reproduction in other forums is permitted, provided the original author(s) and the copyright owner(s) are credited and that the original publication in this journal is cited, in accordance with accepted academic practice. No use, distribution or reproduction is permitted which does not comply with these terms.
*Correspondence: Qiang Han, aGFucWlhbmdAY21hLmdvdi5jbg==