 Bo Chen
 Hui Chen
 Wanli Xing*†
 Yingchao Wang
 Yixuan Zhao
- Science and Technology Division and Technical Guidance Center for Mineral Exploration, Development Research Center of China Geological Survey, Beijing, China
The Ashawayi gold deposit is situated in the eastern part of the Southern Tianshan Sb–Hg–Au metallogenic belt, a significant source of gold in China. This deposit exhibits typical disseminated mineralization controlled by faults or fractures. This study presents a comprehensive set of petrological, fluid inclusion, and H–O–S isotopic data for the deposit. Fluid inclusions can be classified into three main types, namely, NaCl–H2O, CO2-bearing aqueous solutions, and pure CO2. The quartz from the ore contains fluid inclusions predominantly composed of NaCl–H2O and CO2. The homogenization temperatures of these inclusions range from 200°C to 360°C. Estimates based on fluid inclusion pressures suggest that mineralization occurred at depths of approximately 2–4 km. Mineralization is associated with fault healing and fracturing, which induce secondary fluid immiscibility. Fluid boiling features indicate rapid upwelling of ore fluids from depth, with metal precipitation occurring through decompression at shallower levels. H–O–S isotopes suggest that metals were extracted from the country rock and that the ores were formed through the mixing of metamorphic fluids with meteoric water. A combined analysis classifies the Ashawayi gold deposit as a hypabyssal orogenic gold deposit.
1 Introduction
The Southern Tianshan orogen extends across Uzbekistan, Kyrgyzstan, and China, forming a significant gold metallogenic belt in Central Asia and one of the world’s most renowned mineralization belts (Wilde et al., 2001; Graupner et al., 2006; Kempe et al., 2015; Mao et al., 2004; Yang J. G. et al., 2004; Abzalov, 2007; Morelli et al., 2007; Frimmel, 2008; Pasava et al., 2010; 2013; Bierlein and Wilde, 2010; Chen et al., 2012a; 2012b; Goldfarb et al., 2014; Xue et al., 2014b). This region hosts numerous gold deposits, including super-large (>100t Au) and large (20–100t Au) deposits. Notable super-large deposits include Muruntau (Au 6137t; Frimmel, 2008), Daugyztau (Au 186t; Bierlein and Wilde, 2010), Amantaitau (Au 120t; Pasava et al., 2010), and Zarmitan (Au 314t; Abzalov, 2007) in Uzbekistan; Jilau (Au 110t; Cole et al., 2000) in Tajikistan; and Kumtor (Au 1100t; Mao et al., 2004) in Kyrgyzstan (Figure 1).
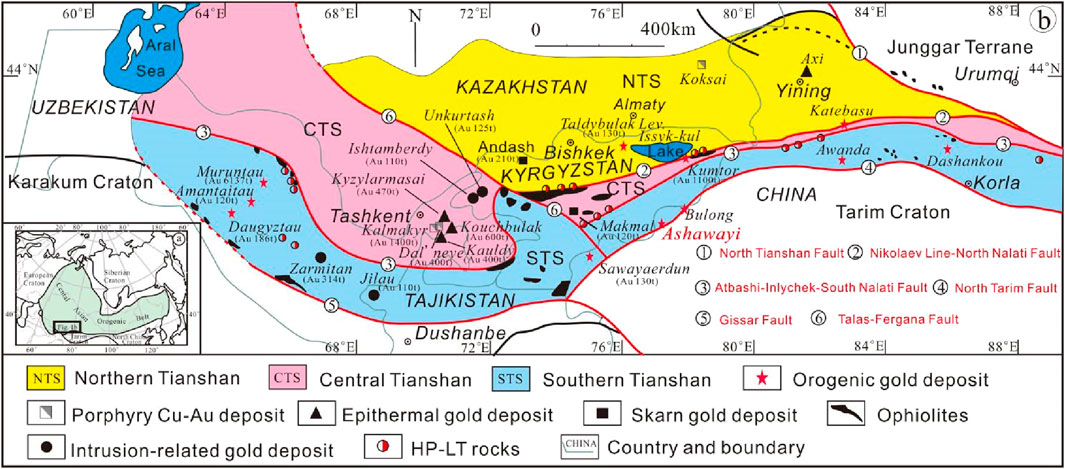
Figure 1. (a) Tectonic map of the Central Asian Orogenic Belt (modified from Gao et al., 2009); (b) Sketch map of west Tianshan showing the location of the Ashawayi gold deposit (modified from Xue et al., 2014b; Zhang et al., 2017).
The Southern Tianshan in Xinjiang is the eastern extension of Southern Tianshan in Central Asia and exhibits metallogenic conditions similar to those in neighboring countries. Several gold deposits have been discovered in this area, including Sawayaerdun, Dashankou, Sahentouhai, and Bulon, along with some promising exploration sites (Ye et al., 1999a; Ye et al., 1999b; Liu et al., 2002a; Liu et al., 2002b; Liu et al., 2007; Yang F. Q. et al., 2004; Yang et al., 2006; Yang et al., 2007; Liu et al., 2007). Although these deposits show good potential for further exploration, they do not match the number and scale of deposits in the adjacent regions of foreign countries, and the level of mineral resource development and research remains insufficient. The Sawayaerdun gold deposit, with reserves exceeding 100t and an inferred resource of at least 300t (Rui et al., 2002; Xue et al., 2014a; 2014b; 2015), is currently the largest gold deposit in southwestern Tianshan, China, and has received the highest level of research attention (Rui et al., 2002; Chen et al., 2012a; Chen et al., 2012b; Xue et al., 2014a; Xue etal., 2014b; Xue et al., 2015; Zhang et al., 2017). The Ashawayi gold deposit is located east of the Sawayaerdun gold deposit and south of the world-class Kumtor gold deposit. Recent geological exploration has revealed that the Ashawayi gold deposit has become a medium-scale mine and ranks as the third largest gold deposit in the region. However, limited research has been conducted on this deposit (Chen B et al., 2019; Zhang et al., 2020; Zhang et al., 2023; Feng et al., 2021; Zhou et al., 2023).
In this paper, we present a comprehensive set of mineralogical, petrological, fluid inclusion, and H–O–S stable isotope studies on the newly discovered Ashawayi gold deposit. We investigate the ore-forming P–T conditions and sources, as well as the possible relationship between fluid pressure conversion and gold precipitation. This study aims to elucidate potential mineralization mechanisms and their implications for tectonic evolution.
2 Geological settings
The Tianshan orogen is a critical component of the Central Asian Orogenic Belt, situated between the Siberian Plate, the Eastern European Craton, the Karakum Plate, the Tarim Plate, and the North China Plate (Figure 1a). The Tianshan orogenic belt is bounded to the north by the Junggar Basin and to the south by the Tarim Basin. From north to south, it comprises three tectonic units, namely, Northern Tianshan, Central Tianshan, and Southern Tianshan. These units are delineated by the North Tianshan Fault, Nikolaev Line–North Nalati Fault, Atbashi–Inlychek–South Nalati Fault, and North Tarim (Kalatieke) Fault, respectively (Figure 1b; Gao et al., 2009; Xue et al., 2014a; Xue et al., 2014b; Zhao et al., 2014; Zhao et al., 2015; Zhang et al., 2017). Additionally, the NW-striking Talas–Fergana dextral strike–slip fault transects three tectonic units obliquely (Figure 1b; Zhang et al., 2017).
The Southern Tianshan primarily consists of Precambrian metamorphic rocks overlain by Cambrian–Carboniferous marine carbonates and clastic rocks with volcanic interlayers (Allen et al., 1993; Gao et al., 2009). In the central part of the Southern Tianshan, Permian fluvial sedimentary and volcanic rocks unconformably overlie the Carboniferous carbonate rocks (Huang et al., 2012). Sporadically exposed along the Atbashi–Inlychek–South Nalati Fault are ophiolites and high-pressure/low-temperature metamorphic (HP–LT) rocks (Figure 1b; Gao et al., 2006; Xiao et al., 2013). The glaucophane in the ophiolites has a K–Ar age of 360 ± 10 Ma (Gao et al., 2009), indicating that the ophiolites formed during the northward subduction of the Southern Tianshan Ocean. The phengite and metamorphic zircon in the HP–LT rocks have 40Ar–39Ar ages of 331–310 Ma and U–Pb ages of 320 Ma, respectively (Klemd et al., 2005; Su et al., 2010; Gao et al., 2011), suggesting that the collision between the Tarim craton and the Central Tianshan terrane occurred during the Late Carboniferous (Gao et al., 2009; Huang et al., 2012). Intrusive rocks, which constitute approximately 5% of the total area of the Southern Tianshan, were mainly emplaced from the Late Carboniferous to Early Permian (Huang et al., 2012). Post-collisional granites have ages of 298–260 Ma (Solomovich, 2007; Konopelko et al., 2007; Long et al., 2008; Gao et al., 2011), consistent with the inference that the closure of the Southern Tianshan Ocean took place during the Late Carboniferous (Zhang et al., 2017).
The Ashawayi gold deposit is located in the eastern part of Southern Tianshan, regionally between the NE-trending Karatik fault and the Keletibik fault (Figure 2). The gold ore is primarily hosted within quartz auriferous veins emplaced in Carboniferous sericite phyllite and relic sandstone (Figures 4c,d). Gold mineralization is structurally controlled by NNE- to NE-trending (30°–50°) ductile–brittle shear zones (Figure 3). These shear zones are crosscut by some NW-trending brittle faults that are generally not mineralized (Figure 3). Gold ores in the sub-surface zone (Figures 4a,b) exhibit fracturing and strong alteration. At depth, the ores gradually transition to primary ore with diminishing fracturing. The dominant ore mineral is pyrite, along with minor amounts of arsenopyrite, stibnite, galena, sphalerite, and chalcopyrite (Figures 5c–i). Gold occurs predominantly in pyrite and arsenopyrite. Based on mineralogical, textural, and crosscutting relationships observed in the deposit and hand samples, three stages of hydrothermal alteration were identified in the Ashawayi gold deposit. From oldest to youngest, these stages are (I) an early non-mineralization or quartz-growth stage (Figure 4e), (II) a middle quartz–polymetallic sulfide stage (Figures 4f–i), and (III) a late quartz and carbonatization stage (Figure 4g). Wall-rock alterations in the Ashawayi gold deposit commonly include silicification, pyritization (secondary ferritization), arsenopyritization, sericitization, carbonatization, chloritization, and kaolinization. Pyritization and silicification are closely associated with ore mineralization.
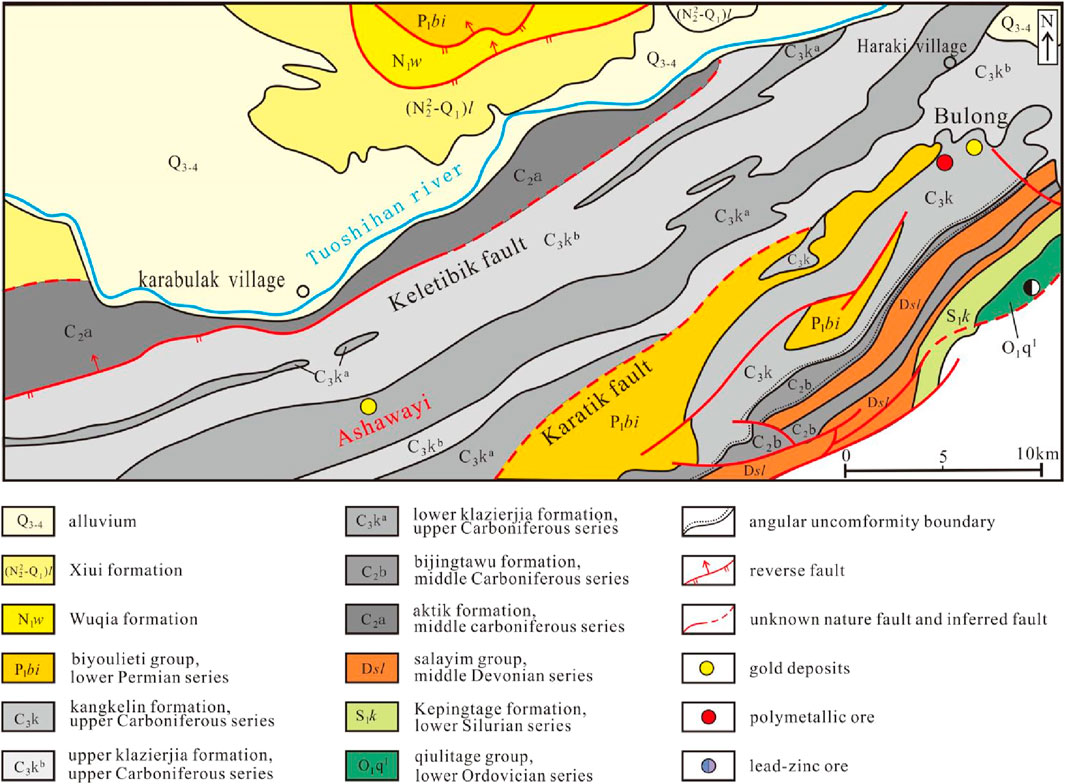
Figure 2. Geological map of the Ashawayi area (modified from Chen K. et al., 2007).
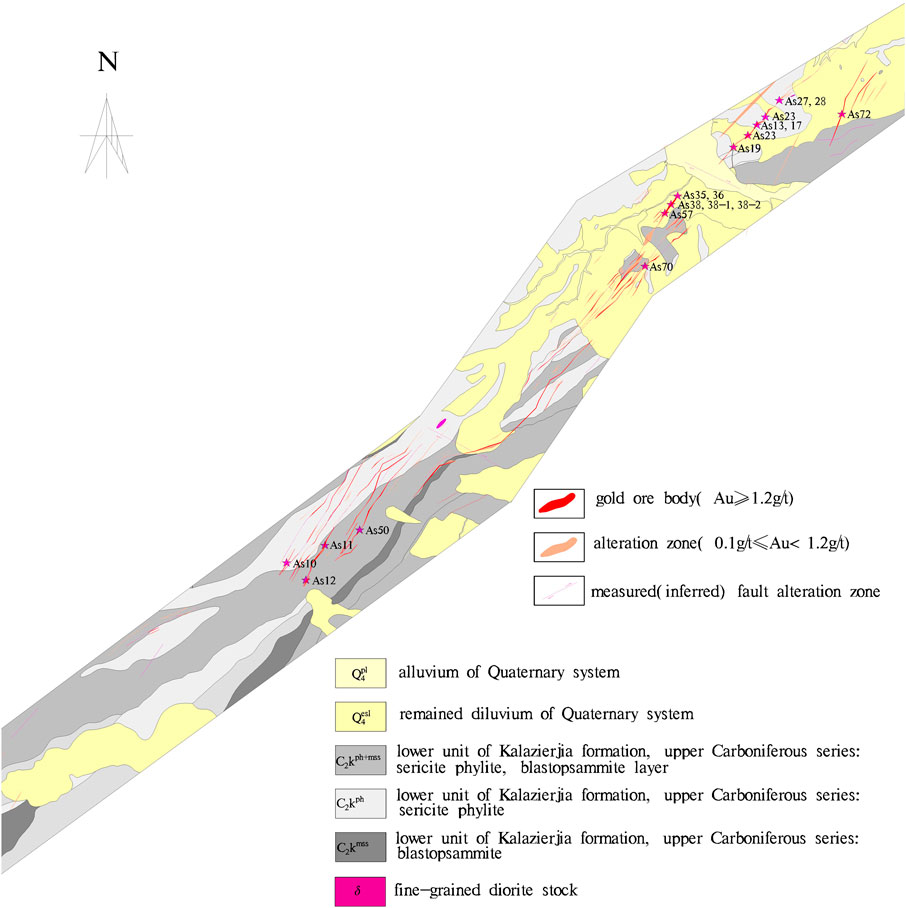
Figure 3. Geological sketch map of the Ashawayi gold deposit.
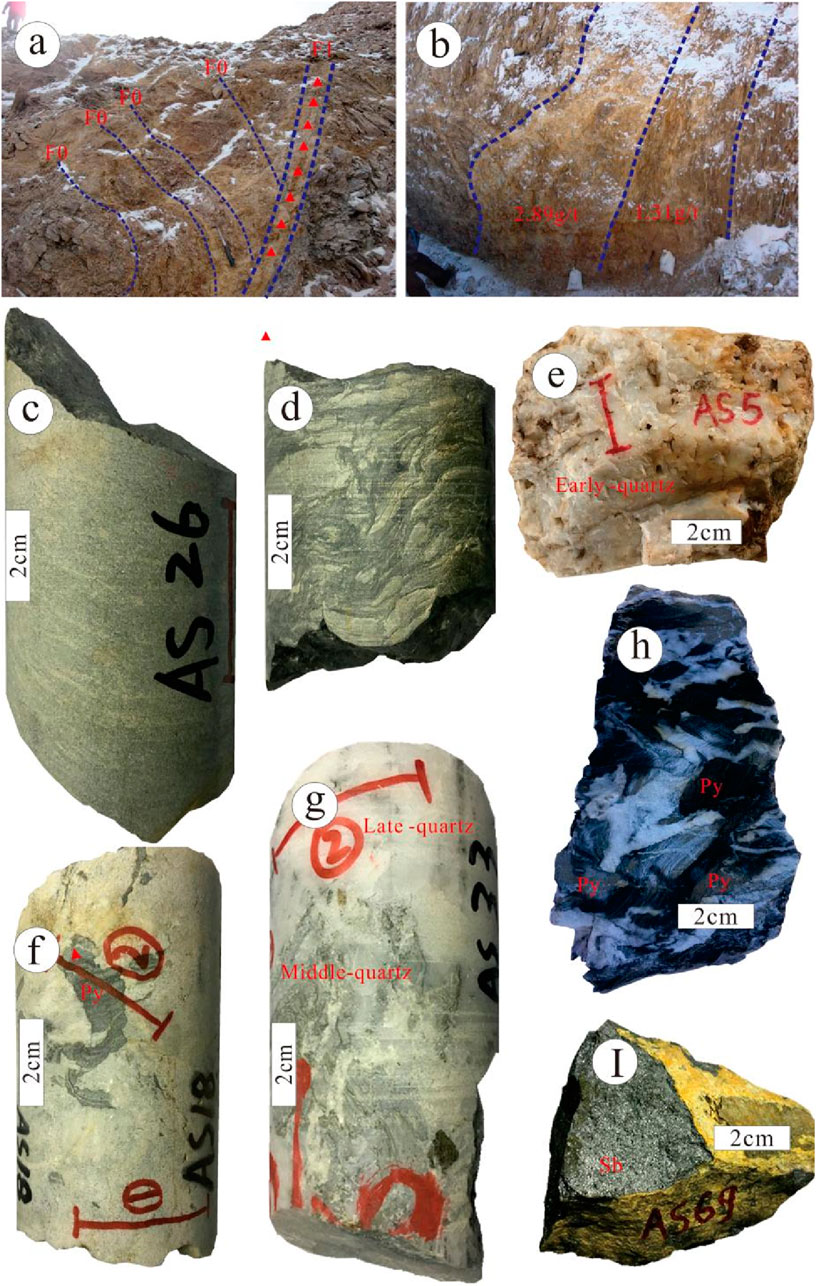
Figure 4. Characteristics of oxidized and primary ores and wall-rock samples from the Ashawayi gold deposit. (a) Surface-oxidized ore (produced from interlayer slip plane F0 and a little late thrust fault F1); (b) surface-oxidized ore (the gold grade of the ore collected from the breccia zone is 2.89 g/t and 1.31 g/t from the cleavage zone); (c) siltstone of wall rock; (d) phyllite of wall rock; (e) non- or poor-mineralized quartz vein sample produced from the early stage; (f) late-stage quartz cemented by smoky gray quartz breccia produced in the middle stage; breccia contains pyrite; (g) late-stage white quartz replaced the smoky quartz produced from the main stage of mineralization; (h) breccias ore (experienced through ductile and brittle deformation); (i) massive stibnite ore.
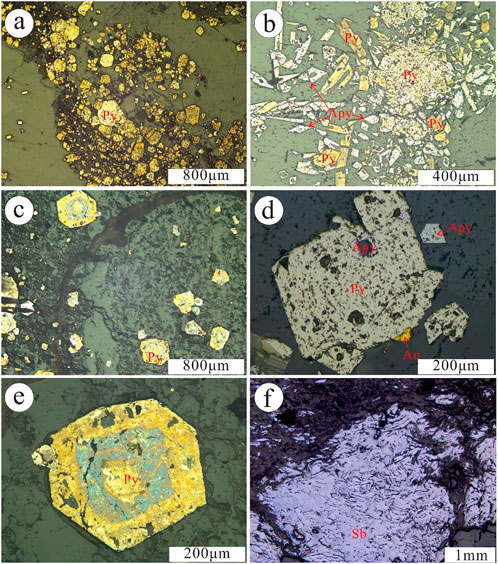
Figure 5. Photomicrographs of the Ashawayi gold deposit. (a) Anhedral and subhedral pyrite in gold ore; (b) pyrite–arsenopyrite assemblage in the gold ore; (c) euhedral and subhedral pyrite in the gold ore (developed zoning texture shows multi-period genesis); (d) native gold grains confined to the margin of pyrite; (e) clear zoning texture of pyrite; (f) massive stibnite ore.
3 Sampling and analytical methods
3.1 Sampling
In this study, systematic sampling was conducted from various ore bodies and different wall rocks. Due to the strong weathering and oxidation of the outcrops, representative samples were primarily collected from the drill core. Only a limited number of relatively fresh samples were obtained from outcrops. A total of 92 samples were used to select representative fluid inclusions for laser Raman spectroscopy and temperature measurements. A total of 14 samples from the main ore-forming phase were selected for H–O isotope analysis. Individual minerals such as pyrite, arsenopyrite, and antimonite were selected from 12 ore samples, four wall-rock samples, and two rock-body samples for S isotope analysis. The 14 samples selected for H–O isotope analysis are characterized by siliceous metasomatism associated with auriferous quartz or net-like veins. A summary of sample locations, rock types, and selected individual minerals is provided in Table 1. Representative field photographs are shown in Figure 4, and photomicrographs of typical mineral assemblages are presented in Figure 5.
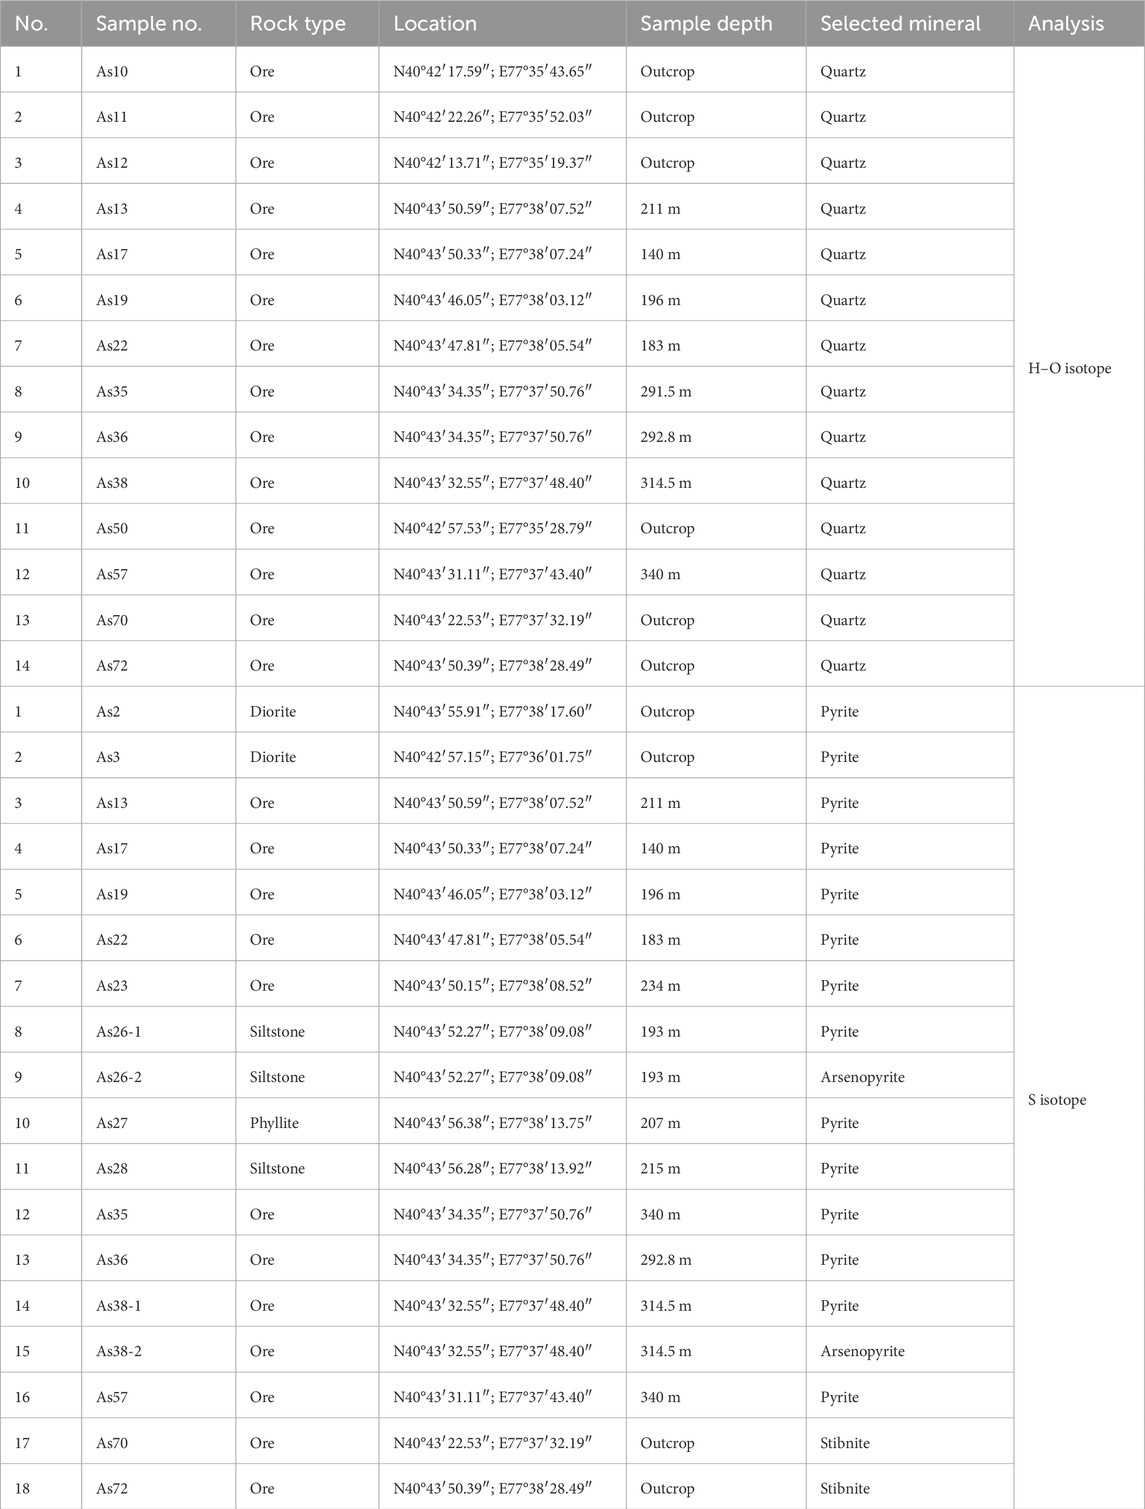
Table 1. Details of 14 samples analyzed for the H–O isotope and 18 samples analyzed for the S isotope from the Ashawayi gold deposit.
3.2 Fluid inclusion studies
Doubly polished wafers of representative samples were prepared for inclusion petrography, which was conducted at the University of the Chinese Academy of Sciences using an optical polarizing microscope. Microthermometry studies involving heating and freezing runs of the fluid inclusions were performed using a LINKAM THMS600 housed at the fluid inclusion laboratory of the North China University of Science and Technology. This equipment operates within a temperature range of −180°C to +600°C. Calibration was conducted at −56.6°C and 0°C using synthetic fluid inclusion standards and pure water to ensure measurement accuracy. The samples were first frozen and then heated gradually to prevent inclusion bursting. The heating rate varied from 0.1°C to 10 C/min, with a slower rate of 0.1 C/min when approaching phase transitions. Repeated measurements were conducted to ensure the accuracy of the measured phase transition temperatures.
Laser Raman spectroscopy of fluid inclusions from doubly polished wafers of representative samples was performed using the LABHR–VIS LabRAM HR800 machine at the Solid Mineral Resource Key Laboratory under the Institute of Geology and Geophysics, Chinese Academy of Sciences. The laser source was a yttrium aluminum garnet (YAG) laser with a wavelength of 532 nm and a power of 1,000 mW. Each spectral line involved an integration time of 10 s, with 10 integrations performed per line. The spectral resolution was ±2 cm-1 with a beam size of 2 μm.
3.3 H–O–S stable isotopic studies
The H–O–S isotopes were analyzed at the Research Center for Analysis and Measurement, affiliated with the Beijing Uranium Geology Research Institute. For the extraction of H2O from fluid inclusion in quartz, a decrement method was employed. The extracted H2O was prepared for the H isotope component measurement. The measurement procedure was as follows: individual quartz samples were first baked low temperature to remove the adsorbed water. The samples were then heated until they fractured, releasing the volatiles. Water vapor was extracted and subjected to a reduction reaction with zinc at 400°C to produce hydrogen. The resulting hydrogen was frozen with liquid nitrogen and collected in a sample bottle containing active carbon. Finally, its isotope component was analyzed using a MAT-253 mass spectrometer, calibrated with the international standard V-SMOW, with an analytical accuracy of ±2%.
For the analysis of the O isotope in quartz, the BrF5 method was used as follows: a 12 mg pure quartz sample was reacted with BrF5 under vacuum and high-temperature conditions for 15 h. Oxygen was extracted, and a resistance graphite rod was burnt with oxygen to produce CO2 at 700°C. Its O isotope component was analyzed using a Delta V Advantage mass spectrometer, calibrated with the international standard V-SMOW, with an analytical accuracy of ±0.2%.
The S isotopic composition was measured according to the following procedure: first, individual metal sulfides were uniformly mixed with cuprous oxide—ground to 200 mesh—using a precision scale. The mixture was then heated under vacuum condition at 2.0 Pa. Subsequently, the mixture was subjected to an oxidizing reaction at 980°C to produce SO2. SO2 was collected using the freezing method under vacuum conditions. The S isotope component was analyzed using the Delta V Plus mass spectrometer, calibrated with the CDT standard, with an analytical accuracy better than ±0.2%.
4 Results
4.1 Petrography
The ore characteristics of the various stages are listed below:
Stage I: During this stage, mineralization is either absent or occurs to a minimal extent. Well-developed quartz veins and quartz lenses are present, characterized by coarse brownish-white quartz grains ranging in size from 0.5 to 1 mm (Figure 4e). The average thickness of quartz veins is 1–3 cm, with the thickest reaching 30 cm. Small amounts of cubic-type pyrite occur within the quartz veins at this stage. The characteristics of quartz veins are similar to those observed in the earliest stage of the Muruntau gold deposit (Wilde et al., 2001).
Stage II (quartz polymetallic sulfide stage): This is the main stage of gold mineralization. In contrast to the barren quartz veins, mineralized quartz veins have experienced intense structural deformation, fracturing, and hydrothermal alteration. These mineralized quartz veins exhibit fine-grained or net-like textures and are commonly found within altered and fractured zones. The quartz grains range in color from deep gray to light gray, with grain sizes typically between 0.05 and 0.2 mm. The sulfides within these veins are predominantly euhedral or subhedral pyrite, accompanied by minor amounts of arsenopyrite, stibnite, galena, sphalerite, and chalcopyrite (Figures 5c–i). Gold is primarily hosted within pyrite and arsenopyrite, which are distributed along fractures in early-stage mineralized quartz veins or quartz breccias (Figures 4f,g). Notably, pyrite exhibits a zoning structure (Figures 5c,e), indicating that the mineralization process underwent a transition from compressional shear to tension stress conditions and involved multiple episodes of hydrothermal activity. Stibnite ores lack significant gold mineralization and occur mainly as veinlets, net veins, breccia, and disseminations.
Stage III (quartz-carbonatization stage): This is the late mineralization stage, characterized by the development of quartz–carbonate or net-like veins with widths ranging from 0.2 to 3 cm. The quartz–carbonate assemblages are metasomatic, replacing the sulfide quartz veins formed in stage II or filling the crushed alteration zones (Figure 4G). Quartz veins exhibit geode and pectinate structures. Carbonate minerals primarily consist of calcite and ferrodolomite. Sulfide occurrences are minimal at this stage, and gold mineralization is weak.
4.2 Fluid inclusion studies
4.2.1 Classification of fluid inclusions and their features
The studied fluid inclusions mainly originated from quartz in various mineralization stages. The quartz in the early and late mineralization stages is characterized by transparency, cleanliness, and relatively well-developed large-diameter fluid inclusions (long axis >7 μm). However, the quartz from the main mineralization stage is relatively turbid and less transparent, containing fewer large-diameter fluid inclusions (long axis >7 μm). Based on the chemical composition and physical characteristics at room temperature, the primary fluid inclusions are classified into three types, namely, NaCl–H2O type inclusions, CO2-bearing aqueous solution inclusions, and pure CO2 inclusions.
4.2.1.1 Type I inclusion
The NaCl–H2O type inclusions consist of two phases (liquid NaCl–H2O + vapor H2O) at room temperature and account for approximately 90% of all inclusions (Figures 6a–d). The liquid phase dominates, with the vapor phase comprising 5%–30% of the inclusion volume, mostly between 5% and 10%. Type I inclusions exhibit oval, nearly round, or irregular shapes. Smaller inclusions have a long axis ranging from 4 to 12 μm, while larger inclusions can reach up to 30 μm. NaCl–H2O type inclusions hosted in quartz occur in almost all mineralization stages.
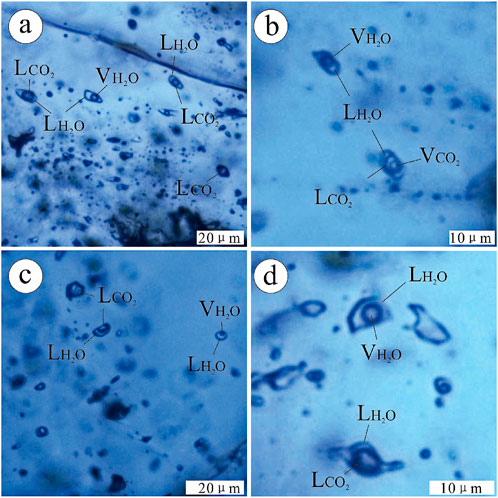
Figure 6. Microphotographs of fluid inclusions in quartz from the Ashawayi gold deposit. (a) Inclusions of types I (H2O–NaCl), II (CO2–H2O), and III (CO2) in the same sample (immiscibility); (b) types I (H2O–NaCl) and II (CO2–H2O) co-existed in the middle stage (immiscibility); (c) types I, II, and III co-existed in the middle stage (immiscibility); (d) types I (H2O–NaCl) and II (CO2–H2O) in the late stage. Abbreviations: VH2O, vapor H2O; LH2O liquid H2O; VCO2, vapor CO2; LCO2, liquid CO2.
4.2.1.2 Type II inclusion
Comprising approximately 10% of total inclusions, these CO2-bearing aqueous solution inclusions primarily consist of two phases (liquid H2O–NaCl + liquid CO2) at room temperature. Occasionally, three-phase inclusions (liquid H2O–NaCl + liquid CO2 ± vapor CO2) are observed (Figures 6b, c). Type II inclusions are more prevalent in the early stage than the middle stage and are underdeveloped in the late stage. This type of inclusion is further divided into two subtypes: Type II1 inclusions, which contain lower concentrations of CO2 (Figure 6b), and Type II2 inclusions, which are richer in CO2 (Figure 6c). Type II1 inclusions constitute 10%–50%, while Type II2 inclusions make up 50%–90%. The long axes of Type II inclusions range from 5 to 35 μm, which are larger than those of Type I inclusions. These inclusions are oval or irregular and show minor elongation signs.
4.2.1.3 Type III inclusions
Representing less than 1% of the total inclusions, these inclusions consist solely of pure CO2 and predominantly occur in the early and middle stages. They can be either single-phase or two-phase. Upon freezing, single-phase inclusions produce vapor CO2. Type III inclusions are oval, strip-like, or irregular, with long axes measuring 5–25 μm.
4.2.2 Laser Raman spectrum analysis
The measurement and analysis of various types of fluid inclusions (Figure 7) reveal that Type I (H2O–NaCl) inclusions are present across mineralization stages. Consequently, representative Type II (CO2–H2O) and Type III (pure CO2) inclusions with varying CO2/H2O ratios are selected for further analysis. The results indicate that in addition to the characteristic peaks of the host mineral quartz, distinct peaks corresponding to CO2 and liquid H2O are also observed. The components identified from the laser Raman spectrum are consistent with those of types I, II, and III inclusions within the H2O–CO2–NaCl system. Notably, no CH4 peaks were detected, likely due to the extremely low abundance of CH4 inclusions, which is insufficient for detection.
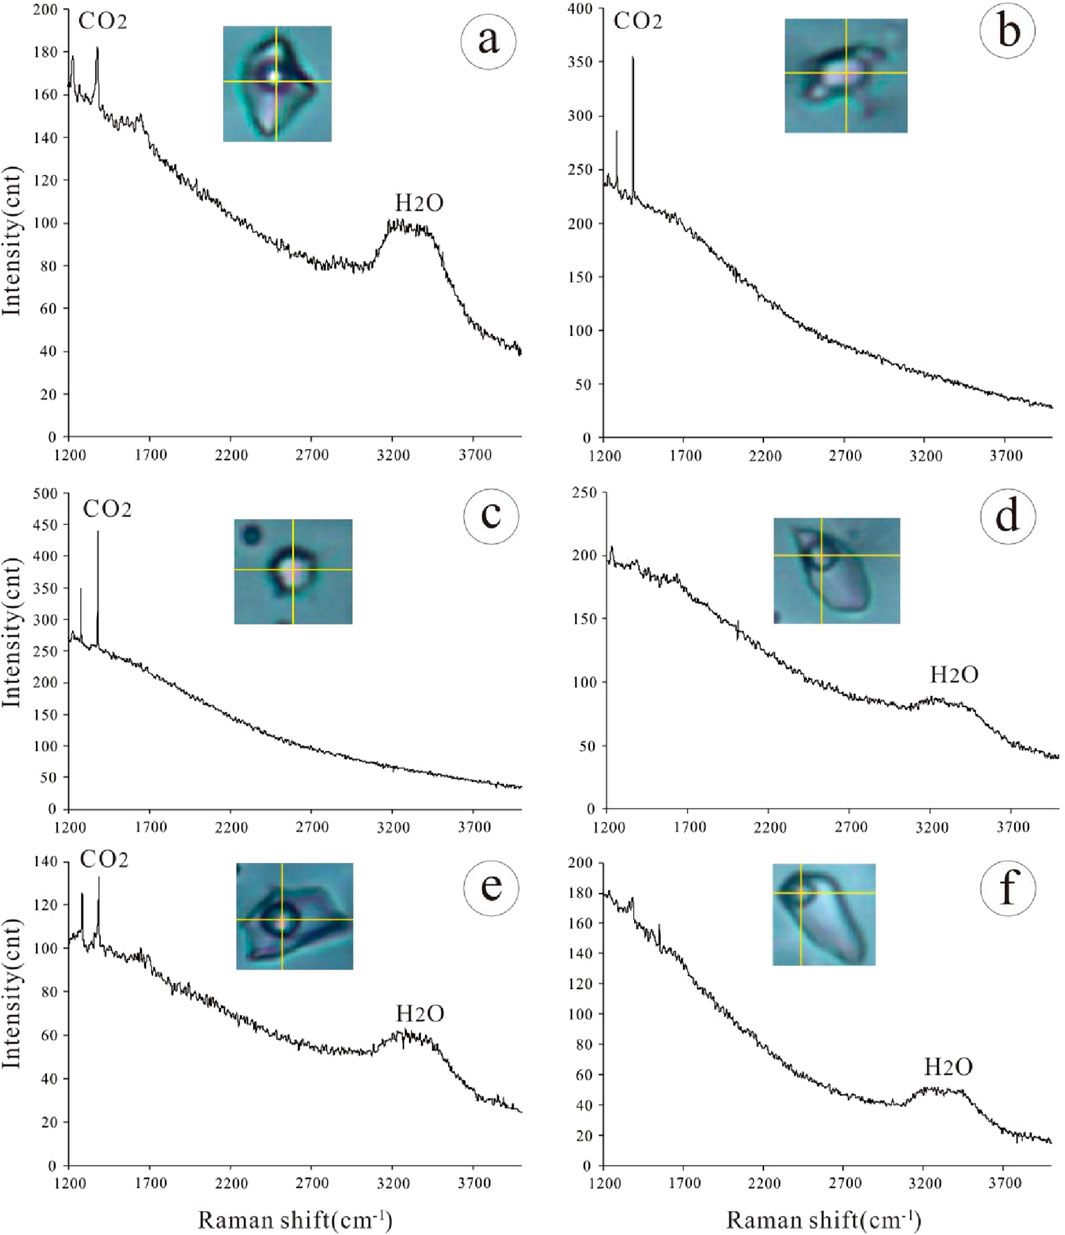
Figure 7. Laser Raman spectrum of vapor phases within fluid inclusions in quartz from the Ashawayi gold deposit. (a) Type II1 inclusion from the early-stage barren quartz vein; (b) Type II2 inclusion from the middle-stage auriferous quartz vein; (c) Type III inclusion from the middle-stage auriferous quartz vein; (d) Type I inclusion from the middle-stage auriferous quartz vein; (e) Type II1 inclusion from the late-stage quartz vein; (f) Type I inclusion from the late-stage quartz vein.
4.2.3 Homogenization temperature and salinity of fluid inclusion
The homogenization temperature (T) and salinity of fluid inclusions were obtained from 147 fluid inclusions across three stages, derived from 16 samples (Table 2). The ice-melting temperature (Tm,ice) is used to calculate the salinity of two phases (vapor and liquid) of fluid inclusions, following the formula presented by Hall et al. (1988). For the CO2-bearing H2O solution, salinity was calculated using the FLINCOR program developed by Brown (1989).
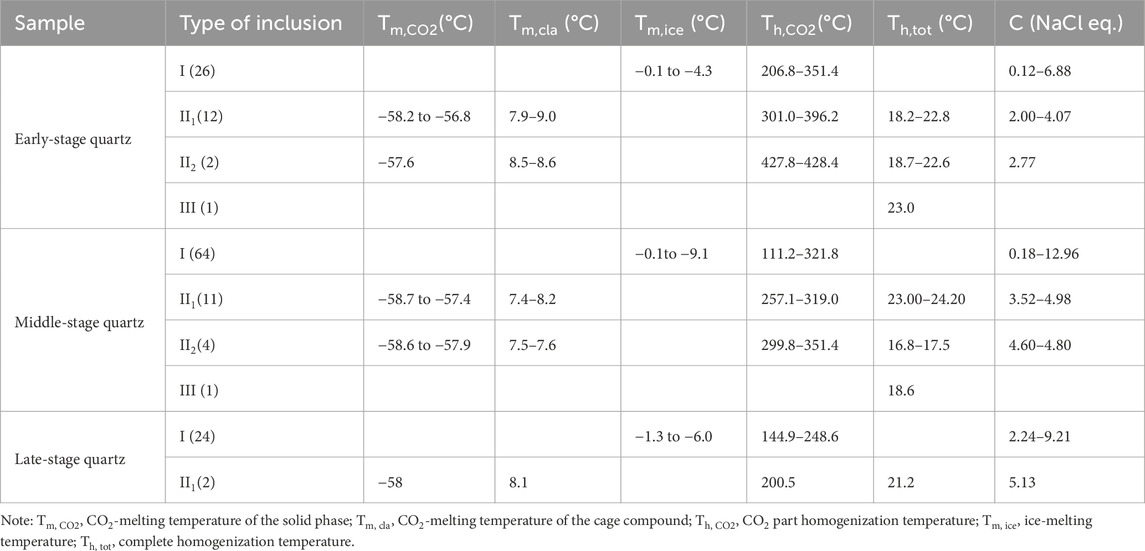
Table 2. Microthermomeric data on fluid inclusions in quartz from the Ashawayi gold deposit.
The types and proportions of fluid inclusions vary significantly across each mineralization stage. In the early non-mineralized stage, H2O–NaCl inclusions (Type I) account for 75%, followed by CO2–H2O inclusions (Type II), and pure CO2 inclusions (Type III) are less than 1%. During the middle quartz–polymetallic sulfide stage, which is the main mineralization phase, the proportion of H2O–NaCl inclusions (Type I) increases to approximately 90%, while the proportion of CO2–H2O inclusions (Type II) decreases significantly to approximately 10%, compared to the early ore-free stage with minimal sulfide content. In the late quartz–carbonate stage, H2O–NaCl inclusions (Type I) remain predominant, with occasional occurrences of CO2–H2O inclusions (Type II). From the early to the late stage, the number of CO2–H2O inclusions (Type II) gradually decreases.
The homogenization temperature of fluid inclusions exhibits two peaks in each stage (Figure 8). The homogenization temperature peak concentrations of quartz inclusions in different stages show a generally consistent superposition phenomenon, such as the overlap of low-temperature peaks in the early and middle stages and high-temperature peaks in the late stage. This indicates the superposition effect of fluids from the middle and late stages on minerals formed in the early stage. Specifically, the homogenization temperature range for quartz inclusions in the early stage is 320°C–360°C, while that in the late stage is concentrated between 180°C and 200°C, excluding factors affecting fluid superposition. The presence of two peaks (220°C–250°C and 280°C–300°C) in the middle stage may not result from vein superposition but rather from the presence of different inclusion types. The low-temperature peak (220°C–250°C) corresponds to the homogenization temperature of H2O–NaCl inclusions (Type I), while the high-temperature peak (280°C–300°C) primarily represents the homogenization temperature of CO2–H2O inclusions (Type II). This result may be related to fluid inclusions trapped in an immiscible system.
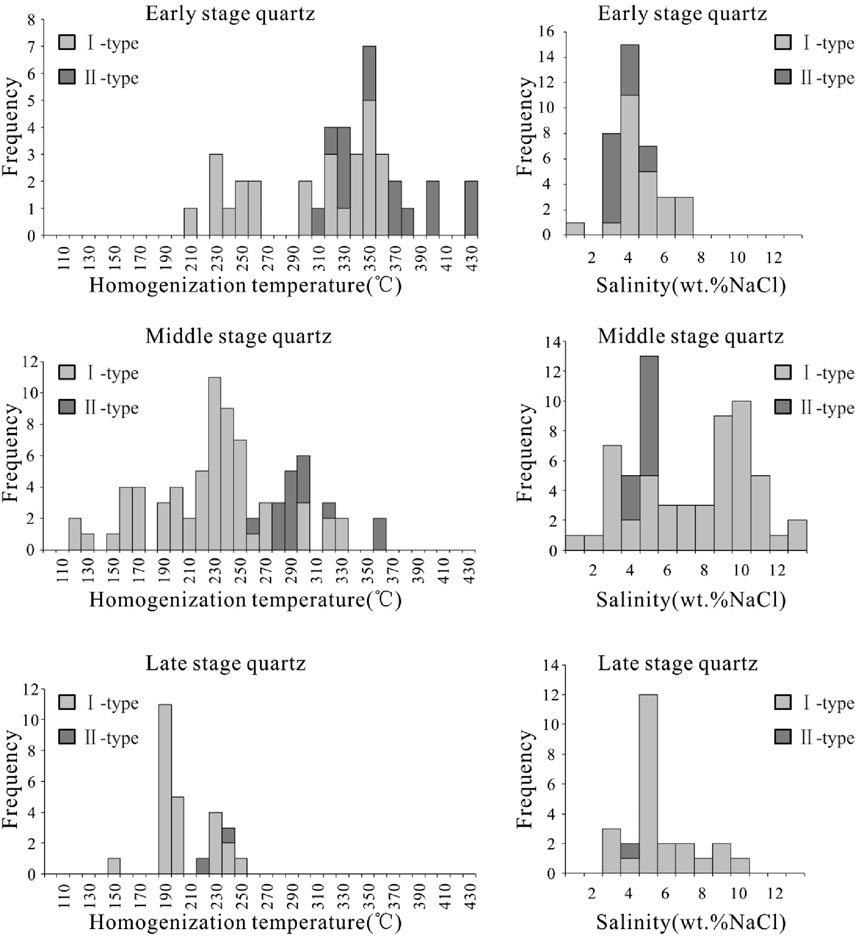
Figure 8. Histograms of salinities and homogenization temperatures of fluid inclusions in quartz from different mineralization stages of the Ashawayi gold deposit.
The salinity of fluid inclusions in each stage is generally low (Figure 8). The peak salinity range for quartz fluid inclusions in the early stage is the lowest (3%–5% NaCl.eqv), concentrated at approximately 4% NaCl.eqv. The salinity of the fluid inclusions in the middle stage is generally higher than that in the early stage, with salinity increasing as temperature decreases, resulting in two peaks. Type II inclusions are predominantly found in the low-salinity region, while Type I inclusions are found in the high-salinity region. The peak salinity range for fluid inclusion in late-stage quartz is generally lower than that in middle-stage quartz.
4.3 H–O–S isotopes
4.3.1 H–O isotopes
A total of 14 quartz samples from the middle mineralization stage were selected for H–O isotope analysis. The results are summarized in Table 3, where δ18OW was calculated using the oxygen isotope equilibrium fractionation equation 10001nαquartz-water = 3.38 × 10⁶/T2−3.40 (Clayton et al., 1972), based on the homogeneous temperature of fluid inclusions and the oxygen isotope balance between quartz and water, while the remaining values were measured directly.
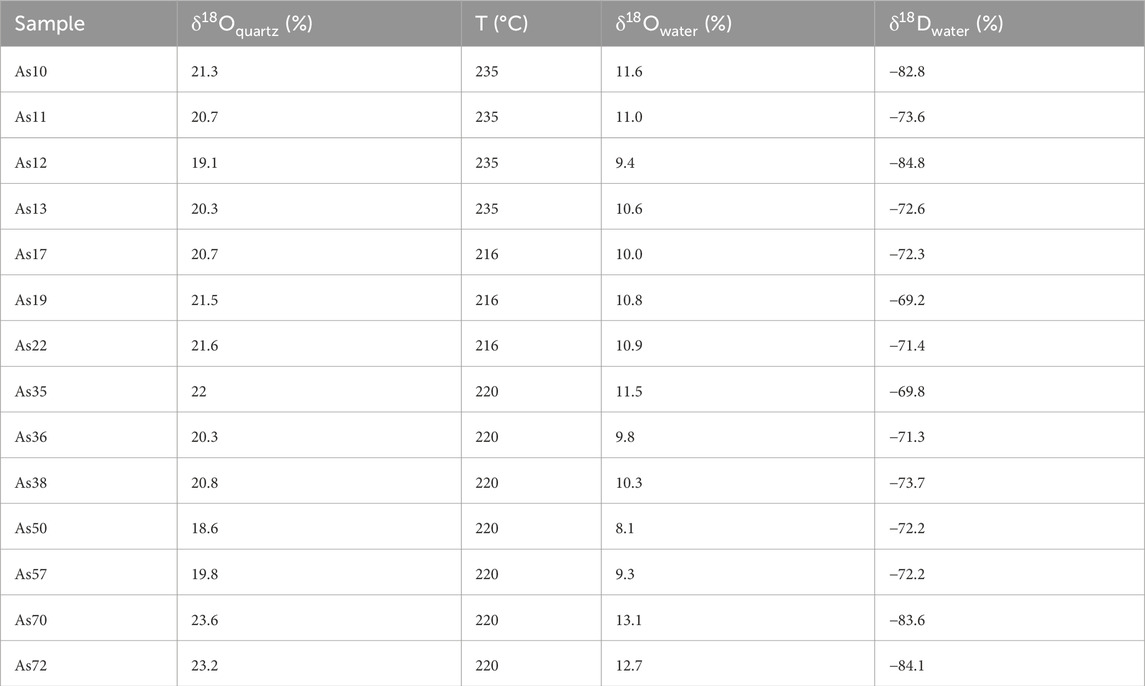
Table 3. H–O isotopic compositions in the fluid inclusions of quartz separated from ores in the Ashawayi gold deposit.
4.3.2 Sulfur isotopes
Twelve samples, including nine pyrite, one arsenopyrite, and two stibnite samples, were collected from gold ore bodies in the Ashawayi gold deposit. Their δ34S values range from 13.8‰ to 24.4‰ (Table 4). Specifically, pyrite and arsenopyrite, as gold-hosting minerals, exhibit δ34S values ranging from 16.8‰ to 24.4‰, with an average of 18.6‰. Four samples of pyrite and arsenopyrite from wall rocks (phyllite or siltstone) have δ34S values ranging from 17.1‰ to 18.5‰. Two samples from the fine-grained diorite rock have δ34S values ranging from −6.9‰ to 1.5‰. Notably, δ34S values of the ore bodies are similar to those of the wall rocks but differ significantly from those of the granitic rocks.
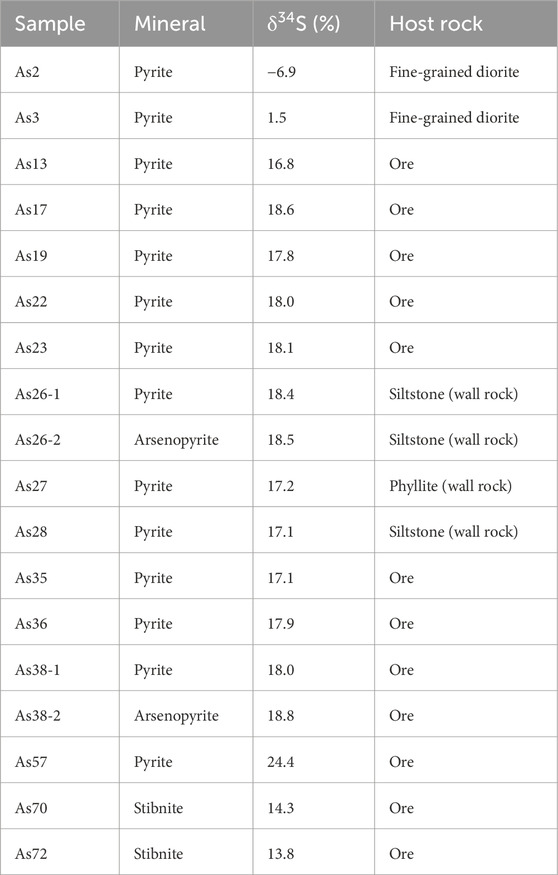
Table 4. Sulfur isotopic compositions of sulfides from the Ashawayi gold deposit.
5 Discussion
5.1 Genetic type of deposit
Orogenic gold deposits form during compressional to transpressional deformation processes at convergent plate margins in accretionary and collisional orogens. These deposits exhibit temporal and spatial association with orogeny (Groves et al., 1998). They display similar geodynamic settings and geochemical characteristics, forming at various depths ranging from the earth’s surface to 2–20 km, including the superficial zone (<6 km), middle zone (6–12 km), and deep zone (>12 km) (Groves et al., 1998). As an important mineralization type, 23 gold deposits worldwide, each with reserves exceeding 500 t, belong to the orogenic gold deposit category (Bierlein et al., 2006). Since the concept of orogenic gold deposits was introduced, extensive research has been conducted on their tectonic settings, mineralization characteristics, formation ages, ore-forming fluid features, and mineralization mechanisms (Bierlein and Maher, 2001; Wilde et al., 2001; Goldfarb et al., 2001; Groves et al., 2003; Mao et al., 2002; Chen YJ et al., 2004; Chen YJ, 2006; Bodnar et al., 2014; Derek et al., 2016; Damien, 2019). Concurrently, numerous orogenic-type gold deposits have been discovered.
A comprehensive comparison (Table 5) between the Ashawayi gold deposit and the typical orogenic gold deposit was carried out regarding geological and mineralization fluid characteristics (Groves et al., 1998; Kerrich et al., 2000; Goldfarb et al., 2001; Chen YJ, 2006; Chen Y. J. et al., 2007). The Ashawayi gold deposit shares many similarities with the typical orogenic gold deposit, including structural environment, host rock features, ore-controlling structures, ore body shapes, ore types, mineral assemblages, fluid inclusion types, fluid properties, original fluid characteristics, main mineralization temperature, fluid pressure system, and fluid evolution. Therefore, we propose that the genetic type of the Ashawayi gold deposit is defined as an orogenic gold deposit.
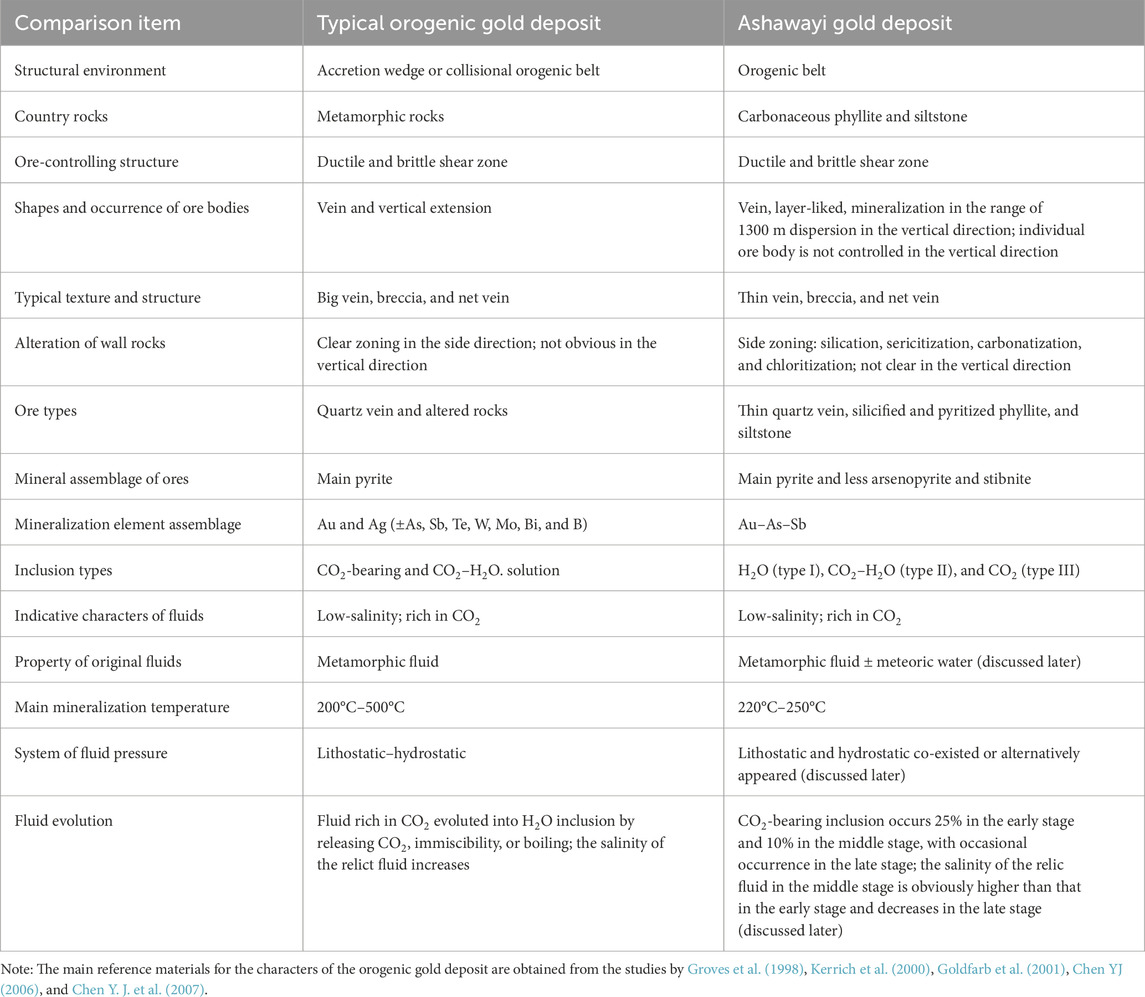
Table 5. Comparison of key features between the Ashawayi gold deposit and orogenic deposits.
5.2 Fluid immiscibility and gold enrichment and deposition
The heterogeneous capture of fluid inclusions is prevalent in the Ashawayi gold deposit, with types I, II, and III inclusions coexisting within the same sample (Figure 6c). Two distinct types of fluid inclusions with differing characteristics occur in close association within the same sample, indicating simultaneous trapping. The simultaneous capture of fluids with distinct properties by minerals is most likely caused by heterogeneous trapping, which is an important indicator of fluid immiscibility or mixing (Ramboz et al., 1982; Roedder, 1984). The evolution of salinity and homogenization temperature of fluid inclusions during each metallogenic stage further supports the occurrence of fluid immiscibility: ① from the early to the middle stage of mineralization, fluid salinity increases and disperses as temperature decreases, contradicting the general trend that solubility decreases with decreasing temperature. High salinity predominantly occurs in type I inclusions, while type II inclusions are mainly characterized by low salinity (Figures 8, 9). This phenomenon may result from fluid concentration due to the escape of the gas phase, i.e., boiling. ② Some fluid inclusions exhibit varying salinities within approximately the same temperature range. Thus, the metallogenic process of the Ashawayi gold deposit resembles that of most vein-type mesothermal hydrothermal deposits worldwide, where fluid immiscibility plays a significant role in gold deposit formation (Drummond SE and Ohmoto H, 1985; Cox et at., 1995; McCuaig and Kerrich, 1998; Sibson et al., 1988; Jia et al., 2000; Chen YJ et al., 2005; Chen et al., 2006; Chen et al., 2012a; Chen et al., 2012b; Chen B et al., 2019; Skinner, 1997; Wilkinson, 2001). Between 320°C and 360°C, the fluid underwent its first immiscibility event, leading to the formation of various types of fluid inclusions through heterogeneous trapping. During this stage, initial gold mineralization occurred, although it was generally low, forming quartz veins with little to no mineralization. In the temperature range of 220°C–300°C, primarily between 220°C–250°C, secondary fluid immiscibility occurred after the early fluid evolution stage. This resulted in higher salinity in the liquid phase and the formation of low-salinity and gas-rich inclusions, specifically high-salinity type I inclusions and low-salinity type II inclusions. Continuous CO2 escape from the fluid ore-forming system led to fluid concentration and supersaturation, promoting the rapid precipitation of ore-forming materials (Sui et al., 2000; Chen H. Y. et al., 2007; Chen et al., 2012a; Chen et al., 2012b). Meanwhile, the escape of CO2 will disrupt the stability of the Au(HS)2- complex in the fluid, prompting the decomposition of the Au(HS)2- complex and leading to the enrichment and precipitation of Au. The reaction equations are as follows:
①: 4Au(HS)2- + C + 4H+ + 2H2O = 4Au + CO2 + 8H2S (Craw, 2002; Craw et al., 2007; Zoheir et al., 2008; Hu et al., 2015; 2017; Damien, 2019).
②: 2HCO3− + Au(HS)2- + Fe3+ = Au + FeS2 + 2H2O+ 2CO2 (Zhang et al., 2012).
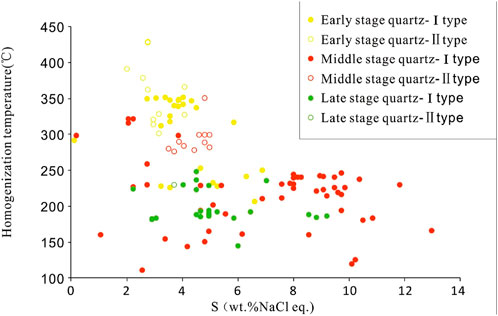
Figure 9. Homogenization temperature–salinity plots for fluid inclusion.
In conclusion, secondary fluid immiscibility is thus a critical mechanism for gold enrichment and precipitation. Additionally, the water–rock reaction between the fluid and the surrounding rock may contribute to gold precipitation to some extent. These reactions not only extract ore-forming substances from the surrounding rock to promote fluid saturation but also consume H2O during the reaction, further enhancing fluid concentration. For example, C + 2H2O = CO2 + 2H2 (Cox et al., 1995; Naden and Shepherd, 1989). In the late stage, at temperatures between 180°C and 200°C, fluid immiscibility becomes less pronounced, characterized by temperature decrease. This stage is marked by occasional type II inclusions, absence of type III inclusions, homogenization of the fluid to the liquid phase, and decreased fluid salinity. Quartz–carbonate veins develop during this stage, with very weak or nominal mineralization.
5.3 Pressure and depth estimation of the ore-forming fluid
The homogenization temperature (T) and pressure (P) of fluid inclusions trapped in the fluid boiling state are theoretically equal to the temperature and pressure at the time of trapping (Pichavant et al., 1982; Ramboz et al., 1982; Brown, 1998). However, this hypothetical condition does not apply to the Ashawayi gold deposit. As previously discussed, the fluids in the Ashawayi gold deposit underwent a complex inhomogeneous trapping process. Nevertheless, the mineralization depth was estimated using the homogenization pressure of fluid inclusions as the minimum trapping pressure.
After excluding homogenization temperatures from the main mineralization stage that were influenced by late-stage fluids (homogenization T < 200°C), the depth is estimated using all remaining Type I and Type II inclusions, based on the minimum capture pressure. The pressures of types I and II inclusions are estimated based on the methods described by Bodnar and Vityk (1994) and the FLINCOR Program proposed by Brown (1989), respectively. The H2O–CO2–NaCl system was selected to estimate the mineralization depth. The results show two distinct pressure ranges: a low-pressure range (16.2–36.7 MPa) and a high-pressure range (75.0–103.6 MPa). The uncertainty in estimating the fluid capture depth (mineralization depth) makes it difficult to determine whether the estimated capture pressure is lithostatic or hydrostatic, which depends on the degree of opening and closing of the fault (Roedder, 1984). Fluid immiscibility indicated by fluid inclusions has special implications for the hydrodynamics of mineralization. One of the major causes of fluid immiscibility is the decrease in fluid pressure, which is directly related to fluid flow driving forces (Guoxiang and Steele-Macinnis, 2025). The co-existence or alternative appearance of lithostatic and hydrostatic pressure results from oscillations in fault healing and fracturing in orogenic gold deposits, as described using the Fault Valve Model (Sibson et al., 1988; Kerrich et al., 2000; Cox et al., 2001). When faults heal, fluids are under (super)lithostatic pressure due to tectonic overpressure, and when fracturing or hydrofracturing occurs, fluids are under hydrostatic pressure. The disappearance of vapor components removes heat, causing a decrease in the mineralization temperature and an increase in the salinity of the remaining fluid—sometimes to the point of oversaturation, thereby leading to the rapid deposition of ore-forming materials and subsequent fracture healing (Deng et al., 2008). Determining the values of these two types of pressures is crucial for accurate estimates. The mineralization depth remains relatively constant during the fluid deposition process, with pressure fluctuations triggered by changes between different pressure types. Lithostatic and hydrostatic pressures frequently change during fault closure and opening. If trapped fluid inclusions record both pressure types, the end members of the two pressure ranges can be considered. Since lithostatic pressure is higher than hydrostatic pressure at the same depth, the low-value pressure endmember is closer to hydrostatic pressure, while the high-value pressure endmember is closer to lithostatic pressure (Xu et al., 1995). The Ashawayi gold deposit is located in a thrust fault system. Ores’ fabric features indicate that the mineralization process experienced a transition from compressive stress to intense stress with multistage action characteristics, suggesting multiple fracture and closure processes that cause consistent fluctuations in fluid pressure.
Accordingly, we assume that the high- and low-pressure range fluids are under the pressure systems of static rock pressure and static hydrostatic pressure, respectively, and estimate them using the general formula for the pressure–depth relationship, P = ρgh, taking ρ as the average rock density of the mining area at 2.6 g/cm3 when the fluids are under the static rock pressure system and ρ as the density of various inclusions calculated at the time when the fluids are under the static hydrostatic pressure system. The corresponding fluid depth ranges are 1.8–4.2 km for the high-pressure range and 2.9–4.2 km for the low-pressure range. The high values of the depth ranges of the two are close, so the fluid may be in the depth range of 1.8–4.2 km due to the complex non-miscible process caused by the co-existence and alternation of static rock pressure and static hydrostatic pressure, resulting in the precipitation of gold. The following three points also directly or indirectly support the above viewpoint: (1) the estimated pressure range of Type II inclusions falls entirely within the low-pressure range, and the peak of the low-pressure range is located in the temperature range of 220°C–250°C, which is consistent with the result that Type I and Type II fluid inclusions are captured simultaneously by the fluid inclusions in the temperature range of 220°C–250°C due to the immiscibility of the fluid inclusions in this temperature range. (2) No Type II inclusions are found in the high-pressure range, only a part of Type I inclusions, i.e., no Type II inclusions are captured in the high-pressure peak range, which is consistent with the fact that the closed-system hydrofluids in the static rock pressure system do not undergo obvious immiscibility. (3) Type I inclusions account for the majority of the total inclusions in the temperature range of 220°C–250°C, which is considered representative of the mineralization conditions.
It is noteworthy that the homogenization temperature range (220°C–250°C) under low-pressure conditions is comparable to the peak values observed in well-known mesothermal gold deposits such as the Muruntau, Kumtor, and Sawayaerdun deposits (Ivanove, 2000; Wilde et al., 2001; Graupner et al., 2001; Chen et al., 2012a) and other typical mesothermal vein-type gold deposits (Spooner et al., 1987; Goldfarb et al., 1989; Fan et al., 2003; Zhang et al., 2009; Hagemann and Luders, 2003). However, the corresponding mineralization depth (1.8–4.2 km) is significantly shallower than that of the Sawayaerdun gold deposit in Chinese Tianshan (Chen et al., 2012a).
5.4 Origins of ore-forming fluids and components
The δ18O values of mineralized quartz from the Ashawayi gold deposit range from 18.6‰ to 23.6‰ (Table 3; Figure 10). These values are higher than those of most lode gold deposits (δ18O = 10‰–18‰) (Kyser et al., 1986; Kerrich, 1987; Goldfarb et al., 1991; 1997; McCuaig and Kerrich, 1998; Ivanove, 2000; Kerrich et al., 2000; Jia et al., 2001; Chen et al., 2012b) but are similar to those of the Sawayaerdun gold deposit in southwestern Tianshan, China (Chen et al., 2012b). The elevated δ18Oquartz values compared to those of other vein-type gold deposits (commonly in the temperature of 300°C–350°C; Ridley and Diamond, 2000) were likely caused by strong isotope fractionation under low-mineralization temperature conditions. The calculated δ18O values of the mineralization fluid range from 8.1‰ to 13.1‰, which is consistent with those of most lode deposits.
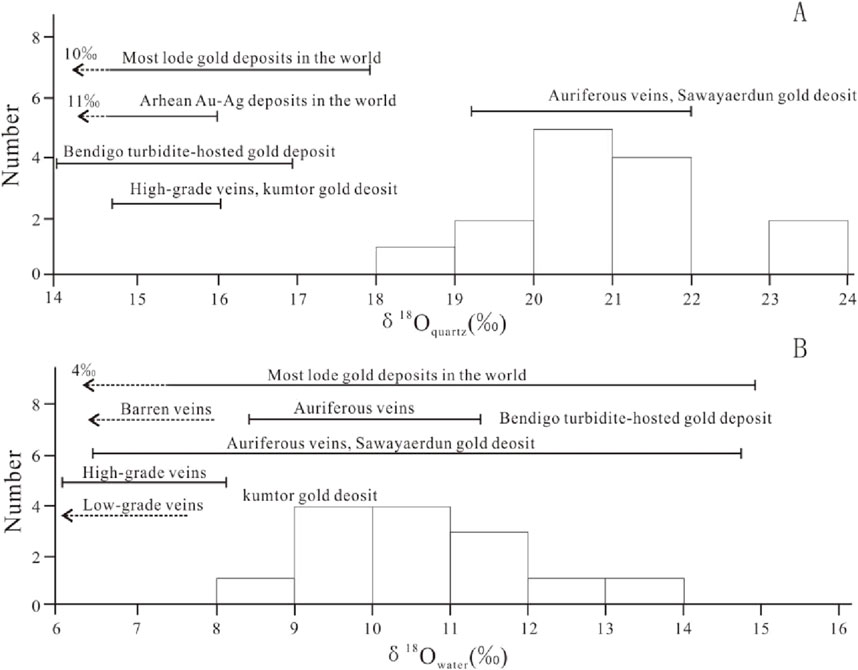
Figure 10. Oxygen isotopic compositions of quartz (A) and ore-forming fluids (B). References for the isotopic ranges of deposits are given in the text.
The δ18D values of the mineral-forming fluid range from −84.8 to −69.2‰ (Table 3; Figure 11). This range falls within that of most vein-type gold deposits (Kerrich, 1987; McCuaig and Kerrich, 1998; Ridley and Diamond, 2000; Chen et al., 2012b), but the interval is narrower than that of the Juneau gold mineralization belt in Alaska, United States (Goldfarb et al., 1991), and the Sawayaerdun gold deposit in China (Chen et al., 2012b). The peak value of δ18Dwater in the range of −68 to −72‰ is close to the δ18Dwater value of meteoric water (-70‰) in the Tianshan region, suggesting that part of the mineralization fluid may be derived from atmospheric precipitation. However, according to the low δ18Dwater value (<−80%) obtained from lode gold deposits hosted by carbonaceous turbidite, the fluid is also sourced from reactions between deep-source non-atmospheric water and organic substances in the host rock, leading to depleted δ18Dwater (Goldfarb et al., 1989; McCuaig and Kerrich, 1998; Jia et al., 2001). As shown in Figure 12, the mineralization fluid of the Ashawayi gold deposit plots to the right of the metamorphic and igneous water fields, consistent with most vein-type gold deposits. It is comparable to the Juneau orogenic gold deposit belt (Goldfarb et al., 1991) and the Sawayaerdun gold deposit (Yang et al., 2006; Chen et al., 2012b). In conclusion, the fluids of the Ashawayi gold deposit are likely derived from a mixture of metamorphic fluid and meteoric water.
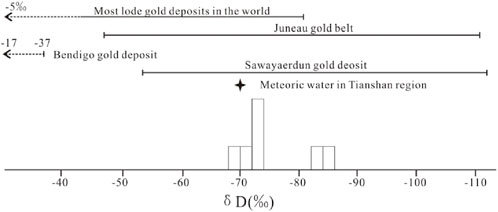
Figure 11. Hydrogen isotopic compositions of the ore-forming fluids at the Ashawayi gold deposit. Reference for the isotopic ranges of other deposits and meteoric water are given in the text.
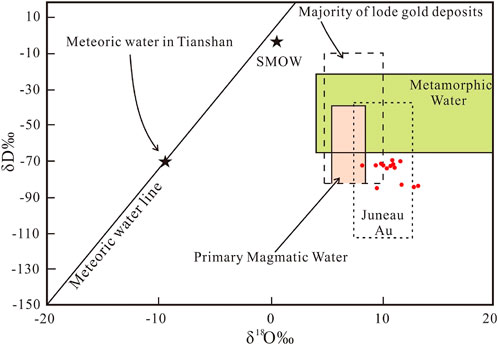
Figure 12. Calculated δD and δ18O values of the fluid at the Ashawayi gold deposit. References for the fields of other deposits are given in the text [Fields for magmatic and metamorphic waters are obtained from Taylor (1997)].
The amount of sulfides increases significantly from the early to the main mineralization phase, while the ratio of CO2–H2O inclusions to total inclusions decreases markedly. This indicates a transition in the mineralized fluid from high oxygen fugacity during the early stage to low oxygen fugacity during the main stage. This feature is consistent with the low SO2/H2S redox level observed in most orogenic gold deposits (Phillips and Groves, 1983; Mikucki and Ridley, 1993; McCuaig and Kerrich, 1998; Jia et al., 2000; Kerrich et al., 2000). At low oxygen fugacity and moderate temperature (220°C–250°C), S isotope fractionation between sulfide and fluid is generally minimal (<2%, Ohmoto and Goldhaber, 1997). Therefore, the δ34SV-CDT values of sulfide and fluid in the main mineralization stage are similar.
The sulfides from orogenic gold deposits exhibit a wide range of δ34SV-CDT values, but the range of the S isotope in the S-complexion of mineralization fluid remains inconclusive (McCuaig and Kerrich, 1998; Goldfarb et al., 2005). For example, the δ34SV-CDT values of sulfides in Archean orogenic gold deposits range from 0‰ to 9‰ (Kerrich, 1987; Golding et al., 1990; McCuaig and Kerrich, 1998), whereas those in Phanerozoic orogenic gold deposits range −20‰–25‰ (Peters and Golding, 1989; Kontak et al., 1990). The δ34SV-CDT values of pyrite, arsenopyrite, and stibnite in the ore bodies range from +13.8‰ to 24.4‰ (Table 4). Specifically, pyrite and arsenopyrite, as gold-carrying minerals, have δ34SV-CDT values ranging from +16.8‰ to 24.4‰, with an average of +18.3‰. These values fall within the ranges typical of metamorphic and sedimentary rock and are significantly higher than those of basaltic and granitic rocks. They are consistent with the δ34SV-CDT values (17.1‰–18.5‰) of pyrite and arsenopyrite in phyllite and siltstone, which are the wall rocks of the ore bodies. In contrast, the δ34SV-CDT values (−6.9‰–1.5‰) of the rock body in the diggings (Figure 13) indicate that the ore components are derived from wall rocks. Compared with that in other well-known orogenic gold deposits, such as the Juneau gold belt (Goldfarb et al., 1989), the Bendigo in Australia (Jia et al., 2001), the Kumtor in Kyrgyzstan (Ivanove, 2000), and the Sawayaerdun in China (Chen et al., 2012b), the positive anomaly of δ34SV-CDT in the Ashawayi gold deposit suggests that the sulfur in the ores originates primarily from a shallow position within the orogenic belt and upper crust.
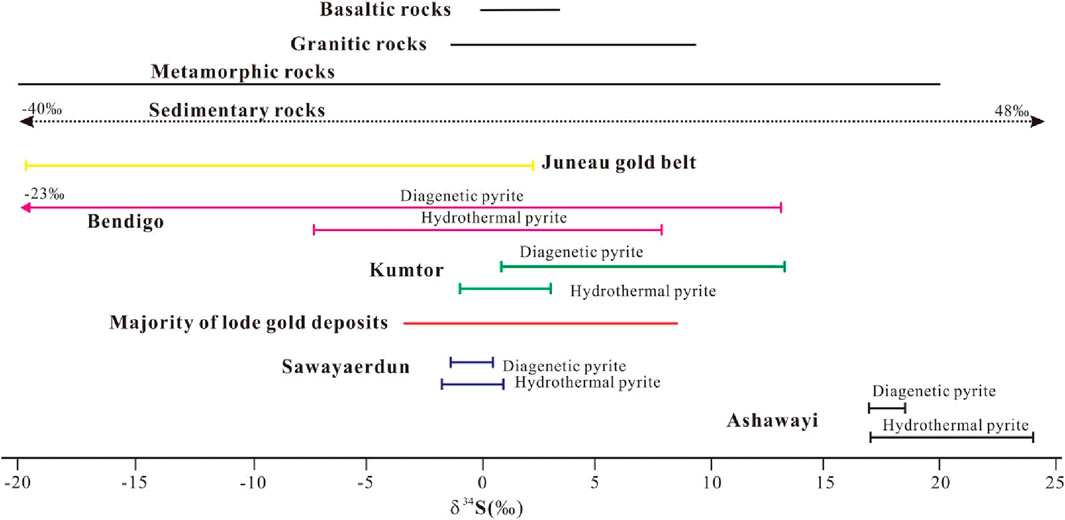
Figure 13. δ34S values of diagenetic and hydrothermal pyrites at the Ashawayi gold deposit. References for the ranges of major sulfur reservoirs and other deposits are given in the text.
5.5 Comparison of metallogenic setting and prospecting direction
Numerous giant and ultra-large orogenic gold deposits have been discovered in the Southern Tianshan region of Central Asia. In contrast, only one ultra-large deposit, Sawayaerdun, has been identified in Southern Tianshan in Xinjiang Province. Although the Ashawayi gold deposit ranks second in scale, it is only moderately large and has relatively low gold grades. To understand the significant disparity in gold scale and ore grade between deposits formed within the same geological evolution history, we compare factors such as the ore-hosting formation background, structural superposition, magmatic activity, and ore denudation. The reasons for the lower size and grade of the Southern Tianshan deposits in Xinjiang Province than those in Central Asia can be summarized as follows: (1) the ore-hosted strata in the Southern Tianshan of Xinjiang Province are relatively young and thin and have a low carbon content, lacking a material basis for large-scale gold mineralization. (2) The crust in the Southern Tianshan of Xinjiang Province is relatively thick, leading to shallow fracture depths, limited denudation, weak deformation, and low metamorphism. (3) Magmatic activity in the Southern Tianshan of Xinjiang Province is relatively weak, resulting in less intense crust–mantle interaction and a relative lack of magmatic activation and re-enrichment processes for gold.
Based on this analysis, future prospecting efforts at Ashawayi should focus on strata with high carbon content formations and areas subject to strong structural deformation and metamorphism, such as the intersection of low-angle and high-angle faults to the northeast of the mining area.
6 Conclusion
(1) The Ashawayi gold deposit is classified as an orogenic gold deposit in the Southern Tianshan. It shares similar characteristics with most orogenic gold deposits worldwide in terms of ore-forming structural environments, fluid characteristics and evolution, mechanisms of gold enrichment, and estimates of ore-forming conditions (temperature and pressure).
(2) The mineralization process can be divided into three stages: the early stage is a quartz-growth stage with minimal or no mineralization; the intermediate stage is a quartz–polymetallic sulfide stage; the late stage is a quartz–carbonatization stage.
(3) Three types of fluid inclusions have been identified, namely, NaCl–H2O, CO2-bearing aqueous solution, and pure CO2. Fluid inclusion temperature ranges from 320°C to 360°C in the early stage and 220°C–300°C in the late stage, indicating that the Ashawayi gold deposit belongs to the medium–low temperature hydrothermal deposit. Distinct fluid immiscibility features are observed from the early to the intermediate stage, with continuous CO2 release. In the main mineralization stage, low homogenization pressures (16.2–36.7 MPa) and high homogenization pressures (75.0–103.6 MPa) suggest the co-existence or alternation of hydrostatic and lithostatic pressure systems at depths of 1.8–4.2 km. Fault healing and fracturing, controlled by fault–valve action, induce secondary fluid immiscibility, which is a critical mechanism for gold enrichment and deposition.
(4) The H–O–S isotopic characteristics of the mineralization fluid indicate that ore components are derived from the country rocks, while the ore-forming fluids originate from metamorphic fluid and meteoric water.
Data availability statement
The original contributions presented in the study are included in the article/supplementary material; further inquiries can be directed to the corresponding authors.
Author contributions
BC: Investigation, Methodology, Project administration, and Writing – original draft. HC: Data curation, Formal analysis, Writing – review and editing. WX: Data curation, Methodology, Writing – review and editing. YW: Data curation, Supervision, Writing – review and editing. YZ: Supervision, Validation, Writing – review and editing.
Funding
The author(s) declare that financial support was received for the research and/or publication of this article. This study was supported by the China Geological Survey project (Project No. DD20230053).
Acknowledgments
The authors would like to express their gratitude to the staff members of Hadli Mining Limited Company affiliated with the Ashawayi gold deposit in Aheqi County for their invaluable help and support during the fieldwork. Sincere acknowledgements are given to Engineer Liang-Liang Huang from the Institute of Geology and Geophysics, Chinese Academy of Sciences, and Qun-Ye Xiu from the Beijing Research Institute of Uranium Geology for their assistance during the analysis. The authors also thank Qiong-Yan Yang from China University of Geosciences for her kind support and valuable discussion during the preparation and writing of this paper. Special thanks are extended to Professor Ke-Zhang Qin from the Institute of Geology and Geophysics, Chinese Academy of Sciences, for his supervision.
Conflict of interest
The authors declare that the research was conducted in the absence of any commercial or financial relationships that could be construed as a potential conflict of interest.
Publisher’s note
All claims expressed in this article are solely those of the authors and do not necessarily represent those of their affiliated organizations, or those of the publisher, the editors and the reviewers. Any product that may be evaluated in this article, or claim that may be made by its manufacturer, is not guaranteed or endorsed by the publisher.
References
Abzalov, M. (2007). Zarmitan granitoid-hosted gold deposit, TianShan belt. Uzb. Econ.Geol. 102 (3), 519–532. doi:10.2113/gsecongeo.102.3.519
Allen, M. B., Windly, B. F., and Zhang, C. (1993). Palaeozoic collisional tectonics and magmatism of the Chinese Tien Shan, central Asia. Tcetonophysics 220 (1-4), 89–115. doi:10.1016/0040-1951(93)90225-9
Bierlein, F. P., Groves, D. I., Goldfarb, R. J., and Dubé, B. (2006). Lithospheric controls on the formation of provinces hosting giant orogenic gold deposits. Minera. Deposita 40, 874–886. doi:10.1007/s00126-005-0046-2
Bierlein, F. P., and Maher, S. (2001). Orogenic disseminated gold in phanerozoic fold belts - examples from Victoria, Australia and elsewhere. Ore Geol. Rev. 18 (1-2), 113–148. doi:10.1016/s0169-1368(01)00019-1
Bierlein, F. P., and Wilde, A. R. (2010). New constraints on the polychronous nature of the giant Muruntau gold deposit from wall-rock alteration and ore paragenetic studies. Aust. J. Earth. Sci. 57 (6), 839–854. doi:10.1080/08120099.2010.495705
Bodnar, R. J., Lecumberri-Sanchez, P., Moncada, D., and Steele-MacInnis, M. (2014). Fluid inclusions in hydrothermal ore deposits. Treatise Geochem., 119–142. doi:10.1016/b978-0-08-095975-7.01105-0
Bodnar, R. J., and Vityk, M. O. (1994). “Interpretation of microthermometric data for H2O-NaCl fluid inclusions,” in Fluid inclusions in minerals: methods and applications. Blacksberg: verginia Technology. Editors B. De Vivo, and M. L. Frezzotti, 117–130.
Brown, P. E. (1989). FLINCOR: a microcomputer program for the reduction and investig ation of fluid-inclusion data. Am. Minera. 74, 1390–1393. Available at: https://www.researchgate.net/publication/279895263
Brown, P. E. (1998). Fluid inclusion modeling for hydrothermal systems. Rev. Econ. Geol. 10, 51–171. doi:10.5382/rev.10.07
Chen, B., Hou, Q. L., Feng, H. Y., Guo, H., and Xu, Y. X. (2019). Fluid and sulfide component constraints on the genesis and prospecting implications of the Ashawayi gold deposit, South Tianshan, Xinjiang, NW China. Acta Petrol. Sin. 35 (7), 2086–2104. doi:10.18654/1000-0569/2019.07.09
Chen, H. Y., Chen, Y. J., and Baker, M. (2012a). Evolution of ore-forming fluids in the Sawayaerdun gold deposit in the Southwestern ChineseTianshan metallogenic belt, Northwest China. J. Asian Earth Sci. 49, 131–144. doi:10.1016/j.jseaes.2011.05.011
Chen, H. Y., Chen, Y. J., and Baker, M. (2012b). Isotopic geochemistry of theSawayaerdun gold deposit,Northwest China:Implications for oregenesis and mineral exploration. Chem. Geol. 310, 1–11. doi:10.1016/j.chemgeo.2012.03.026
Chen, H. Y., Chen, Y. J., Ni, P., Zhang, L., and Zhang, Z. J. (2007a). Chemical composition of fluid inclusions of the Sawayaerdun gold deposit, Xinjiang: implications for orogenesis and prediction. Acta Petrol. Sin. 23 (9), 2189–2197. Available online at: http://www.ysxb.ac.cn/data/article/aps/preview/pdf/aps_200709212.pdf
Chen, K., Tian, X. W., Yang, G. R., and Zhang, Y. T. (2007b). The geological Characteristics and exploration guides at the Ashawayi gold deposit. Xinjiang Geolory 25 (4), 348–388.
Chen, Y. J. (2006). Orogenic-type deposits and their metallogenic model and exploration potential. Geol. China 33 (6), 1181–1196. doi:10.12029/gc20060601
Chen, Y. J., Ni, P., Fan, H. R., Pirajno, F., Lai, Y., Su, W. C., et al. (2007c). Diagnostic fluid inclusions of different types hydrothermal gold deposit. Acta Petrol. Sin. 23 (9), 2085–2108. Available at: http://www.ysxb.ac.cn/data/article/aps/preview/pdf/aps_200709204.pdf
Chen, Y. J., Pirajno, F., Qi, J. P., Li, J., and Wang, H. H. (2006). Ore geology,fluid geochemistry and genesis of the Shanggong gold deposit,eastern Qinling Orogen. China. Resour. Geol. 56 (2), 99–116. doi:10.1111/j.1751-3928.2006.tb00272.x
Chen, Y. J., Pirajno, F., and Sui, Y. H. (2004). Isotope geochemistry of the Tieluping silver-lead deposit, Henan, China: a case study of orogenic silver-dominated deposits and related tectonic setting. Minera. Deposita 39 (5-6), 560–575. doi:10.1007/s00126-004-0429-9
Chen, Y. J., Pirajno, F., and Sui, Y. H. (2005). Geology and D-O-C isotope systematica of the tieluping silver deposit, henan, China: implications for ore genesis. Acta Geol. Sin. 79, 106–119. doi:10.1111/j.1755-6724.2005.tb00872.x
Clayton, R. N., O'Neil, J. R., and Mayeda, T. K. (1972). Oxygen isotope exchange between quartz and water. J. Geophys. Res. 77 (1), 3057–3067. doi:10.1029/jb077i017p03057
Cole, A., Wilkinson, J. J., Halls, C., and Serenko, T. J. (2000). Geological characteristics, tectonic setting and preliminary interpretations of the Jilau gold-quartz vein deposit, Tajikistan. Tajikistan. Minera. Deposita 35 (7), 600–618. doi:10.1007/s001260050266
Cox, S. F., Knackstedt, M. A., and Braun, J. (2001). Principles of structural control on permeability and fluid flow in hydrothermal system. Rev. Econ. Geol. 14, 1–24. doi:10.5382/rev.14.01
Cox, S. F., Sun, S. S., Etheridge, M. A., Wall, V. J., and Potter, T. F. (1995). Structural and geochemical controls on the development of turbidite-hosted gold quartz vein deposits, Wattle Gully mine, central Victoria, Australia. Econ. Geol. Bull. Soc. Econ. Geol. 90 (6), 1722–1746. doi:10.2113/gsecongeo.90.6.1722
Craw, D. (2002). Geochemistry of late metamorphic hydrothermal alteration and graphitisation of host rock, Macraes gold mine, Otago Schist, New Zealand. Chem. Geol. 191 (4), 257–275. doi:10.1016/s0009-2541(02)00139-0
Craw, D., MacKenzie, D. J., Pitcairn, I. K., Teagle, D. A. H., and Norris, R. J. (2007). Geochemical signatures of mesothermal Au-mineralized late-metamorphic deformation zones, Otago Schist, New Zealand. Geochem. Explor. Environ. Anal. 7 (3), 225–232. doi:10.1144/1467-7873/07-137
Damien, G. (2019). Parameters for the formation of orogenic gold deposits. Appl. Earth Sci. 128 (3), 124–133. doi:10.1080/25726838.2019.1583310
Deng, X. H., Li, W. B., Li, N., Mei, M., and Zhang, Y. (2008). Fluid inclusion constraints on the origin of Zhifang Mo deposit Songxian county, Henan province. Acta Geol. Sin. 24 (9), 2133–2148. Available at: http://www.ysxb.ac.cn/data/article/aps/preview/pdf/aps_20080922.pdf.
Derek, A. W., Cassidy., K. F., and Hollings, P. (2016). Orogenic gold and the mineral systems approach: resolving fact, fiction and fantasy. Ore Geol. Rev. 78, 322–335. doi:10.1016/j.oregeorev.2016.04.006
Drummond, S. E., and Ohmoto, H. (1985). Chemical evolution and mineral deposition in boiling hydrothermal systems. Econ. Geol. 80 (1), 126–147. doi:10.2113/gsecongeo.80.1.126
Fan, H. R., Xie, Y. H., Zhai, M. G., and Jin, C. W. (2003). A three stage fluid flow model for Xiaoqinling lode gold metallogenesis in the He’nan and Shanxi provinces, central China. Acta Petrol. Sin. 19 (2), 260–266. Available at: http://www.ysxb.ac.cn/data/article/export-pdf
Feng, H. Y., Ju, Y. W., Chen, B., Fang, W. X., Zhu, H. J., Li, W. Y., et al. (2021). Micro-nanoscale characteristics of pyrite and its implications for gold mineralization: two cases of gold deposits in the Youjiang Basin and Southwestern Tianshan Mountains. J. Nanosci. Nanot. 21, 246–261. doi:10.1166/jnn.2021.18744
Frimmel, H. E. (2008). Earth's continental crustal gold endowment. Earth Planet. Sci. Lett. 267, 45–55. doi:10.1016/j.epsl.2007.11.022
Gao, J., Klemd, R., Qian, Q., Zhang, X., Li, J. L., Jiang, T., et al. (2011). The collision between the Yili and Tarim blocks of the Southwestern Altaids: geochemical and age constraints of a leucogranite dike crosscutting the HP–LT metamorphic belt in the Chinese Tianshan Orogen. Tectonophysics 499 (1-4), 118–131. doi:10.1016/j.tecto.2011.01.001
Gao, J., Long, L. L., Klemd, R., Qian, Q., Liu, D. Y., Xiong, X. M., et al. (2009). Tectonic evolution of the South Tianshan orogen and adjacent regions, NW China: geochemical and age constraints of granitoid rocks. Int. J. Earth Sci. 98 (6), 1221–1238. doi:10.1007/s00531-008-0370-8
Gao, J., Long, L. L., Qian, Q., Huang, D. Z., Su, W., and Klemd, R. (2006). South tianshan: a late paleozoic or a triassic orogen? Acta Petrol. Sin. 22 (5), 1049–1061. Available at: http://www.ysxb.ac.cn/data/article/aps/preview/pdf/aps_200605112.pdf
Goldfarb, R. G., Baker, T., Dubé, B., Groves, D. I., Hart, C. J., and Gossellin, P. (2005). Distrabution, character, and genesis of gold deposits in metamorphic terranes. Econ. Geol. 100th Anniv. Volume, 407–450. doi:10.5382/av100.14
Goldfarb, R. J., Groves, D. I., and Gardoll, S. (2001). Orogenic gold and geologic time: a global synthesis. Ore Geol. Rev. 18 (1-2), 1–75. doi:10.1016/s0169-1368(01)00016-6
Goldfarb, R. J., Leach, D. L., Rose, S. C., and Landis, G. P. (1989). Fluid inclusion geochemistry of gold-bearing quartz veins of the Juneau gold belt, southeastern Alaska: implications for ore genesis. Econ. Geol. Monogr. 6, 363–375. doi:10.5382/Mono.06.28
Goldfarb, R. J., Miller, L. D., and Leach, D. L. (1997). Gold deposits in metamorphic rocks of Alaska. Econ. Geol. Monogr. 9, 151–190. doi:10.5382/mono.09.07
Goldfarb, R. J., Newberry, R. J., Pickthorn, W. J., and Gent, C. A. (1991). Oxygen, hydrogen, and sulfur isotope studies in the Juneau gold deposit, southeastern Alaska: constraints on the origin of hydrothermal fluids. Econ. Geol. Bull. Soc. Econ. Geol. 86 (1), 66–80. doi:10.2113/gsecongeo.86.1.66
Goldfarb, R. J., Taylor, R. D., Collins, G. S., Goryachev, N. A., and Orlandini, O. F. (2014). Phanerozoic continental growth and gold metallogeny of Asia. Gondwana Res. 25, 48–102. doi:10.1016/j.gr.2013.03.002
Golding, S. D., Groves, D. I., McNaughton, N. J., Mikucki, E. J., and Sang, J. H. (1990). Sources of ore fluid and ore components-sulphur isotope studies, (Perth, WA: Geology Department and University Extension, University of Wester Australia Publication), 20. 259–262.
Graupner, T., Kempe, U., Spooner, E. T. C., Bray, C. J., Kremenetsky, A. A., and Irmer, G. (2001). Microthermometric, laser Raman spectroscopic, and volatile-ion chromatographic analysis of hydrothermal fluids in the paleozoic Muruntau Au-Bearing quartz vein ore field, Uzbekistan. Econ. Geol. Bull. Soc. Econ. Geol. 96, 1–23. doi:10.2113/gsecongeo.96.1.1
Graupner, T., Niedermann, S., Keppe, U., Klemd, R., and Bechtel, A. (2006). Origin of ore fluids in the Muruntau gold system: constraints from noble gas, carbon isotope and halogen data. Geochim. Cosmochim. Ac. 70 (21), 5356–5370. doi:10.1016/j.gca.2006.08.013
Groves, D. I., Goldfarb, R. J., Gebre-Mariam, M., Hagemann, S. G., and Robert, F. (1998). Orogenic gold deposits: a proposed classification in the context of their crustal distribution and relationship to other gold deposit types. Ore Geol. Rev. 13 (1-5), 7–27. doi:10.1016/s0169-1368(97)00012-7
Groves, D. I., Goldfarb, R. J., Robert, F., and Hart, C. J. R. (2003). Gold deposits in metamorphic belts: overview of current understanding, outstanding problems, future research, and exploration significance. Econ. Geol. 98 (1), 1–29. doi:10.2113/gsecongeo.98.1.1
Guoxiang, C., and Steele-Macinnis, M. (2025). “Chapter 13-Application in mineral deposits,” in Fluid inclusion studies. Elsevier, 299–333.
Hagemann, S. G., and Luders, V. (2003). P-T-X conditions of hydrothermal fluids and precipitation mechanism of stibnite-gold mineralization at the Wiluna lode-gold deposits, Western Australia: conventional and infrared microthermometric constraints. Minera. Deposita 38, 936–952. doi:10.1007/s00126-003-0351-6
Hall, D. L., Sterner, S. M., and Bodnar, R. J.(1988). Freezing point depression of NaCl-KCl-H2O solutions. Economic Geology, 83(1), 197–202. doi:10.2113/gsecongeo.83.1.197
Hu, S. Y., Evans, K., Craw, D., Rempel, K., Bourdet, J., Dick, J., et al. (2015). Raman characterization of carbonaceous material in the macraes orogenic gold deposit and metasedimentary host rocks, New Zealand. Ore Geol. Rev. 70, 80–95. doi:10.1016/j.oregeorev.2015.03.021
Hu, S. Y., Evans, K., Craw, D., Rempel, K., and Grice, K. (2017). Resolving the role of carbonaceous material in gold precipitation in metasediment-hosted orogenic gold deposits. Geology 45 (2), 167–170. doi:10.1130/g38462.1
Huang, H., Zhang, Z. C., Kusky, T., Zhang, D. Y., Hou, T., Liu, J. L., et al. (2012). Geochronology and geochemistry of the chuanwulu complex in the south tianshan, western Xinjiang, NW China: implications for petrogenesis and phanerozoic continental growth. Lithos 140, 66–85. doi:10.1016/j.lithos.2012.01.024
Ivanove, S. (2000). Constrains on the fluid evolution at Kumtor deposit. GSA 2000 Presentation. Available online at: http://homepage.usask.ca/smi454/project/articles/GSA2000.htm.
Jia, Y., Li, X., and Kerrich, R. (2000). A fluid inclusion study of Au-bearing quartz vein systems in the central and north Deborah deposits of the Bendigo gold field,Central Victoria, Australia. Econ. Geol. 95, 467–494. doi:10.2113/gsecongeo.95.3.467
Jia, Y., Li, X., and Kerrich, R. (2001). Stable isotope (O, H, S, C, and N) systematics of quartz VeinSystems in the turbidite-hosted central and North deborah gold deposits ofthe Bendigo gold field, central victoria, Australia: constraints on the originof ore-forming fluids. Econ. Geol. Bull. Soc. Econ. Geol. 96 (4), 705–721. doi:10.2113/gsecongeo.96.4.705
Kempe, U., Seltmann, R., Graupner, T., Rodionov, N., Sergeev, S. A., Matukov, D. I., et al. (2015). Concordant U-Pb SHRIMP ages of U-rich zircon in granitoids from the Muruntau gold district (Uzbekistan): timing of intrusion, alteration ages, or meaningless numbers. Ore Geol. Rev. 65, 308–326. doi:10.1016/j.oregeorev.2014.10.007
Kerrich, R. (1987). “The stable isotope geochemistry of Au-Ag vein deposits in metamorphic rocks,” in Stable isotope geochemistry of low temperature fluids: mineralogical association of Canada short course. Editor T. K. Kyser, 13, 287–336.
Kerrich, R., Goldfarb, R., Groves, D., Garwin, S., and Jia, Y. (2000). The characteristics, origins, and geodynamic settings of supergiant gold metallogenic provinces. Sci. China 43 (Suppl. l.), 1–68. doi:10.1007/bf02911933
Klemd, R., Bröcker, M., Hacker, B. R., Gao, J., Gans, P., and Wemmer, K. (2005). New age constraints on the metamorphic evolution of the high-pressure/low-temperature belt in the western Tianshan Moutains, NW China. J. Geol. 113 (2), 157–168. doi:10.1086/427666
Konopelko, D., Biske, G., Seltmann, R., Eklund, O., and Belyatsky, B. (2007). Hercynian post-collisional A-type granites of the kokshaal range, southern tien Shan, Kyrgyzstan. Lithos 97 (1-2), 140–160. doi:10.1016/j.lithos.2006.12.005
Kontak, D. J., Smith, P. K., Kerrich, R., and Williams, P. F. (1990). Integrated model for meguma group lode gold deposits, nova scotia, Canada. Geology 18 (3), 238–242. doi:10.1130/0091-7613(1990)018<0238:imfmgl>2.3.co;2
Kyser, T. K., Janser, B. W., Wilson, M. R., and Hattie, I. (1986). “Stable isotope geochemistry related to gold mineralization and exploration in the Western Shield,” in Gold in the western shield: CIM special. Editor L. A. Clark, 38, 470–498.
Liu, J. J., Long, X. R., Zheng, M. H., Li, E. D., Wang, J. Z., Sang, H. Q., et al. (2002a). The metallogentic age of Sawayaerdun gold deposit in southwestern tianshan mountains, Xinjiang. J. Mineralogy Petrology 22 (3), 19–23.
Liu, J. J., Zheng, M. H., Cook, N., Long, X. R., Deng, J., and Zhai, Y. S. (2007). Geological and geochemical characteristics of the Sawaya'erdun gold deposit, Southwestern Chinese Tianshan. Ore Geol. Rev. 32 (1-2), 125–156. doi:10.1016/j.oregeorev.2006.11.003
Liu, J. J., Zheng, M. H., Long, X. R., Yin, H. X., Wang, J. Z., Li, E. D., et al. (2002b). Metallogenic characteristics of Sawayaerdun gold deposit in Xinjiang, and their similarities to and differences from those of the Muruntau-type gold deposits. Acta Mineral. Sin. 22 (1), 54–61.
Long, L. L., Gao, J., Wang, J. B., Qian, Q., Xiong, X. M., Wang, Y. W., et al. (2008). Geochemistry and SHRIMP zircon U-Pb age of post-collisional granites in the southwest tianshan orogenic belt of China: examples from the heiyingshan and laohutai plutons. Acta Geol. Sin. 82 (2), 415–424. doi:10.1111/j.1755-6724.2008.tb00592.x
Mao, J. W., Konopelko, D., Seltmann, R., Lehmann, B., Chen, W., Wang, Y. T., et al. (2004). Postcollisional age of the kumtor gold deposit and timing of hercynian events in the tien Shan, Kyrgyzstan. Kyrg. Econ. Geol. 99 (8), 1771–1780. doi:10.2113/gsecongeo.99.8.1771
Mao, J. W., Qiu, X. M., Goldfarb, R. J., Zhang, Z. C., and Ren, F. S. (2002). Geology, distribution and classitication of gold deposit in the western Qinling belt, central China. Minera. Deposita 37 (3-4), 52–377. doi:10.1007/s00126-001-0249-0
McCuaig, T. C., and Kerrich, R. (1998). P-T-t-deformation-fluid characteristics of lode gold deposits: evidence from alteration systematics. Ore Geol. Rev. 12, 381–453. doi:10.1016/s0169-1368(98)80002-4
Mikucki, E. J., and Ridley, J. R. (1993). The hydrothermal fluid of Archæan lode-gold deposits at different metamorphic grades: compositional constraints from ore and wallrock alteration assemblages. Minera. Deposita 28 (6), 469–481. doi:10.1007/bf02431603
Morelli, R., Creaser, R. A., Seltmann, R., Stuart, F. M., Selby, D., and Graupner, T. (2007). Age and source constraints for the giant Muruntau gold deposit, Uzbekistan, from coupled Re-Os-He isotopes in arsenopyrite. Geology 35 (9), 795–798. doi:10.1130/g23521a.1
Naden, J., and Shepherd, T. J. (1989). Role of methane and carbon dioxide in gold deposition. Nature 342, 793–795. doi:10.1038/342793a0
Ohmoto, H., and Goldhaber, M. B. (1997). “Sulfur and carbon isotopes,” in Geochemistry of hydrothermal ore deposits. Editor H. L. Barnes (New York: Wiley Interscience), 435–486.
Pasava, J., Frimmel, H., Vymazalova, A., Dobes, P., Jukov, A. V., and Koneev, R. I. (2013). A two-stage evolution model for the Amantaytau orogenic-type gold deposit in Uzbekistan. Deposita 48 (7), 825–840. doi:10.1007/s00126-013-0461-8
Pasava, J., Frimmel, H., Vymazalova, A., Kosler, J., Koneev, R. I., Jukov, A. V., et al. (2010). Platinum-group elements in ores from the Kalmakyr porphyry Cu-Au-Mo deposit, Uzbekistan: bulk geochemical and laser ablation ICP-MS data. Minera. Deposita 45 (5), 411–418. doi:10.1007/s00126-010-0286-7
Peters, S. G., and Golding, S. D. (1989). Geologic, fluid inclusion and stable isotope studies of granitoid-hosted gold-bearing quartz veins, Charter Tower, Northeastern Australia. Econ. Geol. Monogr. 6, 260–273. doi:10.5382/mono.06.20
Phillips, G. N., and Groves, D. I. (1983). The nature of Archaean gold-bearing fluids as deduced from gold deposits of Western Australia. J. Geol. Soc. Aust. 30 (1-2), 25–39. doi:10.1080/00167618308729234
Pichavant, M., Ramboz, C., and Weisbrod, A. (1982). Fluid immiscibility in natural processes: use and misuse of fluid inclusion data. Chem. Geol. 37 (1-2), 1–27. doi:10.1016/0009-2541(82)90064-x
Ramboz, C., Pichavant, M., and Weisbrod, A. (1982). Fluid immiscibility in natural processes: use and misuse of fluid inclusion data. Chem. Geol. 37 (1-2), 29–48. doi:10.1016/0009-2541(82)90065-1
Ridley, J. R., and Diamond, L. W. (2000). “Fluid chemistry of orogenic lode gold deposits and implications for genetic models,”. Gold in 2000. Editors S. G. Hagemann, and P. E. Brown (Reviews in Econ. Geol.), 13, 141–162. doi:10.5382/rev.13.04
Roedder, E. (1984). Fluid inclusions: reviews in mineralogy, 12. Mineralogical Society of America, 1–644. doi:10.1515/9781501508271
Rui, Z. Y., Goldfarb, R. J., Qiu, Y. M., Zhou, T. H., Chen, R. Y., Pirajno, F., et al. (2002). Paleozoic–early mesozoic gold deposits of the Xinjiang autonomous region, northwestern China. Deposita 37, 393–418. doi:10.1007/s00126-001-0243-6
Sibson, R. H., Robert, F., and Poulsen, K. H. (1988). High-angle reverse faults, fluid-pressure cycling, and mesothermal gold-quartz deposits. Geology 16 (6), 551–555. doi:10.1130/0091-7613(1988)016<0551:harffp>2.3.co;2
Skinner, B. J. (1997). “Hydrothermal mineral deposits: what we do and don’t know,” in Geochemistry of hydrothermal ore deposits Editor H. L. Barnes third ed. (New York: John Wiley and Sons), 1–29.
Solomovich, L. I. (2007). Postcollisional magmatism in the south tien Shan variscan orogenic belt, Kyrgyzstan: evidence for high-temperature and high-pressure collision. J. Asian Earth Sci. 30 (1), 142–153. doi:10.1016/j.jseaes.2006.08.003
Spooner, E. T. C., Bray, C. J., Wood, P. C., Burrows, D. R., and Callan, N. J. (1987). Au-quartz vein and Cu-Au-Ag-Mo-anhydrite mineralization, Hollinger-McIntyre mines, Timmins, Ontario: δ13C values (McIntyre), fluid inclusion gas chemistry, pressure (depth) estimation, and H2O-CO2 phase separation as a precipitation and dilation mechanism. Ont. Geol. Surv. Misc. 136, 35–56.
Su, W., Gao, J., Klemd, R., Li, J. L., Zhang, X., Li, X. H., et al. (2010). U-Pb zircon geochronology of Tianshan eclogites in NW China: implication for the collision between the Yili and Tarim Blocks of the southwestern Altaids. Eur. J. Mineral. 22 (4), 473–478. doi:10.1127/0935-1221/2010/0022-2040
Sui, Y. H., Wang, H. H., Gao, X. L., Chen, H. Y., and Li, Z. (2000). Ore fluid of the Tieluping silver deposit of Henan Province and its illustration of the tectonic model for collisional petrogenesis, metallogenesis and fluidization. Sci. China. Ser. D 43, 108–121. doi:10.1007/bf02911937
Taylor, H. P. (1997). “Oxygen and hydrogen isotope relationships in hydrothermal mineral deposits,” in Geochemistry of hydrothermal ore deposits. Editor H. L. Barnes (New York: Wiley and Sons), 229–302.
Wilde, A. R., Layer, P., Mernagh, T., and Foster, J. (2001). The giant Muruntau gold deposit: geologic, geochronologic, and fluid inclusion constraints on ore genesis. Econ. Geol. 96, 633–644. doi:10.2113/gsecongeo.96.3.633
Wilkinson, J. J. (2001). Fluid inclusions in hydrothermal ore deposits. Lithos 55, 229–272. doi:10.1016/s0024-4937(00)00047-5
Xiao, W. J., Windley, B. F., Allen, M. B., and Han, C. M. (2013). Paleozoic multiple accretionary and collisional tectonics of the Chinese Tianshan orogenic collage. Gondwana Res. 23 (4), 1316–1341. doi:10.1016/j.gr.2012.01.012
Xu, Q. D., Zhong, Z. Q., Suo, S. T., and Qi, X. M. (1995). Ore-forming fluids in mesothermal gold deposits of Tong—dabie area:their properties and precipitation mechanism. Mineral. Deposits 14 (1), 59–72.
Xue, C. J., Zhao, X. B., Mo, X. X., Chen, Y. C., Dong, L. H., Gu, X. X., et al. (2014a). Tectonic-metallogenicevolution of giant Au-Cu-Zn-Pb metallogenic belt and prospectingorientation. Acta Geol. Sin. 88 (12), 2490–2531.
Xue, C. J., Zhao, X. B., Mo, X. X., Dong, L. H., Gu, X. X., Nurtaev, B., et al. (2014b). Asian Gold Belt in Western Tianshan and its dynamic setting, metallogenic control and exploration. Earth Sci. Front. 21 (5), 128–155. doi:10.13745/j.esf.2014.05.011
Xue, C. J., Zhao, X. B., Zhang, G. Z., Mo, X. X., Gu, X. X., Dong, L. H., et al. (2015). Metallogenic environments, oreformingtypes and prospecting potential of Au-Cu-Zn-Pb resources in WesternTianshan Mountains. Geol. China 42 (3), 381–410. doi:10.12029/gc20150302
Yang, F. Q., Mao, J. W., and Wang, Y. T. (2004a). The ore-forming fluids and metallogenesis of the Bulong gold deposit in AKqi county, Xinjiang. Earth Sci. Front. 11 (2), 501–514. doi:10.13745/j.esf.2004.02.012
Yang, F. Q., Mao, J. W., Wang, Y. T., and Bierlein, F. P. (2006). Geology and geochemistry of the bulong quartz-barite vein-type gold deposit in the Xinjiang uygur autonomous region, China. Ore Geol. Rev. 29 (1), 52–76. doi:10.1016/j.oregeorev.2005.07.033
Yang, F. Q., Mao, J. W., Wang, Y. T., Bierlein, F. P., Ye, H. H., Li, M. W., et al. (2007). Geology and metallogenesis of the Sawayaerdun gold deposit in the southwestern tianshan mountains, Xinjiang, China. Resour. Geol. 57 (1), 57–75. doi:10.1111/j.1751-3928.2006.00005.x
Yang, J. G., Yan, Y. Y., Xu, X. Y., Ma, Z. P., Zhao, Z. P., and Yao, W. G. (2004b). Metallogenic regularity of southwest tianshan mountains in comparison with neighboring countries. Mineral. Deposits 23 (1), 20–30. Available online at: https://www.kcdz.ac.cn/kcdz/ch/reader/create_pdf
Ye, J. H., Wang, L. B., Ye, Q. T., Li, H. Q., and Zhang, X. H. (1999b). Metallogenic epoch and ore-bearing strata age of the Sawayaerdun gold-antimony deposit in Tianshan Mountains, China. Acta Geosci. Sin. 20 (3), 278–283.
Ye, J. H., Ye, Q. T., Wang, J., Wu, Y. P., Yang, F. Q., and Fu, X. J. (1999a). Geochemistry and metallogenic mechanism of the Sawayaerdun gold-antimony deposit. Mineral. Deposits 18 (1), 63–72.
Zhang, G. Z., Xue, C. J., Chi, G. X., Liu, L. Y., Zhao, X. B., Zu, B., et al. (2017). Multiple-stage mineralization in the Sawayaerdun orogenic gold deposit, western Tianshan, Xinjiang: constraints from paragenesis, EMPA analyses, Re-Os dating of pyrite (arsenopyrite) and U-Pb dating of zircon from the host rocks. Ore Geol. Rev. 81, 326–341. doi:10.1016/j.oregeorev.2016.10.038
Zhang, J., Yang, Y., Hu, H. Z., Wang, Z. G., Li, G. P., and Li, Z. L. (2009). C-S-Pb isotope geochemistry of the Yindonggou orogenic-type silver deposit in Henan province. Acta Petrol. Sin. 25 (11), 2833–2842.
Zhang, L., Chen, H. Y., Chen, Y. J., Qin, Y. J., Liu, C. F., Zheng, Y., et al. (2012). Geology and fluid evolution of the Wangfeng orogenic-type gold deposit, Western Tian Shan, China. Ore Geol. Rev. 49, 85–95. doi:10.1016/j.oregeorev.2012.09.002
Zhang, T., Chen, Z. L., Huang, H. Y., Zhang, W. G., Zhang, Q., Pan, J. Y., et al. (2020). Geochemical characteristics of gold-bearing minerals and its geological significance in the Ashawayi gold deposit in the southwestern Tianshan Orogen. J. Geomechanics 26, 443–458. doi:10.12090/j.issn.1006-6616.2020.26.03.038
Zhang, T., Chen, Z. L., Zhou, Z. J., Zhang, W. G., Zhang, Q., Pan, J. Y., et al. (2023). Geochemical characteristics of fluid inclusions and H-O isotopes of the Ashawayi gold deposit in the Southwest Tianshan Orogen and its orogenic-type gold deposit. Geol. China. 50 (5), 1513–1531.
Zhao, X. B., Xue, C. J., Chi, G. X., Pak, N., and Zu, B. (2015). Re-Os pyrite and U-Pb zircon geochronology from the Taldybulak Levoberezhny gold deposit: insight for Cambrian metallogeny of the Kyrgyz northern Tien Shan. Ore Geol. Rev. 67, 78–89. doi:10.1016/j.oregeorev.2014.12.002
Zhao, X. B., Xue, C. J., Chi, G. X., Wang, H. G., and Qi, T. J. (2014). Epithermal Au and polymetallic mineralization in the Tulasu Basin, western Tianshan, NW China: potential for the discovery of porphyry CuAu deposits. Ore Geol. Rev. 60, 76–96. doi:10.1016/j.oregeorev.2013.12.018
Zhou, Z. J., Chen, Z. L., Weyer, S., Horn, I., Huo, H. L., Zhang, W. G., et al. (2023). Metal source and ore precipitation mechanism of the Ashawayi orogenic gold deposit, southwestern Tianshan Orogen, western China: constraints from textures and trace elements in pyrite. Ore Geol. Rev. 157, 105452. doi:10.1016/j.oregeorev.2023.105452
Keywords: fluid inclusions, H–O–S isotopes, Ashawayi gold deposit, orogenic gold deposit, Southern Tianshan
Citation: Chen B, Chen H, Xing W, Wang Y and Zhao Y (2025) Fluid inclusion and H–O–S isotope constraints on the genesis of the Ashawayi gold deposit, Southern Tianshan, Xinjiang, NW China. Front. Earth Sci. 13:1485901. doi: 10.3389/feart.2025.1485901
Received: 25 August 2024; Accepted: 31 March 2025;
Published: 02 July 2025.
Edited by:
Hongjian Zhu, Yanshan University, ChinaReviewed by:
Rui Liu, Shandong University of Technology, ChinaTao Zhang, China University of Geosciences Wuhan, China
Yannan Wang, Hebei University of Engineering, China
Ildar Rakhimov, Institute of Geology Ufa Federal Research Centre of the Russian Academy of Sciences, Russia
Copyright © 2025 Chen, Chen, Xing, Wang and Zhao. This is an open-access article distributed under the terms of the Creative Commons Attribution License (CC BY). The use, distribution or reproduction in other forums is permitted, provided the original author(s) and the copyright owner(s) are credited and that the original publication in this journal is cited, in accordance with accepted academic practice. No use, distribution or reproduction is permitted which does not comply with these terms.
*Correspondence: Hui Chen, Y2hlbmhAbWFpbC5jZ3MuZ292LmNu; Wanli Xing, eHdhbmxpQG1haWwuY2dzLmdvdi5jbg==
†ORCID: Wanli Xing, orcid.org/0000-0001-9491-7204