 Baofeng Wan
 Kai Qin
 Hongbin Shi3
- 1School of Environment and Spatial Informatics, China University of Mining & Technology, Beijing, China
- 2School of Surveying and Mapping, Kunming Metallurgy College, Kunming, China
- 3School of Urban and Rural Planning and Landscape Architecture, Xuchang University, Xuchang, China
- 4Yunnan Aerial Survey Technology Co., Ltd, Kunming, China
- 5Yunnan Institute of Water & Hydropower Engineering Investigation, Design and Research, Kunming, China
Solar photovoltaic (PV) panels convert solar energy into clean, renewable electricity. Their efficiency and sustainable application are highly dependent on precise terrain analysis and optimal site selection. While LiDAR technology enables the acquisition of dense point cloud data for accurate terrain modeling, its high data volume poses significant challenges for efficient processing. This study proposes a workflow to generate high-resolution digital terrain models (DTMs) by combining octree-based point cloud compression (achieving an 80% compression ratio via elevation zoning) with four interpolation methods: inverse distance weighted (IDW), radial basis function (RBF), thin plate spline (TPS), and empirical Bayesian kriging (EBK). Multi-factor analysis is then used to identify optimal PV panel installation areas by integrating key terrain factors—slope (S), aspect (AS), and maximum solar radiation (SR).The proposed approach was validated in three test zones (A, B, and C) in Dongchuan District, northeastern Kunming, Yunnan Province, China. The optimal installation areas identified in these zones were 82,360 m2, 302,462 m2, and 97,464 m2, respectively. The EBK-generated DTM was selected as the most accurate for terrain analysis. The workflow significantly reduced data volume and processing time while maintaining high DTM accuracy (error range: 0.004–0.008 m compared to uncompressed data). This study demonstrates that efficient point cloud compression and multi-factor analysis can address the challenges of large-scale terrain data processing and site optimization for PV deployment in complex terrains. The proposed method offers new technological guidance for PV site selection. Future research will focus on further improving data processing techniques to enhance DTM precision and PV panel placement accuracy in more diverse geographic contexts.
1 Introduction
Solar photovoltaic (PV) panels offer multiple advantages, including environmental cleanliness, renewability, wide adaptability, and low maintenance costs. This technology holds significant growth potential and broad application prospects in the renewable energy sector (Tawalbeh et al., 2021; Minh Tri et al., 2022; Jathar et al., 2023; Rus et al., 2024). China is strongly committed to the sustainable development of solar energy, with the National Energy Administration implementing supportive policies to accelerate photovoltaic power generation projects.
The geographic suitability of a location is critical to the efficiency and sustainable deployment of solar photovoltaic panels (Kazem et al., 2020). Doljak and Stanojevic (2017) utilized Serbia’s natural solar resources by applying a GIS-based multi-criteria evaluation approach that considered climate, terrain, and vegetation factors to identify optimal photovoltaic installation sites. In their assessment, terrain emerged as the second most influential criterion with a weight of 0.230, primarily emphasizing slope and aspect. Liu et al. (2017) aimed to select the optimal location for photovoltaic plants in northwest China by considering geographical conditions, economic benefits, and environmental benefits. The geographical conditions primarily included solar radiation, altitude, and temperature. Through continuous adjustment of the weights of these three factors, they found that regardless of changes in the weights of solar radiation, altitude, and temperature, Yulin city consistently emerged as the optimal choice for photovoltaic panel installation in terms of potential value. Alami Merrouni et al. (2018) used GIS combined with Analytic Hierarchy Process (AHP) for photovoltaic plant site selection in eastern Morocco. Their AHP analysis revealed that terrain was the second most important criterion, with a weight of 23.5%. The main factors considered were slope, as larger slopes would significantly increase the construction costs of photovoltaic fields. Therefore, selecting areas with relatively small slopes is necessary to ensure the site remains relatively flat for photovoltaic plant installation. Demir et al. (2023) proposed a site selection method for large-scale photovoltaic power plants that integrates the AHP and Geographic Information Systems (GIS). In their methodology, the weights assigned to solar radiation rate, land use, and slope were 58%, 23%, and 19%, respectively.
In addition, some scholars have carried out related research, such as, Huang et al. (2015) using the Lujiazui area of Shanghai, China, as a case study, developed a GPU-accelerated solar radiation model (SHORTWAVE-C) based on airborne LiDAR data and Fengyun satellite cloud cover data. The model aims to accurately estimate rooftop solar radiation in complex urban environments, providing a scientific foundation for the optimal placement of photovoltaic panels. By integrating a Digital Surface Model (DSM) with a spatial resolution of 1 m, along with factors such as solar position, cloud cover effects, and terrain shading analysis, the model calculates solar radiation across various temporal scales. An object-based method was employed to identify rooftop areas suitable for photovoltaic panel installation. Wong et al. (2016) using Hong Kong as a case study, generated a photovoltaic potential distribution map by integrating solar radiation data with multiple factors, including slope, aspect, and shading effects. To facilitate analysis and computation, the original DSM and Digital Elevation Model (DEM) data were resampled to a spatial resolution of 3 m. The study estimated the total photovoltaic potential of Hong Kong to be 2.66 TWh, identifying sunlit residential rooftops as the optimal areas for photovoltaic panel installation. Martínez-Rubio et al. (2016) using two streets in Logroño, Spain, as test sites, evaluated the solar radiation distribution characteristics of building facades with varying orientations and heights. This assessment was conducted using high-density LiDAR point cloud data combined with 3D modeling and grid-based discretization techniques. The results revealed that facade orientation and shading effects significantly influence the distribution of solar radiation. South-facing facades and unobstructed upper floors receive higher radiation levels, making them the most suitable for photovoltaic power generation. Tiwari et al. (2020) using the small city of Kiryat Malakhi on Israel’s southern coastal plain as a case study, analyzed rooftop solar radiation potential by extracting slope and orientation information from DSM with a spatial resolution of 1 m. This analysis employed multi-resolution segmentation techniques. The results indicated that roofs with gentle slopes (4°–22°) and south-, east-, or west-facing orientations have the highest annual solar radiation potential, making them ideal for solar photovoltaic panel installation. Nelson and Grubesic (2020) using the Sunnyslope community in Phoenix, Arizona, United States, as a case study, explored the differences in applying LiDAR and Unmanned Aerial System (UAS) data for assessing rooftop solar photovoltaic potential. The study utilized DEM and point cloud data, combined with the ArcGIS solar radiation tool, to quantify effective photovoltaic area based on factors such as slope, orientation, and building obstructions. The results indicated that UAS data offers superior capabilities in resolving building geometries and shading regions, enhancing the accuracy of solar radiation estimation.
In the site selection process, terrain is crucial for selecting solar photovoltaic power stations, and DTM provides a digital representation of terrain by recording elevation information at various points on the Earth’s surface. DTMs allow for accurate understanding of the terrain characteristics of areas designated for solar photovoltaic panel installation. Several scholars have conducted related research on solar photovoltaic (PV) site selection.
Yilmaz et al. (2023) introduced multiple factors, including flood risk, soil erosion, and terrain, to study the optimal location for solar PV power plants in the Menteşe region of Turkey. The study emphasized that slope and aspect are key terrain factors affecting PV site selection, with south-facing slopes and relatively flat areas being the most suitable. It also highlighted the lack of scientific basis for traditional methods that assess flood risk based on fixed distances and suggested that more attention should be given to the specific details of the terrain. Vecchi and Berardi (2024) used downtown Toronto as a case study, employing GIS analysis and multi-scale methods to help determine the most suitable locations and scale for PV installations, providing scientific support for urban PV planning. The study discusses the importance of digital terrain models and terrain factors in PV site selection, particularly slope, aspect, and shading, all of which directly affect solar radiation and PV generation efficiency. Liang et al. (2024) explored the joint optimization deployment strategy for 5G base stations (5G BS) and distributed PV energy supply systems in urban ultra-dense environments in Nanning, Guangxi. By utilizing GIS to extract 3D building geographic information and combining it with DEM data, a precise 3D model was generated. The base station deployment location was optimized using the Mixed-Integer Quadratic Constrained Programming (BSSCP) model, reducing the number of base stations. The results indicate that the proposed framework can lower costs and carbon emissions while enhancing both base station signal coverage and PV generation efficiency. The study utilized DEM to extract building height, area, and shading characteristics, supporting the optimization of base station deployment and PV connections, thus providing a data foundation for achieving efficient coverage and low-cost connections. Drozd and Kussul (2024) applied a multi-criteria analysis method to assess land suitability for solar power plant site selection across Ukraine, providing scientific support for optimizing solar resource development. By calculating slope and elevation from the DEM, precise analysis was conducted to identify areas with flat terrain and low construction costs. Additionally, the solar power generation efficiency in high-altitude regions was analyzed, providing crucial insights for site optimization and cost control in construction. Based on the above review, it is evident that slope, aspect, and solar radiation are consistently identified as the most critical terrain-related factors in PV site selection studies. These factors are widely recognized because slope influences construction costs and installation feasibility, aspect directly affects the potential solar energy capture efficiency, and solar radiation fundamentally determines the PV generation capacity of a given location. Therefore, these terrain attributes merit particular attention when assessing the suitability and optimizing the location of solar photovoltaic installations.
With advancements in science and technology, airborne LiDAR technology can generate high-resolution DTMs through extensive laser point cloud scans of surface information. This technology reveals fine details and features of the surface, enabling a more accurate description of the terrain (Balsa-Barreiro and Lerma, 2014; Waqas et al., 2023). And, Gassar and Cha (2021) illustrate that LiDAR combined with GIS can effectively estimate solar photovoltaic potential. Huang et al. (2022) using the western region of Aichi Prefecture, Japan, as a case study, assessed rooftop solar photovoltaic power generation potential by integrating LiDAR data, DTM with a spatial resolution of 5 m, and solar radiation data provided by SolarGIS. The study employed three methods: deriving a digital canopy model from LiDAR data, utilizing building polygon data, and incorporating direct normal irradiance. By comprehensively considering building height, slope, orientation, and shading effects, the research calculated the potential rooftop areas suitable for photovoltaic panel installation.
The relationship between point cloud density and DTM is closely intertwined, with variations in density impacting the quality and accuracy of the DTM. Higher point cloud density generally results in DTMs with greater precision and resolution because more ground points offer richer elevation information, allowing the DTM to more accurately reflect terrain details and variations. However, high-density point clouds require more computational resources and storage space, which increases the complexity of data processing and analysis to some extent (Fan and Atkinson, 2018; Chen et al., 2023).
For point cloud data compression, Ji et al. (2019) recognized point cloud compression as a critical preprocessing step to reduce computer resource consumption and expedite model reconstruction. They established a k-neighborhood search rule, preserved multiple point cloud detail features, and then applied an octree for point cloud compression. Experimental results on four different datasets indicated that this method could effectively compress the point cloud while clearly capturing the object’s contours. Liu et al. (2020) highlighted that the vast amount of point cloud data increases the time required for model reconstruction, making data compression crucial. By generating geometric domains for each point cloud and applying different clustering algorithms for the geometric and spatial domains of regional point clouds, their experimental results demonstrated that this method can effectively compress the number of points to 10% while preserving the edge features of the point cloud. Wang et al. (2021) addressed the diversity of point cloud features by first determining the scale of the point cloud, then constructing the boundaries based on points with larger curvature values, clustering the point cloud, and finally compressing each category using a random method. The proposed method was tested on Stanford University’s point cloud Bunny model, revealing that even after compressing 90% of the point cloud data, the detailed features of the Bunny could still be clearly preserved. Shi et al. (2022) focused on emphasizing the features of the point cloud during compression. They employed AHP and Criteria Importance Through Intercriteria Correlation (CRITIC) method to assign weights to point cloud features such as curvature, density, edge, and terrain. They then compressed the point cloud based on the spatial relationship between feature points and other points. Results demonstrated that the proposed method could achieve more uniform point cloud compression, with accuracy improvements of 5%–15% compared to traditional methods.
Against this backdrop, relevant literature and technological limitations have been comprehensively reviewed in recent studies. For example, Huang et al. (2022) analyzed the rooftop solar power potential in the western region of Aichi, Japan, using comparative assessments of solar radiation data and remote sensing information. Similarly, Rus et al. (2024) conducted a comprehensive comparison of photovoltaic system installations from various perspectives on building rooftops in Romanian cities. Nevertheless, methodological challenges remain in improving the spatial accuracy and computational efficiency of solar photovoltaic site selection in complex mountainous terrains. One key challenge is maintaining high DTM accuracy when compressing and processing high-resolution LiDAR point clouds. Lingfors et al. (2017) showed that reducing the number of LiDAR points through downsampling can significantly impact the reliability of solar resource assessment and shading analysis. Likewise, Sánchez-Aparicio et al. (2020) demonstrated that variations in the number of LiDAR points affect the geometric characterization of rooftops, which is critical for accurate photovoltaic site evaluation. However, the specific influence of LiDAR point quantity on DTM accuracy in the context of solar energy planning—especially for large-scale or mountainous regions—remains insufficiently explored.
Moreover, while GIS-based methods have been widely adopted to optimize solar site selection, most existing studies focus on urban environments. These studies often rely on digital models with relatively low spatial resolution and analyze factors such as slope, aspect, and solar radiation independently (Freitas et al., 2015; Song et al., 2018). The integration of these key terrain and solar parameters into a unified, high-resolution analytical workflow for PV site selection in complex terrains is still limited and warrants further investigation. Of note, Tong et al. (2025) conducted a suitability analysis for photovoltaic power station site selection in China, demonstrating that although the terrain is complex in southwestern regions such as Yunnan and Guizhou, the abundant solar radiation resources result in considerable power generation potential. By contrast, a comprehensive and efficient framework for integrating high-resolution terrain characteristics with solar radiation data in complex mountainous regions is still lacking. In response, this study aims to minimize environmental impact, enhance sustainability, improve the economic feasibility of PV projects, and identify optimal locations for PV panel deployment. The proposed approach begins by compressing the LiDAR point cloud using a combination of elevation-based filtering and octree partitioning techniques. Subsequently, a comparative analysis is performed using multiple methods to construct DTMs. Terrain attributes and solar radiation data are then interpreted and integrated. Finally, the spatial intersection of optimal zones for each factor is conducted to delineate the most suitable areas for PV panel installation.
2 Materials and methods
2.1 Overview of the study area
Yunnan Province is a region rich in solar energy resources. The province has proposed specific project configuration plans and safeguard measures to accelerate the development of photovoltaic power generation (Li et al., 2023).
Dongchuan district is located in the northeastern part of Kunming city, Yunnan Province, as shown in Figure 1a. The district receives an annual average of 2,327.5 h of sunshine, providing abundant sunlight resources and high solar radiation intensity, making it suitable for solar photovoltaic power generation. The annual evaporation is 1,856.4 mm, with a maximum wind speed of 40 m/s, predominantly experiencing southwest winds. Geographically, the eastern and western parts of Dongchuan District feature mountainous terrain, the central part comprises high-temperature and dry river valleys, and the southern and northern parts are characterized by mid-to-low mountainous terrain, as shown in Figure 1c. Mountains account for approximately 97% of the district’s total area (Zhu et al., 2023).Yunnan Province places significant emphasis on the development of solar photovoltaic power generation. Dongchuan district has large areas of vacant or barren land suitable for photovoltaic power plant construction, providing space for project planning and exhibiting promising development prospects and potential for photovoltaic power generation.
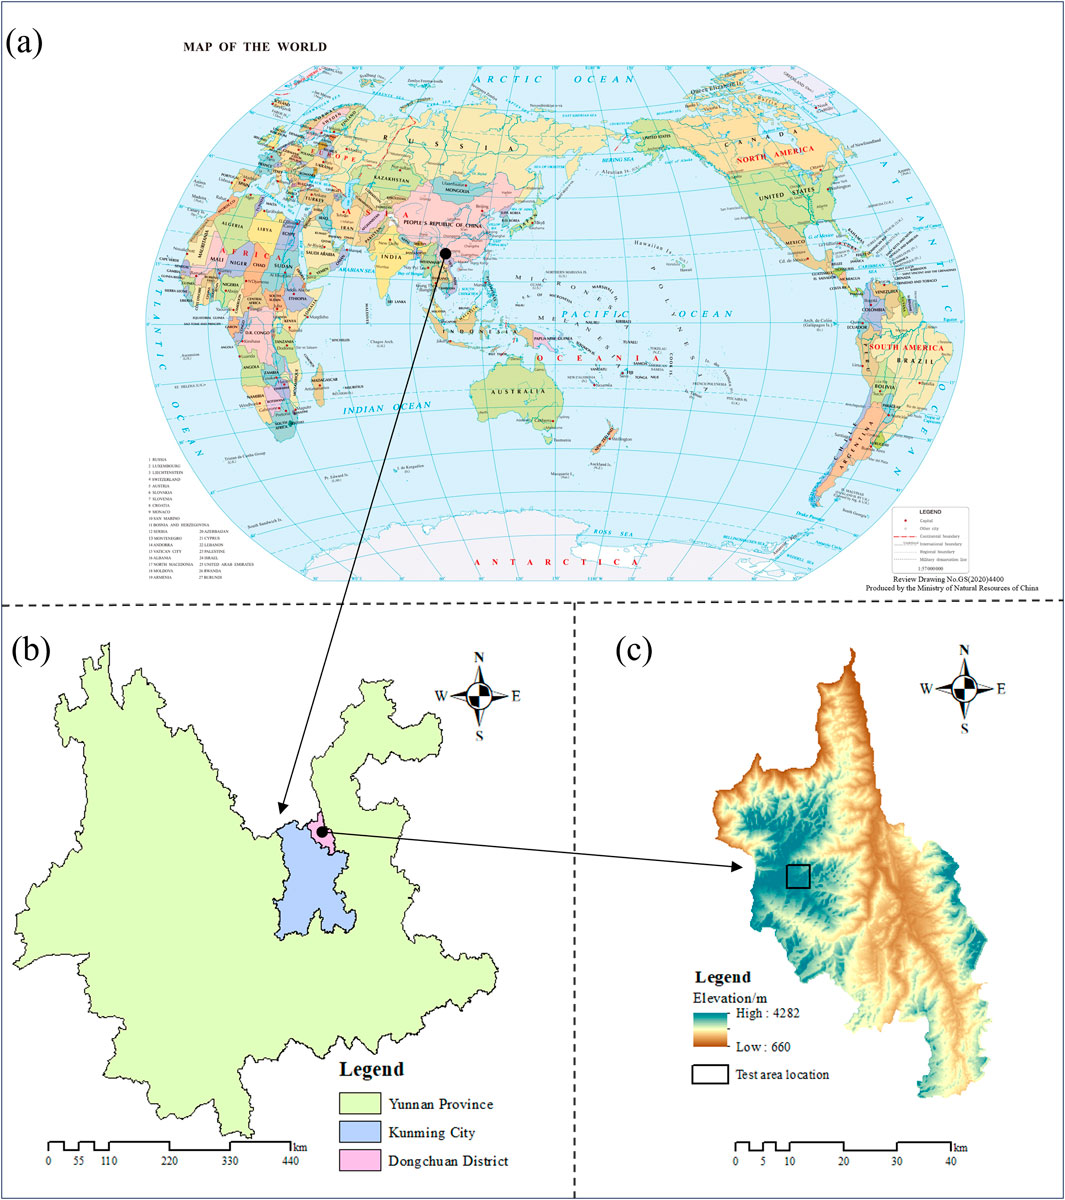
Figure 1. Overview of the test area. (World map showing the location of Kunming City, Yunnan Province, China (a). and (a) from http://bzdt.ch.mnr.gov.cn/index.html (b) depicts Yunnan Province with Kunming City and Dongchuan District indicated. (c) presents the elevation map of Dongchuan District, highlighting the test area location.)
2.2 Point cloud data collection
LiDAR point cloud data was collected using the Feima-D2000 equipped with the VUX-1LR lens. The specific UAV platform and lens parameters are shown in Table 1. The UAV has an actual endurance of up to 40 min and a wind resistance capability of up to level 6. In survey areas with significant elevation differences and complex environments, variable altitude flight paths were planned to ensure the stability and accuracy of the data. The point cloud data for this experiment was collected under clear, light breeze conditions, with a flight altitude of 350 m, and a flight speed of 8 m/s. Both the flight direction and side overlap were set at 60%.
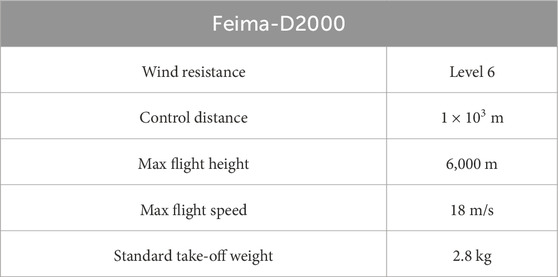
Table 1. UAV platform parameters.
Based on the collected point cloud, Inertial Measurement Unit (IMU) data, and Position Orientation System (POS) data, a tightly coupled method was used to calculate the trajectory. The calculated trajectory data and point cloud data were then input into the “Intelligent Laser” module of the Feima-UAV Manager. Necessary information such as project path, coordinate system, and load number was sequentially input according to the prompts. UAV manager automatically downloaded the cloud calibration report based on the load number and other information to ensure the accuracy of the point cloud. Table 2 lists the parameters of the VUX-1LR lens. LiDAR has the capability to penetrate certain surface features such as trees and crops to a degree, allowing for the direct acquisition of DSM. However, surface features can interfere with the calculation of terrain factors. To address this, the Progressive TIN Densification (PTD) (Wang et al., 2020) filtering algorithm in TerraSolid was employed with parameters set to an iteration angle of 8° and an iteration distance of 2 m. This filtering process removes surface feature information from the collected point cloud, enabling the construction of a DTM from ground points for terrain factor interpretation.
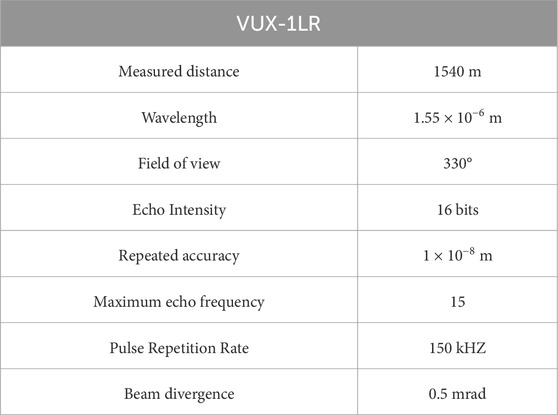
Table 2. LiDAR lens parameters.
As shown in Figure 2, test zone A covers an area of is 618,519 m2, with 8,982,152 ground points, resulting in a point cloud density of 14.521 points/m2. Test zone B covers 520,887 m2, with 6,955,455 ground points, resulting in a point cloud density of 13.324 points/m2. Test zone C covers 516,566 m2, with 4,827,040 ground points, resulting in a point cloud density of 10.503 points/m2.
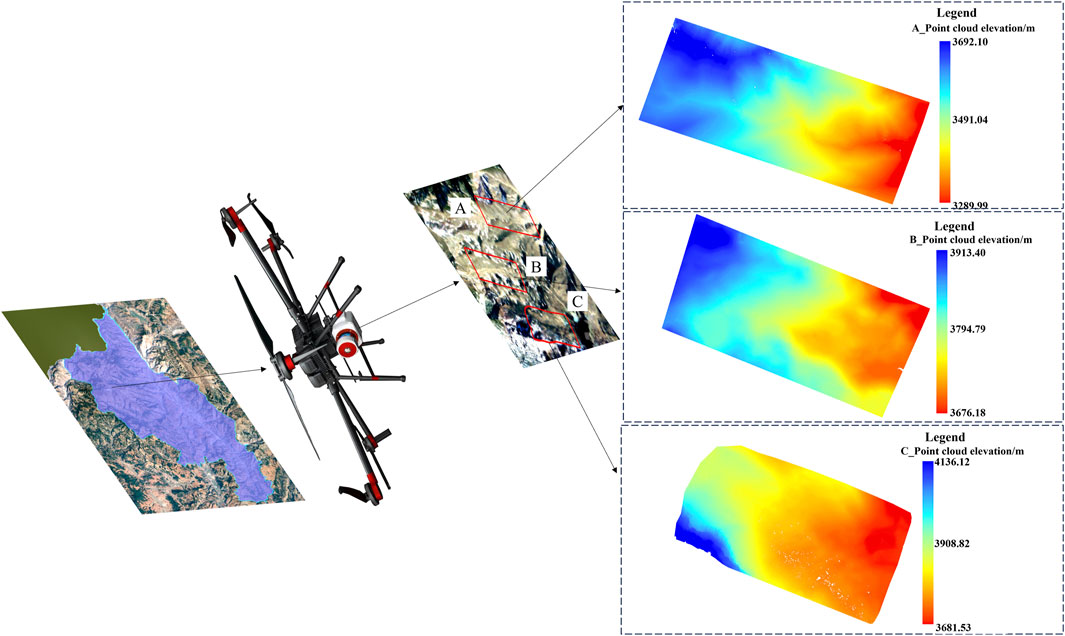
Figure 2. Point clouds in three survey zones.
3 Methods
To address the optimization of solar photovoltaic (PV) panel placement, this study proposes a comprehensive method combining point cloud compression, high-resolution DTM generation, and multi-factor analysis. The research methodology involves three main steps: First, LiDAR point clouds are compressed using a combination of elevation data and octree compression techniques to reduce data volume. Second, various interpolation methods are applied to the compressed point cloud data to construct the DTM, followed by the selection of optimal methods for terrain feature factor calculations. Finally, the generated high-resolution DTM data, combined with GIS technology, is used to conduct intersection analysis of three key factors—slope (S), aspect (AS), and solar radiation (SR)—to identify the optimal area for PV panel installation. The process is illustrated in Figure 3.
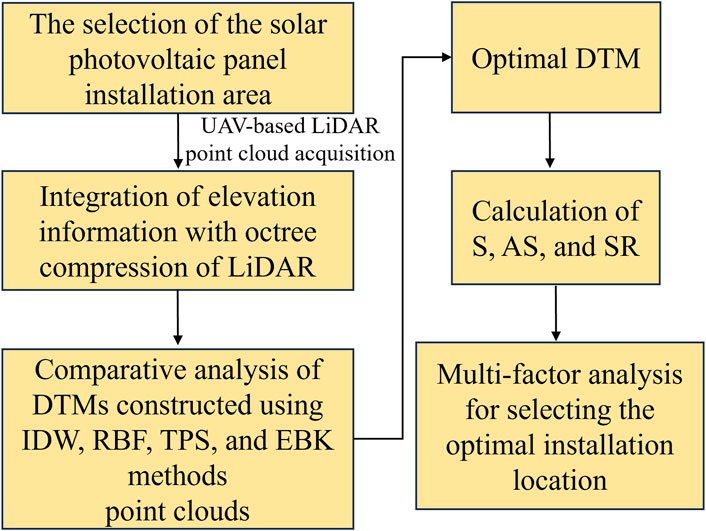
Figure 3. The process of this experiment.
3.1 Point cloud compression
LiDAR point clouds serve as the fundamental basis for constructing high-resolution DTMs, containing rich terrain information that supports the terrain interpretation for solar photovoltaic panel placement. High-quality DTMs can accurately reflect these terrain details, ensuring the scientific validity of the site selection. However, due to the massive volume and high density of LiDAR point clouds, they not only consume substantial storage space but also place high demands on computational resources and processing efficiency. Therefore, optimizing point cloud data through compression techniques is a critical step in improving processing efficiency while maintaining DTM accuracy (He et al., 2023).
The octree is a data structure used for segmenting and organizing the three-dimensional space of point clouds. An octree is a recursive data structure that divides point cloud data into nodes based on spatial location to construct a cube, considered the root node of the octree. This cube is then uniformly subdivided into eight sub-cubes, as shown in Figure 4, with the sub-cubes being the child nodes of the root node. Using a recursive method, the space is further subdivided into sub-cubes. Each root node corresponds to a cube containing eight sub-cubes, and in the three coordinate directions (x, y, z), it is divided by half the side length of the parent node’s cube. Subdivision stops when the number of three-dimensional points contained in any node is less than or equal to the preset minimum number of points a cube should contain. After subdivision, point cloud compression is completed by placing the center points in the grid, with the compression rate shown in Equation 1.
where:
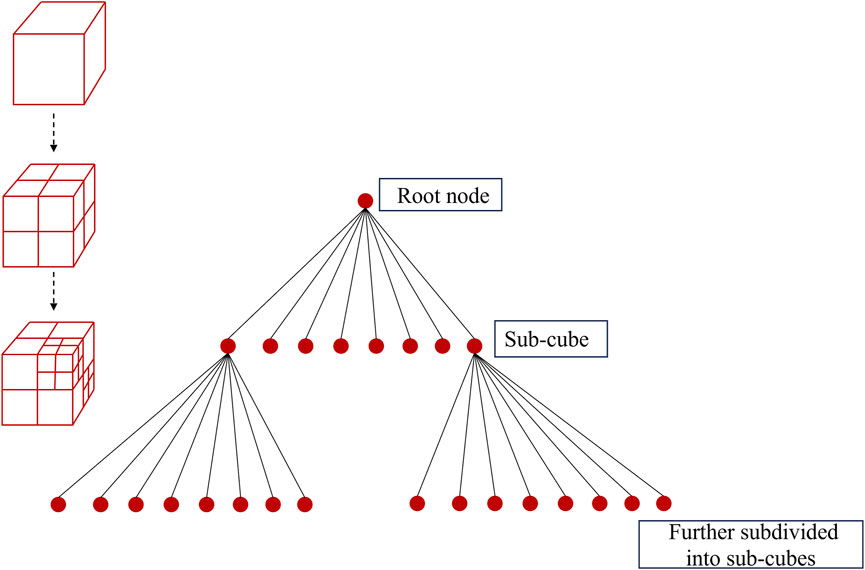
Figure 4. Octree structure.
Considering the elevation differences in the test zone, point cloud compression can lead to the loss of local detail and feature information, resulting in deviations and accuracy loss. To ensure terrain accuracy, this study first uses the natural breakpoint method (Xiao et al., 2020; Xiao et al., 2023) to divide the data into five elevation intervals, as shown in Figure 5. The point cloud is traversed and categorized into different elevation classes. Then, suitable node thresholds and point cloud quantity thresholds for these nodes are preset for the octree. The subdivision process stops when any of these threshold conditions are met. By setting thresholds for leaf node size and the number of points per node, the octree indexing process can be effectively controlled. The leaf node size threshold terminates the node division process in a timely manner, while the point cloud quantity threshold prevents unreasonable node division. Combining these two threshold conditions allows the establishment of a reasonable, efficient, and optimized octree index.
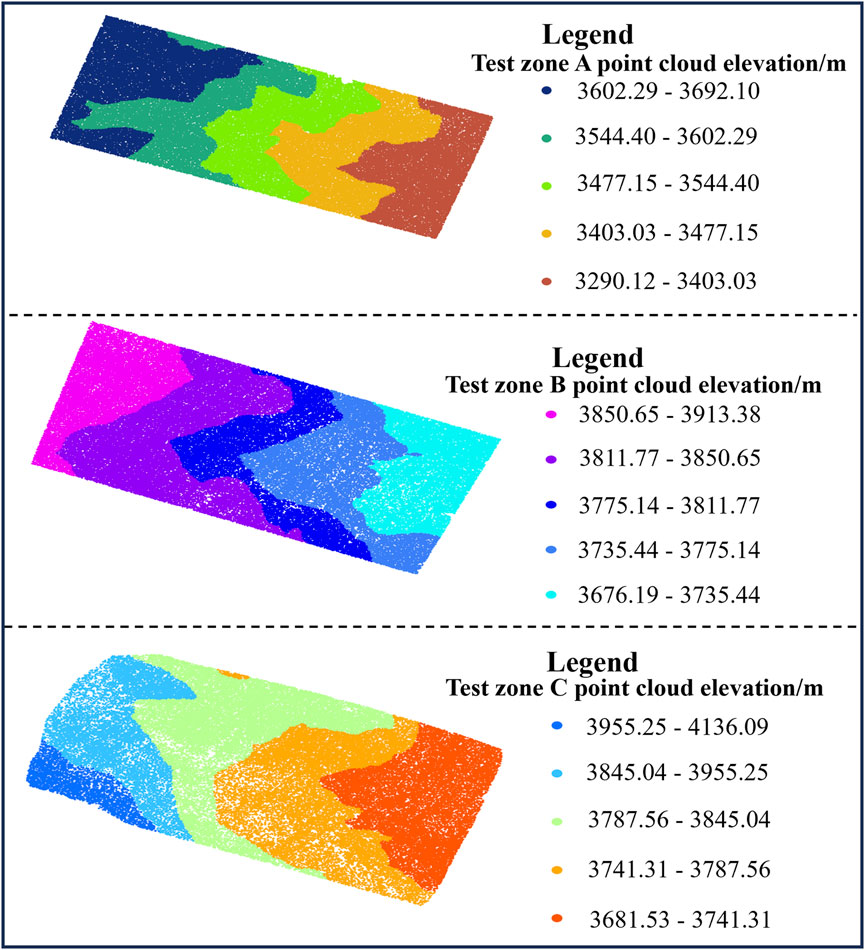
Figure 5. Point cloud classification of the three test zones.
3.2 Point cloud DTM construction
In the process of selecting optimal locations for solar photovoltaic panel placement, DTM serves as the core tool for terrain interpretation and factor analysis, precisely characterizing terrain features. These terrain factors directly impact the efficiency of solar resource utilization, as well as the installation and construction costs of photovoltaic panels. Constructing high-quality DTMs is essential for accurately identifying the most suitable locations for PV panel installation.
Point clouds are discrete datasets, whereas DTMs represent terrain in a continuous raster format. Effective interpolation methods can help seamlessly fill the discrete point cloud data across the entire terrain surface, thereby generating a continuous elevation raster. Choosing an appropriate interpolation method is crucial for creating a DTM from point clouds, as it directly affects the accuracy of the generated DTM, the preservation of terrain features, and computational efficiency. The interpolation methods for DTM include:
This section may be divided by subheadings. It should provide a concise and precise description of the experimental results, their interpretation, as well as the experimental conclusions that can be drawn. Triangulated irregular network (TIN), natural neighbor (NN), ordinary kriging (OK), inverse distance weighted (IDW), radial basis function (RBF), thin plate spline (TPS), empirical bayesian kriging (EBK) and so on (Krivoruchko and Gribov, 2019; Zou et al., 2021; Han and Suh, 2024; Minh et al., 2024).
IDW uses weights to measure the influence of sample points on interpolation points, as shown in Equation 2 (Habib et al., 2020). The closer the distance to the interpolation point, the greater the weight; points beyond the distance threshold have a weight of 0. This method does not consider the spatial correlation between discrete point clouds. It has a low computational load, making it a simple and efficient interpolation algorithm, but it is susceptible to the influence of uneven point cloud distribution.
where:
RBF method constructs a surface that passes through all the sample points, and using different basis functions results in surfaces of different shapes and outcomes. As shown in Figure 5, the profiles of surfaces fitted by the IDW algorithm and the RBF algorithm are compared. In Figure 6a, the IDW algorithm only calculates estimated values between the maximum and minimum elevations of the sample points. In contrast, Figure 6b shows that the RBF algorithm can calculate estimated values that are greater or less than the elevations of the sample points, resulting in a smooth fitted surface.
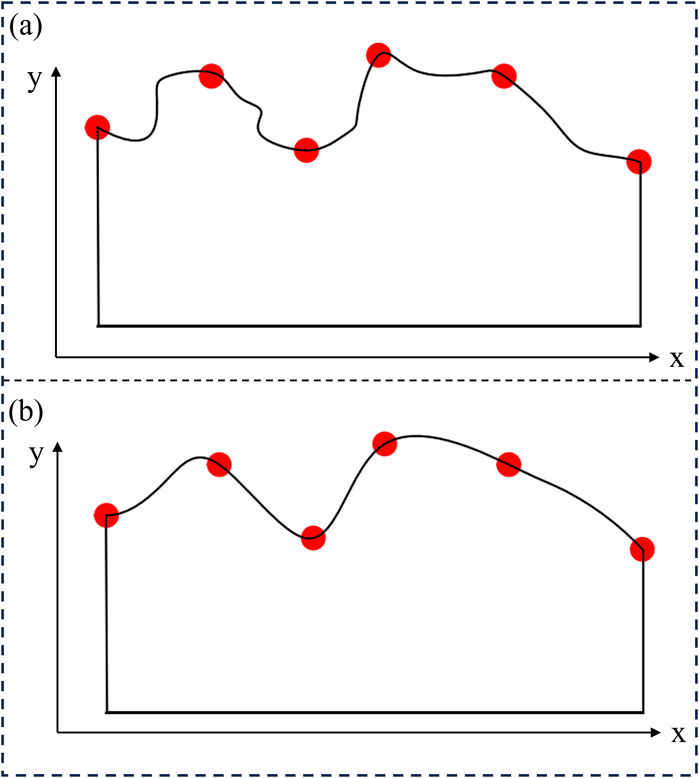
Figure 6. Profiles of IDW and RBF fitted surfaces. ((a) IDW-fitted profile within sample elevation range. (b) RBF-fitted profile exceeding sample elevation range, smoother surface.)
RBF method is a linear combination of a series of exact interpolation methods. Its interpolation principle uses multiple surfaces to approximate the target surface. For a random interpolation point x, assuming there are m neighboring sample points
where:
where: m represents the number of ground points.
TPS is a multidimensional interpolation method using RBF with a foundational linear combination function for scattered data. TPS obtains related ground points from the interpolation and removes noise points. TPS for two independent position covariates and an additional covariate is shown in Equation 7. The smoothing functions
where:
Kriging is a high-quality interpolation method that can effectively perform the best linear unbiased prediction of data, avoiding clustering effects. EBK interpolation method stands out from various Kriging methods such as Ordinary Kriging (OK), Universal Kriging (UK), and Co-Kriging (CK). This is because EBK can automatically optimize multiple semivariogram models and uses a relatively small number of the nearest observations to predict values at specified locations, as shown in Equation 9. The weights are calculated according to Equations 10 and 11 (Zou et al., 2016; Zaresefat et al., 2023).
where:
To ensure the effectiveness of terrain suitability analysis for PV panel placement, 10% of the original ground points were randomly selected to form a subset dataset for validation purposes. Cross-validation was then performed in ArcGIS Pro using the Geostatistical Analyst module to assess the accuracy of DTMs generated with different LiDAR point densities and interpolation techniques. The primary validation criteria were the average elevation error and the Root Mean Square Error (RMSE). The average error measures the degree of average deviation between a set of measurements and the actual values, effectively assessing DTM accuracy. RMSE is a numerical standard for measuring DTM accuracy, representing the square root of the sum of the squared deviations of the observed values from the true values divided by the number of observations n. It is calculated based on Equations 12–14 (Pouladi et al., 2019; Chen et al., 2021; Wu et al., 2024).
To minimize the potential for random errors associated with a single cross-validation, additional validation was performed using ground-truth points collected in the field through Real-Time Kinematic (RTK) surveying. The elevation values from the DTM are extracted to the corresponding points. The mean elevation error of the DTM is then calculated based on Equations 12–14.
where:
3.3 Terrain analysis for selecting the optimal installation area
Based on the calculations of S and AS, suitable slope and aspect regions were selected. Then, using a solar radiation model, the distribution of solar radiation on the surface was analyzed, identifying the areas with the most abundant solar radiation as the optimal solar radiation regions. Subsequently, the optimal regions of the three factors were intersected to determine the best installation locations that comprehensively consider S, AS, and SR. The workflow is shown in Figure 7.
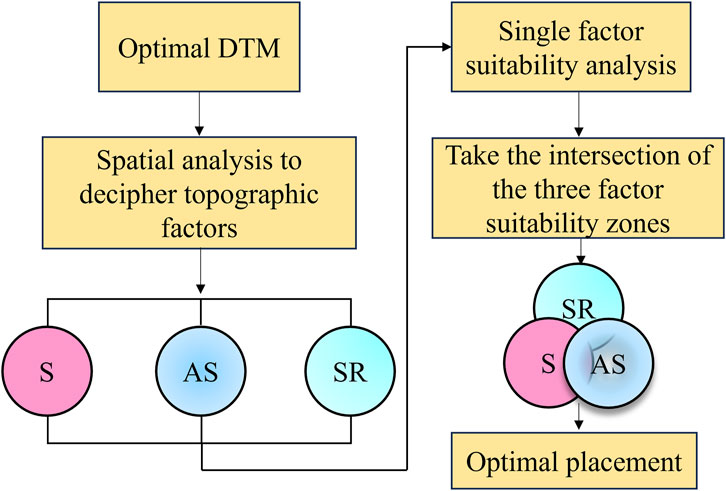
Figure 7. Topographic analysis to select the optimum location.
4 Results
This experiment conducted a comparative analysis of various interpolation methods to evaluate their potential for interpolating accurate DTMs from training data with different point cloud densities. The selected interpolation methods were applied to all training datasets to create DTMs with a spatial resolution of 0.5 m. A total of 60 DTMs were interpolated across three test zones. TPS method was integrated into the topo to raster (ANUDEM) tool, which can input data such as contour lines, flow accumulation points, and cliff lines to assist in interpolating ground points into DTMs (Igaz et al., 2021; Chen et al., 2022b).
All interpolations were performed using the default settings in ArcGIS Pro. The training DTMs were then evaluated against the validation dataset to assess the consistency between each DTM and the measured elevations (Salekin et al., 2018).
By combining elevation information with the octree method to compress point clouds, this study explores the impact of different compression rates and various point cloud interpolation methods on the constructed DTM. Using a 20% compression step, ground points were selected at rates of 100%, 80%, 60%, 40%, and 20% compression, and DTMs were constructed using four methods. The error check results for zone A are shown in Figure 8a. It was found that the ME and M of the DTMs interpolated using TPS were higher than those of other methods at all compression rates, while the errors for RBF and IDW were similar. The error check results for zone B are shown in Figure 8b. The highest M of 0.109 m was observed for the DTM interpolated using TPS at an 80% compression rate. The error check results for zone C are shown in Figure 8c. Similar to zones A and B, the ME and M of the DTMs interpolated using EBK at different compression rates were lower than those of the other three methods. Specifically, the M of the DTM interpolated using EBK at an 80% compression rate was only 0.004, 0.008, and 0.005 m higher than the M of the DTM constructed from uncompressed point clouds in zones A, B, and C, respectively.
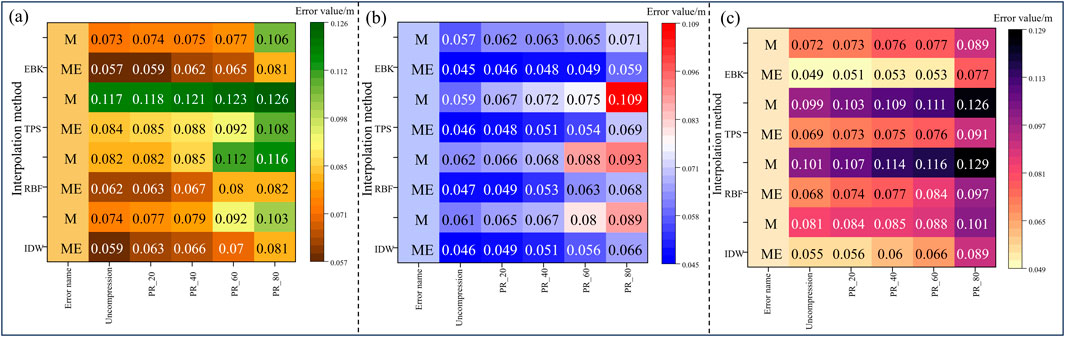
Figure 8. Cross-validation of DTM errors in different test zones. ((a) Error comparison for Zone A under varying compression rates and interpolation methods. (b) Error comparison for Zone B under varying compression rates and interpolation methods. (c) Error comparison for Zone C under varying compression rates and interpolation methods.)
Point cloud compression effectively reduces the number of points while maintaining the shape and features of the original point cloud. This process is typically used to reduce data storage requirements, improve processing speed, or simplify subsequent data processing tasks. Choosing an appropriate interpolation method is crucial for constructing DTMs from point clouds, as it directly affects the accuracy and retention of terrain features in the generated DTM. Considering the above analysis, the DTM constructed by interpolating an 80% compressed point cloud using the EBK method was selected for the subsequent terrain analysis for solar photovoltaic panel installation site selection.
S is a measure of the inclination of a surface, typically expressed in degrees or as a percentage. In geomorphology, slope is used to describe the steepness of the terrain, which is an important consideration for the installation of solar photovoltaic panels.
Using the spatial analysis tools in ArcGIS Pro, the slope of the test zone was interpreted based on a high spatial resolution DTM of 0.5 m. The slope classification of the test zone was divided according to the slope nodes set in the “Yunnan Provincial Forest Resource Planning and Design Survey Operational Guidelines” (Zhu et al., 2022). The specific classifications from levels I to VI are shown in Table 3.
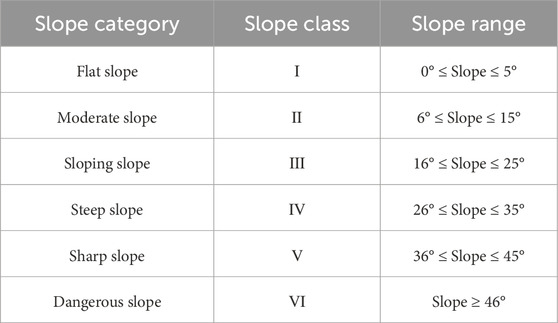
Table 3. Slope classification.
The optimal installation angle for solar photovoltaic panels is typically close to the latitude of the location. Terrain slopes of less than 26° are generally suitable for installing solar photovoltaic panels, corresponding to levels I to III. Smaller slopes can effectively reduce the installation difficulty of photovoltaic panels and minimize safety risks during installation and maintenance. In contrast, larger terrain slopes require more complex support structures and pose greater safety risks.
As shown in Figure 9, in test zone A, level IV accounts for 40.015% of the entire area, while levels I, II, and III account for 4.745%, 8.900%, and 26.489%, respectively. In test zone B, level III accounts for 38.345% of the entire area, while levels I and II account for 9.386% and 30.494%, respectively. In test zone C, level III accounts for 28.978% of the entire area, while levels I and II account for 7.783% and 23.698%, respectively. From the perspective of slope suitability, 40.134% of test zone A and 60.459% of test zone C are suitable for solar photovoltaic panel installation, while test zone B has the highest suitability, with 78.225% of the area meeting the criteria for installation.
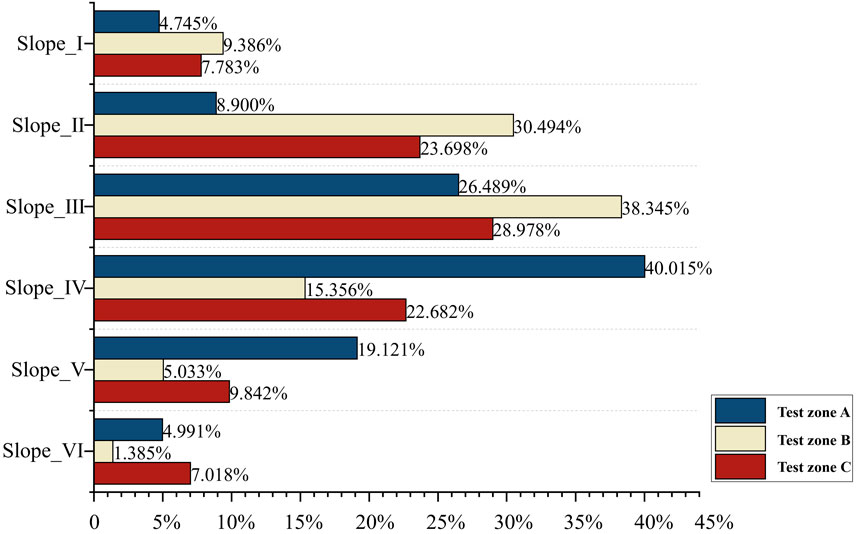
Figure 9. Slope classification statistics for Test zone A, Test zone B, and Test zone C. Slope _I to Slope _VI correspond to: I (0° ≤ Slope ≤ 5°), II (6° ≤ Slope ≤ 15°), III (16° ≤ Slope ≤ 25°), IV (26° ≤ Slope ≤ 35°), V (36° ≤ Slope ≤ 45°), and VI (Slope ≥ 46°), as defined in Table 3.
AS refers to the orientation of a terrain slope. It affects the duration of sunlight, solar radiation intensity, temperature, and thus influences plant growth and environmental changes. In the installation of solar photovoltaic panels, aspect is also an important reference factor and can be classified according to Table 4. A sunny slope is a slope that faces the sun, receiving good solar radiation and directly capturing sunlight. Sunny slopes are the optimal installation locations for solar photovoltaic panels.

Table 4. Aspect classification.
As shown in Figure 10, the proportion of half shady slopes in zones A, B, and C is relatively high, at 36.535%, 37.892%, and 43.758%, respectively. However, the parts of the half shady slopes affected by shadows are not suitable for photovoltaic panel installation, as shading can reduce the efficiency of power generation. To avoid the impact of shading and other factors, this experiment only considers sunny slope areas for selecting suitable locations for solar photovoltaic panel installation. In the three test zones, the proportion of sunny slopes is 38.397%, 33.250%, and 23.846%, respectively.
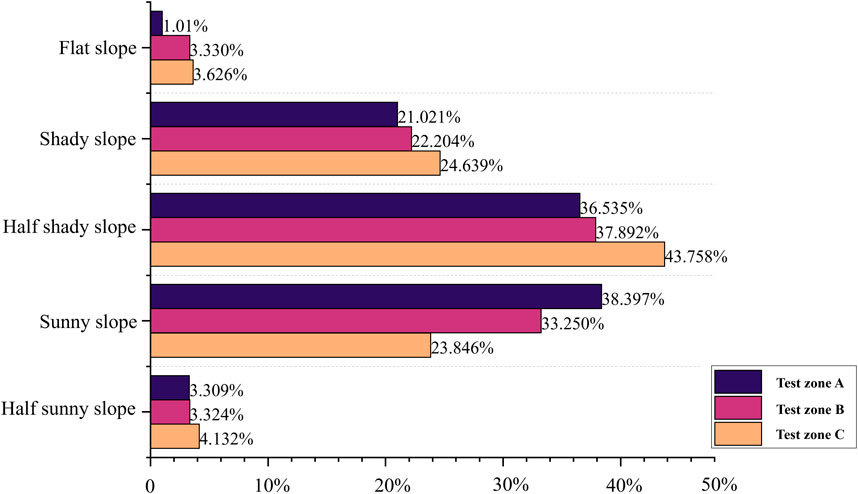
Figure 10. Distribution of slope aspect types in test zone A, test zone B, and test zone C. The aspect types were classified as flat slope, shady slope, half shady slope, sunny slope, and half sunny slope according to the definitions in Table 4.
With the rise of renewable energy, solar energy, as a clean and renewable resource, has its radiation amount directly determining the power generation efficiency of solar panels and the economic feasibility of the project. In ArcGIS Pro’s solar radiation analysis, the latitude of the test area is set to N 26°18′, the sky size is set to 200, and the time configuration is set to multiple days throughout the year with an interval of 14 days and half-hour intervals to plot the solar radiation for the three test areas. As shown in Figure 11, visual interpretation indicates a high content of red levels in all three areas. Statistical analysis shows that the red level proportions are 46.363%, 48.328%, and 46.439% for the respective areas.
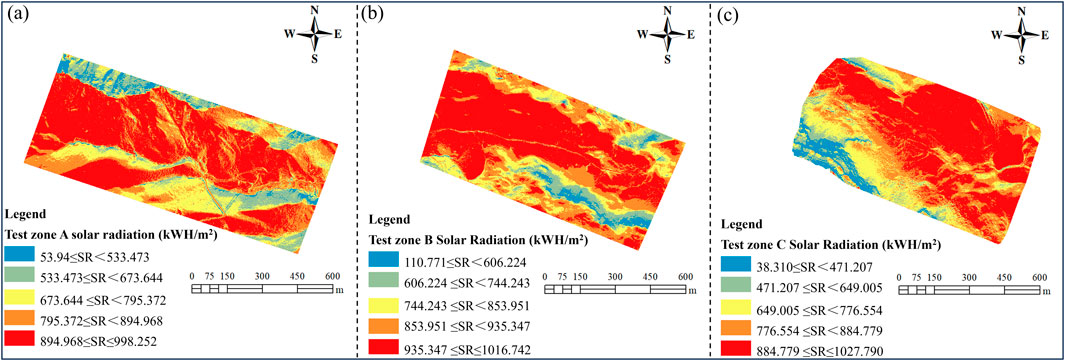
Figure 11. Distribution of solar radiation. ((a) Test zone A, where the red-level (highest radiation) proportion is 46.363%. (b)Test zone B, where the red-level proportion is 48.328%. (c) Test zone C, where the red-level proportion is 46.439%.)
The solar radiation level is a key indicator for evaluating the abundance of solar energy resources in a given area, thus providing essential data for the planning and design of solar energy projects. At the landscape scale, terrain plays a significant role in determining the spatial variation of sunlight, as shadows cast by terrain features such as elevation, angle, and aspect influence the amount of sunlight received in each zone. In this study, slope classes I to III (S), sunny slopes (AS), and areas with the highest solar radiation (SR) were comprehensively considered. By intersecting these three factors, the most suitable locations for solar photovoltaic panel installation were identified. As shown in Figure 12a, the suitable installation area in test zone A is calculated to be 82,360 m2. Figure 12b shows that the suitable area in test zone B is 302,462 m2, while Figure 12c indicates that the suitable area in test zone C is 97,464 m2.
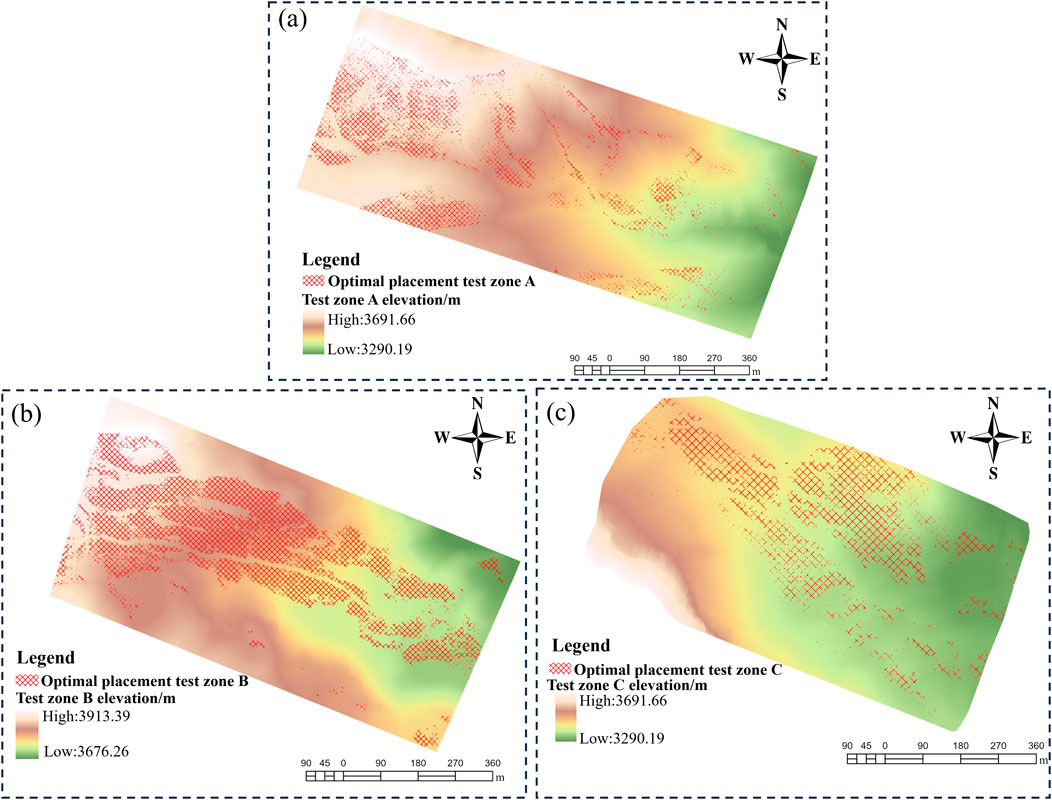
Figure 12. Optimal PV panel placement zones and elevation for test zones A, B, and C. ((a) Suitable installation area in test zone A. (b) Suitable installation area in test zone B. (c) Suitable installation area in test zone C.)
5 Discussion
This methodological framework is designed to seamlessly integrate LiDAR point cloud compression with the specific siting requirements of PV panel deployment. Initially, a geometry-preserving adaptive compression algorithm is applied to the raw point cloud data, achieving an 80% compression ratio while still supporting the generation of a high-resolution DTM. Subsequently, three key terrain-related factors that directly affect PV installation—S, AS, and SR—are extracted and filtered using empirically defined thresholds. GIS-based spatial overlay and intersection analyses are then performed to isolate regions that meet all optimal conditions simultaneously. This ensures that the prioritized deployment zones not only receive maximum solar irradiance but also demonstrate high engineering constructability and operational stability. The proposed end-to-end workflow enhances both the efficiency of large-scale terrain data processing and the precision of site suitability evaluation for PV systems. Moreover, the final site recommendations emphasize engineering feasibility, thereby supporting scientifically grounded and operationally viable siting decisions. The method is readily generalizable to diverse geographic contexts and topographic conditions.
In the context of solar photovoltaic panel site selection, terrain plays a crucial role. DTMs provide a digital representation of surface elevation, enabling detailed characterization of potential installation sites. This study investigates how point cloud compression and interpolation methods affect DTM accuracy through high-resolution DTM construction and terrain factor analysis. By integrating intersection analysis of S, AS, and SR, this approach establishes a scientific basis for optimal PV panel placement. Cățeanu and Ciubotaru (2021) demonstrated that reducing LiDAR sampling density to 50%–60% of the original can still achieve relatively high DTM accuracy, provided an appropriate interpolation algorithm is used. By contrast, our octree-based compression scheme, enhanced with elevation constraints, reduces the point cloud by 80%. Experimental results show that, even at this high compression ratio, the resulting DTMs differ from those generated with uncompressed data by only 0.004–0.008 m on average across test zones A, B, and C. This highlights the efficiency and reliability of our adaptive compression strategy in maintaining high spatial accuracy for terrain modeling, and demonstrates clear improvement over previous approaches in balancing data reduction with accuracy preservation.
Additionally, when using EBK interpolation to generate the DTM, the runtime for the original point cloud in the three regions was 516, 512, and 263 s, respectively. Under 80% compression, the runtimes were dramatically reduced to 68, 44, and 35 s, respectively. These results demonstrate that a carefully designed compression strategy can substantially reduce data storage requirements and computational costs while maintaining high DTM fidelity. This provides valuable insights for large-scale terrain data processing. Although existing studies have explored octree and curvature clustering-based compression (Ji et al., 2019; Liu et al., 2020), most focus primarily on data management or storage efficiency. Our study, by contrast, validates the feasibility of generating high-quality DTMs from highly compressed point clouds specifically for PV site selection in mountainous regions, thus expanding the practical applicability of point cloud compression in renewable energy planning.
While this study compared several widely-used interpolation methods—including IDW, RBF, TPS, and EBK—each has inherent limitations. Notably, IDW is highly sensitive to the spatial distribution of sample points, which often results in errors in regions with uneven point density, especially over large or heterogeneous landscapes (Habib et al., 2020). RBF and TPS tend to produce over-smoothed surfaces or are subject to parameter tuning challenges, particularly in complex terrain where accurately capturing fine-scale topographic variation is crucial (Chen et al., 2022a). Although EBK excels at handling data uncertainty and spatial variability, its reliance on prior information may introduce bias in highly heterogeneous environments (Krivoruchko and Gribov, 2019).It should also be noted that the experimental test zone in this study featured ideal data quality and minimal vegetation interference. However, in mountainous or forested regions, LiDAR point clouds are frequently affected by noise, outliers, and data voids, which can substantially degrade both point cloud compression and interpolation accuracy. Furthermore, the significant computational and storage requirements for large-scale terrain modeling remain a major challenge, as demonstrated in this study (Chen et al., 2023). Therefore, future work should aim to validate the proposed methodology across more complex and diverse real-world scenarios and explore adaptive or hybrid interpolation strategies, in combination with noise suppression and robust data preprocessing techniques, to further enhance the accuracy and robustness of DTM generation for photovoltaic site assessment.
Both Li et al. (2024) and Finn and McKenzie (2020) have confirmed that overlaying key terrain and solar factors in GIS enables robust identification of PV-suitable zones. Building on these approaches, our study further integrates these factors (S, AS, SR) with high-resolution, compressed DTM data, and quantitatively validates site suitability in complex mountainous terrain—demonstrated by the 78.225% optimal area identified in test zone B. This finding highlights the feasibility and advantage of our multi-factor, GIS-based workflow for PV deployment in challenging real-world landscapes. In summary, our methodological advances not only facilitate high-efficiency terrain data processing but also enhance the scientific rigor of PV siting recommendations. Future research could incorporate additional factors relevant to solar PV site selection, such as economic variables (e.g., transportation and maintenance costs) and ecological constraints (e.g., environmental protection requirements), to construct a more comprehensive site selection framework. Additionally, integrating multi-factor analysis results with energy output simulations could further support the economic evaluation and planning of solar projects.
6 Conclusion
The selection of suitable installation areas is crucial for ensuring the efficiency and long-term sustainability of solar photovoltaic panels. Terrain factors, such as slope, aspect, and topographic relief, directly influence solar radiation reception and photovoltaic panel performance, with high-resolution DTM serving as the foundation for terrain analysis. LiDAR technology, through its point cloud data, accurately captures the three-dimensional structure of the Earth’s surface, providing essential support for photovoltaic panel site selection. However, the high density and vast volume of LiDAR point clouds present significant challenges for data processing. This study systematically optimized the generation of DTMs from point clouds using elevation information combined with octree compression and various interpolation methods. Through comprehensive analysis of slope, aspect, and solar radiation, the study identified the optimal areas for photovoltaic panel installation, offering valuable insights for solar panel site selection.
Key findings have emerged in the areas of point cloud compression and DTM generation. By introducing octree point cloud compression, the study significantly reduced data storage requirements and processing complexity while effectively preserving terrain features. Experimental results show that the DTM generated from point cloud data compressed at an 80% rate achieved nearly the same accuracy as the DTM generated from uncompressed point clouds, with mean square errors increasing by only 0.004, 0.008, and 0.005 m in the three test zones. These results demonstrate that a well-designed point cloud compression strategy can substantially improve processing efficiency, offering an effective solution for DTM generation in large-scale, complex terrain areas. Additionally, the study compared four interpolation methods—IDW, RBF, TPS, and EBK—and found that the EBK method yielded the highest DTM accuracy when applied to compressed point cloud data, making it particularly suitable for complex terrain environments. This provides a reliable technology for future terrain modeling and site selection analysis.
In the comprehensive analysis of terrain factors, this study computed the slope, aspect, and solar radiation distribution using high-resolution DTMs, and further determined the optimal installation areas through intersection analysis. The results indicated that areas with gentler slopes (Class I–III) and south-facing slopes are more suitable for photovoltaic panel installation. Among the three test zones, test zone B demonstrated the highest overall suitability, with an installation proportion of 78.225% and a suitable area of 302,462 m2. This finding validates the practicality and scientific foundation of multi-factor intersection analysis in site optimization, providing technical support for efficient photovoltaic panel installation.
This experiment not only theoretically expands the application of point cloud compression and DTM generation technologies in solar energy site selection but also provides a reference framework for practical engineering. The combination of octree compression technology and EBK interpolation method offers a new approach for efficiently processing large-scale point cloud data, particularly suitable for solar photovoltaic site optimization in complex terrain areas (e.g., mountainous regions). Additionally, through the integrated analysis of slope, aspect, and solar radiation factors, this study has established a scientific site selection decision framework that can guide the spatial layout of solar energy resources, enhancing the power generation efficiency and economic benefits of photovoltaic power plants. However, several areas still require improvement: the point cloud compression process may result in the loss of some feature points. Future research could explore more suitable compression methods for mountainous regions to further enhance compression efficiency while preserving key terrain features. Furthermore, interpolation methods still need optimization, and future studies could investigate the integration of multiple interpolation techniques or adaptive interpolation methods to better accommodate different terrain types and regional characteristics. Additionally, future research can incorporate more factors related to photovoltaic site selection (such as economic, ecological, and social aspects) and combine energy yield prediction models to further improve the practical application value of site selection schemes.
Data availability statement
The raw data supporting the conclusions of this article will be made available by the authors, without undue reservation.
Author contributions
BW: Conceptualization, Validation, Visualization, Writing – original draft, Writing – review and editing. KQ: Conceptualization, Funding acquisition, Writing – original draft. HS: Data curation, Formal Analysis, Supervision, Writing – review and editing. XZ: Data curation, Formal Analysis, Writing – review and editing. YH: Data curation, Writing – review and editing. YY: Data curation, Methodology, Software, Supervision, Writing – review and editing.
Funding
The author(s) declare that financial support was received for the research and/or publication of this article. The article is supported by the National Natural Science Foundation of China (No. 41975041).
Acknowledgments
The authors would like to acknowledge the reviewers and the editors for their valuable comments and suggestions to improve the quality of this manuscript.
Conflict of interest
Author YH was employed by Yunnan Aerial Survey Technology Co., Ltd.
The remaining authors declare that the research was conducted in the absence of any commercial or financial relationships that could be construed as a potential conflict of interest.
Generative AI statement
The author(s) declare that Generative AI was used in the creation of this manuscript. This article used AI to check and improve the English grammar and language clarity of the manuscript.
Publisher’s note
All claims expressed in this article are solely those of the authors and do not necessarily represent those of their affiliated organizations, or those of the publisher, the editors and the reviewers. Any product that may be evaluated in this article, or claim that may be made by its manufacturer, is not guaranteed or endorsed by the publisher.
References
Alami Merrouni, A., Elwali Elalaoui, F., Mezrhab, A., Mezrhab, A., and Ghennioui, A. (2018). Large scale PV sites selection by combining GIS and analytical hierarchy process. Case study: eastern Morocco. Renew. Energy 119, 863–873. doi:10.1016/j.renene.2017.10.044
Alvarez, O., Guo, Q., Klinger, R. C., Li, W., and Doherty, P. (2014). Comparison of elevation and remote sensing derived products as auxiliary data for climate surface interpolation. Int. J. Climatol. 34 (7), 2258–2268. doi:10.1002/joc.3835
Balsa-Barreiro, J., and Lerma, J. L. (2014). Empirical study of variation in lidar point density over different land covers. Int. J. Remote Sens. 35 (9), 3372–3383. doi:10.1080/01431161.2014.903355
Cățeanu, M., and Ciubotaru, A. (2021). The effect of LiDAR sampling density on DTM accuracy for areas with heavy forest cover. Forests 12 (3), 265. doi:10.3390/f12030265
Chen, Z., Li, J., and Yang, B. (2021). A strip adjustment method of UAV-borne LiDAR point cloud based on DEM features for mountainous area. Sensors 21 (8), 2782. doi:10.3390/s21082782
Chen, C., Bei, Y., Li, Y., and Zhou, W. (2022a). Effect of interpolation methods on quantifying terrain surface roughness under different data densities. Geomorphology 417, 108448. doi:10.1016/j.geomorph.2022.108448
Chen, C., Gao, Y., Li, Y., and Bei, Y. (2022b). Structure tensor-based interpolation for the derivation of accurate digital elevation models. Catena 208, 105733. doi:10.1016/j.catena.2021.105733
Chen, J., Xiong, L., Yin, B., Hu, G., and Tang, G. (2023). Integrating topographic knowledge into point cloud simplification for terrain modelling. Int. J. Geogr. Inf. Sci. 37 (5), 988–1008. doi:10.1080/13658816.2023.2180801
Demir, A., Dincer, A. E., and Yilmaz, K. (2023). A novel method for the site selection of large-scale PV farms by using AHP and GIS: a case study in Izmir, Turkiye. Sol. Energy 259, 235–245. doi:10.1016/j.solener.2023.05.031
Doljak, D., and Stanojevic, G. (2017). Evaluation of natural conditions for site selection of ground-mounted photovoltaic power plants in Serbia. Energy 127, 291–300. doi:10.1016/j.energy.2017.03.140
Drozd, S., and Kussul, N. (2024). Solar energy potential mapping in Ukraine through integration of GIS, remote sensing, and fuzzy logic. Eur. J. Remote Sens. 57 (1), 2362390. doi:10.1080/22797254.2024.2362390
Fan, L., and Atkinson, P. M. (2018). A new multi-resolution based method for estimating local surface roughness from point clouds. Isprs J. Photogrammetry Remote Sens. 144, 369–378. doi:10.1016/j.isprsjprs.2018.08.003
Finn, T., and Mckenzie, P. (2020). A high-resolution suitability index for solar farm location in complex landscapes. Renew. Energy 158, 520–533. doi:10.1016/j.renene.2020.05.121
Freitas, S., Catita, C., Redweik, P., and Brito, M. C. (2015). Modelling solar potential in the urban environment: state-of-the-art review. Renew. Sustain. Energy Rev. 41, 915–931. doi:10.1016/j.rser.2014.08.060
Gao, Y., Zhu, Y., Chen, C., Hu, Z., and Hu, B. (2023). A weighted radial basis function interpolation method for high accuracy DEM modeling. Geomatics Inf. Sci. Wuhan Univ. 48 (8), 1373–1379. doi:10.13203/i.whugis20210100
Gassar, A. a. A., and Cha, S. H. (2021). Review of geographic information systems-based rooftop solar photovoltaic potential estimation approaches at urban scales. Appl. Energy 291, 116817. doi:10.1016/j.apenergy.2021.116817
Habib, M., Alzubi, Y., Malkawi, A., and Awwad, M. (2020). Impact of interpolation techniques on the accuracy of large-scale digital elevation model. Open Geosci. 12 (1), 190–202. doi:10.1515/geo-2020-0012
Han, H., and Suh, J. (2024). Spatial prediction of soil contaminants using a hybrid random forest-ordinary kriging model. Appl. Sciences-Basel 14 (4), 1666. doi:10.3390/app14041666
He, L., Yan, Z., Hu, Q., Xiang, B., Xu, H., and Bai, Y. (2023). Rapid assessment of slope deformation in 3D point cloud considering feature-based simplification and deformed area extraction. Meas. Sci. Technol. 34 (5), 055201. doi:10.1088/1361-6501/acafff
Huang, Y., Chen, Z., Wu, B., Chen, L., Mao, W., Zhao, F., et al. (2015). Estimating roof solar energy potential in the downtown area using a GPU-accelerated solar radiation model and airborne LiDAR data. Remote Sens. 7 (12), 17212–17233. doi:10.3390/rs71215877
Huang, X., Hayashi, K., Matsumoto, T., Tao, L., Huang, Y., and Tomino, Y. (2022). Estimation of rooftop solar power potential by comparing solar radiation data and remote sensing data—a case study in Aichi, Japan. Remote Sens. (Basel). 14 (7), 1742. doi:10.3390/rs14071742
Igaz, D., Sinka, K., Varga, P., Vrbicanova, G., Aydin, E., and Tarnik, A. (2021). The evaluation of the accuracy of interpolation methods in crafting maps of physical and hydro-physical soil properties. Water 13 (2), 212. doi:10.3390/w13020212
Jathar, L. D., Ganesan, S., Awasarmol, U., Nikam, K., Shahapurkar, K., Soudagar, M. E. M., et al. (2023). Comprehensive review of environmental factors influencing the performance of photovoltaic panels: concern over emissions at various phases throughout the lifecycle. Environ. Pollut. 326, 121474. doi:10.1016/j.envpol.2023.121474
Ji, C., Li, Y., Fan, J., and Lan, S. (2019). A novel simplification method for 3D geometric point cloud based on the importance of point. IEEE Access 7, 129029–129042. doi:10.1109/access.2019.2939684
Kazem, H. A., Chaichan, M. T., Al-Waeli, A. H. A., and Sopian, K. (2020). A review of dust accumulation and cleaning methods for solar photovoltaic systems. J. Clean. Prod. 276, 123187. doi:10.1016/j.jclepro.2020.123187
Krivoruchko, K., and Gribov, A. (2019). Evaluation of empirical Bayesian kriging. Spat. Stat. 32, 100368. doi:10.1016/j.spasta.2019.100368
Li, Y., Zhou, J., Feng, Z., and Skilodimou, H. D. (2023). Location of mountain photovoltaic power station based on fuzzy analytic hierarchy process-taking Longyang District, Baoshan City, Yunnan Province as an example. Sustainability 15 (24), 16955. doi:10.3390/su152416955
Li, X., Dong, X., and Ye, Y. (2024). An interaction model applied to optimize photovoltaic farm location: a case study of China. Appl. Energy 356, 122421. doi:10.1016/j.apenergy.2023.122421
Liang, L., Fu, C., Gao, Y., Su, T., Wan, F., Xiong, X., et al. (2024). An optimal siting and economically optimal connectivity strategy for urban green 5G BS based on distributed photovoltaic energy supply. Energy Convers. Manag., 301. doi:10.1016/j.enconman.2023.118043
Lingfors, D., Bright, J. M., Engerer, N. A., Ahlberg, J., Killinger, S., and Widén, J. (2017). Comparing the capability of low- and high-resolution LiDAR data with application to solar resource assessment, roof type classification and shading analysis. Appl. Energy 205, 1216–1230. doi:10.1016/j.apenergy.2017.08.045
Liu, J., Xu, F., and Lin, S. (2017). Site selection of photovoltaic power plants in a value chain based on grey cumulative prospect theory for sustainability: a case study in Northwest China. J. Clean. Prod. 148, 386–397. doi:10.1016/j.jclepro.2017.02.012
Liu, S., Liang, J., Ren, M., He, J., Gong, C., Lu, W., et al. (2020). An edge-sensitive simplification method for scanned point clouds. Meas. Sci. Technol. 31 (4), 045203. doi:10.1088/1361-6501/ab5e00
Martínez-Rubio, A., Sanz-Adan, F., Santamaría-Peña, J., and Martínez, A. (2016). Evaluating solar irradiance over facades in high building cities, based on LiDAR technology. Appl. Energy 183, 133–147. doi:10.1016/j.apenergy.2016.08.163
Minh, N. Q., Huong, N. T. T., Khanh, P. Q., Hien, L. P., and Bui, D. T. (2024). Impacts of resampling and downscaling digital elevation model and its morphometric factors: a comparison of hopfield neural network, bilinear, bicubic, and kriging interpolations. Remote Sens. 16 (5), 819. doi:10.3390/rs16050819
Minh Tri, N., Cong Toai, T., Vu Thinh, N., Van Tu, D., Huy Hung, N., and Tan Tien, N. (2022). Research on adhesive coefficient of rubber wheel crawler on wet tilted photovoltaic panel. Appl. Sciences-Basel 12 (13), 6605. doi:10.3390/app12136605
Nelson, J. R., and Grubesic, T. H. (2020). The use of LiDAR versus unmanned aerial systems (UAS) to assess rooftop solar energy potential. Sustain. Cities Soc. 61, 102353. doi:10.1016/j.scs.2020.102353
Pouladi, N., Moller, A. B., Tabatabai, S., and Greve, M. H. (2019). Mapping soil organic matter contents at field level with Cubist, Random Forest and kriging. Geoderma 342, 85–92. doi:10.1016/j.geoderma.2019.02.019
Rus, T., Moldovan, R.-P., and Picazo, M. a. P. (2024). LCA analysis of a roof mounted PV system: a Romanian case study. Front. Environ. Sci. 12, 1413629. doi:10.3389/fenvs.2024.1413629
Salekin, S., Burgess, J. H., Morgenroth, J., Mason, E. G., and Meason, D. F. (2018). A comparative study of three non-geostatistical methods for optimising digital elevation model interpolation. Isprs Int. J. Geo-Information 7 (8), 300. doi:10.3390/ijgi7080300
Sánchez-Aparicio, M., Del Pozo, S., Martín-Jiménez, J. A., González-González, E., Andrés-Anaya, P., and Lagüela, S. (2020). Influence of LiDAR point cloud density in the geometric characterization of rooftops for solar photovoltaic studies in cities. Remote Sens. (Basel). 12 (22), 3726. doi:10.3390/rs12223726
Shi, Z., Xu, W., and Meng, H. (2022). A point cloud simplification algorithm based on weighted feature indexes for 3D scanning sensors. Sensors 22 (19), 7491. doi:10.3390/s22197491
Song, X., Huang, Y., Zhao, C., Liu, Y., Lu, Y., Chang, Y., et al. (2018). An approach for estimating solar photovoltaic potential based on rooftop retrieval from remote sensing images. Energies (Basel). 11 (11), 3172. doi:10.3390/en11113172
Tawalbeh, M., Al-Othman, A., Kafiah, F., Abdelsalam, E., Almomani, F., and Alkasrawi, M. (2021). Environmental impacts of solar photovoltaic systems: a critical review of recent progress and future outlook. Sci. Total Environ., 759. doi:10.1016/j.scitotenv.2020.143528
Tiwari, A., Meir, I. A., and Karnieli, A. (2020). Object-based image procedures for assessing the solar energy photovoltaic potential of heterogeneous rooftops using airborne LiDAR and orthophoto. Remote Sens. (Basel). 12 (2), 223. doi:10.3390/rs12020223
Tong, H., Lv, Z., Jiang, J., Gao, X., Wang, Z., You, C., et al. (2025). Analysis of regional photovoltaic power generation suitability in China using multi-source data. Front. Earth Sci. 12, 1528134. doi:10.3389/feart.2024.1528134
Vecchi, F., and Berardi, U. (2024). Solar analysis for an urban context from GIS to block-scale evaluations. Energy Policy 184, 113884. doi:10.1016/j.enpol.2023.113884
Wang, X., Ma, X., Yang, F., Su, D., Qi, C., and Xia, S. (2020). Improved progressive triangular irregular network densification filtering algorithm for airborne LiDAR data based on a multiscale cylindrical neighborhood. Appl. Opt. 59 (22), 6540–6550. doi:10.1364/ao.394341
Wang, G., Wu, L., Hu, Y., and Song, M. (2021). Point cloud simplification algorithm based on the feature of adaptive curvature entropy. Meas. Sci. Technol. 32 (6), 065004. doi:10.1088/1361-6501/abd497
Waqas, H., Jiang, Y., Shang, J., Munir, I., and Khan, F. U. (2023). An integrated approach for 3D solar potential assessment at the city scale. Remote Sens. 15 (23), 5616. doi:10.3390/rs15235616
Wong, M. S., Zhu, R., Liu, Z., Lu, L., Peng, J., Tang, Z., et al. (2016). Estimation of Hong Kong’s solar energy potential using GIS and remote sensing technologies. Renew. Energy 99, 325–335. doi:10.1016/j.renene.2016.07.003
Wu, Y., Gan, X., Zhou, Y., and Yuan, X. (2024). Estimation of diameter at breast height in tropical forests based on terrestrial laser scanning and shape diameter function. Sustainability 16 (6), 2275. doi:10.3390/su16062275
Xiao, W., Lv, X., Zhao, Y., Sun, H., and Li, J. (2020). Ecological resilience assessment of an arid coal mining area using index of entropy and linear weighted analysis: a case study of Shendong Coalfield, China. Ecol. Indic. 109, 105843. doi:10.1016/j.ecolind.2019.105843
Xiao, S., Zou, L., Xia, J., Dong, Y., Yang, Z., and Yao, T. (2023). Assessment of the urban waterlogging resilience and identification of its driving factors: a case study of Wuhan City, China. Sci. Total Environ., 866. doi:10.1016/j.scitotenv.2022.161321
Yilmaz, K., Dincer, A. E., and Ayhan, E. N. (2023). Exploring flood and erosion risk indices for optimal solar PV site selection and assessing the influence of topographic resolution. Renew. Energy 216, 119056. doi:10.1016/j.renene.2023.119056
Zaresefat, M., Hosseini, S., and Roudi, M. A. (2023). Addressing nitrate contamination in groundwater: the importance of spatial and temporal understandings and interpolation methods. Water 15 (24), 4220. doi:10.3390/w15244220
Zeybek, M., and Sanlioglu, I. (2020). Investigation of landslide detection using radial basis functions: a case study of the Takent landslide, Turkey. Environ. Monit. Assess. 192 (4), 230. doi:10.1007/s10661-020-8101-0
Zhu, Z., Gan, S., Zhang, J., Yuan, X., Wang, R., and Zhang, X. (2022). Identification of geological potential landslides in Cang Mountain by combining SBAS-InSAR technique and information entropy. Bull. Surv. Mapp. (11), 13–19. doi:10.13474/j.cnki.11-2246.2022.0318
Zhu, Z., Yuan, X., Gan, S., Zhang, J., and Zhang, X. (2023). A research on a new mapping method for landslide susceptibility based on SBAS-InSAR technology. Egypt. J. Remote Sens. Space Sci. 26 (4), 1046–1056. doi:10.1016/j.ejrs.2023.11.009
Zou, L., Kent, J., Lam, N. S. N., Cai, H., Qiang, Y., and Li, K. (2016). Evaluating land subsidence rates and their implications for land loss in the lower Mississippi River Basin. Water 8 (1), 10. doi:10.3390/w8010010
Keywords: LiDAR point cloud, point cloud compression, terrain analysis, solar photovoltaic panels, DTM
Citation: Wan B, Qin K, Shi H, Zhang X, Huan Y and Yang Y (2025) Research on solar photovoltaic panel layout based on compressed LiDAR point cloud. Front. Earth Sci. 13:1490356. doi: 10.3389/feart.2025.1490356
Received: 03 September 2024; Accepted: 31 July 2025;
Published: 02 September 2025.
Edited by:
Pengfei Liu, CCCC Second Harbor Engineering Co., Ltd., ChinaReviewed by:
Weizhen Hou, Harvard University, United StatesRoberto Alonso González-Lezcano, CEU San Pablo University, Spain
Arti Tiwari, University of Maryland, United States
Ahmed C. Kadhim, University of Technology, Iraq
Copyright © 2025 Wan, Qin, Shi, Zhang, Huan and Yang. This is an open-access article distributed under the terms of the Creative Commons Attribution License (CC BY). The use, distribution or reproduction in other forums is permitted, provided the original author(s) and the copyright owner(s) are credited and that the original publication in this journal is cited, in accordance with accepted academic practice. No use, distribution or reproduction is permitted which does not comply with these terms.
*Correspondence: Kai Qin, cWlua2FpQGN1bXQuZWR1LmNu