 U. Z. Magawata
 N. K. Olasunkanmi2
- 1Physics Department, Abdullahi Fodio University of Science and Technology, Aliero, Nigeria
- 2Physics and Material Science Department, Kwara State University, Malete, Kwara, Nigeria
- 3Department of Physics, Ibrahim Badamasi Babangida University, Lapai, Nigeria
This study investigates the lithological boundaries, structural features, and mineralization potential in the southwestern part of the Sokoto Basin, Nigeria, using an integrated approach involving high-resolution aeromagnetic, radiometric, and Landsat 8 multispectral data. The aeromagnetic data were enhanced using tilt derivative, analytical signal, and first vertical derivative filters to delineate subsurface lithological units and structural trends. Depth-to-source estimations were carried out using Euler deconvolution and Source Parameter Imaging (SPI), while radiometric data were analyzed to map potassium concentrations indicative of hydrothermal alteration zones. Landsat 8 imagery supported lithological and structural mapping through band ratios and false-color composites. The results revealed three major magnetic zones, high (53.3–120.2 nT), intermediate (27.0–53.2 nT), and low (-50.8–22.3 nT) corresponding to different rock units. Depth models highlighted complex basement topography with favorable zones for subsurface mineralization. Structural interpretation identified faults and NE-SE trending fractures that control fluid flow. Potassium anomaly zones were associated with metamorphosed rocks such as amphibolites and quartz mica schists, indicating gold-related hydrothermal alteration aligned with major structural features. The integration of geophysical and remote sensing methods provides a more detailed and spatially extensive understanding of the subsurface geology compared to traditional field-based mapping, offering valuable insights for future mineral exploration and a refined geological interpretation of the Sokoto Basin.
1 Introduction
The study area is located in the southwestern part of the Sokoto Basin, at the boundary between the sedimentary and basement complex regions in northwestern Nigeria. The Neoproterozoic schist belts, running from southwest to northwest across Nigeria, consist mainly of green-schist facies and various metamorphic grades (Wright et al., 1985). Two significant fault systems, the NE–SW Kalangai-Ifewara and the NNE–SSW Anka-Yauri-Iseyin shear zones, have disrupted earlier N–S structures in the Pan-African basement, influencing the structural layout and subsurface arrangement of crystalline rocks (Wright et al., 1985). These fault systems intersect the Zuru schist belt (ZSB), known for its mapping and the presence of auriferous high-strain zones (Garba, 2000). The ZSB, formed during the Pan-African orogeny, is part of the trans-Saharan mobile belt.
The study area is renowned for its connection to mesothermal gold deposits and mineral occurrences typically found in alluvial placer deposits (Kogbe, 1979; Fagbohun et al., 2020). These deposits, considered of orogenic origin, are primarily structurally controlled (Wright et al., 1985; Garba, 2000) and are mainly located within quartz veins, encompassing formations such as amphibolite, phyllites, mica schist, and various types of gneisses with differing lithologies. Rock deformations in the region significantly impact geological structures, influencing tectonic events and the accumulation of hydrothermal fluids (Garba, 2000). These events can affect rocks of varying ages, leading to both linear and curvilinear geomorphological features. While some previous research utilized geophysical tools, including aeromagnetic data, Landsat8 data, and radiometric responses to describe lithology and geological structures for mineral prospecting in selected areas within the southwestern part of the Sokoto Basin (Danbatta and Garba, 2007; Ranjbar et al., 2011; Olasunkanmi et al., 2020; Bamigboye et al., 2018; Elkhateeb and Abdellatif, 2018; Olasunkanmi et al., 2023; Augie et al., 2022), our study focuses on the Zuru-BirninYauri schist belt, one of several schist belts hosting gold deposits within Nigeria’s basement complex (Garba, 2000). This study integrates aeromagnetic and radiometric data to (i) identify lithologic boundaries, (ii) detect structural trends influencing mineralization fluid movement, and (iii) estimate the depth extent of suspected mineral veins in the southwestern part of the Sokoto Basin. The study area spans from 3o 30′ 00″E to 5o 30′ 00″E and 10o 00′ 00″N to 12o 00′ 00″N, situated in the southwestern part of the Sokoto Basin, Nigeria (Figure 1). This area primarily consists of an undulating plain with elevations ranging from 250 m to 400 m above sea level. The geological setting comprises three petro-lithological units: the sedimentary complex, the gneiss-migmatite unit containing older granitoids, and supracrustal schist belts consisting of metasedimentary and metavolcanic rocks. The Sokoto Basin’s sedimentary deposits are divided into three sequences: the lower continental beds, including the Gundumi and Illo Formations, the Rima and Sokoto groups deposited during the Maastrichtian transgression, and the Gwandu Formation deposited from the upper Eocene to Miocene, representing the post-Paleocene continental terminal. These sediments gently dip and thicken toward the northwest, reaching approximately 1,200 m near the border with the Niger Republic. The migmatite–gneiss complex, a dominant lithological unit in Nigeria’s basement complex, includes migmatites, paragneisses, orthogneisses, and various basic and ultrabasic metamorphosed rocks (Obaje, 2009). The Pan-African terrane in northwest Nigeria, separating the West Africa and Congo cratons, comprises the Proterozoic–Early Phanerozoic terrane, which underwent regional metamorphism during the Pan-African tectonic event (600–150 Ma) (Kogbe, 1979; Wright et al., 1985). Pan-African shield units consist of gneisses and migmatites in the basement, schist belts, and Pan-African granitoids. Many granitoid plutons yield ages between 750 Ma and 450 Ma (Kogbe, 1979), and most host rocks exhibit narrow thermal auriferous zones.

Figure 1. Simplified tectonic map of the southwestern part of Sokoto Basin, modified after NGSA (2009).
2 Potential field data and methodology
2.1 Magnetic data
We obtained a high-resolution aeromagnetic dataset consisting of 16 sheets (grid size 55 km × 55 km per sheet) from the Nigeria Geological Survey Agency (NGSA) (NGSA, 20,009). These data were acquired by Fugro Aero Services, Ltd., between 2004 and 2009 for mineral resource development in Nigeria (NGSA, 2009). The magnetic response depicted in Figure 2 was recorded with 500-m line spacing in the NW–SE direction, 80-m terrain clearances, and 2,000-m tie line spacing in the NE–SW direction. We removed the International Geomagnetic Reference Field (IGRF) and applied reduction to the equator (RTE) to eliminate near-surface noise and enhance magnetic anomalies over the study area. The data have an inclination and declination angle of I = 3.021, D = −0.245. The reduction to the equator (RTE) is the preferred operation for low magnetic latitude to remove the magnetic inclination effect associated with low latitude regions, mainly because the study is situated within the low latitude region (Dentith and Mudge, 2014). When induced magnetization occurs, a negative (low) anomaly will be recorded because the geomagnetic field of the Earth is opposed by a magnetic body near the magnetic equator (Jain, 1892; Dobrin and Savit, 1988; Pal et al., 2017). However, a magnetic high will be observed over non-magnetic bodies, while a magnetic low will be observed over magnetic bodies (Mishra, 2011). The resulting residual magnetic anomaly (RTE-RMA) map (Figure 2b) was upwardly continued to 200 m to improve the visibility of magnetic anomalies (Figure 2c).
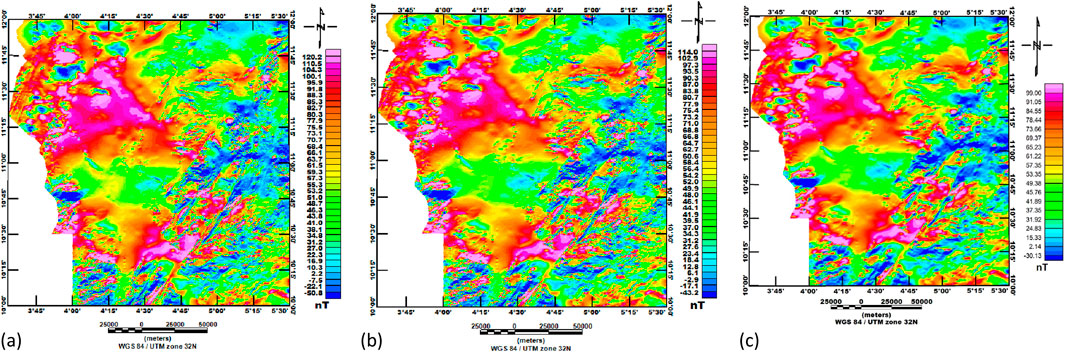
Figure 2. (a) Total magnetic intensity (TMI) map, (b) reduced to equator-residual magnetic anomaly map, showing the magnetic contrast of southwestern Sokoto Basin, and (c) upward continuation to 200 m.
Other enhancement techniques employed included total horizontal derivatives in estimating the contact locations of bodies at depth (Ndousa-Mbarga et al., 2012). Euler deconvolution applying various structural indices was used to assess the location of the magnetic sources, and depth spectral analysis through the fast Fourier transform (FFT) approach was used to evaluate the depth to the magnetic basement. The power spectral analysis technique is a critical tool in estimating the mean depths for shallow and deep subsurface structures. This involves generating a radially averaged power spectrum profile from geophysical anomaly data, such as gravity or magnetic surveys, over the area of interest. The raw geophysical data are first preprocessed to remove noise, regional trends, or residuals that could obscure the underlying frequency characteristics of the anomalies. After preprocessing, the data are transformed into the frequency domain using a Fourier transform, which converts spatial variations in the signal into corresponding frequency components. The power spectrum is computed from the squared magnitude of the Fourier-transformed data, and the results are averaged radially to produce a power spectrum that is independent of direction, focusing solely on the depth-related frequency characteristics of the subsurface structures. This radially averaged power spectrum is then analyzed to distinguish between contributions from shallow and deep sources. The slope of the logarithmic power spectrum is interpreted to calculate the mean depths, as deeper sources contribute more to low-frequency components while shallow sources dominate the high-frequency components. The calculated depths are typically visualized and validated against known geological models or additional data sources.
Three NE–SW, N–S, and NW–SE profiles were established to cross the major notable structural/deformational trends in Nigeria. The profiles have a varying length of 150 km–210 km. Two-dimensional modeling of magnetic anomalies was performed in the gravity/magnetic system (GM-SYM) (an extension modeling interface in Oasis Montaj Geosoft) across the three significant profiles A-A′, B-B′, and C-C′ (Figures 3A–C) to map the subsurface structures, basement topography, and basement depths. The structural trend was further configured with shuttle radar topography mission (SRTM) data and estimated depth to causative bodies using power spectral analysis.
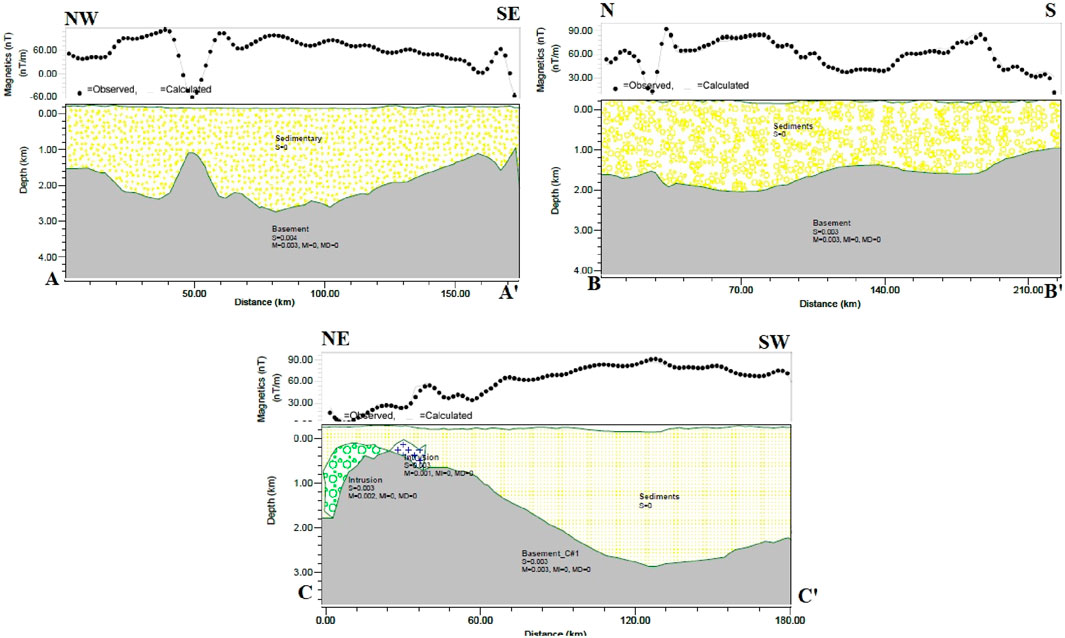
Figure 3. Two-dimensional profile models: (A) A-A′ in the NW–SE direction, (B) B-B′ in the N–S direction, and (C) C-C′ in the NE–SW direction.
2.2 Radiometric data
Aero-radiometric datasets from the Nigerian Geological Survey Agency (NGSA) were measured using an advanced digital high-resolution gamma-ray spectrometer (ADS, model Rs-500) coupled with eight crystals connected to a solid scintillation detector. The data provided measurements of potassium (%), thorium (ppm), and uranium (ppm) elemental concentrations at the shallow surface. The data were processed to enhance elemental depositional contrast using color composite images within red–green–blue (RGB) bands and ternary images. These were used to recognize the radiometric signatures attributable to host rocks, significant to mineralization enrichment (Talaat and Mohammed, 2011; Akinsunmade et al., 2020).
3 Result and discussion
3.1 Magnetic geological sequences
The magnetic anomalies in the study area range from 2.2 nT to 120.2 nT, and they correspond to three main magnetic zones (Figure 2a). High magnetic amplitudes (53.3–120.2 nT) are observed in the northwestern region, primarily associated with sedimentary rocks. Intermediate magnetic anomalies (27.0–53.2 nT) dominate the western and central parts, as well as some northern regions, corresponding to metasedimentary rocks. Low magnetic anomalies (−50.8 to 22.3 nT) are prevalent in the eastern part and are associated with metamorphic rocks. The positive magnetic intensity (related to sedimentary rocks) trends in the NW–EW orientation, while the negative magnetic anomalies (related to basement complex rocks) trend in the NE–SW orientation. In the southeastern part, linear magnetic anomalies are observed, likely associated with the Anka and Zuru-BirninYauri regional lineament.
The 2D models depicted in Figure 3A serve to validate and complement the information derived from the RTE-RMA data, shedding light on the contrasting lithological features within the study area. These features include sedimentary rocks denoted as SR, encompassing formations such as the Gwandu Formation (GF) Illo Formation (IF), Gundumi Formation, Sokoto Group (SG), Rima Group (RM), and the basement rock formation (BC), as summarized in Table 1. These models reveal a complex basement topography characterized by variations in magnetization and magnetic susceptibility. In the extreme northwestern segment of profile A-A′, a sedimentary cover of 1.5 km thickness is observed within the sedimentary formation. Conversely, moving toward the central part of the profile, an approximately 80 km decrease in depth is evident, with sedimentary cover exceeding 2.3 km within the same formation. As one proceeds toward the southeastern part, there is an uplift of the basement (indicating intrusive bodies), resulting in a reduction of sedimentary thickness to approximately 1.5 km. Conversely, sediment thickness increases toward the profile’s extreme end, intersecting the upper Bida Basin. The 2D profile labeled B-B′ encompasses the northern to central zone and extends to the extreme southwestern part of the study area (Figure 3B). In the northern region, the 2D model unveils a basement depth of approximately 1.6 km. Approximately 30 km from the profile’s starting point, in the northern section, a depth decrease of approximately ∼2.0 km is observed. This continues for approximately 80 km into the central region within the sedimentary formation, maintaining a consistent depth. Furthermore, a shallow basement with a depth of approximately ∼1.0 km is noticeable toward the southern part of the basement rock complex. The highest recorded sedimentary thickness in this region reaches approximately ∼2.0 km. Profile ‘C–C' (Figure 3C) traverses both the SR and BR formations. At the outset of the profile, an intrusive rock is detected at a depth of 1.8 km, characterized by a susceptibility of 0.03 nT and magnetization of 0.02 nT. Progressing along the profile, approximately 30 km into the northeastern region, an intrusion of porphyritic granite within the basement is identified. Generally, the thickness of the basin within this profile varies from 1.0 km to 2.5 km. These results align with prior research conducted in analogous study areas, where magnetic source depths ranging from 1.0 km to 2.7 km have been documented (Cooper, 2009; Oyeniyi et al., 2016; Agarwal and Lal, 1969; Rapolla et al., 2002).
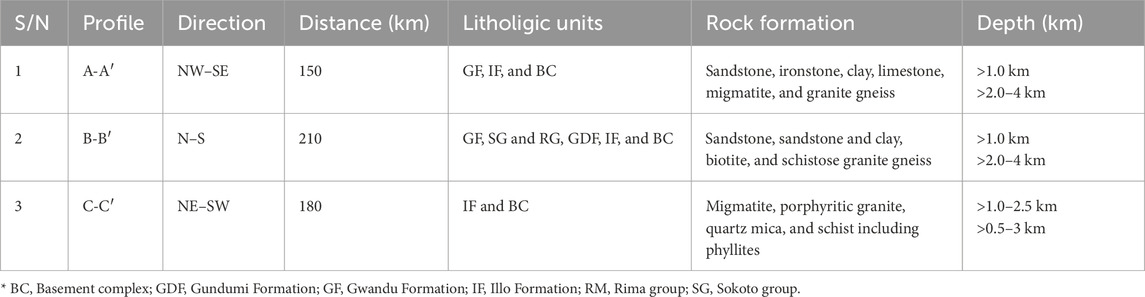
Table 1. Summary of varying lithologic units, rock formations, and depth to magnetic causative bodies using 2D modeling of the magnetic anomalies.
3.2 Basement depth estimation
Different sets of Euler’s depth solutions were employed, each corresponding to a specific structural index (SI) value of (0.5, 1, and 2). Additionally, a window size of 3,000, with a maximum depth tolerance of 15%, generated the most meaningful results for identifying potential geometries. The best cluster was observed at SI = 0.5, revealing a distinct structural trend with the total horizontal gradient magnitude (THGM) at a shallow depth of less than 69.5 m. This trend extends to a depth of approximately 561.1 m, corresponding to the thickness of the sedimentary rock (Figure 4a). Consequently, the estimated depth of the sediment thickness overlying the basement rocks is approximately 110.4 m. When SI = 1, different cluster solutions emerged, highlighting the contacts and edges of intrusive bodies at shallow depths, approximately 200 m at shallow depth (Figure 4b). SI = 2 indicated the presence of vertical penetrative horizontal cylinders or vertical bodies, often referred to as “pipes” (Figure 4c). In this case, the thickness of the basin was estimated to exceed 764.8 m. The delineated structural trends in the NE–SW direction, as observed when SI = 1 was superimposed on the THGM map, align with the influence of the Pan-African Orogeny. This alignment suggests that the mineralization in the area is predominantly controlled by these structural features (Figure 4d). Furthermore, spectral analysis unveiled distinct depth ranges: 69.5 m–200 m for shallow sources, 300 m–400 m for intermediate sources, and depths ranging from 500 m to 600 m for deep sources (Figure 4e). Importantly, the estimated depths obtained from the Euler solutions fell within the same ranges, ranging from 69.5 m to 400 m for shallow and intermediate magnetic sources. This agrees with the results obtained using spectral analysis. The systematic approach to Euler’s depth solutions, combined with spectral analysis, has provided valuable insights into the subsurface structures and depths of magnetic sources in the study area.
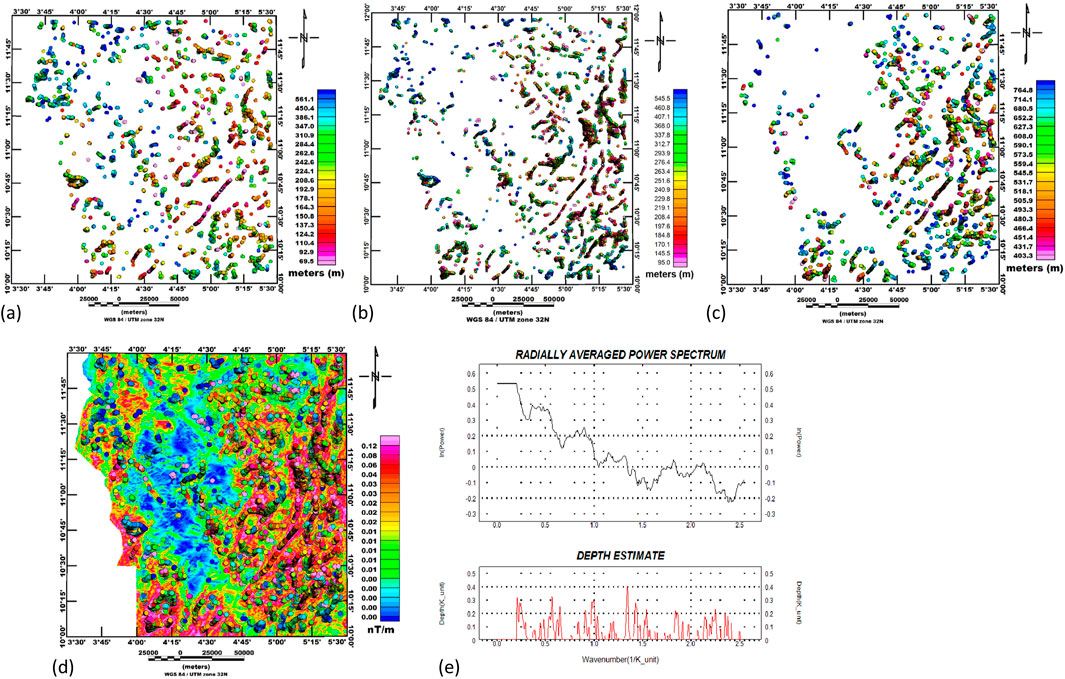
Figure 4. (a) Euler deconvolution showing approximate depth to the anomaly with a window size of 3,000 and a maximum depth tolerance of 15% for SI = 0.5, (b) SI = 1, and (c) SI = 2; (d) superimposition of the Euler solution of the structural index of 1.0 on the horizontal derivative map, and (e) radially average power spectrum estimate of depth.
3.3 Structural features
The total horizontal gradient magnitude’ (THGM) provides valuable insights into prominent structural features and the enhancement of boundaries associated with causative sources (Figure 5a). The structural features are shown in the THGM map (Figure 5a), the first vertical derivative (FVD) map (Figure 5b), and a gray scale of the first vertical derivative (Figure 5c).
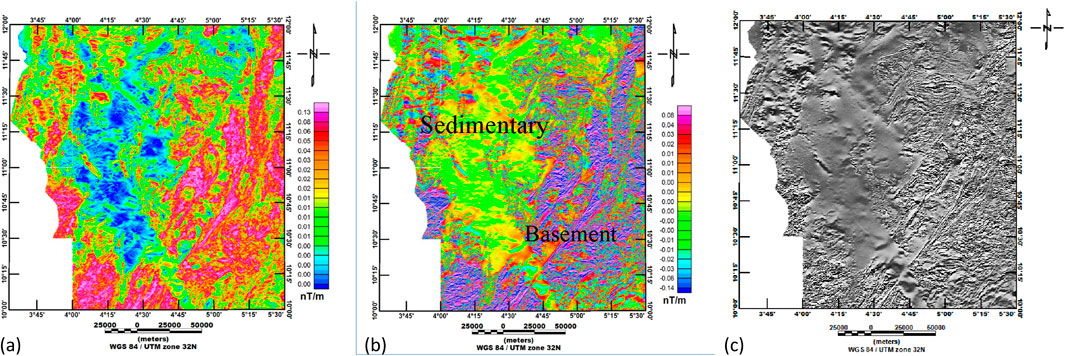
Figure 5. (a) Total horizontal derivative, (b) first vertical derivative, and (c) grayscale of the first vertical derivative map.
These structural features are outlined and presented in the structural maps (Figures 6a, b) and displayed in rose diagrams Figures 6c, d. The THGM filter is useful for detecting magnetized structural edges and tends to enhance shallow anomalies (Bonde et al., 2014). This function reveals a peak anomaly above the magnetic contacts (Shehu et al., 2004). The THGM map highlights key structural features in the study area and provides valuable insights into their potential significance. Notably, it identifies prominent structures that are of geological interest, suggesting that these peaks might be associated with mineralization. This implies that areas with heightened structural activity or anomalies could serve as indicators of mineral deposits, emphasizing the importance of these features in guiding exploration efforts. By linking structural peaks to potential mineralization, the THGM map is both a diagnostic tool and a predictive framework for understanding subsurface processes. These structures controlled the area correspond with ongoing artisan mining activities, suggesting a potential area for mineralization. The FVD is derived by calculating the second vertical derivative (2VD) of the second horizontal derivatives using the Laplace equation (Umego, 1990; Oyeniyi et al., 2016; Adetona et al., 2008).
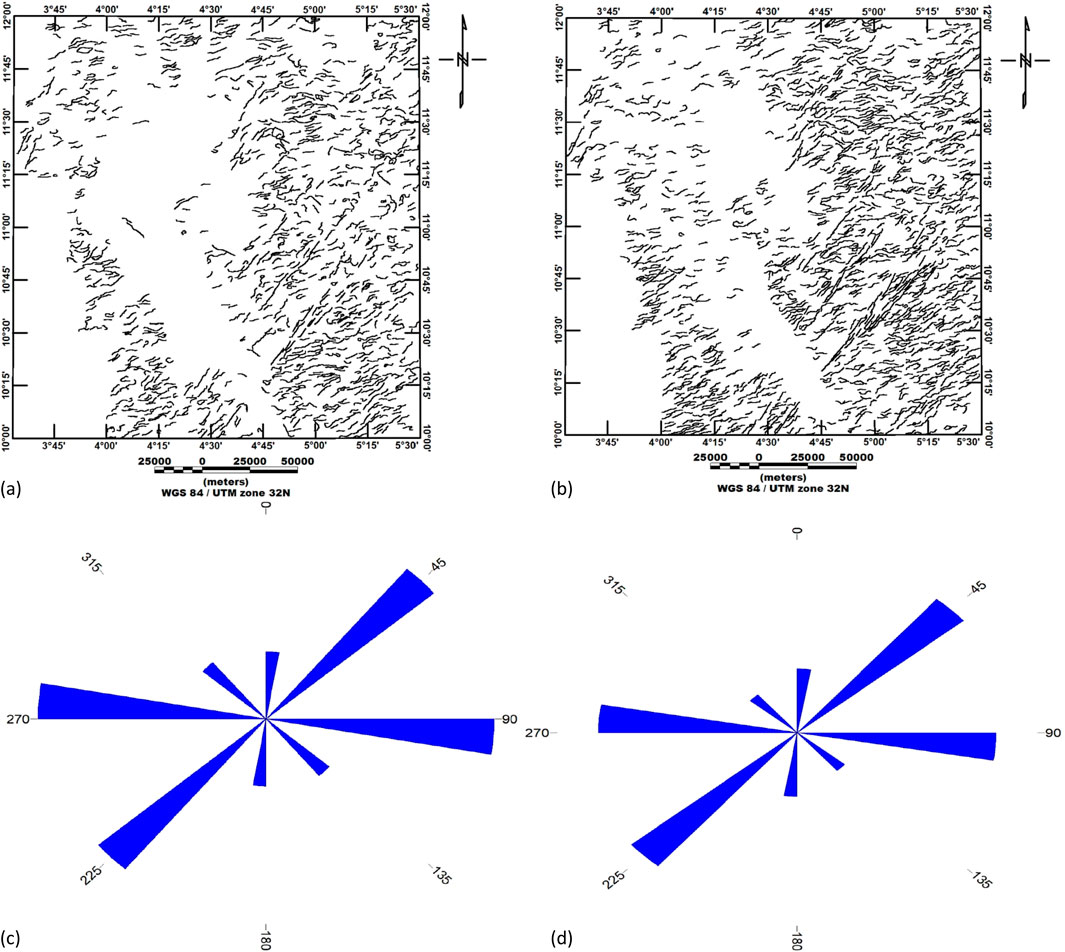
Figure 6. Structural map of the area computed from the identified maxima of the (a) horizontal gradient magnitude, (b) first vertical derivative, and the rose diagram computed from the maxima of the (c) horizontal gradient magnitude and the (d) first vertical derivative.
Comparing the FVD map (Figure 5b) with the RTE map, it becomes apparent that structural features that are not visible in the RTE map are pronounced in the FVD map. This FVD map reflects near-surface structural features and provides insights into structural enhancements, possibly indicating the main pathways for hydrothermal activity in the region. To enhance the visualization of structural features that might not be discernible in the long-wavelength anomalous bodies, the FVD map was transformed into a grayscale image (Figure 5c). This transformation reveals a series of linear and curvilinear geologic structures, including faults, fractures, folds, and shear zones, intersecting the country rocks. They are highlighted in Figure 5c. The composite aeromagnetic lineament, derived from FVD (Figure 6a) and THGM (Figure 6b), distinguishes the tectonic trends affecting the southwestern part of the Sokoto Basin. To further analyze this, an azimuth-frequency diagram was extracted from FVD and THGM maps, as shown in Figures 6c, d, respectively, to determine the directional trend of magnetic lineaments. The linear structures indicated in the rose diagram (Figure 6d) predominantly trend in the SE–NE direction. Notably, the NW–SE lineaments in the area are closely associated with the Anka and Yauri lineaments, as in Figure 8a. These lineaments are likely responsible for tectonic activities leading to the formation of faults and folds within the study area. Furthermore, a high density of lineaments is observed within granite-migmatite gneisses, quartz-mica schist, feldspathic sandstone, and amphibolite and corroborated the K-deviation concentration (Figure 8b). This observation suggests the possibility of extensive hydrothermal alteration due to the concentration of lineaments in these zones (Figure 8c). Previous reports (Garba, 2000; Danbatta and Garba, 2007; Talaat and Mohammed, 2011; Airo and Mertane, 2008) have documented shear zones exhibiting dextral displacement and a striking fault trend in the NW–SE direction, strongly associated with alteration and mineralization extending in the E–S direction within the area.
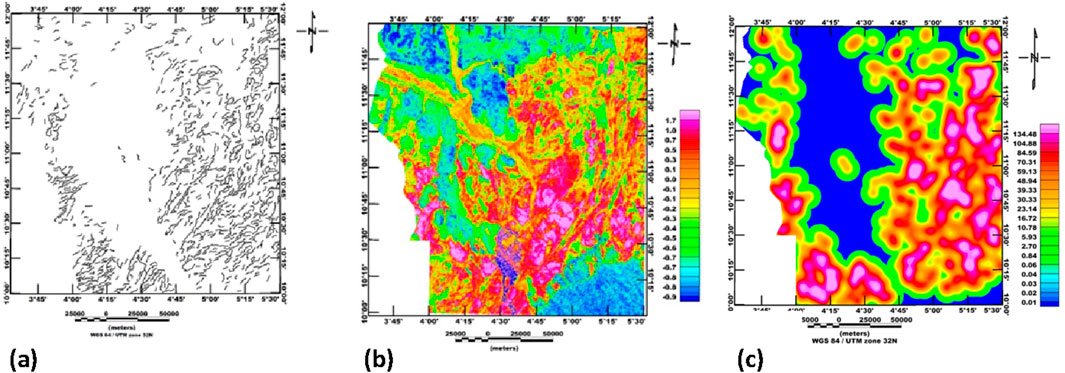
Figure 8. (a) Composite lineament map, (b) K-deviation map for delineation of hydrothermal alteration zones, and (c) composite aeromagnetic lineament density map of the area.
3.4 Potassium concentration and its implications
The prominent potassium concentration observed in the region serves as a crucial indicator of potential alteration zones associated with gold mineralization (Elkhateeb and Abdellatif, 2018; Olomo, et al., 2022). These high-potential areas are primarily situated in the eastern–southern (E–S) area, predominantly within geological formations such as amphibolite, migmatite, coarse-grained biotite, and gneiss. These zones exhibit substantial anomalies, with potassium concentrations ranging from 1.90% to 3.17%. In contrast, regions displaying weaker potassium signatures, ranging from 0.09% to 0.70%, are underlain by sedimentary rocks, including sandstone, ironstone, and feldspathic sandstone, often intersected by major waterways. However, certain exceptions exist where moderate potassium concentrations are observed. Moreover, the presence of high potassium anomalies, designated as H1 to H6, signifies potential zones of hydrothermal alteration, which are likely responsible for gold mineralization. These alterations may manifest as alluvial deposits, placer deposits, or quartz vein deposits. Remarkably, a strong correlation emerges between the high potassium signatures H1–H6 (Figure 7a), the total horizontal gradient magnitude (THGM) in (Figure 5b), and high magnetic density zones (Figure 7c). This suggests a significant relationship between hydrothermal alteration zones and structural features.
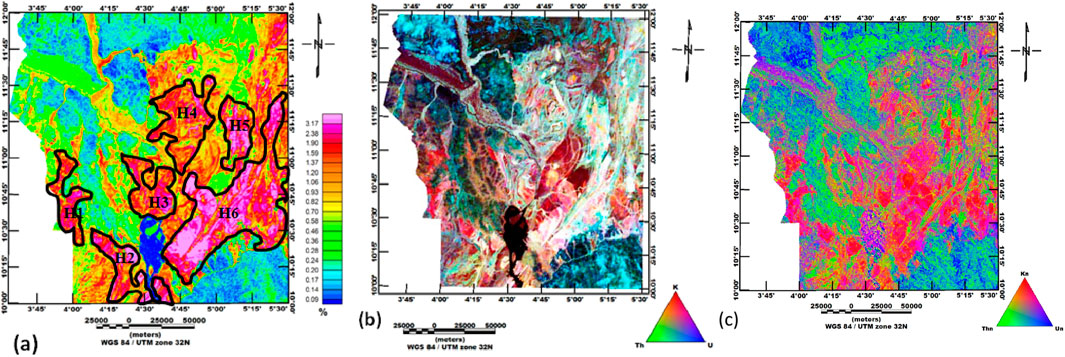
Figure 7. Potassium (K) (a) concentration map, (b) ternary map, and (c) normalization map of the area.
A ternary map was generated by equally modulating the proportions of potassium (K), thorium (Th), and uranium (U) concentrations (Figure 7b). The areas with high concentrations of all three radioactive elements are depicted in light colors, while darker regions indicate lower concentrations, often associated with weakly radioactive rocks (Dentith and Mudge, 2014). The darkest portions correspond to rocks with low radioactivity due to the presence of clay or carbonate rock (Dentith and Mudge, 2014; Olasunkanmi et al., 2023). Notably, the alteration zones marked H5 and H6 exhibit substantial extents and align closely with regional lineament anomalies in the area. This alignment correlates with the geological map, particularly the Anka and Yauri fault zones (Figure 1). These alteration zones are indicative of mesothermal gold deposits and are displayed individually in a normalized form, with potassium represented in red, thorium in green, and uranium in blue (Figure 7c).
The concentration of potassium (K) in the southeastern (S-E) zone suggests a strong influence of mineralization in that region, while thorium concentrations are notably higher in the northern area. Uranium is predominantly found in the extreme northwestern zone, and to some, extent in the southern and western regions of the area. Figure 8c highlights the significance of the potassium deviation (KD) map in targeting areas for potential mineral exploration. The ‘K deviation map effectively filters out unwanted signals stemming from weathering and lithological factors, thus culminating in the potassium concentration map and accentuating major alteration zones. Hydrothermal alteration anomaly zones represented by H1–H6 on the K map (Figure 8b) exhibit nearly identical characteristics to the KD map (Figure 8c) and serve as accurate indicators of hydrothermal alteration zones. The KD map demonstrates a strong correlation and agreement with the K map (H1 and H6) (Figures 8b, c), except for the significantly high concentration (H2) in the western part of the KD map, which is notably improved compared to the K map of the area. Prominent hydrothermal alteration zones are concentrated around notable geological structures such as fractures, shear zones, and various geological boundaries (Figure 8a). The correlation between the K (Figure 8b) and KD (Figure 8c) maps highlights distinct alteration zones. In general, areas with high K concentrations (Figure 8b) delineate favorable zones for mineralization, corresponding to high KD (Figure 8c) and low magnetic concentrations (Figure 2b) along various lithological boundaries. This proved a relationship association between alteration zones and magnetic lineaments.
3.5 Mapping mineral potential in the southwestern Sokoto Basin
The potential mineralized maps of the southwestern part of the Sokoto Basin were produced from total horizontal derivatives, THGM, Euler deconvolution, and potassium concentration (K) maps. The structures delineated in the FVD and Euler solutions display peak anomalies on the THGM map and indicate mineralized zones that coincide with areas exhibiting high lineament density zones (Figure 8c), where ore deposits can be assessed. The combined analysis of magnetic and radiometric responses offers insights into zones enriched with minerals. Previous studies (Garba, 2000; Fagbohun et al., 2020) reported that quartz veins in mesothermal deposits primarily host gold mineralization. The geological map and mineralization zones suggest a strong association between mineralization and geological formations comprising (mica schist, amphibolite schist tremolite, and various gneiss varieties) that form part of metasediment and metamorphic rocks (Figure 1). Notably, suspected prospective vein enrichment is observed within K-rich lithologies, specifically migmatite/paragneisses. The structural pattern, as well as depth estimates derived from magnetic anomalies, reveal that mineralization is concentrated within low to intermediate depths trending in a southeast (S-E) and east–west (E–W) to northeast–southwest (NE–SW) direction. These trends coincide with major transcurrent faults, notably the Anka and Yauri lineaments and other structural features along the southwestern part of the area. Previous reports indicate that significant structures in the area host mineralization, with the most prominent being NE-trending brittle strike–slip faults and E–W and N–S to NE–SW ductile trending folds (Olasunkanmi et al., 2023; Airo and Mertanen, 2008; Garba, 2000).
4 Conclusion
The comprehensive geological analysis conducted in the southwestern part of the Sokoto Basin provides valuable insights into the region’s lithology, structural trends, and potential for mineralization, particularly gold deposits. The study integrated aeromagnetic and radiometric data to delineate geological features and structural trends influencing mineralization. Analysis of high-resolution aeromagnetic data has revealed distinct magnetic anomalies, categorizing the study area into three magnetic zones: high, intermediate, and low. These anomalies correspond to different lithologies and geological formations, aiding in the identification of potential mineralization sites. Euler’s depth solutions, coupled with spectral analysis, provided valuable insights into the depth of magnetic sources. Shallow to deep magnetic source depths indicative of different geological features and structures were delineated. Results from the total horizontal gradient magnitude (THGM) and first vertical derivative (FVD) maps highlighted prominent structural features, including faults, fractures, folds, and shear zones. These structural trends generally concord with NE–SW traverse hornfels between granodiorite intrusion and phyllites and NW-–E sinistral faults crosscutting shear zones. The structural trends align with previous research on mineralization in the region and are closely associated with major tectonic trends that have a significant impact on mineralization. Mineralization in the area is associated with major transcurrent faults, including the Anka and Yauri lineaments. High-potential areas for hydrothermal alteration and mineralization, particularly gold deposits, were noticed. These areas exhibit high potassium concentrations that have strong correlations with structural features and magnetic anomalies. However, these areas coincide with geological formations known to host gold mineralization, such as mica schist, amphibolite schist, and various gneiss varieties. The identified hydrothermal alteration zones and structural trends offer valuable guidance for targeting potential gold deposits and other mineral resources for further exploration and mineral prospecting in the southwestern part of the Sokoto Basin.
Data availability statement
The original contributions presented in the study are included in the article/supplementary material; further inquiries can be directed to the corresponding author.
Author contributions
UM: conceptualization, methodology, software, visualization, and writing – original draft. NO: investigation, project administration, resources, and writing – review and editing. GE: data curation, visualization, and writing – review and editing. AS: conceptualization, supervision, validation, and writing – review and editing.
Funding
The author(s) declare that no financial support was received for the research and/or publication of this article.
Acknowledgments
The authors acknowledge the support of the Tertiary Education Trust Fund (TETFund), Abdullahi Fodio University of Science and Technology, Aliero (AFUSTA), Kwara State University (KWASU), and the Nigerian Geological Survey Agency (NGSA) for providing the necessary data and resources for this research. Additionally, we extend our sincere thanks to the reviewers for their valuable feedback, which greatly enhanced the quality of this article.
Conflict of interest
The authors declare that the research was conducted in the absence of any commercial or financial relationships that could be construed as a potential conflict of interest.
Publisher’s note
All claims expressed in this article are solely those of the authors and do not necessarily represent those of their affiliated organizations, or those of the publisher, the editors and the reviewers. Any product that may be evaluated in this article, or claim that may be made by its manufacturer, is not guaranteed or endorsed by the publisher.
References
Adetona, A. A., Udensi, E., and Agelaga, A. G. (2008). Determination of depth to buried rocks under the lower Sokoto Basin, Nigeria using aeromagnetic data. Niger J. Physiology 19, 275–284. doi:10.4314/njphy.v19i2.38144
Agarwal, B. N. P., and Lal, T. (1969). Calculation of the second vertical derivative of gravity field. J. Pure Appl. Geophys. 76 (1), 5–16. doi:10.1007/bf00877833
Airo, M. L., and Mertanen, S. (2008). Magnetic signatures related to orogenic gold mineralization, Central Lapland Greenstone Belt, Finland. J. Appl. Geophys. 64 (1), 14–24. doi:10.1016/j.jappgeo.2007.10.003
Akinsunmade, A., Nguyen Dinh, C., Wojas, A., and Tomecka-Suchon, S. (2020). Characterization of lithological zones of the Isanlu sheet 225, North Central Nigeria, using aero geophysical datasets. Acta Geophys. 68, 651–665. doi:10.1007/s11600-020-00411-6
Augie, A. I., Magawata, Y. I., Saleh, A., Magawata, U. Z., and Garba, N. (2022). Tracing the structures associated with manganese over the western part of Kebbi using aeromagnetic data. Sci. Forum Journal Pure Appl. Sci. doi:10.5455/sf.augie22
Bamigboye, O. S., Adekeye, J. I. D., Kadioglu, Y. K., Adedoyin, A. D., and Omorinoye, O. A. (2018). Geochemistry and origin of Fe-Mn oxide mineralization in Kaoje-Derena and their environs, northwestern Nigeria. Arab. J. Geosci. 11, 570–588. doi:10.1007/s12517-018-3872-0
Bonde, D. S., Udensi, E. E., and Momoh, M. (2014). Modeling of magnetic anomaly zones in Sokoto Basin, Nigeria. IOSR J. Appl. Geol. Geophys. 2 (1), 19–25. doi:10.9790/0990-02111925
Cooper, G. R. J. (2009). Balancing images of potential field data. Geophysics 74, L17–L20. doi:10.1190/1.3096615
Danbatta, U. A., and Garba, I. (2007). Geochemistry and petrogenesis of Precambrian amphibolites in the Zuru schist belt, northwest Nigeria. J. Min. Geol. 43 (1), 23–30. doi:10.4314/jmg.v43i1.18861
Dentith, M., and Mudge, S. T. (2014). Geophysics for the mineral exploration geoscientist. Cambridge (United Kingdom): Cambridge University Press.
Dobrin, M. B., and Savit, C. H. (1988). Introduction to geophysical prospecting. McGraw-Hill Book Company.
Elkhateeb, S. O., and Abdellatif, M. A. G. (2018). Delineation potential gold mineralization zones in a part of central eastern desert, Egypt using airborne magnetic and radiometric data. NRIAG J. Astron Geophys. 7 (2), 361–376. doi:10.1016/j.nrjag.2018.05.010
Fagbohun, B. J., Ayotunde, A. O., Oluseyi, A. B., and Femi, J. A. (2020). Remote detection and interpretation of structural style of the Zuru schist belt, northwest Nigeria. Geocarto Int. 37, 978–998. doi:10.1080/10106049.2020.1753822
Garba, I. (2000). Origin of pan-african mesothermal gold mineralisation at bin Yauri, Nigeria. J Afr. Earth Sci. 31, 433–449. doi:10.1016/s0899-5362(00)00098-1
Jain, K. P. (1982). Cenozoic dinoflagellate cysts, acritarchs from sedimentary formations of India, a critical review, 1. Palaeontological Society of India: Special Publication, 50–56.
Kogbe, C. A. (1979). “Geology of the south-eastern sector of the iullemmeden basin,” in Bulletin of the department of geology (Zaria: Ahmadu Bello University), 36–45.
Mishra, D. C. (2011). Gravity and magnetic methods for geological studies’’, BS publications. Hyderabad, USA: CRC Press, 938p.
Ndousa-Mbarga, T., Fenmoue, A. N. S., Manguelle-Dicoum, E., and Fairhead, J. D. (2012). Aeromagnetic data interpretation to locate buried faults in south-East Cameroon. Geophysica 48 (1e2), 49e63.
Nigerian Geological Survey Agency (2009). Airborne geophysical survey residual magnetic intensity map of southwestern part Sokoto Basin (16 sheet) area.
Obaje, N. G. (2009). Geology and mineral resources of Nigeria. Lecture notes in Earth sciences. Springer.
Olasunkanmi, N. K., Bamigboye, O. S., Olatunji, S., Salawu, N. B., and Bamidele, T. (2020). Interpretation of high resolution aeromagnetic data of Kaoje and its environ, western part of the Zuru Schist belt, Nigeria’’, implication for Fe–Mn occurrence. 2405-8440/©2020. Elsevier Ltd. Available online at: http://creativecommons.org/licenses/by-nc-nd/4.0/.
Olaunkanmi, N. K., Magawata, U., and Bayowa, O. G. (2023). Assessment of image ratio technique: targeting structural features and mineralization characteristics in the southwestern part of the Sokoto Basin in Nigeria using Landsat8 imagery. Kuwait J. Sci. doi:10.1016/j.kjs.2023.02.030
Olomo, K. O., Bayode, S., Alagbe, O. A., Olayanju, G. M., and Olaleye, O. K. (2022). Aeromagnetic mapping and radioelement influence on mineralogical composition of mesothermal gold deposit in part of ilesha schist belt, Southwestern Nigeria. NRIAG J. Astronomy Geophys. 11 (1), 177–192. doi:10.1080/20909977.2022.2057147
Oyeniyi, T. O., Salami, A. A., and Ojo, S. B. (2016). Magnetic surveying as an aid to geological mapping: a case study from Obafemi Awolowo university campus in Ile-ife, southwest Nigeria. Ife J. Sci. 18 (2), 331e343.
Pal, S. K., Vaish, J., Kumar, S., Priyam, P., Bharti, A. K., and Kumar, R. (2017). Downward continuation and tilt derivative of magnetic data for delineation of concealed coal bre in east basuria colliery, jharia coal beld, India. J. Earth Syst. Sci. 126 (53), 1–17. doi:10.1007/s12040-017-0826-y
Ranjbar, H., Masoumi, F., and Carranza, E. J. M. (2011). Evaluation of geophysics and space Borne multispectral data for alteration mapping in the SarCheshmeh mining area, Iran. Int. J. Rem. Sens. 32, 3309–3327. doi:10.1080/01431161003745665
Rapolla, A., Cella, F., Fedi, M., and Florio, G. (2002). Improved techniques in data analysis and interpretation of potential fields: examples of application in volcanic and seismically active area. Ann. Geophys. 45 (6), 733–751. doi:10.4401/AG-3541
Shehu, A. T., Udensi, E. E., Adeniyi, J. O., and Jonah, S. A. (2004). Spectral analysis of the magnetic residual anomalies over the Upper Sokoto Basin, Nigeria. Zuma J. Pure Appl. Sci. 6 (2), 37–49.
Talaat, M., and Mohammed, A. (2011). Characterization of gold mineralization in Garin Hawal area, Kebbi State, NW Nigeria, using remote sensing. Egypt. J. Remote Sens. Space Sci. 13, 153–163. doi:10.1016/j.ejrs.2009.08.001
Umego, M. N. (1990). Structural interpretation of gravity and aeromagnetic anomalies over Sokoto Basin, Northwestern Nigeria. Zaria, Nigeria: Ahmadu Bello University.
Keywords: lithologic boundaries, structural trends, mineralization potential, hydrothermal alteration, geological structures
Citation: Magawata UZ, Olasunkanmi NK, Egbeyale GB and Saleh A (2025) Structure and mineralization potential of the southwestern part of Sokoto Basin in Nigeria. Front. Earth Sci. 13:1500162. doi: 10.3389/feart.2025.1500162
Received: 22 September 2024; Accepted: 18 April 2025;
Published: 23 May 2025.
Edited by:
Zhongliang Wang, China University of Geosciences, ChinaReviewed by:
Ameha Atnafu Muluneh, University of Bremen, GermanyVsevolod Yutsis, Instituto Potosino de Investigación Científica y Tecnológica (IPICYT), Mexico
Copyright © 2025 Magawata, Olasunkanmi, Egbeyale and Saleh. This is an open-access article distributed under the terms of the Creative Commons Attribution License (CC BY). The use, distribution or reproduction in other forums is permitted, provided the original author(s) and the copyright owner(s) are credited and that the original publication in this journal is cited, in accordance with accepted academic practice. No use, distribution or reproduction is permitted which does not comply with these terms.
*Correspondence: U. Z. Magawata, dXpheXlhbnVAeWFob28uY29t