 Renzhong Gan
 Hao Zhang1
- 1Xinjiang Oilfield Exploration Division, Karamy, Xinjiang, China
- 2China Petroleum Group Logging Co., Ltd., Xinjiang, China
Black shale is the main source rock of the Jurassic Liangshan Formation shale reservoir in basin A, and its organic geochemical parameters TOC, S1, and S2 are very important for the quantitative evaluation of shale reservoir exploration and development potential. TOC, S1, and S2 logging evaluation methods are established according to the principle of “core calibration logging” because of the possession of logging and core analysis data in basin A. Firstly, improved △logR and multiple regression analysis methods are used to establish a quantitative TOC logging method based on slowness, resistivity, and gamma-ray logging. Secondly, based on acoustic time difference, resistivity, and gamma logging, a quantitative calculation method of S2 is established by multiple regression analysis. Finally, based on the statistical relationship between TOC and (S1+S2) of core analysis and S2 calculation results, a logging method for quantitative calculation of S1 is obtained. The application results show that the TOC calculated based on multiple regression analysis is in good agreement with the TOC of core analysis, with A relative deviation of 9%. The modified △logR method results in a large deviation from the TOC of core analysis due to the influence of the error of coefficient A and overlap coefficient K. The relative deviation of S1 and S2 calculated by logging and S1 and S2 by core analysis is 6% and 7%, which can meet the evaluation requirements of hydrocarbon generation potential of source rocks.
1 Introduction
A set of deep lacustrine and semi-deep water lacustrine sedimentary black shale, mainly composed of quartz and clay minerals, is developed in the Jurassic Liangshan Formation of east Sichuan Basin. The deep lake-semi deep water lacustrine sedimentary black shale developed in the Lianggaoshan Formation of the Jurassic in basin A is the main source rock for shale oil and gas reservoirs (Chen et al., 2005; Zou et al., 2018; Farouk et al., 2024a). The organic geochemical parameters (TOC, S1, S2) are vital in the exploration and development evaluation. Therefore, the evaluation methods of organic TOC, S1, S2 are widely concerned.
Two main methods for quantitative evaluation of organic TOC, S1, S2 are core analysis testing and logging evaluation (Shihe and Zhang, 2016; Farouk et al., 2024b; Youmi, 2008). Although the results of core analysis testing are objective and accurate, the method has disadvantages such as limited core samples, discrete core sampling, and high cost. Logging evaluation can continuously evaluate the target interval using logging curves, mainly including single and combination logging evaluation. Single logging evaluation includes: Schmoker and Hester (1983) established empirical formulas using DEN and TOC to calculate TOC. Mendelson. and Toksoz (1985) established a linear relationship between TOC and GR to calculate TOC. Fertl and Chilingar (1988) established a linear relationship between TOC and uranium content to calculate TOC (Chen and Qiang, 2004). Herron et al. (1988) calculated TOC using C/O spectral logging data. However, sh1ale’s rock and mineral composition are complex, and the evaluation error of a single logging is large. Compared to single logging, the accuracy of combination logging evaluation is higher. Based on kerogen’s high resistance and high acoustic time difference properties, Passey et al. (1990) combined the acoustic time difference curve with the resistivity curve, using the core scale to calculate TOC (Passey et al., 1990) quantitatively, and proposed the △logR method. The method has strong applicability and can be used for both clastic and carbonate rocks while eliminating the influence of pores. However, reading baseline values is complex, and the method’s accuracy is limited by dependence on the thermal maturity index (LOM); the method has low accuracy. Therefore, Zhang and Zhang (2000) superimposed a suitably calibrated porosity curve (e.g., acoustic interval transit time log curve) on a resistivity log curve, enabling relatively accurate evaluation of the total thickness of source rocks in each well and the depth distribution of source rocks in each layer the with the resistivity curve, using the core scale to clogR method is improved to get higher accuracy. Qu et al. (2011) established a linear relationship between TOC and with the resistivity curve, using the core scale to clogR and eliminated the influence of the thermal maturity index (LOM). Ritesh et al. (2014) used extended elastic impedance for obtaining the GR and porosity volumes and simultaneous inversion for obtaining the brittleness volume. Zhu et al. (2013) integrated previous research methods and utilized the means of rock-electricity relation, ΔlgR method, and fracture logging interpretation model to solve the problem of identifying high-quality reservoirs in the black shales of the Chang 7 Member in the southeastern Ordos Basin.
Huo et al. (2011) established a cross plot of AC and lgRT to determine baseline values, which can compare baseline values of non-source rocks under different sedimentary conditions. Liu et al. (2014) proposed a variable coefficient △logR method, which improves the adaptability of the △logR method to terrestrial formations by modifying the model coefficients and introducing new logging parameters. Adeniji and Onayemi (2014) analysis of the Agbada shales of Niger Delta basin using RMS Amplitude method,and proved that Agbada shales are not matured source rocks, but rather sealing the reservoir. Hu et al., (2016) established a generalized △lgR method using GR, AC, and lgR to predict TOC. Integrating geochemical approaches, one - and two - dimensional basin modeling exercises, well log analyses, seismic interpretations, and the study of hydrocarbon migration pathways, (Farouk et al., 2024c) identified suitable drilling targets.
In addition, the combination logging evaluation includes (Zhu et al., 2002), who used a BP neural network to calculate TOC based on logging data similar to existing logging data. Jacobi. et al. (2009) proposed Nuclear magnetic resonance logging and density logging dual porosity. Density logging is used to divide the response of kerogen into the response of formation porosity, and nuclear magnetic resonance logging divides the response of kerogen into the framework, the difference between the two responses is the TOC content of the formation (Gao et al., 2014). Hu et al. (2011) used multiple regression analysis through conventional logging curves, including GR, DEN, and CNL, to select logging curves that significantly impacted TOC content. They established a multiple regression equation.
Pan et al. (2009) used multiple regression analysis to fit and establish a multiple regression equation for the free hydrocarbon content S1. Wang et al. (2009a) conducted a regression analysis between the pyrolysis analysis data of source rocks and TOC, founding the positive correlation between the pyrolysis hydrocarbon content S2 and TOC, and finally established an equation between S2 and TOC. Yang et al. (2013) established a relationship between natural gamma spectroscopy logging data and rock pyrolysis hydrocarbon generation potential (S1+S2) using core regression analysis based on the fact that organic matter increases with the decrease of Th/U value and the increase of rock pyrolysis hydrocarbon generation potential with the increase of U/Th value. Song et al. (2021) combined several curves that contributed to the potential of rock pyrolysis for hydrocarbon generation, using principal component regression to quantitatively analyze the potential of rock pyrolysis for hydrocarbon generation (S1+S2) and established a computational model.
In the Jurassic of the eastern basin A, the absence of specialized logging data, including nuclear magnetic resonance and natural gamma ray spectroscopy, poses challenges. There are lots of defects and deficiencies in using conventional logging data to comprehensively evaluate the total organic carbon content (TOC), free hydrocarbon content (S1), and pyrolysis hydrocarbon content (S2) of the source rock. Therefore, referencing various research methods mentioned above and combining relevant data from basin A, based on logging data and core analysis data, the article introduced logging evaluation methods including 2 types of total organic carbon content (TOC), 2 types of free hydrocarbon content (S1), and pyrolysis hydrocarbon content (S2), and applied the methods in the Lianggaoshan Formation of the Jurassic in basin A and selected the most effective method as the theoretical basis for hydrocarbon source rock evaluation.
2 Characteristic of Jurassic source rocks in the basin A
The eastern region of Sichuan refers to part of basin A, including east areas of Huaying Mountain, west areas of Qiyue Mountain, south areas of Daba Mountain, and north areas of Chongqing (Zhang et al., 2019).
The analysis of field geological profiles and rock debris logging data shows that the Lianggaoshan Formation in basin A mainly includes a set of shale, sandstone, and mudstone interbeds with varying thicknesses. Black shale is the main source rock of shale oil and gas reservoirs, with strong hydrocarbon generation ability, and is the main exploration target layer.
Based on the TOC data of 52 core and debris samples from the Lianggaoshan Formation, a frequency distribution histogram of shale organic carbon content was plotted (Figure 1). It was found that the organic carbon content was distributed between 0.51% and 2.63%, with an average value of 1.16%, mainly concentrated in 1.0%–2.0%. According to the evaluation criteria for organic carbon abundance in source rocks (Li et al., 2021), the shale of the Lianggaoshan Formation is a high-quality source rock. Based on the data of 43 cores and debris samples S1 and S2 from the Lianggaoshan Formation, a frequency distribution histogram of shale hydrocarbon generation potential was plotted (Figure 2). The hydrocarbon generation potential (S1+S2) was found to be distributed between 0.48 and 3.62 mg/g, with an average value of 1.93 mg/g, mainly concentrated between 2.0 and 6.0 mg/g. According to the evaluation criteria for organic carbon abundance in source rocks (Lu and Zhang, 2007), the shale of the Lianggaoshan Formation is a moderate source rock.
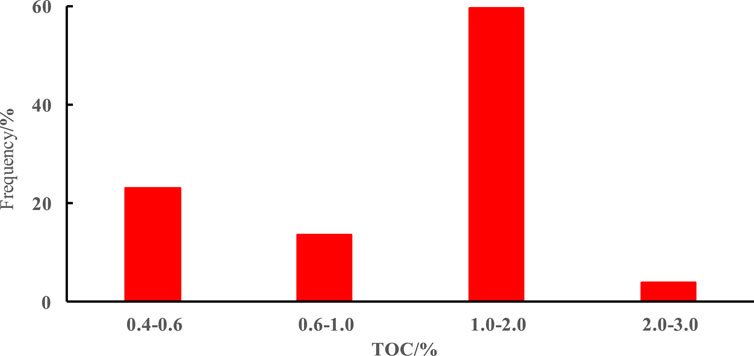
Figure 1. Frequency distribution histogram of total organic carbon content (TOC) in the shale of the Lianggaoshan Formation.
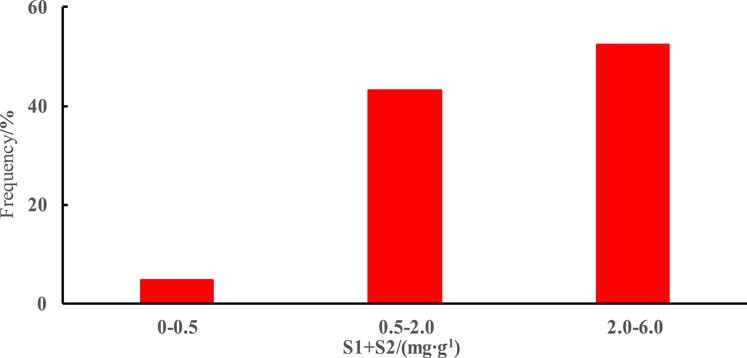
Figure 2. Frequency distribution histogram of hydrocarbon generation potential (S1+S2) in the shale of the Lianggaoshan Formation.
Lu and Zhang (2007) proposed in Oil and Gas Geochemistry that the evaluation of organic matter abundance in source rocks is mainly based on organic carbon content, supplemented by hydrocarbon generation potential (Kamali and Mirshady, 2005). In summary, the shale of the Jurassic Lianggaoshan Formation in basin A is a high-quality source rock.
3 Quantitative calculation method and application result analysis of total organic carbon content (TOC)
Based on logging data and core analysis data, the article uses the improved △logR method and multiple regression analysis methods to calculate the TOC of the Lianggaoshan Formation shale in the basin A region and analyzes the actual application results.
3.1 Improved △logR method
The △logR method was derived by EXXON and ESSO companies in 1979 and has been used in several countries with great application results. Passey officially proposed the △logR method in 1990 for carbonate and clastic rocks under different maturity conditions, which can quantitatively calculate TOC by overlaying the resistivity curve and acoustic time difference curve. As a logging evaluation method for quantitatively calculating the TOC of source rocks, The △logR method is still widely used (Li et al., 2021; Lu and Zhang, 2007; Kamali and Mirshady, 2005).
The △logR method overlays the acoustic time difference curve and resistivity curve onto the same channel, with each 50 US/FT acoustic time difference on the channel head corresponding to a logarithmic resistivity scale. In non-source rock formations, the acoustic time difference and resistivity curves have the same trend, and the overlapping part is the baseline. In the source rock formation, the amplitude difference between the two curves is recorded as Δ logR, and Passey believes that Δ logR and TOC are positively correlated. Furthermore, the calculation formula for the △logR method is derived as follows:
In the formula, R is the resistivity, ohm. m; Rbaseline is the resistivity of the non-source rock section, ohm. m; △t is the acoustic time difference, US/FT; △tbaseline is the acoustic time difference of the non-source rock section, US/FT; K is the superposition coefficient, dimensionless number; LOM is a maturity parameter with no dimensionality (Passey et al., 1990; Tang et al., 2010; Tan et al., 2021).
In actual reservoirs, there are often many gas fields of the fracture-porosity type and porosity type. There may be certain problems when using conventional methods in dealing with such data (Han et al., 2012). The method has strong applicability and can eliminate the influence of porosity on TOC. However, there are some deficiencies in the reading and use of baseline values and maturity parameter LOM (Hu et al., 2011).
(1) Baseline value: Due to the constant changes of logging response, a well typically requires a segmented reading of baseline values to calculate ΔlogR. Determining each baseline value after segmentation is complex and greatly influenced by subjective factors, which can easily lead to errors.
(2) Maturity parameter LOM: a “thermal stress” parameter that describes the relative intensity of temperature time, which can be obtained from core analysis. In regions where maturity parameters are unavailable, the model fails to calculate TOC accurately.
Given the shortcomings above, it is urgent to establish an improved △logR model suitable for the Lianggaoshan Formation. For a well required segmented reading of multiple baseline values with a small range of variation, 102.297–0.1688*LOM can be considered as a constant value, denoted as A. The improvement applies to areas where LOM cannot be determined. Therefore, Formula 2 has been modified to:
Substituting Formula 1 into Formula 3 yields:
For a well, A, lgRbaseline, and △tbaseline are constants, and K represents the length of the acoustic time difference corresponding to the resistivity value of each logarithmic scale in Formula 4. Passey believes that K should be a fixed value of 0.02. The improved △ logR model was ultimately obtained in Formula 5:
The improved △logR model only needs to consider the acoustic time difference and resistivity, avoiding the influence of factors such as manually determining baseline values and lacking maturity parameter LOM. This improves the applicability of the △logR method.
3.2 Multiple regression analysis method
The multiple regression analysis method can use all logging curves, including acoustic time difference, resistivity, and natural gamma, and establish regression equations between several logging response values and organic carbon content (Wang et al., 2009b; Guo et al., 2012). The method has strong regional characteristics, and suitable logging curves should be selected based on the actual situation of the target block.
Establishing a single connection between TOC and various logging curves can quickly and intuitively evaluate linear correlation and select appropriate, sensitive curves to establish a multiple regression model. Due to the limitation of logging data availability, the cross plots of TOC data and GR, AC, and RT for shale core analysis in the Lianggaoshan Formation were drawn separately (Figure 3).
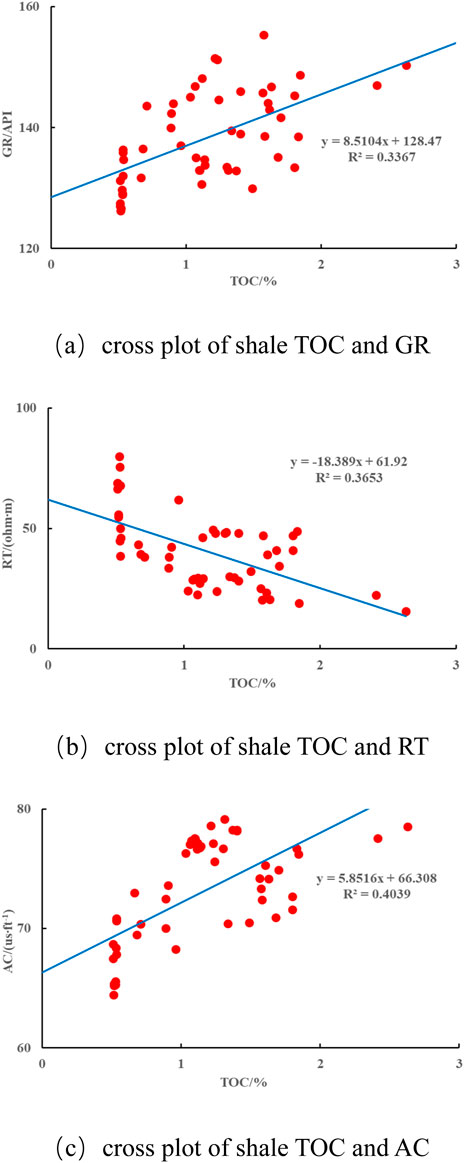
Figure 3. Cross plots of TOC and logging curves of shale in the Lianggaoshan Formation. (a) Cross plot of shale TOC and GR (b) Cross plot of shale TOC and RT (c) Cross plot of shale TOC and AC.
Based on the correlation between TOC data from core analysis and logging curves, the acoustic time difference, resistivity, and natural gamma curves were ultimately selected as sensitive curves for multiple regression analysis. A TOC interpretation model suitable for the region was established with the formula:
3.3 Application results analysis
Figure 4 shows the TOC logging interpretation results of the Longgang 80 well. The improved △ logR model calculated TOC, and rock debris analysis TOC data have poor corresponding effects, indicating that the model is not suitable for TOC calculation in the area. Due to the different coefficients A in different layers of the improved △logR model, setting the A value of the entire target well section to the same constant may result in some wrong calculated results. The superposition coefficient K should consider the influence of hydrocarbon fluids in the source rock, and setting a fixed value of 0.02 may cause errors.
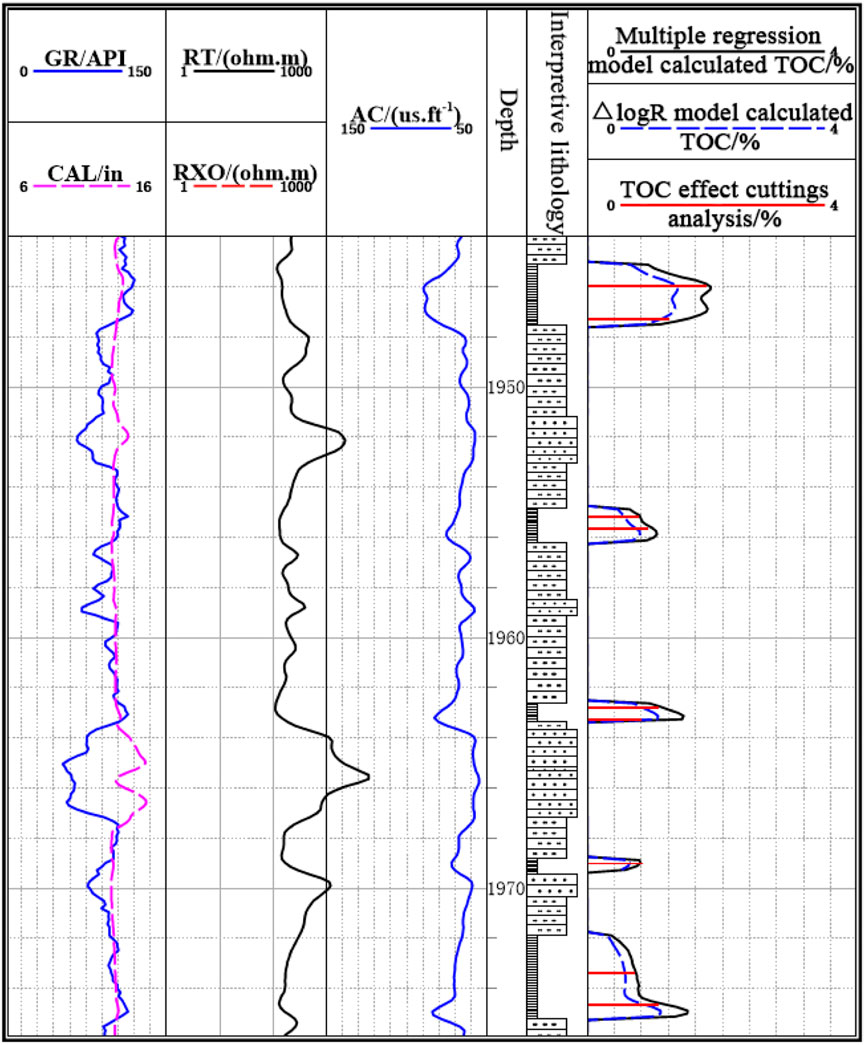
Figure 4. Interpretation results of TOC for Longgang 80 well.
According to research, resistivity, acoustic time difference, and natural gamma curve are greatly influenced by kerogen in source rocks, so these 3 curves can be used to establish regression models to calculate TOC. Due to the rich uranium content, kerogen typically has high natural gamma values. The propagation speed of sound waves in kerogen is relatively small, increasing the acoustic time difference. Kerogen has poor conductivity, which increases its resistivity. However, mud intrusion, mineral composition, and increased organic pores may lead to decreased resistivity, so resistivity cannot be used alone. Considering practical application results, the TOC calculated by the multiple regression model corresponds well with the TOC data of rock debris analysis, which can meet actual production requirements. Figure 5 compares the TOC data obtained from the rock debris analysis of the Lianggaoshan Formation in Longgang 80 well in basin A and the TOC data calculated by the multiple regression interpretation model. The relative deviation between the rock debris analysis and the model calculation data points is 9%, with a small deviation and a high degree of fit, indicating the calculation model’s high reliability.
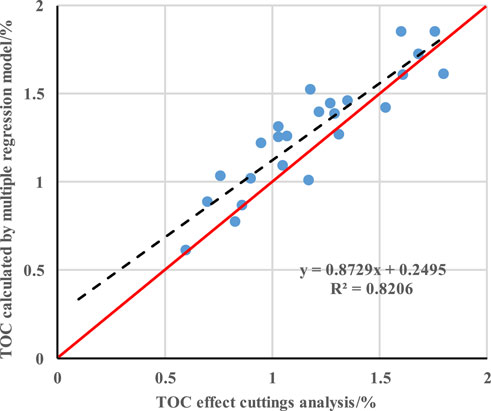
Figure 5. Comparison between TOC analysis of Longgang 80 well and TOC calculated by multiple regression models.
4 Quantitative calculation method and application results analysis of free hydrocarbons (S1) and pyrolysis hydrocarbons (S2)
Free hydrocarbon (S1) refers to the hydrocarbon content detected per unit mass of source rock when the rock sample is heated up to 300°C. Pyrolysis hydrocarbon (S2) refers to the amount of hydrocarbons generated by heating a unit mass of source rock to 300°C–600°C. The quantitative calculation methods for free hydrocarbons and pyrolysis hydrocarbons mainly include multiple regression analysis and the TOC correlation method (Farouk et al., 2024d).
4.1 Evaluation method for S2 logging of pyrolysis hydrocarbons
Based on the TOC multiple regression model, the acoustic time difference, resistivity, and natural gamma curves are selected as the sensitive curves for S2 multiple regression. Using core pyrolysis analysis data, establish a corresponding calculation model with the formula:
4.2 Evaluation method for S1 logging of free hydrocarbons
Establish a logging calculation model for S1 using the above multiple regression analysis method, with the formula:
However, the R2 of the model is small, indicating a poor fit between the model and the sample, which cannot represent the trend of the sample values. Therefore, we try to use the TOC correlation method. As shown in the TOC - (S1+S2) cross plot (Figure 6), a positive correlation exists between S1+S2 and TOC. S1+S2 refers to the hydrocarbon generation potential of the source rock, which refers to the total amount of hydrocarbons produced by the organic matter in the source rock during pyrolysis. It can be directly used to evaluate the oil generation capacity. Generally, the higher the organic carbon content of source rocks with the same type and maturity, the higher the content of generated hydrocarbons. Therefore, establishing a single correlation between hydrocarbon generation potential (S1+S2) and organic carbon content (TOC), the formula is:
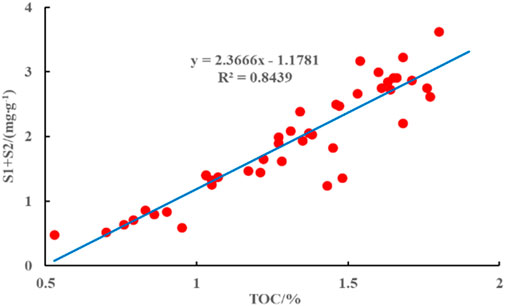
Figure 6. Cross plot of TOC and (S1+S2) of shale in Lianggaoshan Formation.
Finally, based on the calculation results of the S2 model, use the difference to calculate S1 in the Formula 6.
4.3 Application results analysis
Figure 7 shows the S1 and S2 logging interpretation results of the Longgang 80 well. The comparison between the S1 and S2 obtained from the logging calculation and the rock debris data shows a small error and great application result.
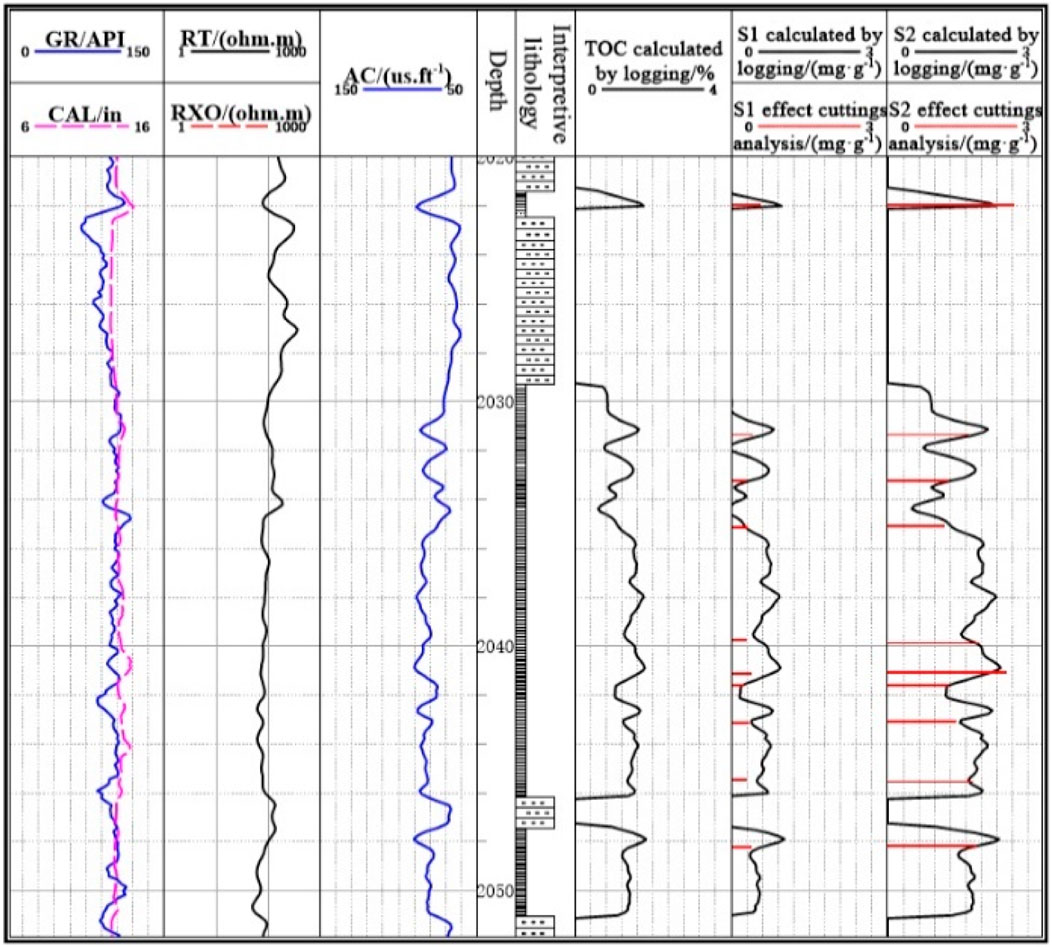
Figure 7. Interpretation results of S1 and S2 in Longgang 80 Well.
Figure 8 compares the performance of the S1 data obtained from the cuttings analysis and the S1 data calculated from the logging interpretation model. The relative deviation between the cuttings analysis and the model calculation data points is 7%, which is relatively small and has a high degree of fit, indicating the calculation model’s high reliability. Figure 9 compares the S2 data obtained from rock debris analysis and the S2 data obtained from multiple regression interpretation models. The relative deviation between the data points obtained from rock debris analysis and the model calculation is 6%, which is relatively small and highly consistent, indicating the high reliability of the calculation model.
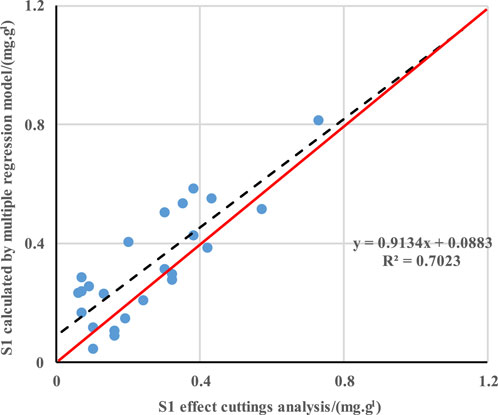
Figure 8. Comparison between S1 analysis of rock cutting in Longgang 80 well and S1 calculation of logging interpretation model.
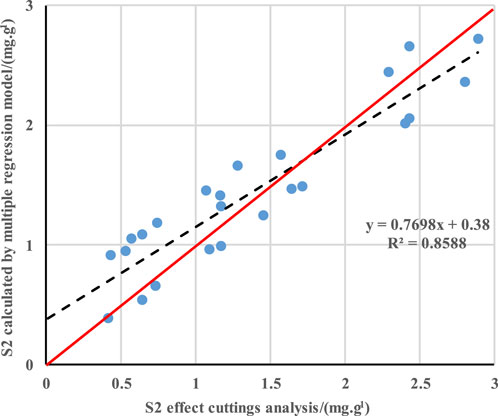
Figure 9. Comparison between S2 analysis of rock cutting in Longgang 80 well and multiple regression model calculation of S2 result.
5 Conclusion
1) According to field geological profiles and cuttings logging data, black shale is the main source rock for shale oil and gas reservoirs in basin A. Based on the core analysis data statistics, the Lianggaoshan Formation shale in the Jurassic can be considered a high-quality source rock.
2) In response to the data in basin A, two methods, including improved logR and multiple regression analysis, were used to establish a quantitative logging model for calculating TOC. The multiple regression analysis method results were highly consistent with the rock debris analysis data, and the application result was better.
3) Based on the multiple regression analysis method to calculate the pyrolysis hydrocarbon S2, the TOC correlation method was used to calculate the hydrocarbon generation potential (S1+S2), and the final difference between the two was obtained as the free hydrocarbon S1. Combined with the logging interpretation results of the Longgang 80 well, the calculation results were consistent with the rock debris analysis data, and the model was highly reliable.
Data availability statement
The raw data supporting the conclusions of this article will be made available by the authors, without undue reservation.
Author contributions
RG: Supervision, Writing – original draft, Software. HZ: Writing – review and editing. TF: Validation, Writing – review and editing, Formal Analysis. LM: Methodology, Writing – review and editing, Resources, Validation. LN: Writing – review and editing, Data curation, Methodology. LC: Writing – review and editing.
Funding
The author(s) declare that no financial support was received for the research and/or publication of this article.
Conflict of interest
Authors RG, HZ, TF, LM, and LC were employed by the Xinjiang Oilfield Exploration Division. Author LN was employed by the China Petroleum Group Logging Co., Ltd.
Generative AI statement
The author(s) declare that no Generative AI was used in the creation of this manuscript.
Publisher’s note
All claims expressed in this article are solely those of the authors and do not necessarily represent those of their affiliated organizations, or those of the publisher, the editors and the reviewers. Any product that may be evaluated in this article, or claim that may be made by its manufacturer, is not guaranteed or endorsed by the publisher.
References
Adeniji, A. A., and Onayemi, J. R. (2014). Source rock analysis of the Agbada shales of Niger Delta Basin, Nigeria, using well log data and attribute analysis SEG Annual Meeting. Colorado, USA: Society of Exploration Geophysicists.
Chen, Z., and Qiang, J. (2004). Application of natural gamma and natural gamma spectral logging in paleoenvironmental inversion of sedimentary basins. J. Geophys. (06), 1145–1150. doi:10.1002/cjg2.616
Chen, S., Du, M., Wan, M., Zheng, P., Li, Z., Zhang, J., et al. (2005). Study on the distribution and geochemical characteristics of jurassic source rocks in the sichuan basin. Nat. Gas Explor. Dev. (02), 15-17+69–5. doi:10.3969/j.issn.1673-3177.2005.02.005
Farouk, S., Arafat, M., Fagelnour, M. S., Al-Kahtany, K., and Gentzis, T. (2024c). Petroleum system assessment of the beni suef basin, western desert, Egypt. J. Afr. Earth Sci. 217, 105345. doi:10.1016/j.jafrearsci.2024.105345
Farouk, S., Fagelnour, M., Zaky, A. S., Arafat, M., Salama, A., Al-Kahtany, K., et al. (2024a). Petroleum system evaluation: hydrocarbon potential and basin dynamics in abu darag sub-basin, northern gulf of suez (Egypt). Minerals 14 (11), 1154. doi:10.3390/min14111154
Farouk, S., Saada, S. A., Fagelnour, M. S., and Arafat, M. (2024d). Petrophysical and gas chromatographic analysis integration for hydrocarbon identifications in cretaceous reservoirs, azhar field, beni suef basin, Egypt. Egypt. J. Petroleum 33 (1), 7. doi:10.62593/2090-2468.1018
Farouk, S., Sen, S., Ahmed, F., Qteishat, A., Al-Kahtany, K., Moreno, H. M., et al. (2024b). Assessment of the upper cretaceous abu roash carbonate source rocks from the beni suef field, western desert, Egypt. J. Afr. Earth Sci. 215, 105272. doi:10.1016/j.jafrearsci.2024.105272
Fertl, W. H., and Chilingar, G. V. (1988). Total organic carbon content determined from well logs. Spe Form. Eval. 3 (2), 407–419. doi:10.2118/15612-pa
Gao, Y., Zhao, Y., Li, G., Hu, T., and Fan, X. (2014). Evaluation of organic carbon content of tight oil source rocks in the Junggar Basin based on nuclear magnetic resonance and density logging. Oil gas Reserv. Eval. Dev. 4 (02), 5–8+14. doi:10.3969/j.issn.2095-1426.2014.02.003
Guo, Z., Sun, P., and Liu, W. (2012). Calculation of quaternary organic carbon in the sanhu area of the Qaidam basin using Δ logR technology. Prog. Geophys. 27 (02), 626–633. doi:10.6038/j.issn.1004-2903.2012.02.027
Han, X., Yufeng, C., and Fengbi, Li (2012). Etc Classification and conventional logging identification methods for heterogeneous reservoirs in DB gas fields. Prog. Geophys. 27 (01), 186–192. doi:10.6038/j.issn.1004-2903.2012.01.021
Herron, S. L., Letendre, I., and Dufour, M. (1988). Source rock evaluation using geochemical information from wireline logs and cores.AAPG Bull.,72(8):1007–1009. doi:10.1306/703C9555-1707-11D7-8645000102C1865D
Hu, H., Lu, S., Liu, C., et al. (2011). Comparison and analysis of models for calculating organic carbon content in source rocks using logging data. J. Sedimentology 29 (06), 1199–1205. doi:10.14027/j.cnki.cjxb.2011.06.012
Hu, H., Su, R., Liu, C., Wang, W., Wang, M., Li, J., et al. (2016). Method and application of generalized Δ LgR technology for predicting organic carbon content in deep continental source rocks. Nat. Gas. Geosci. 27 (01), 149–155. doi:10.11764/j.issn.1672-1926.2016.01.0149
Huo, Q., Zeng, H., Fu, L., and Ren, Z. (2011). Improvement of Δ lgR logging source rock evaluation method and its application in the Songliao Basin. J. Jilin Univ. Earth Sci. Ed. 41 (02), 586–591. doi:10.13278/j.cnki.jjuese.2011.02.022
Jacobi, D. J., Gladkikh, M. N., Lecompte, B. J., Mendez, F. E., Hursan, G., Ong, S. H., et al. (2009). A Method for petrophysical evaluation of shale gas reservoirs: ca, WO/2009/126609.
Kamali, M. R., and Mirshady, A. A. (2005). Total organic carbon content determined from well logs using ΔLogR and Neuro Fuzzy techniques. J. Petroleum Sci. & Eng. 45(3/4): 141–148. doi:10.1016/j.petrol.2004.08.005
Li, S., Zhang, W., Li, Y., and Liu, B. (2021). Evaluation of source rocks in the Dongyue temple member of the lower jurassic ziliujing Formation in east Sichuan. Nat. Gas Explor. Dev. 44 (02), 11–18. doi:10.12055/gaskk.issn.1673-3177.2021.02.002
Liu, C., Lu, S., and Haitao, X. (2014). Variable coefficient Δ logR method and its application in organic matter evaluation of shale. Prog. Geophys. 29 (01), 312–317. doi:10.6038/pg20140144
Mendelson, J. D., and Toksoz, M. N. (1985). Source rock charaterization using multivariate analysis of log data.
Pan, R., Wu, Y., and Zheng, S. (2009). Preliminary exploration of geochemical indicators and logging analysis methods for shale gas exploration. China Pet. Explor. 14 (03), 6–9+28+1. Available online at: http://www.cped.cn/CN/Y2009/V14/I3/6
Passey, Q. R., Creaney, S., and Kulla, J. B. (1990). A practical model for organic richness from porosity and resistivity logs. AAPG Bull. 74 (12), 1777–1794. doi:10.1306/0c9b25c9-1710-11d7-8645000102c1865d
Qu, Y., Zhong, N., Liu, Y., and Peng, B. (2011). Logging calculation method and influencing factors of organic matter abundance in source rocks. Lithological Oil Gas Reserv. 23 (02), 80–84+99. doi:10.3969/j.issn.1673-8926.2011.02.015
Ritesh, K. S., Satinder, C., and Amit, K. R. (2014). Seismic characterization of montney shale formation using passey's approach[C]//SEG annual meeting. Colorado, USA: Society of Exploration Geophysicists.
Schmoker, J. W., and Hester, T. C. (1983). Organic carbon in bakken formation, United States portion of williston basin. Am. Assoc. Pet. Geol. Bull. (United States) 67 (12), 2165–2174. doi:10.1306/ad460931-16f7-11d7-8645000102c1865d
Shihe, Y., and Zhang, C. (2016). Well logging data processing and comprehensive interpretation. Dongying, Shandong: China University of Petroleum Press, 139533–139566.
Song, Y., Sun, Q., Zhang, X., and Feng, J. (2021). Quantitative evaluation method of hydrocarbon source rocks based on well logging information. J. Heilongjiang Univ. Sci. Technol. 31 (02), 156–162. doi:10.3969/j.issn.2095-7262.2021.02.005
Tan, J., Wu, K., Li, Y, Zhao, X., Yan, C., Huang, Z., et al. (2021). Application of TOC method for well logging prediction in shale reservoir evaluation. Prog. Geophys. 36 (01), 258–266. doi:10.6038/pg2021EE0093
Tang, Y., Liang, X., Zhou, S., and Chen, F. (2010). Evaluation of source rocks in Baiju Depression using logging data. West. Explor. Eng. 22 (01), 137–140. doi:10.3969/j.issn.1004-5716.2010.01.048
Wang, L., Jin, Q., Lin, L., Liu, Y., and Zhang, B. (2009a). Characteristics of high-quality source rocks from the paleogene to neogene in the western qaidam basin. Nat. Gas. Ind. 29 (02), 23–26+131. doi:10.3787/i.issn.1000-0976.2009.02.005
Wang, Li, Tang, C., and Fei, W. (2009b). Application of Δ lgR technology in hydrocarbon source rock evaluation. Fault Block Oil Gas Field 16 (02), 52–54.
Yang, T., Li, S., Guo, H., and Wang, J. (2013). Application of source rock logging evaluation technology in the Yinchuan Basin. Pet. Instrum. 27 (01), 66–68+10. doi:10.3969/j.issn.1004-9134.2013.01.024
Youmi, H. (2008). Principles and comprehensive interpretation of well logging. Dongying, Shandong: China University of Petroleum Press, 165–195.
Zhang, W., Li, S., Zhu, Y., Ye, C., and Chen, S. (2019). “Reservoir characteristics of the jurassic daanzhai Formation in the eastern sichuan region,” in Proceedings of the 31st national natural gas academic annual conference. 01 Geological Exploration, 104–109.
Zhang, Z., and Zhang, L. (2000). Methods and application effects of logging evaluation of source rocks. Petroleum Explor. Dev. (03), 84-87+115–124. doi:10.3321/j.issn:1000-0747.2000.03.026
Zhu, D., Wang, X., Ding, W., Zhang, L., Jiang, C., and Gong, M. (2013). Application of well logging data in identifying high-quality shale gas reservoirs: a case study of the black shale in the southeastern 7th section of the Ordos Basin. J. Xi'an Petroleum Univ. Nat. Sci. Ed. 28 (02), 25–29+34+5. doi:10.3969/j.issn.1673-064X.2013.02.005
Zhu, Z., Wang, G., and Zhu, G. (2002). Application of artificial neural network method in hydrocarbon source rock logging evaluation. Prog. Geophys. (01), 137–140.
Keywords: Lianggaoshan formation shale, logging evaluation, organic geochemical parameters, multiple regression analysis, black shale
Citation: Gan R, Zhang H, Fang T, Mu L, Ni L and Chai L (2025) Logging evaluation method for organic geochemical parameters of shale in Jurassic Formation. Front. Earth Sci. 13:1503798. doi: 10.3389/feart.2025.1503798
Received: 29 September 2024; Accepted: 17 April 2025;
Published: 15 May 2025.
Edited by:
Peng Wu, Dalian University of Technology, ChinaReviewed by:
Sherif Farouk, Egyptian Petroleum Research Institute, EgyptLiang Wang, Chengdu University of Technology, China
Copyright © 2025 Gan, Zhang, Fang, Mu, Ni and Chai. This is an open-access article distributed under the terms of the Creative Commons Attribution License (CC BY). The use, distribution or reproduction in other forums is permitted, provided the original author(s) and the copyright owner(s) are credited and that the original publication in this journal is cited, in accordance with accepted academic practice. No use, distribution or reproduction is permitted which does not comply with these terms.
*Correspondence: Renzhong Gan, MzI4Mjk3MzkzQHFxLmNvbQ==