 Kuiqian Ma
 Jijun Wang
- Tianjin Branch of CNOOC Ltd., Tianjin, China
The sand bodies of narrow channel reservoirs are predominantly composed of distributary channels, with effective sand bodies often forming narrow strips. The development of offshore oilfields typically involves large well spacing, which, combined with the distribution form of the river channels and the well pattern, significantly influences the sweep efficiency of water flooding during the high water cut stage. This leads to a complex distribution of remaining oil, thereby increasing the difficulty of reservoir development. This study focuses on the BZ offshore narrow channel reservoir and introduces a novel three-dimensional visual experiment platform designed for the physical simulation of water flooding. Through this platform, we conducted a series of physical experiments to investigate the effects of varying channel widths, permeability differences, and well patterns on water flooding. Our experiments have successfully elucidated the distribution patterns of remaining oil both in the plane and longitudinal directions of the channel during the high water cut stage. The experimental results show that with the increase in width, the shape of the water-swept area changes from a narrow strip to a spindle, and the remaining oil around the production well begins to accumulate. The larger the permeability difference is, the more injected water preferentially advances along the high permeability zone, the worse the sweeping degree at the channel’s edge is, and the higher the accumulation degree of the remaining oil is. Through the well type adjustment, the water cut is reduced and the remaining oil near the production well and the edge of the channel is utilized. After the well pattern adjustment, the utilization of remaining oil in the river channel is also improved. This research not only provides critical insights into the dynamics of water flooding in narrow channel reservoirs but also establishes a foundational methodology for evaluating the effectiveness of CO2 flooding following water flooding. The development of the three-dimensional visual experiment platform represents a significant advancement in reservoir simulation techniques, offering a robust tool for future studies aimed at optimizing oil recovery in complex reservoir environments.
1 Introduction
As the largest narrow channel heavy oil reservoir in the Bohai (Xuejun et al., 2004; Jiang et al., 1993; Shaoxianjie, 2010; Kun-Kun et al., 2013; Amaechi et al., 2014), the BZ reservoir is mainly composed of distributary channels, which have the characteristics of good physical properties in the middle of the channel and poor physical properties in the edge of the channel. Oilfields are generally developed by injection-production well patterns along the river direction. However, this narrow strip sand body has the problems of narrow channel, thin sand body, and fast lateral change, which have a profound impact on the water-flooding law and remaining oil distribution in the process of water injection development.
At present, domestic scholars mainly use reservoir engineering and numerical simulation methods to research injection-production well patterns, water breakthrough law, and productivity tests in narrow channel reservoirs, but there are few studies on the influence of plane heterogeneity on water flooding sweep and recovery. The indoor experimental research on the influence of heterogeneity on water flooding and recovery efficiency mainly adopts three methods: core parallel experiment, three-dimensional physical simulation experiment, and micro casting thin section experiment. Chunsheng et al. (2007) used the method of parallel connection of cores with different permeability to equivalently study the influence of heterogeneity on oil recovery, but only the heterogeneity between layers could be studied, and the plane heterogeneity could not be considered. Yu et al. based on the newly developed three-dimensional large-scale core model production technology (Zhiwei et al., 2016; Yu et al., 2019; Yu et al., 2018; Hongguang et al., 2017; Yu, 2015; Qingtai, 2011; Pingping et al., 2004; Yulong, 2012; Wangming, 2020; Jing, 2013; Min, 2012; Xiaodong et al., 2014; Yuhong et al., 2012) and oil-water saturation three-dimensional acquisition system, showed the hydrodynamic characteristics of injection-production well patterns under complex rhythmic conditions and also revealed the complexity and regularity of remaining oil distribution. Zhou et al. (Yuhong et al., 2012; Haiyan et al., 2020; Zhailiang, 2011; Gong et al., 2011; Yifan et al., 2016; Haochuan et al., 2018; Wei, 2014; Hao et al., 2015; Shuaiwei et al., 2016; Jianwei et al., 2017; Ming et al., 2018; Ashman et al., 2019) designed and made a large-scale plane physical model using similarity criteria for the special geological characteristics and well pattern of narrow channel reservoirs in the BZ oilfield. Based on the three-dimensional water flooding physical simulation experiment device, Yao et al. carried out water flooding physical simulation experiments of basic well pattern, well pattern thinning, and well pattern encryption, and compared the development effects of unadjusted and adjusted well pattern (Xiutian et al., 2023).
A large three-dimensional physical model of the narrow channel reservoir was made based on the geological characteristics and well pattern model of the BZ narrow channel. Through the indoor water flooding experiment, the physical experiment of water flooding under different river widths, permeability differences, and well patterns were carried out, and the distribution law of remaining oil in the plane and longitudinal direction of the river channel in the high water cut stage was clarified. The dynamic characteristics of water flooding in narrow channel reservoirs are further understood, which is of guiding significance for the efficient development of narrow channel reservoirs.
2 Three-dimensional narrow channel water flooding physical simulation experiment design
2.1 Determination of experimental basic parameters
Based on the geological data of the BZ narrow channel reservoir, considering the limitation of experimental conditions, the basic model parameters of the three-dimensional visualization physical experiment of the narrow channel are calculated by using geometric similarity (channel width-thickness ratio and horizontal good length), dynamic similarity (production pressure difference, liquid production intensity) and motion similarity (seepage mode) in similarity criterion. The basic experimental data are shown in Table 1.
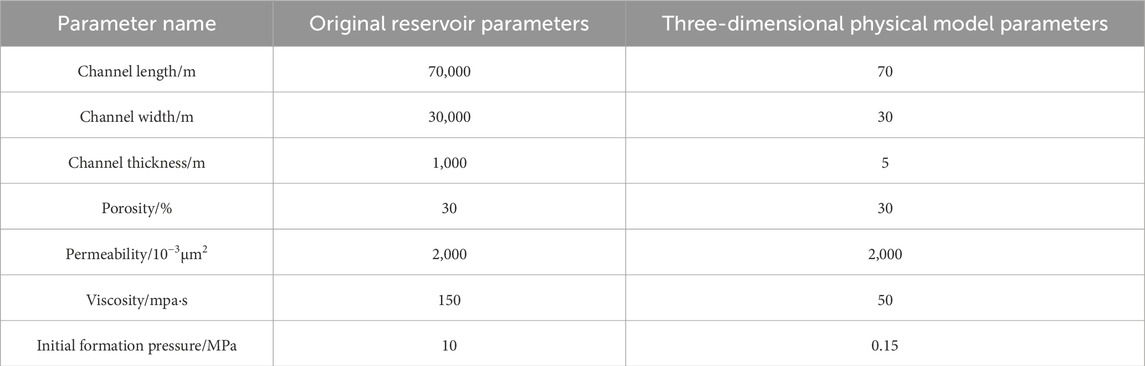
Table 1. Experimental basic parameters.
2.2 Design of three-dimensional experimental device for narrow river channel
The main part of the three-dimensional water flooding physical simulation experiment device for narrow channel reservoirs is a narrow channel three-dimensional visualization device, water injection device, and metering device. The overall experimental device is shown in Figure 1, where:
(1) Water injection device: It is composed of a beaker, ISCO plunger pump, nitrogen bottle, intermediate container, and connecting pipeline. The gas cylinder intake provides power to suck distilled water and discharge liquid for the flow control of the ISCO plunger pump. The injected water was distilled water stained with black ink to observe the three-dimensional water flooding morphology.
(2) Three-dimensional visualization device. It is composed of acrylic glass on four sides. The size is 70 cm long, 30 cm wide and 5 cm high. The glass beads are filled inside to simulate the reservoir. The special stainless-steel pipe is used to simulate vertical wells and horizontal wells. The perforation completion method is used for easy observation.
(3) The metering device is composed of a digital camera, a stopwatch, a measuring cylinder, and a pipeline, which is used to measure the amount of liquid produced in real-time.
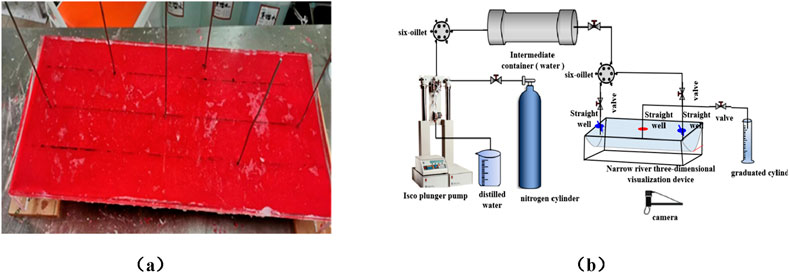
Figure 1. Three-dimensional water flooding physical simulation experiment device for narrow channel reservoir. (a) Three-dimensional visualization device physical map. (b) The overall design diagram of the experiment.
2.3 Three-dimensional experimental scheme design of narrow channel
Based on the problems of the narrow channel, thin sand body, and fast lateral change of narrow strip sand body, combined with the characteristics of large well spacing and thin good pattern in offshore oilfields, the width of the channel is different, and the types of remaining oil enrichment are quite different. In this experiment, the width of the channel is the main factor, and the main research direction is determined according to different channels, and the scheme design is carried out at the same time. Through the control variables to explore the influence of different factors on the effect of water flooding, the experimental process is designed as follows, and the experimental scheme design is shown in Table 2.
(1) Oil sample preparation: Anhydrous kerosene and engine oil diesel were prepared according to a certain proportion to prepare experimental oil with a viscosity of 50 mPa s, and the two were dyed with Sudan III dye according to the experimental requirements.
(2) According to the different experimental requirements, different mesh glass beads were selected, and the simulated oil was fully mixed with glass beads of varying particle sizes. Then, the oil-mixed sands of varying particle sizes were placed in different positions in the model, and compacted with wooden boards to ensure that the porous medium in the model was fully and uniformly saturated with the simulated oil.
(3) Open the liquid storage tank switch, add water to the liquid storage tank; open the gas cylinder, and open the ISCO plunger pump. Under the action of the air compressor, the water enters the constant speed constant pressure pump and then enters the lower part of the intermediate container. The liquid pushes the piston in the intermediate container to move up so that the ink enters the heterogeneous model from the intermediate container through the simulation well.
(4) Water flooding is carried out on the heterogeneous formation model until the water content at the end of the production well is 98%. The pre-set adjustment well is opened, the production well is closed, and then the constant-speed constant-pressure pump is opened, so that the ink enters the heterogeneous formation from the intermediate contain-er through the simulation well and is produced by the adjustment well until the water content at the end of the production well is 98%.
(5) The total liquid production at different times was recorded with a stopwatch and a measuring cylinder. After standing, the amount of oil and water was measured every 3 min.
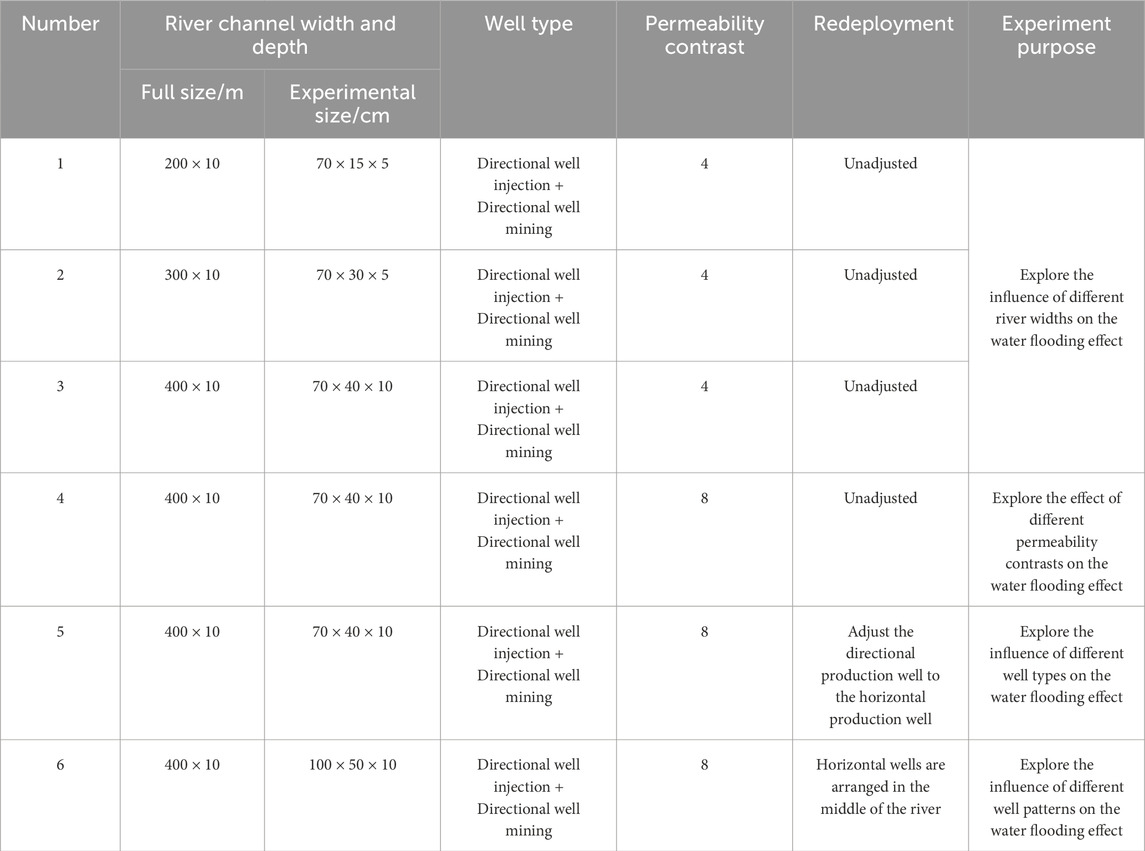
Table 2. Experimental program design.
3 Results
This section may be divided by subheadings. It should provide a concise and precise description of the experimental results, their interpretation, as well as the experimental conclusions that can be drawn and our conclusion on EOR and water flooding can be strengthened following the idea (Zongbin et al., 2013; Abd-Elaal et al., 2024; Salem et al., 2024; Khattab et al., 2024a; Khattab et al., 2024b).
3.1 The distribution law of remaining oil under different channel widths
3.1.1 Experimental scheme
The length of the experimental model is 70 cm, the width is 20 cm ∼ 40cm, the height is 5 cm, and the permeability contrast is 4 (Figure 2). Using the same permeability contrast, the influence of different channel widths on the distribution of remaining oil is compared and analyzed, and the type of remaining oil enrichment is determined.
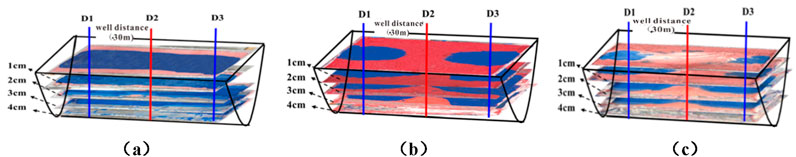
Figure 2. Three-dimensional physical simulation of experimental river longitudinal profiles. (a) The width of the river is 200 m. (b) The width of the river is 300 m. (c) The width of the river is 400 m.
3.1.2 Water flooding characteristics
In the narrow river channel, the injected water in the early stage of displacement first advances along the high permeability area inside the channel, and there are many un-swept areas in the low permeability area at the edge of the channel. In the middle stage of displacement, the injected water spreads from the high permeability area inside the channel to the low permeability area at the edge of the channel. At the end of displacement, the range of sweeping is limited, forming linear displacement, and the shape of the sweeping area is a narrow strip. Due to the limitation of injection speed, the sweep area near the injection well is large, and the sweep area near the production well is small. The displacement shape is a spindle. Due to the limited displacement energy, the injected water is difficult to spread to the edge of the channel, and the remaining oil accumulates near the edge of the channel and the production wells (Figures 3, 4).
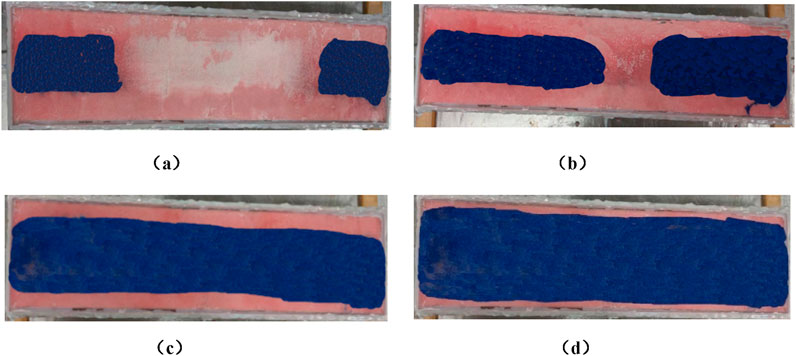
Figure 3. Channel width 200 m water-driven feature. (a) The water content is 34 % (the sweep coefficient is 0.25). (b) The water content is 62 % (the sweep coefficient is 0.5). (c) The water content is 92 % (the sweep coefficient is 0.7). (d) The water content is 35 % (the sweep coefficient is 0.95).
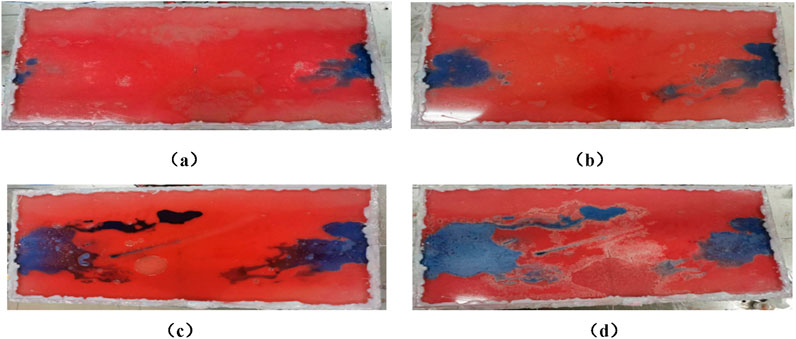
Figure 4. Channel width 400 m water-driven features. (a) The water content is 34 % (the sweep coefficient is 0.05). (b) The water content is 62 % (the sweep coefficient is 0.13). (c) The water content is 92 % (the sweep coefficient is 0.24). (d) The water content is 35 % (the sweep coefficient is 0.27).
3.1.3 Remaining oil distribution
In the later stage of displacement, due to the increase in channel width and the limited displacement energy, the distribution of remaining oil at the top of different channel widths has formed a large difference. The channel width of 200 m is linear displacement, forming a narrow strip swept shape. The remaining oil is distributed throughout the channel (Figure 5a). The channel width of 300 m is radial displacement, forming a spindle-swept shape (Figure 5b). The remaining oil is concentrated on the edge and near production wells. The spindle-swept shape of the channel width of 400 m is more significant, and the remaining oil is concentrated on the edge and near production wells (Figure 5c). The remaining oil distribution in the middle of the river channel is similar to that at the top. The remaining oil with a width of 200 m is dispersed (Figure 6a). The sweeping shape of the river channel with a width of 300 m changes from a spindle shape to a narrow strip shape (Figure 6b). The remaining oil distribution is relatively concentrated. The sweeping shape of the river channel with a width of 400 m is a spindle shape, and the remaining oil distribution is concentrated (Figure 6c). Compared with the top, the remaining oil distribution in the middle of the river channel is less and the sweep range is larger. Due to the narrow channel reservoir, the top is flat and the bottom is convex, the top is wide, and the bottom is narrow, so the bottom of different channels is narrow. The remaining oil distribution at the bottom of different channel widths is similar, almost completely swept, forming a narrow strip swept shape, and the remaining oil is dispersed throughout the channel (Figure 7).
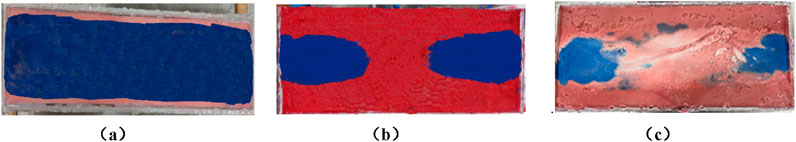
Figure 5. Topwater-driven waves and patterns for different channel widths. (a) 200 m, sweep coefficient 0.95. (b) 300 m, sweep coefficient 0.32. (c) 400 m, sweep coefficient 0.27.
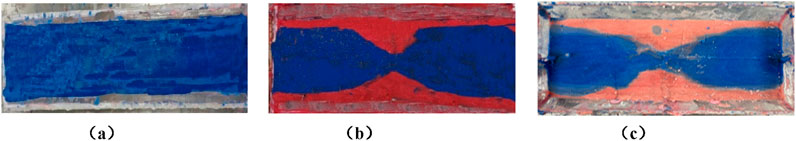
Figure 6. Central water drive and patterns under different channel widths. (a) 200 m, sweep coefficient 1. (b) 300 m, sweep coefficient 0.69. (c) 400 m, sweep coefficient 0.63.
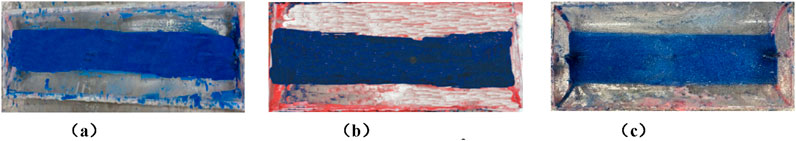
Figure 7. Bottom water-driven waves and patterns for different channel widths. (a) 200 m, sweep coefficient 1. (b) 300 m, sweep coefficient 1. (c) 400 m, sweep coefficient1.
3.1.4 Affected degree and development effect
The variation curves of horizontal and vertical sweep coefficient, water content, and recovery degree under different river widths are shown in Figure 8. In the longitudinal direction, the sweep range decreases with the increase of river width, and the potential area of 200 m ∼ 400 m is above 1/10–4/5 from the top of the river. In the plane, the sweep range decreases with the increase of river width, and the potential area of 200 m ∼ 400 m is outside 1/5 ∼ 1 from the edge of the river. As shown in Figure 9, the recovery degree decreases with the increase in the width of the river channel. The water content reaches 98% in the later stage of displacement, and the recovery degree of the river channel width of 200 m ∼ 400 m is 41%, 34%, and 32%.
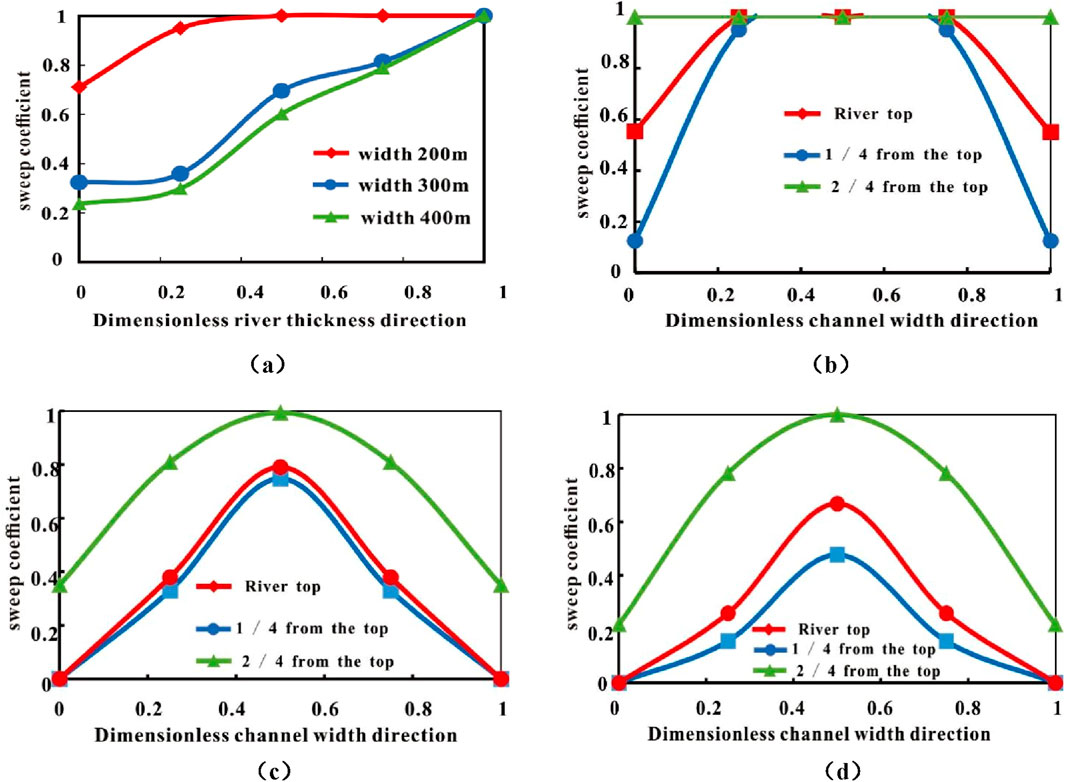
Figure 8. Wave and regularity curves. (a) Longitudinal ripple law under different river widths. (b) The law of plane sweeping with a width of 200 m. (c) The law of plane sweeping with a width of 300 m. (d) The law of plane sweeping with a width of 400 m.
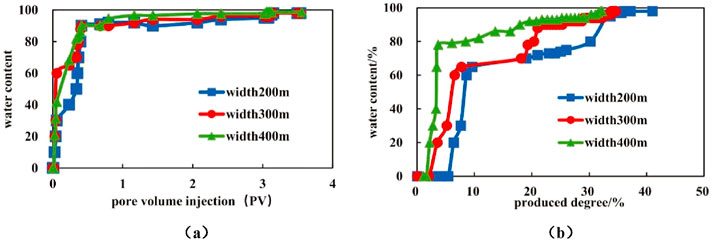
Figure 9. Production indicator curves. (a) The relationship graph between injection multiple and water content. (b) The relationship graph between water cut and recovery degree.
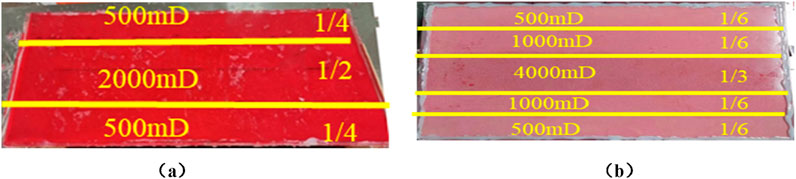
Figure 10. Different permeability differential distribution. (a) permeability difference is 4. (b) permeability difference is 8.
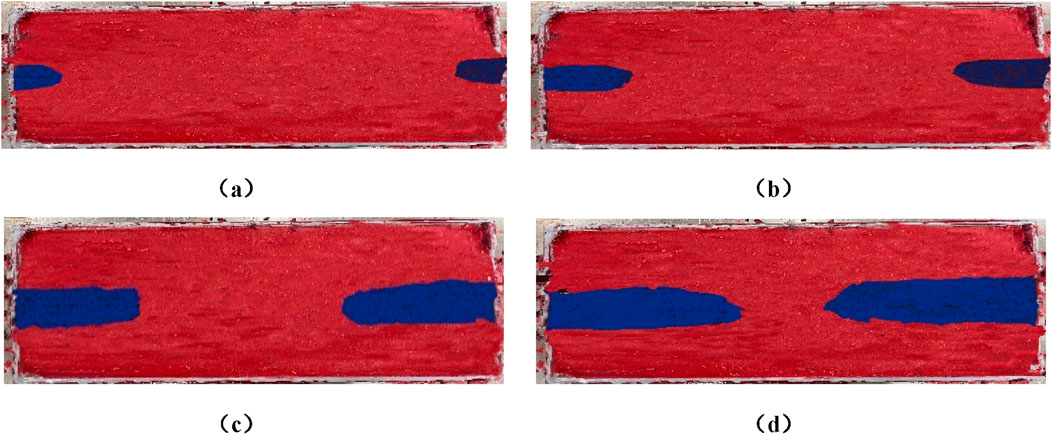
Figure 11. Permeability gradient 8 water drive characteristics. (a) The water content is 34 % (the sweep coefficient is 0.03). (b) The water content is 62 % (the sweep coefficient is 0.07). (c) The water content is 92 % (the sweep coefficient is 0.15). (d) The water content is 98 % (the sweep coefficient is 0.23).
3.2 The distribution law of remaining oil under different permeability differences
3.2.1 Experimental scheme
The width of the model is designed to be 70 cm long, 40 cm wide, and 5 cm high (See Figure 10). The permeability distribution of the whole channel is 1/2 of the internal high permeability and the edge low permeability. The permeability differences of the two groups of experimental models are 8 and 4, respectively. The same channel width is used to compare and analyze the influence of different permeability differences on the distribution of remaining oil.
3.2.2 Drive characteristic
In the early stage of displacement, due to the large permeability difference and limited displacement energy, the injected water first advances along the high permeability area inside the river, and it is difficult for the injected water to advance from the high permeability area to the low permeability area. The middle and low permeability area at the edge of the river is almost unused, and the sweeping shape is a “narrow spindle”. More remaining oil is concentrated in the middle and low permeability area at the edge of the river (Figure 11).
3.2.3 Spreading degree and development effect
The curves of vertical and plane sweep coefficient, water content, and recovery degree under different permeability differentials are shown in Figures 12, 13, it can be seen that in the vertical direction, the sweep range decreases with the increase of permeability difference. The potential area of difference 4 and difference 8 is above 3/5 and 4/5 from the top of the river channel. In the plane, the sweep range decreases with the increase of permeability difference. The potential area is outside 1/5∼1, 3/10 ∼ 1 from the edge of the river channel. The water content in the later stage of displacement reaches 98%, the recovery degree of difference 4 is 32%, and the recovery degree of difference 8 is 28%. The recovery degree decreases with the increase of the difference.
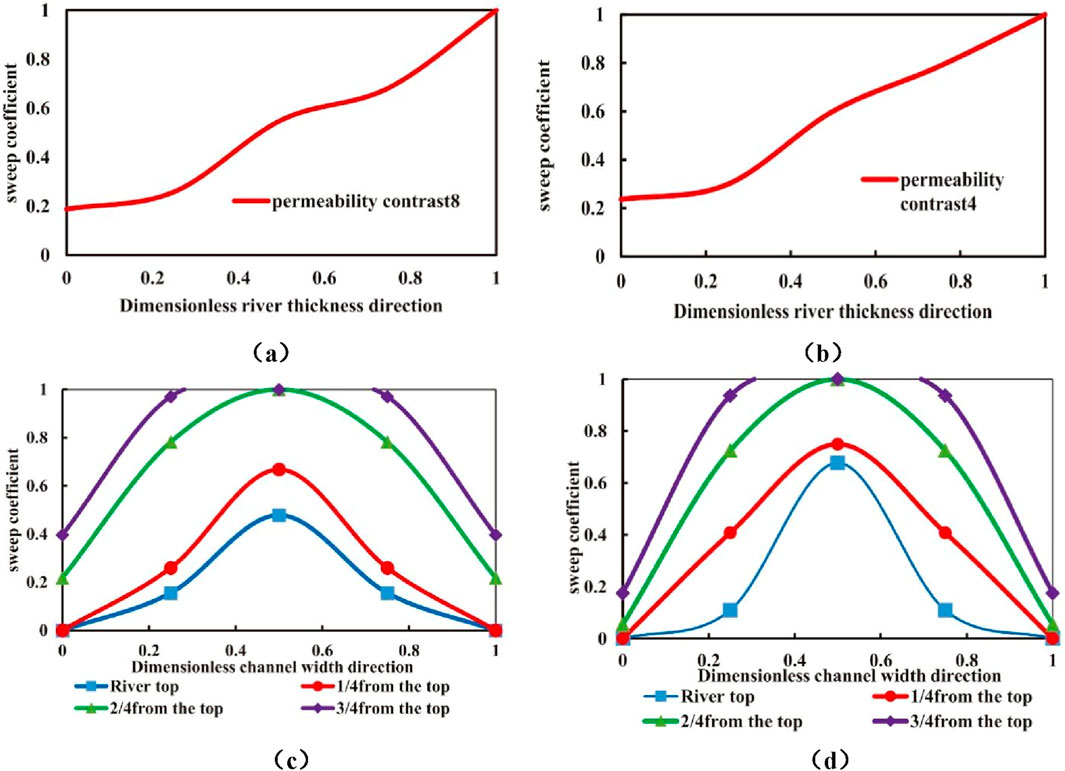
Figure 12. Wave and regularity curves. (a) Longitudinal sweep rule with a grade difference of 4. (b) Longitudinal sweep rule with grade difference of 8. (c) Plane wave propagation law with a grade difference of 4. (d) Plane sweep rule with a grade difference of 8.
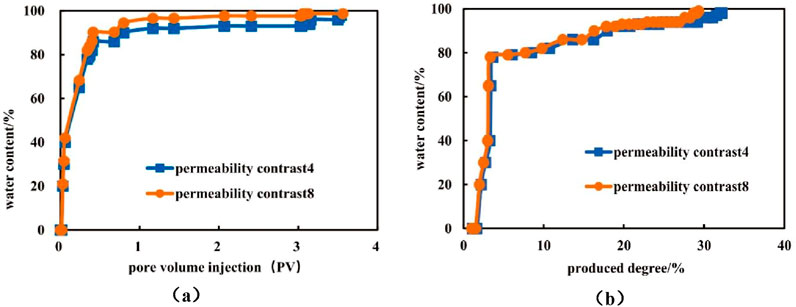
Figure 13. Production indicator curves. (a) The relationship between injection multiple and water content. (b) Relationship diagram of recovery degree and water content.
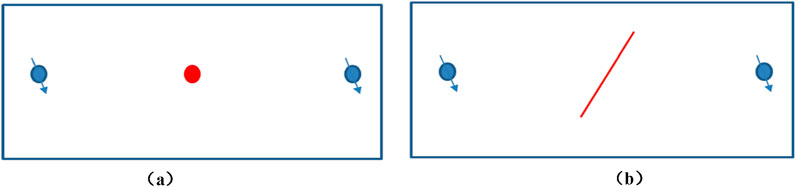
Figure 14. Well network distribution before and after well type adjustment. (a) The original well pattern mode before well type adjustment. (b) Well pattern mode after well type adjustment.
3.3 The mechanism and amplitude of well type adjustment to improve production
3.3.1 Experimental parameters and purpose
The length of the experimental model is 70 cm, the width is 40 cm, the height is 5 cm, and the permeability difference is 8. Based on the results of the remaining oil distribution in the above experiment, due to the complete spread at the bottom of the river channel and the enrichment of remaining oil in the middle and upper parts, it is suitable to use horizontal wells to tap the potential of remaining oil at the top. Therefore, the production wells in the river channel are adjusted from directional wells to horizontal wells, and the mechanism and amplitude of improving the production of horizontal wells relative to directional wells are analyzed (Figure 14).
3.3.2 Water drive characteristics in different development stages
By comparing and analyzing the results of the two groups of experiments before and after the adjustment, the injected water before the adjustment advances along the high permeability area in the middle of the river channel to form a ‘spindle-shaped ‘spread form, and the remaining oil is distributed near the edge of the river channel and the production well. By adjusting the well type, the horizontal well runs through the entire river channel along the width direction of the river channel, changing the direction of the injected water flooding. The spread form is transformed from spindle-shaped to near ‘linear displacement ‘to better use the remaining oil near the low permeability area of the river channel edge and the production well, reducing the un-spread area (Figure 15).
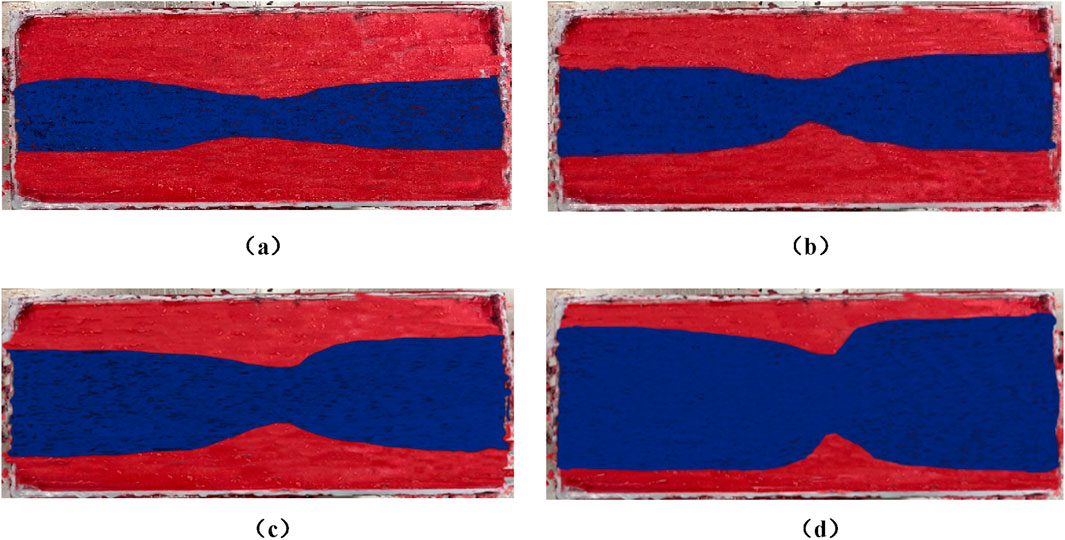
Figure 15. Map of changes in water-driven features at the top of the channel. (a) The water content is 72 % (the sweep coefficient is 0.34). (b) The water content is 80 % (the sweep coefficient is 0.44). (c) The water content is 90 % (the sweep coefficient is 0.54). (d) The water content is 98 % (the sweep coefficient is 0.73).
3.3.3 Spreading degree and development effect
The curve of the degree of spread and the change of production index before and after the adjustment is shown in Figure 16. As can be seen from Figure 16, vertically, the bottom of the river is almost completely swept, there is a small amount of unswept area at the top of the river, and the potential area is more than 1/5 from the top of the river. On the plane, the middle is almost completely spread, the edge of the river is not completely spread, and the potential area is 1/5 ∼ 3/10 away from the edge of the river. With the development of water injection, when the water cut reaches 98%, the recovery degree is 26%. The directional well is transformed into a horizontal well, the water cut decreases by 26%, and the recovery degree increases by 14.6%, which improves the reservoir utilization degree.

Figure 16. Wave and regularity curves. (a) Longitudinal sweep rule. (b) Law of plane sweeping.
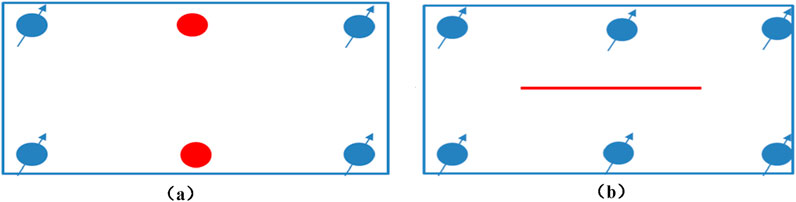
Figure 17. Adjustment of before and after well network patterns. (a) The original well pattern mode before adjustment. (b) The adjusted well pattern mode.
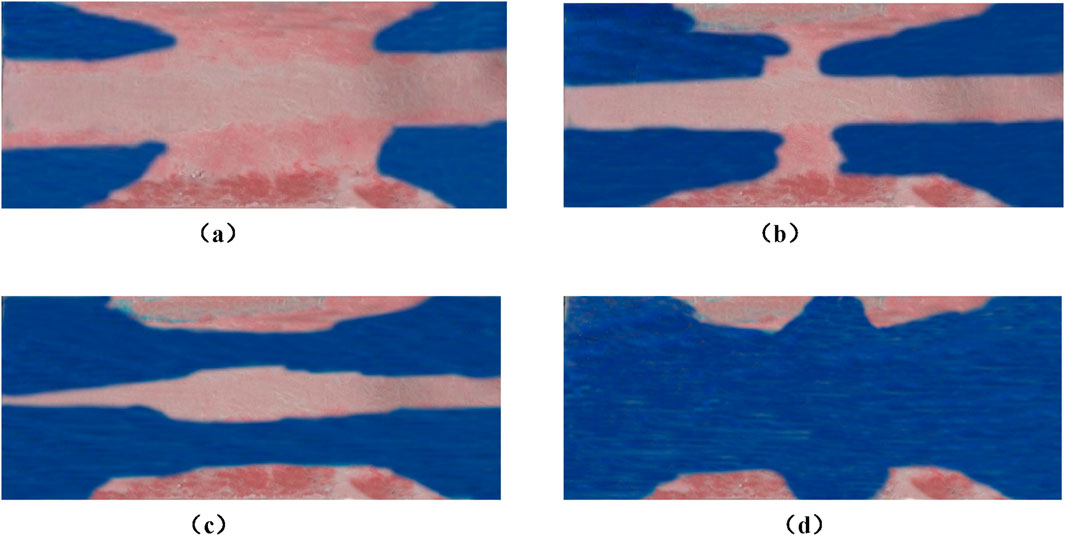
Figure 18. Schematic diagram of water drive characteristics at different development stages. (a) The water content is 72 % (the sweep coefficient is 0.35). (b) The water content is 80 % (the sweep coefficient is 0.44). (c) The water content before adjustment is 90 % (sweep efficiency is 0.68). (d) The adjusted moisture content is 90 % (sweep efficiency is 0.85).
3.4 The mechanism and range of well pattern adjustment for improving the producing range
3.4.1 Experimental parameters and purpose
The development experience of the oilfield shows that the remaining oil with macroscopic distribution can be recovered by adjusting development measures and deploying infill wells in a large range (Zongbin et al., 2013). Combined with the remaining oil distribution characteristics of narrow channel reservoir in this paper. A horizontal well is arranged inside the river channel to transfer the production wells of the original well pattern to the injection wells, which can change the swept form of the injected water and better improve the utilization of the reservoir.
The simulation parameters of the experiment are 100 cm in length, 50 cm in width, 5 cm in height, and 8 in permeability difference. Due to the wide width of the river channel, the remaining oil is irregularly distributed in the river channel. The deployment of adjustment wells to improve the well pattern, alleviate the heterogeneity of the reservoir, and improve the available geological reserves in the well pattern control area (Figure 17). Therefore, the production wells at the edge of the river channel are converted to injection, and a horizontal well is arranged inside to analyze the mechanism and amplitude of well pattern adjustment to improve the utilization.
3.4.2 Water drive characteristics in different development stages
By comparing and analyzing the experimental results of the two groups, the remaining oil before adjustment is mainly distributed in the high permeability area inside the river channel and near the production wells at the edge of the river channel. Through the adjustment of the well pattern, the sweep pattern of injected water is changed in the horizontal well of the river channel, and the remaining oil between the high permeability area in the middle of the river channel and the injection and production wells at the edge of the river channel is better utilized, which reduces the unswept area and improves the utilization of the reservoir (Figure 18).
3.4.3 Production and development index
With the development of water injection, when the water content reaches 98%, the recovery degree is 33%. After the adjustment of the well pattern, the water cut decreased by 8%, the recovery degree increased by 11%, and the reservoir utilization degree was improved (Figures 19, 20).
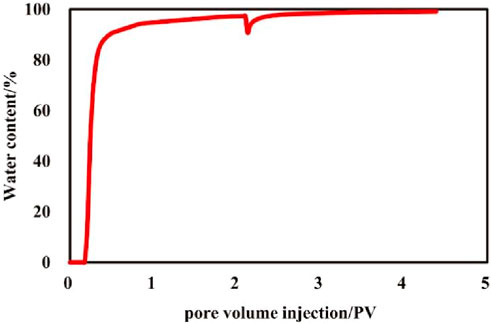
Figure 19. Curve of injection multiplier versus moisture content.
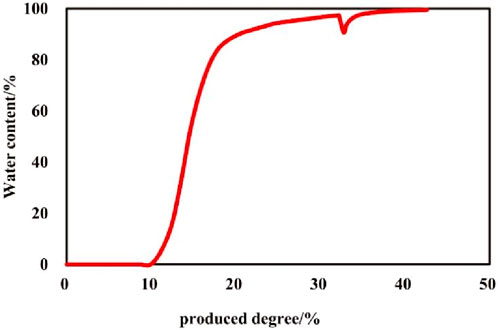
Figure 20. Extraction level vs. water content curve.
4 Conclusion
In this paper, through the three-dimensional physical simulation experiment of water flooding, the remaining oil distribution law of different channel widths, permeability differences, adjustment mode, and cutting mode are analyzed. The main conclusions are as follows:
(1) sweep rule: sweep form is mainly narrow strip linear displacement, spindle radial displacement, through the adjustment of good pattern can change the sweeping form of injected water, improve the reservoir producing degree;
(2) The influence of channel width: the remaining oil below 200 m is dispersed in the whole channel, and the distribution of remaining oil above 200 m is divided into two aspects. On the plane, it is enriched near and at the edge of the production well, and in the longitudinal direction, the bottom is fully affected, and the remaining oil at the top is concentrated. As the width increases, the swept shape changes from narrow strip to spindle ', and the remaining oil around the production well begins to enrich.
(3) The influence of permeability differential: the larger the differential, the injected water preferentially advances along the high permeability area, the worse the sweep degree of the river edge, and the higher the enrichment degree of the remaining oil;
(4) The influence of adjustment mode: after the development of the horizontal well, the water content is reduced, and the remaining oil enriched near the production well and at the edge of the river channel is well utilized. However, due to the strong heterogeneity of the river channel, there is still unused remaining oil at the edge of the river channel, and the well pattern adjustment also improves the utilization of remaining oil inside the river channel.
Data availability statement
The original contributions presented in the study are included in the article/supplementary material, further inquiries can be directed to the corresponding author.
Author contributions
KM: Writing–original draft, Validation. JW: Writing–original draft, Conceptualization, Methodology, Writing–review and editing. SS: Methodology, Writing–review and editing. LY: Data curation, Writing–review and editing. ZZ: Formal Analysis, Writing–review and editing. HL: Writing–original draft, Writing–review and editing. ZW: Writing–review and editing.
Funding
The author(s) declare that financial support was received for the research, authorship, and/or publication of this article. The authors would further like to thank the National Science and Technology Major Project (2016ZX05058-001) and CNOOC Co., Ltd. Major Project (CNOOC-KJ135 ZDXM36 TJ03TJ-GD2020-01, CNOOC-KJGG2021-0505, CNOOC-KJZH-2024-2205). The authors declare that this study received funding from CNOOC Co., Ltd. The funder was not involved in the study design, collection, analysis, interpretation of data, the writing of this article, or the decision to submit it for publication.
Conflict of interest
Authors KM, JW, SS, LY, ZZ, HL, and ZW were employed by Tianjin Branch of CNOOC Ltd.
Generative AI statement
The author(s) declare that no Generative AI was used in the creation of this manuscript.
Publisher’s note
All claims expressed in this article are solely those of the authors and do not necessarily represent those of their affiliated organizations, or those of the publisher, the editors and the reviewers. Any product that may be evaluated in this article, or claim that may be made by its manufacturer, is not guaranteed or endorsed by the publisher.
References
Abd-Elaal, A. A., Tawfik, S. M., Abd-Elhamid, A., Salem, K. G., and El-hoshoudy, A. N. (2024). Experimental and theoretical investigation of cationic-based fluorescent-tagged polyacrylate copolymers for improving oil recovery. Sci. Rep. 14, 27689–28289. doi:10.1038/s41598-024-78128-5
Amaechi, B., Iglauer, S., Pentland, C. H., Bijeljic, B., and Blunt, M. J. (2014). An experimental study of three-phase trapping in sandpacks. Transp. Porous Med. 103, 421–436. doi:10.1007/s11242-014-0309-4
Ashman, K. D., Volpin, S. G., and Kovaleva, O. V. (2019). Possible methods for estimating the composition, distribution and properties of residual oil during flooding. Neft. khozyaystvo-Oil Ind. 2019 (08), 114–117. doi:10.24887/0028-2448-2019-8-114-117
Chunsheng, Y., Min, L., Guoan, Q., and Qiujie, L. (2007). Numerical simulation of multi-layer long core water flooding experiment. Fault block oil gas field (04), 52–54.
Gong, L., Shichao, C., Xinwu, L., and Fenghui, L. (2011). A theoretical calculation formulae of water breakthrough time in narrow channel sand reservoir. Sci. Technol. And Eng. 11 (29), 7236–7241.
Haiyan, Z., Haochuan, L., Hongfu, S., Qiang, S., and Lei, Y. (2020). Experimental study on water drive of plane model in narrow channel reservoirs –by taking BZ oilfield as an example. Petroleum Geol. And Eng. 34 (03), 85–88.
Hao, W., Dehua, L., Hongru, L., and Lu, S. (2015). Quantitative evaluation of remaining oil distribution in reservoirs at high water cut stage case study of 4 layers and 2 layers of the 3rd member of Hetaoyuan Formation in Anpeng District, Zhaoao Oilfield. J. Yangtze Univ. (self-edited) 12 (29), 66–70.
Haochuan, L., Haiyan, Z., Rong, F., Hui, l., and Chaojie, K. (2018). Analysis of water injection capacity in narrow channel reservoirs of Bohai area. Offshore oil. 38 (01), 46–49. doi:10.3969/j.issn.1008-2336.2018.01.046
Hongguang, X., Yu, X., Yongqing, W., Wensheng, Z., Ling, W., and Qian, J. (2017). Preparation and evaluation on artificial core of extra high permeability unconsolidated sandstone. Oil Drill. and Prod. Technol. 39 (04), 477–483.
Jiang, F., Zixiang, Z., and Zaraduxin, A. B. (1993). Model for calculating sweep efficiency of heterogeneous reservoirs. Acta Pet. Sin. 01, 92–98.
Jianwei, G., Zhiwen, L., Xiuling, Y., Yigen, Z., and Yike, W. (2017). Well network adjustment based on the movable potential control-level of remaining oil. Special oil gas reservoirs 24 (06), 84–89. doi:10.3969/j.issn.1006-6535.2017.06.016
Jing, L. (2013). “Study on the easonable working system of intermittent production of oil wells,” in Low permeability reservoirs (Southwest Petroleum University).
Khattab, H., Gawish, A. A., Gomaa, S., Hamdy, A., and El-hoshoudy, A. N. (2024a). Assessment of modified chitosan composite in acidic reservoirs through pilot and field-scale simulation studies. Sci. Rep. 14, 10634–11134. doi:10.1038/s41598-024-60559-9
Khattab, H., Gawish, A. A., Hamdy, A., Gomaa, S., and El-hoshoudy, A. N. (2024b). Assessment of a novel xanthan gum-based composite for oil recovery improvement at reservoir conditions; assisted with simulation and economic studies. J. Polym. Environ. 32, 3363–3391. doi:10.1007/s10924-023-03153-w
Kun-Kun, F. A. N., Ren-Yuan, S. U. N., Zi-Chao, M. A., Zhang, Y. F., Wei, Y., and Zhang, Z. Z. (2013). Effect of fracture parameters on desorption properties of shales. Appl. Mech. And Mater. 397-400, 252–256. doi:10.4028/www.scientific.net/amm.397-400.252
Min, T. (2012). Study on inflow performance and reasonable working system of interwell in low permeability reservoir of huaqing oilfield D.Southwest Petroleum university.
Ming, S, Xiaobin, W, Lining, W., Jianglong, R., and Wu, Y. (2018). Remaining oil distribution La w of water drive sandstone reservoir in low per ability channel. Unconvent. Oil&Gas 5 (04), 58–64.
Pingping, S., Jialu, W., Yuling, T., and Zubo, Z. (2004). Saturation measurement technique for 3D Re-servoir physical modeling. Petroleum exploration and development, (S1): 71–76.
Qingtai, X. (2011). Coulomb method for oil-water saturation test in medium-high permeability reservoirs. Oil And Gas Field Surf. Eng. 30 (11), 27–28. doi:10.3969/j.issn.1006-6896.2011.11.012
Salem, K. G., Salem, A. M., Tantawy, M. A., Gawish, A. A., Gomaa, S., and El-hoshoudy, A. N. (2024). A comprehensive investigation of nanocomposite polymer flooding at reservoir conditions: new insights into enhanced oil recovery. J. Polym. Environ. 32, 5915–5935. doi:10.1007/s10924-024-03336-z
Shaoxianjie, A. (2010). New characterized parameter for the permeability heterogeneity of the reservoir: calculation method of permeability diversity coefficient and its significance. Petroleum Geol. and Exp. 32 (04), 397–399.
Shuaiwei, D., Hanqiao, J., Daiyu, Z., Ji, Z., Xiyu, K., Qian, W., et al. (2016). A new method for quantitatively evaluating the remaining oil potential of the reservoir at the medium-high water-cut stage and its application. Complex Hydrocarb. Reserv. 9 (01), 41–45. doi:10.16181/j.cnki.fzyqc.2016.01.009
Wangming, G. (2020). Water drive simulation experiment and Dy namic analysis of plane heterogeneous reservoir. China Sci. Pap. 15 (09), 1058–1063.
Wei, W. (2014). Study on multidisciplinary effective method of residual oil quantification. J. Of Yangtze Univ. Sci. Ed. 11 (16), 78–80.
Xiaodong, H., Haikuan, D., Yongxiang, D., Yanhui, Z., Xiuping, W., Weiyu, C., et al. (2014). The experimental study for water shut-off on horizontal well of high water cut reservoir in offshore oilfield. Sci. Technol. And Eng. 14 (25), 202–205.
Yao, X., Su, X., Zheng, X., Ma, J., Gai, L., and Cui, C. (2023). 3D physical simulation experiments of development effects after well pattern adjustment in extra-high water cutreservoirs. Petroleum Geol. Recovery Effic. 30 (01), 139–145. doi:10.13673/j.cnki.cn37-1359/te.202211015
Xuejun, C., Jianming, H., Jiapeng, Z., Wei, X., and Shusheng, G. (2004). Diagnosis and adjustment of edge water direction in-plane heterogeneous reservoir. Acta Pet. Sin. 04, 58–61.
Yifan, H., Yong, H., Haiyan, Z., Quanlin, W., Lisha, X. I., et al. (2016). Evaluation of DST deliverability in narrow channel sand reservoirin BZ25⁃1s oilfield, Bohai sea. Xinjiang Pet. Geol. 37 (02), 204–207. doi:10.7657/XJPG20160214
Yu, X. (2015). Wang shuai, geng standing, etc. A new technology of making weakly cemented and hypertonice artificial cores of unconsolidated sandstone. Progress in. Geophysics 30 (03), 1474–1479. doi:10.6038/pg20150364
Yu, X., Hao, Z., Wensheng, Z., Cheng, L., and Li, G. (2019). Water driving physical simulation test of remaining oil based on 3D large-scale heterogeneous reservoir model. Reserv. Eval. And Dev. 9 (06), 16–23. doi:10.13809/j.cnki.cn32-1825/te.2019.06.003
Yu, X., Hongguang, X., Yongqing, W., Wemsheng, Z., Chen, L., Shanshan, W., et al. (2018). Progress of physical research on domestic artificial cores. Nat. Gas And Oil 36 (01), 55–61. doi:10.3969/j.issn.1006-5539.2018.01.009
Yuhong, L., Hanmin, X., Weidong, L., Linghui, S., Jinliang, H., et al. (2012). Research on oil displacement of polymer/surfactant flooding for visible model under the heterogeneous condition. Sci. Technol. And Eng. 12 (29), 7693–7696.
Yulong, S. (2012). Lang lishu, Ma qingming, etc. Feasibility study on determination of water saturation in porous media by resistivity method. J. Of Oil And Gas Technol. 34 (02), 110–113.
Zhailiang, (2011). Optimization of injection-production well pattern for thin and bottom water reservoir in narrow river channel in tanhai area in shengli oilfield. Xinjiang Pet. Geol. 32 (05), 515–517.
Zhiwei, W., Chaopeng, Y., Guoyong, W., and Xiangan, Y. (2016). Experimental study on oil production characteristics of water flooding and remaining oil distribution in the oilfield of plain heterogeneity. Sci. Technol. And Eng. 16 (13), 48–55.
Keywords: narrow channel reservoir, three-dimensional physical simulation, well pattern adjustment, water flooding, residual oil distribution
Citation: Ma K, Wang J, Si S, Yang L, Zhao Z, Ling H and Wu Z (2025) Study on three-dimensional physical simulation experiment of remaining oil distribution in narrow channel reservoir. Front. Earth Sci. 13:1514770. doi: 10.3389/feart.2025.1514770
Received: 21 October 2024; Accepted: 25 February 2025;
Published: 03 April 2025.
Edited by:
Pin Jia, China University of Petroleum, ChinaReviewed by:
Hongjian Zhu, Yanshan University, ChinaYisheng Hu, Southwest Petroleum University, China
Hongye Feng, Chinese Academy of Geological Sciences, China
Abdelaziz El-hoshoudy, Egyptian Petroleum Research Institute, Egypt
Yong Wang, Southwest Petroleum University, China
Copyright © 2025 Ma, Wang, Si, Yang, Zhao, Ling and Wu. This is an open-access article distributed under the terms of the Creative Commons Attribution License (CC BY). The use, distribution or reproduction in other forums is permitted, provided the original author(s) and the copyright owner(s) are credited and that the original publication in this journal is cited, in accordance with accepted academic practice. No use, distribution or reproduction is permitted which does not comply with these terms.
*Correspondence: Jijun Wang, d2FuZ2pqNjBAY25vb2MuY29tLmNu