 Pin Jia
 Qiang Sun2
 Yang Li
 Bangdan Liu
- 1College of Petroleum Engineering, China University of Petroleum (Beijing), Beijing, China
- 2Bohai Petroleum Research Institute, CNOOC Tianjin Branch, Tianjin, China
- 3South Sulige Operating Company, CNPC Changqing Branch, Xi'an, China
In the process of water-driven development of narrow-channel oil reservoirs, the comprehensive water cut rate rises quickly, showing the development characteristics of “flooding everywhere in the river channel, but the degree of recovery is low”, and the underground oil and water distribution is complicated due to its special narrow strip sand body spreading and long-term water-injection development. Therefore, there is an urgent need to research the water-water drive law of narrow-channel reservoirs, to clarify the distribution law of microscopic residual oil and the degree of water-driven utilization. In this paper, taking BZ offshore narrow channel reservoir as the research object, a full-view microscopic water drive physical simulation experiment platform was established and microfluidic experiments were carried out. Based on the physical simulation experiment of microscopic residual oil distribution, the oil-water distribution images of each stage in the water flooding process are obtained. It is found that this type of reservoir has a serious fingering phenomenon in the early stage of water drive, and the residual oil can be classified as contiguous, porous, membrane, strip, and drop, and evolves in the above order. The direction of dredging in the weakly active zone is mainly to change the direction of fluid flow, the direction of dredging in the medium active zone is equivalent to the effect of changing the direction of fluid flow and optimizing the injection and recovery parameters, and the impact of dredging in the strongly active zone is mainly to optimize the injection and recovery parameters. This study reveals the characteristics of microscopic water drive, clarifies the type of microscopic residual oil and its evolution process, and clarifies the distribution of residual oil and the dredging effect under the utilization of different water-driven zones, which is of certain guiding significance for the development and adjustment of the same type of reservoirs.
1 Introduction
BZ oilfield is the largest narrow channel heavy oil reservoir in the Bohai Sea. After over 10 years of water injection development, the oilfield has entered high water cuts (Hongfu et al., 2017). Residual Oil refers to the crude oil that remains trapped within the pores of reservoir rocks and is not recovered after natural energy depletion or artificial displacement methods during reservoir development (Lida, 2022; Pengxiao et al., 2023). Due to the limitation of offshore oilfield development and the particularity of reservoir geological conditions, the development adjustment and remaining oil potential tapping of this type of oilfield cannot completely depend on the development experience of ordinary high water cut oilfield (Haochuan et al., 2018). The development characteristics of narrow channel reservoirs are reflected in the fact that the reservoir is water-bearing, but the degree of recovery is low (Tileuberdi et al., 2024).The key to further improving the degree of recovery is to tap the remaining oil in the range of potential water drive. Therefore, clarifying the microscopic water flooding law of narrow channel reservoirs plays an important role in increasing the production of this type of oilfield (Al-Dujail et al., 2023).
Microfluidic technology is a technology that can realize the displacement control of flowing fluids at the micro-nano scale, which provides a new research perspective and solution for the development of oil and gas fields. Scholars at home and abroad introduced microfluidic technology into the field around the basic theory of oil and gas field development direction, carried out a series of in-depth research, and achieved remarkable results (1950s). Subsequent researchers (Chatenever and Calhoun, 1952) first successfully captured the key information on water seepage path, velocity distribution, and flow pattern in the model by using the visual microscopic glass model of granular filling. Subsequent researchers (Shangping et al., 1986; Qiang et al., 2019) used the microfluidic model to deeply analyze the hydrodynamic characteristics, the stability of the oil-water interface, and the formation and distribution of remaining oil in the process of water flooding. With the development of microfluidic technology, the choice of model materials has gradually diversified, from a single silicon material to a variety of materials such as glass, quartz, and polymer, making microfluidic technology more widely used. Subsequent researchers (Alizadeh et al., 2014) successfully simulated the carbonation water flooding process at the micro-scale by using microfluidic technology. By carefully controlling the experimental conditions, they observed and recorded the flow behavior and interaction process of crude oil, carbonized water, and carbon dioxide gas phase in microfluidic chips, revealing the specific mechanism and influencing factors of these interactions. Subsequent researchers (Chuan et al., 2020) established a set of quantitative characterization methods of microscopic remaining oil characteristic parameters based on image processing technology and mathematical-statistical methods through microfluidic experiments. The microscopic remaining oil was classified and quantitatively characterized, and the occurrence state and dynamic evolution characteristics of the microscopic remaining oil in the process of water flooding were analyzed. Subsequent researchers (Rui et al., 2023; Xu et al., 2017) used microfluidic displacement experiments to clarify the occurrence of microscopic remaining oil under different injection-production methods in highly heterogeneous reservoirs at the ultra-high water cut stage. For highly heterogeneous reservoirs, the use of microscopic remaining oil under different injection-production methods was quantitatively studied (Shilov et al., 2020; Ren et al., 2020). Microfluidic technology can simulate the dynamic migration process of oil and water in porous media and has the unique advantage of visualization. Using this feature of microfluidic technology, the dynamic water flooding process and the distribution of oil and water after displacement can be visually displayed, to clarify the microscopic water flooding characteristics, remaining oil evolution law, and enrichment mechanism.
The remaining oil is highly dispersed on the micro-scale, which will inevitably lead to the change of oil-water flow law. If the distribution law of micro remaining oil cannot be described truly and objectively, it will ultimately affect the increase of oil production. At present, few studies have directly revealed the distribution law of microscopic remaining oil in high-porosity and high-permeability heavy oil reservoirs (Yuan et al., 2019). This study starts with micro-physical simulation, explores the water flooding characteristics, remaining oil types, and their evolution laws at the micro-scale, analyzes the remaining oil distribution under different water flooding zones, and studies the potential tapping direction of different producing areas. This study has an in-depth understanding of the remaining oil distribution and potential tapping direction under the water flooding zoning of narrow channel reservoirs, and then explores the reservoir potential and taps the remaining oil, which has important guiding significance for improving reservoir recovery (Kokkinos et al., 2022).
2 Experimental materials
2.1 Experimental flowing object
The viscosity of crude oil in the BZ reservoir is 13–295 mPa·s, the viscosity of formation water is 1 mPa·s, the relative permeability of the oil phase is 0.19, the relative permeability of the water phase is 0.74, and the water-oil mobility ratio is 50.63–1148.95. According to the typical characteristics of the BZ reservoir, the mobility ratio of 600 is selected, that is, the simulated oil with a viscosity of 150 mPa·s and the simulated water with a viscosity of 0.8 mPa·s are used for physical simulation experiments.
2.1.1 Experimental simulation oil
The simulation oil used is a compound oil composed of anhydrous kerosene and engine oil in proportion and is dyed red with Sudan III dye. The viscosity of the oil sample is 150 mPa·s, and the density is 0.92 g/cm3. The viscosity of kerosene is 2.5 mPa·s, the density is 0.8 g/cm3, the freezing point is −47°C, the boiling range is 180°C–310°C, and the average molecular weight is between 200 and 250 g/mol. The viscosity of the oil is 200 mPa·s, the density is 0.95 g/cm3, the freezing point is −37°C, the boiling range is 200–300°C, and the average molecular weight is 150–400 g/mol.
2.1.2 Experimental simulated water
The experimental displacement solution is distilled water, and methyl blue dye is used to dye it blue. The viscosity of distilled water is 1 mPa·s, the density is 1 g/cm3, the freezing point is 0°C, the boiling point is 100°C, and the molecular weight is 18 g/mol.
2.2 Microfluidic model
2.2.1 Microscopic visual model design and production
As shown in Figure 1a, the cast thin section photos of the typical well C1 are selected as the reference unit of pores and throats, and the permeability level is 2,000 mD. The rock skeleton and pore throat are binarized, and the pore throat is extracted as shown in Figure 1b. Micro-glass etching was performed, and the microfluidic model is shown in Figure 1c.
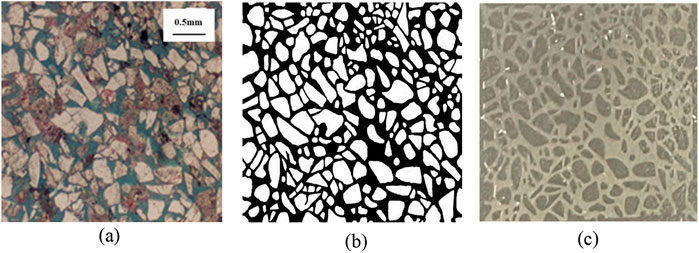
Figure 1. Model selection and production process. (a) Typical well-casting thin sections. (b) Pore throat extraction diagram. (c) Microfluidic model.
According to the experimental equipment and technical requirements and the limitation of glass etching technology, the size of the microfluidic model is designed as shown in Figure 2.
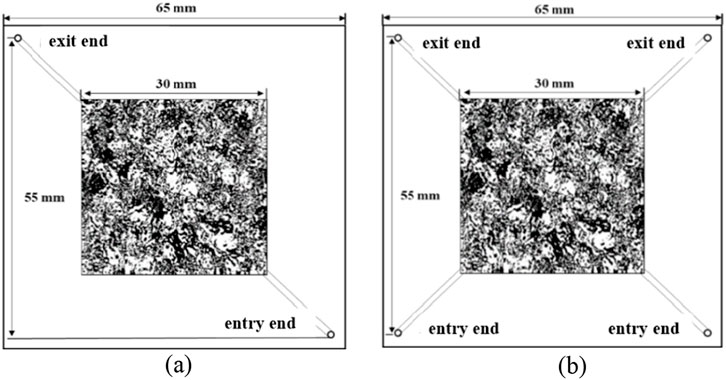
Figure 2. Dimension of microfluidic model. (a) Diagonal injection-production model. (b) Change the injection-production direction model.
2.2.2 Analysis of model pore throat characteristics
In the process of model design and production, the pore throat characteristics and size distribution of the model may have errors with the real core. The pore throat characteristics of the etched microfluidic model were analyzed by Avizo software.
The pore equivalent radius distribution and throat width distribution of the homogeneous model are shown in Figure 3. The pore equivalent radius of the homogeneous model ranges from 0.01 mm to 0.78 mm. The concentrated distribution range of aperture is 0.02–0.28 mm. The throat width is concentrated in the range of 0.02–0.09 mm, and the average throat width is 0.05 mm. The pore throat radius distribution of the homogeneous model is relatively concentrated, showing a non-normal distribution, and the heterogeneity of the model is weak. The micro-etched glass model designed and manufactured in this study is similar to the real core parameters, and the error is less than 10%. It is reliable and feasible to use this model for physical simulation experiments.
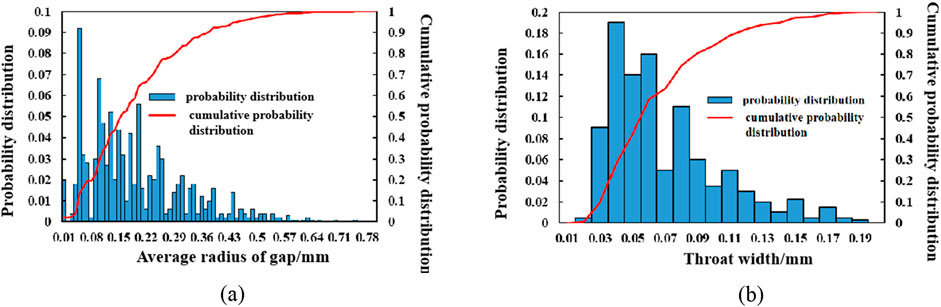
Figure 3. Pore and throat characterization of the homogeneous model. (a) Distribution of pore equivalent radius. (b) Throat width distribution.
2.3 Experimental platform construction
The experimental equipment mainly includes a vertical single-cylinder pump, a high-pressure intermediate container group, a visual clamping kettle, a high-precision microscope, a vacuum pump, and a display. Using the above equipment to build a full-field microscopic physical simulation experiment platform, a series of experimental processes can be realized, such as model saturated oil, water flooding, real-time observation, and recording. The schematic diagram of the experimental platform is shown in Figure 4. The experimental platform is mainly composed of three parts: a fluid injection system, a microscopic water flooding simulation system, and an image acquisition system. The fluid injection system mainly includes a vertical single-cylinder pump, an air compressor, and an intermediate container group. The main functions are to control the type of injected fluid, injection speed, and pressure. The microscopic water flooding simulation system mainly includes a high-pressure visual holding kettle and a microfluidic model. The main functions are: simulating the saturated oil and water flooding of the microscopic glass model. The image acquisition system mainly includes a high-precision microscope, a high-speed motion capture camera, and a computer. The main functions are real-time observation and recording of fluid dynamics occurring in microfluidic models.
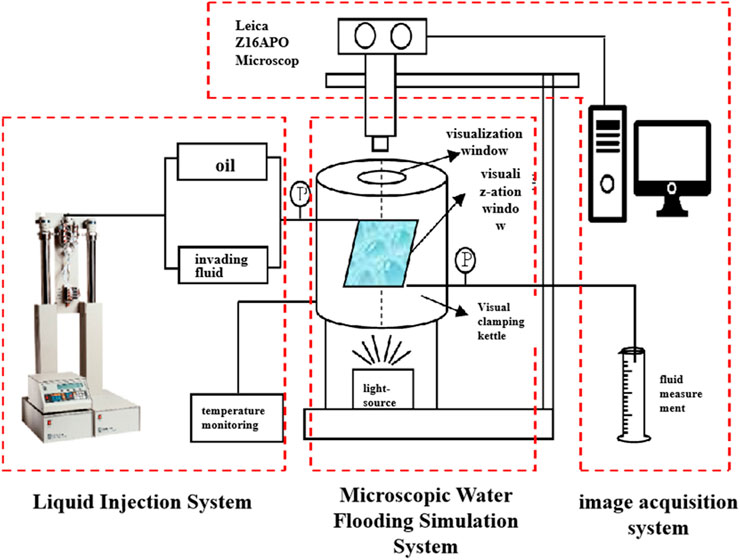
Figure 4. Panoramic view microscopic waterflooding physics simulation experiment platform.
3 Experimental design data and methods
This section may be divided by subheadings. It should provide a concise and precise description of the experimental results, their interpretation, as well as the experimental conclusions that can be drawn.
3.1 Design of experimental data scheme
3.1.1 Water drive production degree
The sweep efficiency and oil displacement efficiency of such narrow channel reservoirs are high, but the recovery degree is low. The recovery degree predicted based on the traditional water flooding sweep coefficient is not consistent with the actual situation. The formula for calculating the degree of recovery is shown in Equation 2, where ES is the sweep coefficient and ED is the oil displacement efficiency. The formula for the sweep coefficient is shown in Equation 1.
Vw: Reservoir volume affected by displacement agent, Vr: Total effective volume of reservoir.
This study evaluates and classifies the utilization degree of the area within the affected area, puts forward the concept of water-driven utilization degree, and conducts targeted research on the types of remaining oil and development methods under different utilization degrees. According to the meaning of the degree of recovery, the ratio of the amount of crude oil produced to the original geological reserves of the reservoir is shown in Equation 3. By extending the calculation formula of recovery degree, it is proposed that the recovery degree of narrow channel reservoir = sweep efficiency × producing degree × oil displacement efficiency. The sweep efficiency can reflect the influence of water flooding on the production of crude oil from the macro scale. The producing degree and oil displacement efficiency describe the production of crude oil in the range of water flooding from the micro-scale.
Among them,
In Equation 2, Np is the cumulative oil production of the reservoir, m3; N is the original geological reserves of the reservoir,m3; Vs is the reservoir producing volume, m3; V is the total volume of the reservoir, m3;
The concept of utilization degree (EC) is introduced, such as Equations 4, 5. The producing degree represents the oil-water saturation in the water flooding range, which has the meaning of oil-water relative flow capacity (mobility ratio). It refers to the difficulty of passive use of crude oil. The reservoir is divided into four intervals by using the oil-water mobility ratio: non, weak, medium, and strong producing areas.
The relative permeability curve and oil-water mobility ratio curve of the BZ reservoir are shown in Figures 5, 6, respectively, where the initial water saturation is Swi = 0.34, irreducible oil saturation Sor = 0.15.
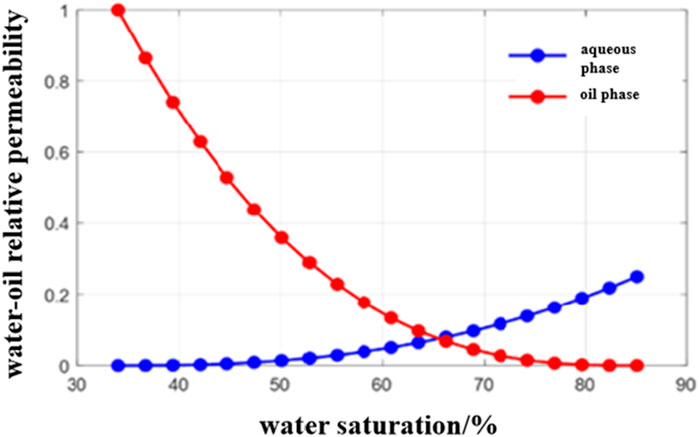
Figure 5. Oil-water relative permeability curves.
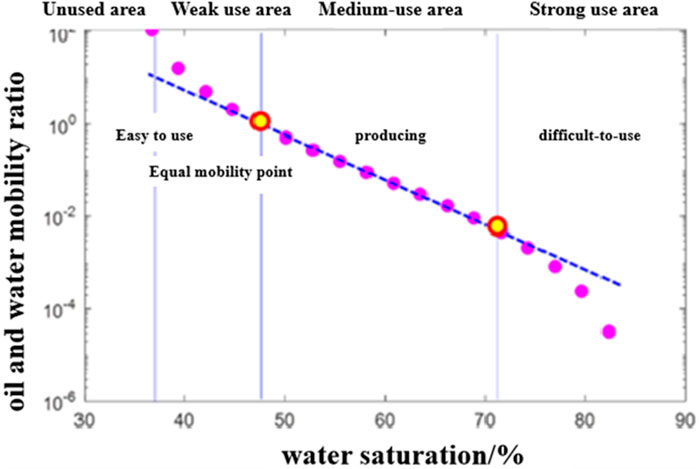
Figure 6. Oil-water mobility ratio curve.
Combined with the oil-water two-phase mobility ratio curve, the discriminant standard of water drive degree zoning suitable for BZ narrow channel reservoir is established, as shown in Table 1.
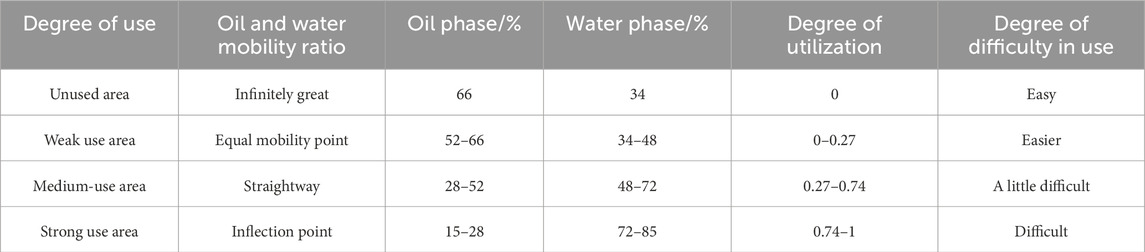
Table 1. Classification criteria of mobilization degree in BZ narrow channel reservoir.
The concept of zonal production is used to quantitatively characterize the production degree of each area in the water flooding affected area of the reservoir at different times, such as Equation 6. Its development significance is the ratio of the reservoir volume to the total reservoir volume in the water flooding affected to a specific saturation interval at a certain time.
In the formula, dx, dy, dz are the length, width, and height of the model grid respectively. Is the total grid number of the model.
3.1.2 Conceptual design
To clarify the microscopic water flooding characteristics of narrow channel reservoirs, the types of microscopic remaining oil, the distribution of remaining oil under different utilization degrees, and different potential tapping measures, seven sets of microfluidic experiments were designed in this study. According to the purpose of the study, it can be divided into the following two categories.
The first type of experiment is the basic experiment. Based on the basic scheme, the microscopic water flooding characteristics, microscopic remaining oil types, and their evolution process are explored. The specific experimental parameters are shown in Table 2. The second type of experiment is the exploration experiment of remaining oil enrichment law under different producing degrees of narrow channel reservoirs. Based on the concept of water drive degree proposed above, the narrow channel reservoir model is divided into four areas, namely, unused area, weak use area, and strong use area. The reservoir partition diagram is shown in Figure 7. In this type of experiment, by understanding the main remaining oil types under the weak/medium/strong producing area of a narrow channel reservoir, the development plan of weak/medium/strong producing area is adjusted respectively, to clarify the best way to tap the potential of remaining oil under different producing degree of narrow channel reservoir.

Table 2. Parameters of type I microfluidic experiments.
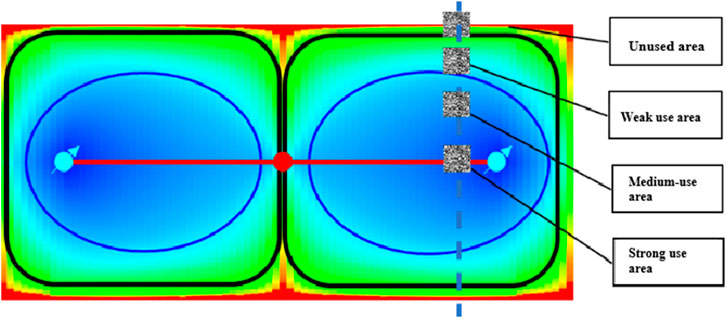
Figure 7. Classification of waterflooding mobilization degree in narrow channel reservoir.
Based on the investigation of the development adjustment methods of narrow channel reservoirs, the main measures taken by the same type of reservoirs in the current water flooding development stage are to optimize the injection-production intensity and improve the good pattern. At the micro level, optimizing the injection-production intensity is reflected in changing the seepage velocity of the fluid in the reservoir, and improving the well pattern is reflected in changing the direction of the fluid flow in the reservoir. The schematic diagrams are shown in Figures 8, 9, respectively. The specific experimental parameters are shown in Table 3. Due to the cross-scale problem, the microscopic model is difficult to reflect the weak/medium/strong use area at the end of water flooding. In this study, different water saturations of the model were used as weak/medium/strong producing areas at the end of water flooding. On this basis, experiments such as tapping the potential of remaining oil were carried out.
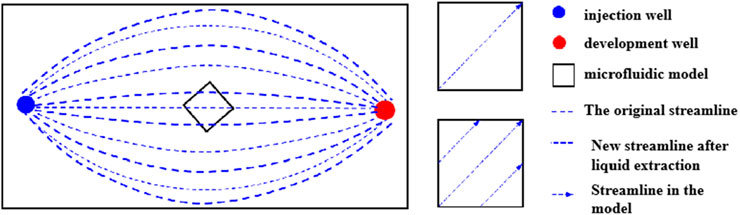
Figure 8. Schematic of increasing fluid production in the narrow channel reservoir model.
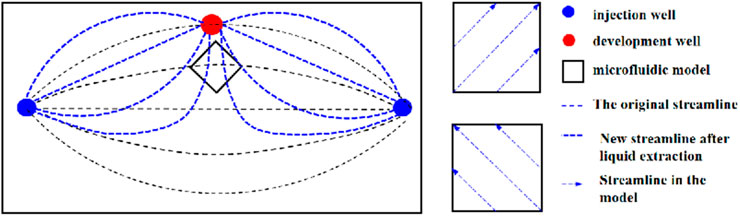
Figure 9. Schematic of improving well network in the narrow channel reservoir model.
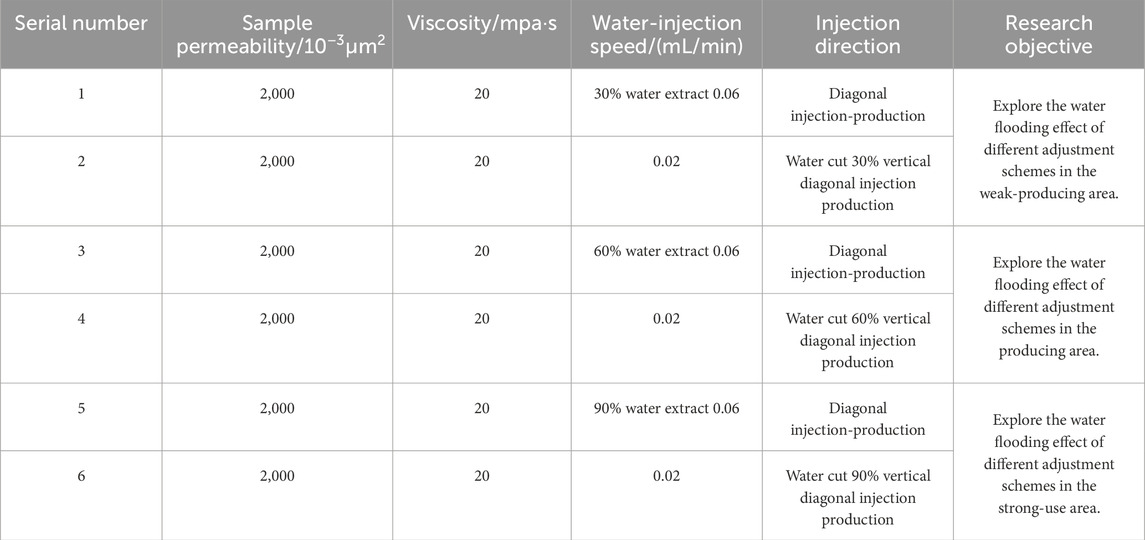
Table 3. Parameters of type III microfluidic experiments.
3.2 Experimental method
3.2.1 Experimental steps
The specific steps of the microscopic physical simulation experiment of the narrow channel reservoir are as follows:
(1) Pipeline design and connection: According to the experimental process, several pipelines with different lengths are made, and different devices are connected by several connectors and control valves to form a complete path.
(2) Preparation and assembly of experimental oil: According to the experimental scheme, the compound oil with a viscosity of 150 mPa·s was used in this experiment. The configuration ratio of kerosene and engine oil was 4:7. The simulated oil was dyed and filtered with Sudan III biological dye, and the simulated oil was assembled into an intermediate container.
(3) Preparation and assembly of experimental water: An appropriate volume of distilled water was poured, methyl blue dye was used for dyeing and filtration, and the dyed simulated water was assembled into the corresponding intermediate container.
(4) Assembly of hydrophobic agent and anhydrous ethanol: The appropriate volume of hydrophobic agent (N-ethyl-N-benzylaniline) and anhydrous ethanol were poured, filtered, and assembled into the corresponding intermediate containers.
(5) Etching glass model assembly: The etched glass model used in the experiment was assembled into a visual gripper. The height and magnification of the microscope eyepiece were adjusted to make the whole area of the etched area of the glass model appear in the field of view. The image saturation, contrast, and gamma value of the image acquisition system were adjusted to make the model outline and color clear.
(6) Saturated hydrophobic agent: The model was saturated at a speed of 0.1 mL/min, and the wettability of the model was fully changed after standing for 24 h so that the pore throat wall in the model was lipophilic.
(7) Saturated oil: The model is saturated with oil at a speed of 0.02 mL/min. When the model is filled with oil and the outlet end has simulated oil outflow, the switch is turned off and the image acquisition system is used to take pictures.
(8) Water flooding: Open the camera of the image acquisition system and drive the model at a speed of 0.02 mL/min until the remaining oil in the model does not change and the water cut at the outlet end is 100%. Stop the water flooding, close the camera, and take global and local photos of the microscopic remaining oil.
(9) Model cleaning: Anhydrous ethanol and hydrophobic agents were used successively. The residual fluid in the model was displaced by a single-cylinder pump at a speed of 0.1 mL/min, and the pore throat of the model was cleaned for the next group of experiments.
3.2.2 Data processing method
In this study, an automatic identification and quantitative characterization method of microscopic remaining oil based on the region growing method is adopted to realize the segmentation and automatic identification of remaining oil, the calculation, and output of indexes. Firstly, based on the physical simulation experiment of microscopic remaining oil distribution, the oil-water distribution images of each stage in the water flooding process are obtained. According to the connectivity, occurrence state, occurrence position, adhesion perimeter ratio, length-width ratio, and geometric coefficient of the remaining oil in the image, the microscopic remaining oil is classified. The specific classification method is shown in the following. Then, the image obtained from the experiment is processed by grayscale, and the pore throat, rock skeleton, and oil/water are separated. After extracting all the remaining oil from the image, the remaining oil in the image is segmented by the region-growing method, that is, the pixels are classified according to the different gray levels of the pixels at the edge of the remaining oil in the image, to extract the single remaining oil. Finally, according to the classification standard, the segmented single remaining oil is classified, and the remaining oil saturation of each type is calculated, that is, the sum of the pixels of the remaining oil of the same type is divided by the total pixels of the pore throat. At the same time, the development indexes such as water saturation, recovery degree, and oil displacement efficiency are calculated and output (in this microscopic water flooding experiment, the water saturation, recovery degree, and oil displacement efficiency of the model are numerically equal).
4 Analysis of experimental results
4.1 Microscopic water flooding characteristics
4.1.1 Drive characteristic
The water flooding process of the basic experiment is shown in Figure 10. In the early stage of water flooding, the injected water is in a ribbon along the line between the injection and production ends. As the displacement progresses, the injected water diffuses along the main flow line to the unswept areas on both sides. After the water is seen at the outlet end, the swept area of the injected water almost covers the entire model. At the end of water flooding, the shape and content of remaining oil hardly change with the change of displacement multiples, and the water cut at the outlet end is close to 100%.
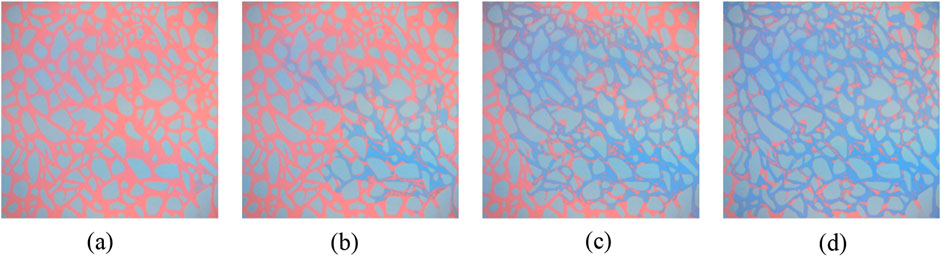
Figure 10. Waterflooding process of the base model. (a) Mmodel saturated oil. (b) Initial stage of water flooding. (c) Middle stage of water flooding. (d) Late-stage of water flooding.
4.1.2 Remaining oil classification
Based on the experimental results, the microscopic remaining oil can be divided into the following five types: bound sheet-like remaining oil and porous remaining oil, semi-bound film-like remaining oil, discrete strip-like remaining oil, and drop-like remaining oil. The typical morphology of different types of microscopic remaining oil is shown in Figure 11.
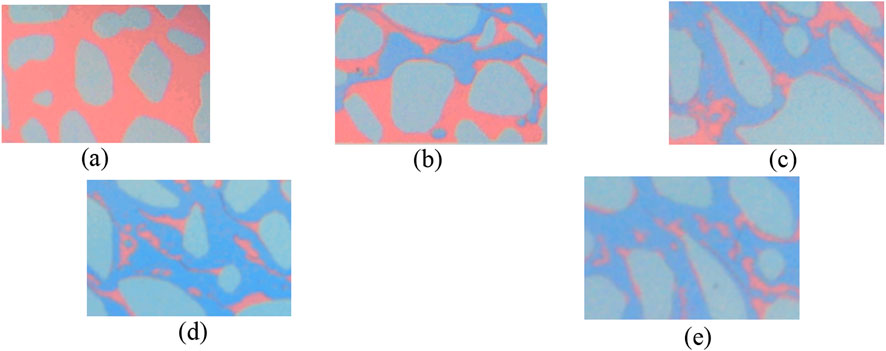
Figure 11. Morphology of different types of microscopic residual oil. (a) Flake-like remaining oil. (b) Porous remaining oil. (c) Membrane residual oil. (d) The banded remaining oil. (e) Droplet remaining oil.
The microscopic remaining oil is classified according to the attachment position of the remaining oil, the perimeter ratio of the remaining oil attached to the hole wall, the length-width ratio of the single remaining oil, the geometric coefficient, and the extension index. The specific classification criteria are shown in Table 4. Among them, the geometric coefficient is the ratio of the area of a single remaining oil to its boundary perimeter; the extension index is a new parameter defined when the region growth algorithm is used to segment the remaining oil in a single block. Its value is the ratio of the growth times of the remaining oil in a single block to the growth times of the entire pore throat.
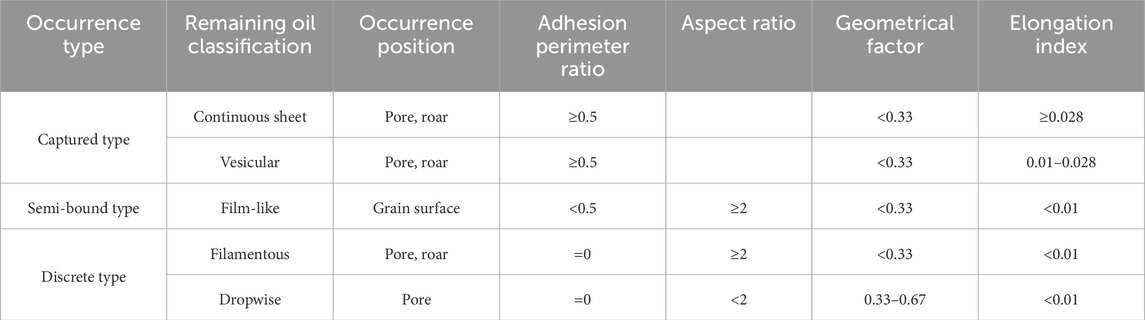
Table 4. Classification criteria of microscopic residual oil.
4.1.3 Evolution process of remaining oil
The water flooding process in the local area of the model is shown in Figure 12. The main types of remaining oil in each stage change with the change of displacement multiple, which is mainly reflected in the transformation from bound remaining oil to discrete remaining oil. The specific transformation process is as follows.
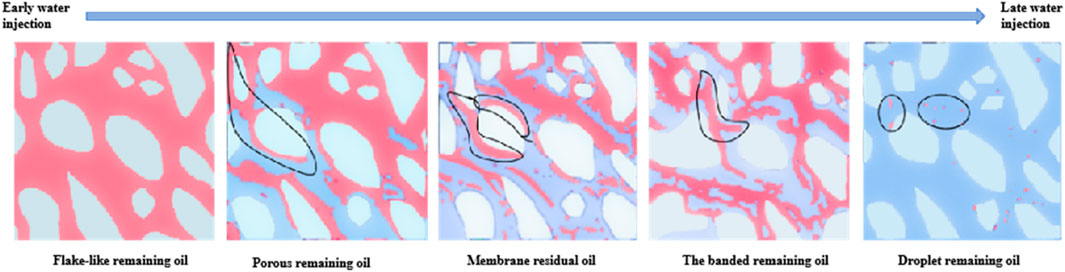
Figure 12. Evolution of microscopic residual oil.
4.2 Distribution law of microscopic remaining oil under different producing degrees
Based on the characteristics of water flooding development in narrow channel reservoirs, this paper puts forward the concept of water drive degree, aiming to refine the water drive area and find the remaining oil potential area that can further improve the recovery degree of the oilfield.
The glass model in the microscopic experiment only represents a point in the macroscopic reservoir, that is, each microscopic model can represent the water flooding state at different positions of the reservoir. When the water saturation of the model is less than 30%, it is considered that the model represents the weak producing area of the reservoir. When the water saturation of the model is between 30% and 60%, it is considered that the model represents the producing area in the reservoir. When the water saturation of the model is greater than 60%, it is considered that the model represents the strong producing area of the reservoir. The experimental results under different water-driven degrees are shown in Figure 13, and the proportion of different types of microscopic remaining oil is shown in Figure 14.
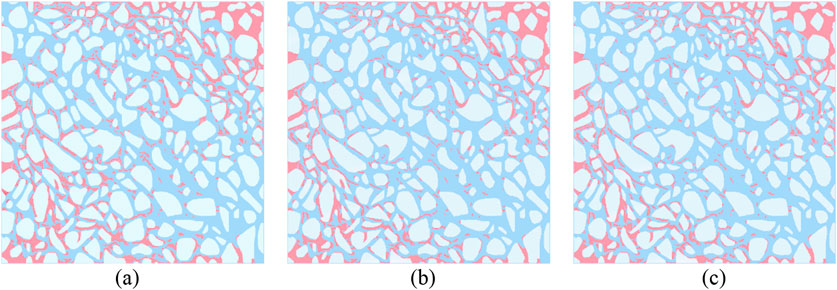
Figure 13. Residual oil distribution at different mobilization degrees. (a) Weak use area. (b) Centrally used area. (c) Forcible use zone.
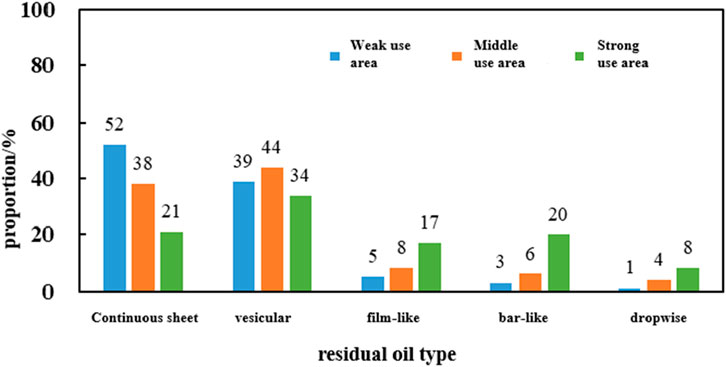
Figure 14. Percentage of different types of microscopic residual oil at different mobilization degrees.
The oil displacement efficiency in the weak producing area is 32%, and the remaining oil is dominated by continuous sheet remaining oil, accounting for 52%. The oil displacement efficiency of the middle producing area is 53%, and the remaining oil is mainly composed of continuous sheet and porous remaining oil, accounting for 38% and 44% respectively. The oil displacement efficiency of the strong use area is 67%, and the remaining oil is dominated by porous, membranous, and banded remaining oil, accounting for 71%.
4.3 Micro remaining oil potential tapping direction under different producing degrees
4.3.1 Weak use area
The remaining oil in the weak-producing area is mainly composed of contiguous remaining oil. The distribution of remaining oil after the adjustment of the potential tapping scheme is shown in Figure 15, and the saturation changes of various types of remaining oil are shown in Figure 16. To improve the water injection speed, to a certain extent, the remaining oil on both sides of the main flow line is used, but there is still a small amount of continuous sheet remaining oil, porous and banded remaining oil increased slightly, and the oil displacement efficiency is 9.2% higher than that of the original scheme. By changing the direction of liquid flow, water flooding is carried out in the direction perpendicular to the original injection-production direction, which greatly improves the continuous remaining oil bound to the pore throat in the non-mainstream line area. After adjustment, the remaining oil is mainly stripped and film-like, and the oil displacement efficiency is improved by 14.6% by changing the direction of liquid flow.
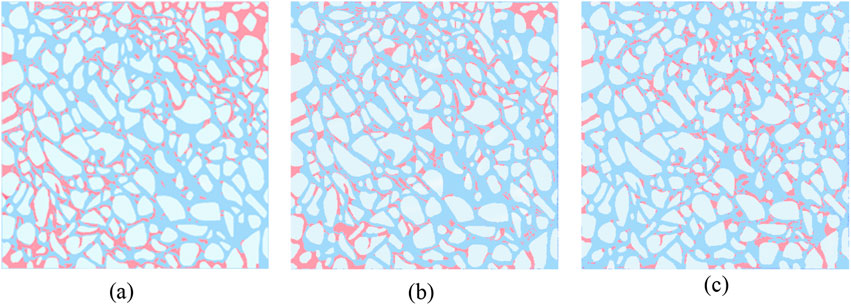
Figure 15. Residual oil distribution of different adjustment programs at weak mobilization area. (a) Original program. (b) Enhanced water injection rate. (c) Changing the direction of liquid flow.
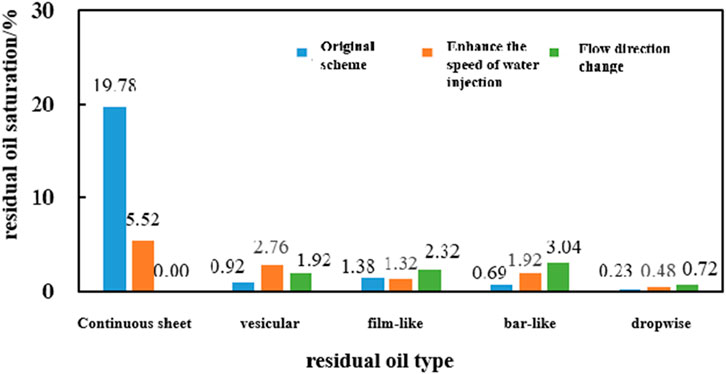
Figure 16. Different types of microscopic residual oil saturation of different adjustment programs at weak mobilization area.
The remaining oil in the middle producing area is mainly composed of continuous sheets and porous remaining oil. The remaining oil distribution after the adjustment of the potential tapping scheme is shown in Figure 17, and the change of remaining oil saturation of each type is shown in Figure 18. On the one hand, the increase of oil displacement power expands the producing area of crude oil, on the other hand, it peels off the bound continuous sheet, porous and semi-bound membrane residual oil, and the saturation of discrete strip and drip residual oil increases. The enhanced water injection speed increases the oil displacement efficiency by 7.9% compared with the original scheme. By changing the direction of the fluid flow, the remaining oil in the unused area is utilized, the type and location of the remaining oil in the model are changed, and the remaining oil is transformed into the porous, membrane and banded remaining oil. The remaining oil migrates from the edge of the model to the middle, and changing the direction of the fluid flow increases the oil displacement efficiency by 8.6% compared with the original scheme.
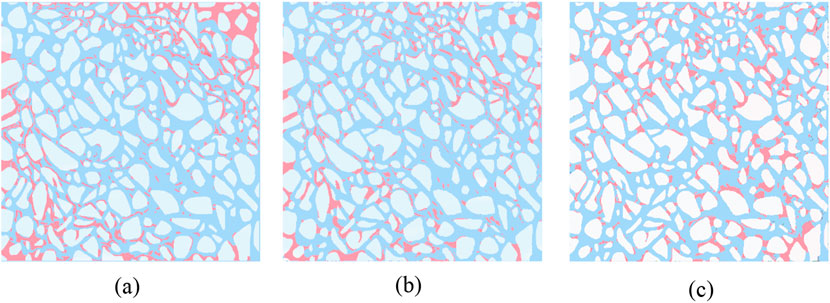
Figure 17. Residual oil distribution of different adjustment programs at medium mobilization area. (a) Original program. (b) Enhanced water injection rate. (c) Changing the direction of liquid flow.
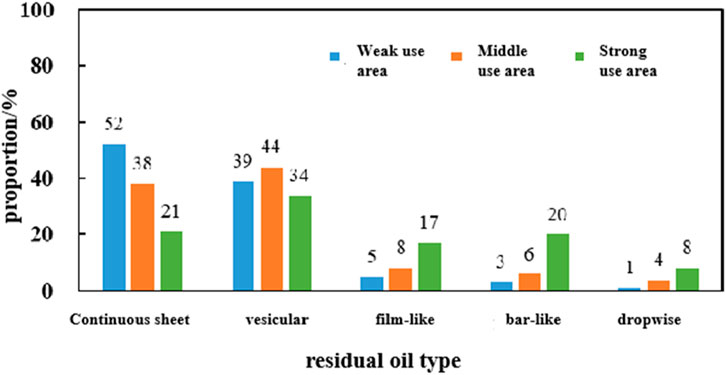
Figure 18. Different types of microscopic residual oil saturation of different adjustment programs at medium mobilization area.
4.3.2 Strong use area
The saturation of remaining oil is low, and most of the crude oil has been displaced by the injected water. There is still a small amount of continuous and porous remaining oil that is difficult to use at the edge of the model. The remaining oil distribution after the adjustment of the original model and the implementation of the potential tapping scheme in the region is shown in Figure 19, and the change of each type of remaining oil saturation is shown in Figure 20. With the increase of water injection rate, the produced area of crude oil in the model increases by a small margin, mainly relying on the high-speed scouring of injected water to separate and peel off porous and membrane residual oil. Compared with the original scheme, the oil displacement efficiency is increased by 6.4%. By changing the direction of liquid flow, there are already dominant channels of injected water in the model, and there are difficult-to-produce film-like, strip-like, and drop-like remaining oil in the pore throat. Changing the displacement direction changes the flow field so that this part of the remaining oil can be displaced. Compared with the original scheme, the oil displacement efficiency is increased by 4.2% by changing the flow direction.
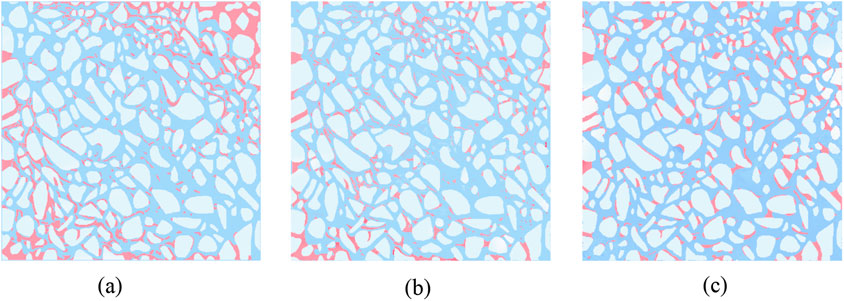
Figure 19. Residual oil distribution of different adjustment programs at strong mobilization area. (a) Original program. (b) Enhanced water injection rate. (c) Changing the direction of liquid flow.
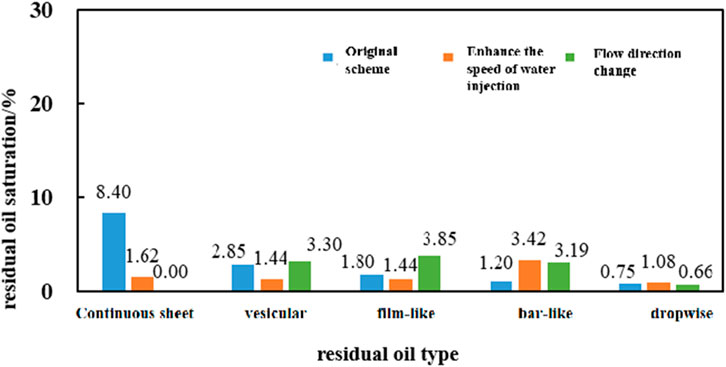
Figure 20. Different types of microscopic residual oil saturation of different adjustment programs at strong mobilization area.
5 Conclusions and suggestions
To explore the micro water flooding characteristics, the distribution of remaining oil, and the direction of tapping potential in the process of water flooding in narrow channel reservoirs, this paper carries out the physical simulation experiment of micro water flooding in narrow channel reservoirs. Through the analysis of the experimental results, the following conclusions can be drawn:
(1) Microscopic water flooding mechanism of narrow channel reservoir: In the process of water flooding, the injected water is filiform along the line between injection and production wells, and the injected water diffuses along the main streamline to both sides after the water is seen at the3 outlet end.
(2) Types and evolution rules of microscopic remaining oil: There are five types of remaining oil, including continuous sheet, porous, film, strip, and drop. The evolution rules of remaining oil in the process of water flooding are the same as in the above order.
(3) The main types of remaining oil are different under different producing degrees. The weak producing area is mainly composed of continuous sheet remaining oil, the middle producing area is mainly composed of porous and continuous sheet remaining oil, and the strong producing area is mainly composed of porous and discrete film, strip, and drip remaining oil. With the increase in production degree, it is more difficult to tap the potential of remaining oil.
(4) Different residual oil potential tapping measures have different potential tapping effects in weak/medium/strong producing areas. The residual oil in the weak producing area is mainly continuous residual oil, and the potential tapping effect is better by changing the direction of liquid flow. The remaining oil in the middle producing area is dominated by porous and continuous residual oil, and the effect of changing the direction of liquid flow is slightly better than that of strengthening the water injection rate. The remaining oil in the strong producing area is mainly porous, membranous, and banded remaining oil, and the effect of strengthening water injection intensity is better.
Data availability statement
The original contributions presented in the study are included in the article/supplementary material, further inquiries can be directed to the corresponding author.
Author contributions
PJ: Writing – original draft. QS: Writing – review and editing. HF: Writing – review and editing. YL: Writing – review and editing. BL: Writing – review and editing.
Funding
The author(s) declare that financial support was received for the research and/or publication of this article. We acknowledge that this study was supported by the National Natural Science Foundation of China (NSFC) top-level project, Research on fluid transport mechanism and seepage mathematical model of shale reservoirs injected with CO2 in multi-scale pore-seam space (No. 52474057).
Conflict of interest
Author QS was employed by CNOOC Tianjin Branch. Author YL was employed by South Sulige Operating Company.
The remaining authors declare that the research was conducted in the absence of any commercial or financial relationships that could be construed as a potential conflict of interest.
Generative AI statement
The author(s) declare that no Generative AI was used in the creation of this manuscript.
Publisher’s note
All claims expressed in this article are solely those of the authors and do not necessarily represent those of their affiliated organizations, or those of the publisher, the editors and the reviewers. Any product that may be evaluated in this article, or claim that may be made by its manufacturer, is not guaranteed or endorsed by the publisher.
References
Al-Dujaili, A. N., Shabani, M., and Al-Jawad, M. S. (2023). Effect of heterogeneity on recovery factor for carbonate reservoirs. A case study for mishrif formation in west qurna oilfield, southern Iraq. Iraqi J. Chem. Petroleum Eng. 24 (3), 103–111. doi:10.31699/IJCPE.2023.3.10
Alizadeh, A. H., Khishvand, M., Ioannidis, M. A., and Piri, M. (2014). Multi-scale experimental study of carbonated water injection: an effective process for mobilization and recovery of trapped oil. Fuel 132, 219–235. doi:10.1016/j.fuel.2014.04.080
Chatenever, A., and Calhoun, J. J. C. (1952). Visual examinations of fluid behavior in porous media - Part I. J. Petroleum Technol. 4 (06), 149–156. doi:10.2118/135-G
Chuan, W., Hanqiao, J., and Mengqi, M. (2020). Study of the variation of pore-scale residual oil flow based on a microfluidic model. Petroleum Sci. Bull. 5 (03), 376–391. doi:10.3969/j.issn.2096-1693.2020.03.032
Haochuan, L., Haiyan, Z., and Rong, F. (2018). Analysis of water injection capacity in narrow channel reservoirs of Bohai area. Offshore Oil. 38 (01), 46–49. doi:10.3969/j.issn.1008-2336.2018.01.046
Hongfu, S., Yifan, H., and Hui, L. (2017). Research on long-term stability of cavern with slim spacing double-well solution mining technology. J. Chongqing Univ. Sci. Technol. Nat. Sci. Ed. 19 (05), 48–51. doi:10.19406/j.cnki.cqkjxyxbzkb.2017.05.011
Kokkinos, N., Nkagbu, D., Marmanis, D., Dermentzis, K. I., and Maliaris, G. (2022). Evolution of unconventional hydrocarbons: past, present, future and environmental FootPrint. J. Eng. Sci. Technol. Rev. 15, 15–24. doi:10.25103/jestr.154.03
Lida, W. (2022). Microfluidic dynamic evaluation and analysis of oil-water flow based on OpenCV. Beijing: China University of Petroleum. doi:10.27643/d.cnki.gsybu.2022.001630
Pengxiao, S., Hui, C., and Xiaoming, C. (2023). Oil-water occurrence law in typical high-permeability sandstone reservoirs in the Bohai sea based on microfluidic modeling. Special Oil Gas Reservoirs 30 (06), 120–127. doi:10.3969/i.issn.1006-6535.2023.06.016
Qiang, S., Haiyan, Z., and Hongfu, S. (2019). Research on water production rule of heavy oil reservoirs in narrow channels. Reserv. Eval. Dev. 9 (02), 21–24. doi:10.13809/j.cnki.cn32-1825/te.2019.02.005
Ren, G., Abedini, A., and Yang, H. (2020). Visualization of flowback aid mechanisms utilizing a microfluidic pore-scale device. Lafayette: SPE International Conference and Exhibition on Formation Damage Control.
Rui, W., Hong, Z., and Jian, W. (2023). Analysis of the producing status of microscopic remaining oil in interlayer heterogeneous reservoirs by different injection-production methods. Petroleum Geol. Oilfield Dev. Daqing 42 (05), 82–89. doi:10.19597/j.issn.1000-3754.202208042
Shangping, G., Yanzhang, H., and Juan, Z. (1986). Microscopic research of the flow of physical chemistry fluid through porous media. Chin. J. Theor. Appl. Mech. 18 (s1), 45–50.
Shilov, E. D., Zakirov, T. R., and Khayrullin, M. M. (2020). Methods for studying two-phase flows in porous media: numerical simulation and experiments on microfluidics chips. Virtual SPE Russ. Pet. Technol. Conf. doi:10.2118/202022-MS
Tileuberdi, N., Al-Dujaili, A. N., Mashrapova, M., Togizov, K., Sanatbekov, M., and Yergali, A. (2024). Optimizing oil recovery by low-pressure nitrogen injection: an experiment case study. ES Mater. Manuf. 25, 1189. doi:10.30919/esmm1189
Xu, K., Liang, T., Zhu, P., Qi, P., Lu, J., Huh, C., et al. (2017). A 2.5-D glass micromodel for investigation of multi-phase flow in porous media. Lab Chip 17 (4), 640–646. doi:10.1039/C6LC01476C
Keywords: narrow-channel reservoirs, microfluidic control, microscopic residual oil, degree of water-driven utilization, dredging direction
Citation: Jia P, Sun Q, Feng H, Li Y and Liu B (2025) Experimental study on microscopic residual oil distribution and dredging direction of water-driven zoned utilization in narrow-channel reservoirs. Front. Earth Sci. 13:1514985. doi: 10.3389/feart.2025.1514985
Received: 22 October 2024; Accepted: 26 May 2025;
Published: 17 July 2025.
Edited by:
Rakesh Chandra Joshi, Amity University, IndiaReviewed by:
Nikolaos C. Kokkinos, Democritus University of Thrace, GreeceHao Xiong, China National Offshore Oil Corporation, China
Zhongyi Xu, SINOPEC Petroleum Exploration and Production Research Institute, China
Ahmed AL-Dujaili, Amirkabir University of Technology, Iran
Copyright © 2025 Jia, Sun, Feng, Li and Liu. This is an open-access article distributed under the terms of the Creative Commons Attribution License (CC BY). The use, distribution or reproduction in other forums is permitted, provided the original author(s) and the copyright owner(s) are credited and that the original publication in this journal is cited, in accordance with accepted academic practice. No use, distribution or reproduction is permitted which does not comply with these terms.
*Correspondence: Pin Jia, ZW1haWxAdW5pLmVkdQ==, amlhcGluMTk5MEAxNjMuY29t