 Hao Zhou
 Shanping Li
 Yadong Wang2
- 1School of Geological Engineering, Qinghai University, Xining, China
- 2Qinghai Key Laboratory of Geological Processes and Mineral Resources in Northern Qinghai-Tibet Plateau, Qinghai Institute of Geological Survey, Xining, China
With the increasingly difficult situation of mineral resources in various countries around the world, there is an urgent need for effective deep. Exploration techniques and methods to expand mineral resources and enhance the survival capacity of mines. The traditional artificial source electromagnetic method has limitations in exploration depth, accuracy, and other aspects. In contrast, the induced polarization ladder, as an effective electromagnetic (EM) exploration method, has the characteristics of high depth penetration, high accuracy, and strong adaptability. The Sanjiaodiang gold mine is located in the middle section of the Saishiteng Mountain on the northern edge of the Qaidam Basin in the northern part of the Qinghai Tibet Plateau. The mining area exhibits two main types of gold mineralization, namely, quartz vein type and alteration mylonite type, indicating multiple periods and stages of mineralization. The pyritic monzonitic granite and gabbro in the SB2 and SB4 alteration zones are characterized by high resistance and polarization, while ore-bearing geological bodies such as limonized granodiorite and strongly limonized gabbro display elevated polarization levels, potentially leading to abnormal polarization phenomena. Two induced polarization anomalies were defined based on apparent resistivity and apparent polarization characteristics. These anomalies primarily result from tectonic alteration zones. Following subsequent geochemical exploration and engineering verification, 12 tectonic alteration zones and over 40 gold mine (chemical) bodies have been delineated. Therefore, induced polarization intermediate gradient anomaly proves to be a promising prospecting method in gold mine exploration. The induced polarization gradient measurement method has played a good demonstration role in exploring quartz vein type and altered mylonite-type gold deposits worldwide. Induced polarization gradient has been widely used in the exploration of metal deposits in many countries due to its advantages and will play a more significant role in the search for hidden metal deposits.
1 Introduction
In recent years, the exploration of deep concealed deposits and peripheral ore bodies has become the most effective approach to expanding production mineral resources and enhancing survival capability (Harrison and Urosevic, 2012a). With the increasing depth of mineral exploration, the challenge of achieving breakthroughs in mining is becoming increasingly formidable. Traditional artificial electromagnetic methods have limitations in data collection (Zhou N et al., 2024; Aizebeokhai, 2014a). The traditional controlled source electromagnetic method (CSEM) exhibits limitations in data acquisition, and it encounters numerous adverse factors during the deep ore prospecting and exploration processes (Teng et al., 2007). In response to these issues, both the industry and academia have continuously improved electromagnetic (EM) methods, rapidly leading to the development of advanced EM equipment such as the controlled-source audio-frequency magnetotelluric (CSAMT) method (Goldstein, 1971; An and Di, 2016), Domain Induced Polarization Method (TDIP) (Yatini, 2013; Yatini et al., 2016), Multi-channel transient electromagnetic (MTEM) method (Wright et al., 2001; Di et al., 2013), long-offset transient electromagnetic (LOTEM) (Strack et al., 1990), multi-channel transient electromagnetic (MTEM) method (Wright et al., 2001; An and Di. 2016), short-offset transient electromagnetic (SOTEM) (Xue et al., 2013), and ground line transient electromagnetic method (Guoqiang X et al., 2021), among others. These methods have the characteristics of high depth penetration, high accuracy, and strong adaptability, which continuously improve the efficiency of EM; Widely used for exploration and 3D inversion models of terrestrial and marine mineral resources (Constable et al., 1987; Chernicoff et al., 2002; Sheard, 2005; Abubakar and Habashy, 2005; Key, 2009; Linfoot et al., 2011; Harrison and Urosevic, 2012b; Puzyrev et al., 2013; Nakayama and Saito, 2014; Smith, R., 2014; Guo et al., 2020). Geophysical exploration techniques are extensively employed in deep mineral exploration. The method of induced polarization intermediate gradient is an exploratory technique that utilizes artificial underground direct current electricity as an excitation condition to investigate the polarization effect of various geological bodies and identify the distribution of subsurface rocks (minerals) (Yang et al., 2017; Zhang et al., 2020). It possesses the characteristics of high-emission power and can output large currents to the underground, thus improving exploration depth (Qi et al., 2008; Zhang et al., 2010; Liu et al., 2003). This method is crucial in detecting abnormal information caused by polarized bodies within a specific depth range (Zhu, 2017). It has been widely applied with favorable outcomes in multi-metal mineral exploration (Cui and Wang, 2009; Luo, 2011; Chen, 2013; Wu et al., 2006; Wang et al., 2019). In recent years, the large-scale Tanjianshan gold deposit, medium-sized Qinglonggou gold-polymetallic deposit, small-sized Yeluotuoquan gold deposit, and Qianmeiling gold mine have been discovered within the Sertengshan-AErCiTuoShan metallogenic subzone (Cui and Wang, 2009; Duan et al., 2011; Xu, 2011; HuGe et al., 2018). These deposits are primarily controlled by northwest-southeast trending tectonic zones. Ore enrichment occurs along brittle-ductile fractures and fold inflexion points, resulting in structural alteration rock types, ductile shear zone types, and quartz vein-type gold deposits that exhibit multiple periods and stages of mineralization characteristics (Feng et al., 2002). Among them, the Sanjiaoding gold deposit is a newly discovered one on the north margin of the Qaidam Basin. It is a “linglong-style” gold deposit within an Ordovician granite diorite body (Lu et al., 2021; Bao et al., 2021; Wang et al., 2015). In this study area at the Sanjiaoding mine site, high-power induced polarization intermediate gradient profiling measurements were conducted to search for anomalies associated with tectonic alteration zones linked to gold deposits, providing a basis for deep exploration of the mining area and prospecting of adjacent areas.
2 Geological background
The convergence of the Indian continent and the Eurasian continent is the most significant tectonic event in the world, accompanied by the opening and closing of the ocean and the collision and orogeny of land plates, resulting in vigorous magmatic and tectonic activity in the region. China is located at the intersection of the Eurasian Plate, Pacific Plate, and Indian Ocean Plate with complex geological structures and unique mineralization environments, forming a large number of large, medium, and small gold deposits (Figure 1A). The formation of gold deposits in China is strictly controlled by tectonic units, geological evolution, and mineralization construction, showing a concentrated distribution characteristic (Yu et al., 1998). The types and classification schemes of gold deposits are diverse (Groves et al., 1998; Goldfarb et al., 2001; Large et al., 2011; Lubben et al., 2012); In terms of global mineralization domains, the pre Cambrian metamorphic rock series widely distributed in the ancient uplift areas of the ancient Asian mineralization domain have developed gold deposits such as Jiapigou and Jinchangyu (Wang et al., 2025). The northern part of the Qinghai-Xizang Plateau is the product of orogenic accretion and collisional orogenesis of the Proto-Tethys Ocean, and the northern margin of the Qaidam Basin structural belt is a significant component of the Early Paleozoic orogenic system in the northern part of the Qinghai-Tibet Plateau (Searle M P et al., 1985). The Sanjiaoding gold mine is located in the central part of Seshten Mountain area on the northern margin of the Qaidam Basin. Sertengshan extends northwestward, spanning approximately 100 km in length and 20 km in width (Figure 1). Geologically, this area belongs to the combined zone of the northern margin of the Qaidam Basin within the Qinling-Qilian-Kunlun orogenic belt. The mineralization zone corresponds to the Sertengshan subzone of the Sertengshan-AErCiTuoShan Pb-Zn-Au-W-Sn (Cu, Co., rare earth) metallogenic belt. The Saishiteng area on the north margin of the Qaidam Basin exhibits a significant occurrence of Early Paleozoic magmatic rocks, which provide crucial insights into the evolution of the Proto-Tethys Ocean. The Early Paleozoic is characterized by three distinct periods of magmatic activity at 514 Ma, 485–464 Ma, and 444–437 Ma (Wang et al., 2022). On the northern margin of the Qaidam Basin, widespread shallow metamorphic Tanjianshan Group and marine volcanic-sedimentary rocks comprise a suite of greenschist facies and strongly deformed lithologies (Zhu, 2011; Zhang et al., 2007). Within the Tanjianshan Group, there are Cambrian island arc tholeiites, calc-alkaline to alkaline transitional basalts, as well as N-MORB-like tholeiites and adakites (Wu, 2008). Notably, it is characterized by exposed Middle-Late Ordovician medium-acidic granite bodies (Zhang et al., 2016), with a predominance of the middle-late Caledonian medium-acidic, as well as bare intrusive rocks and secondary occurrence of the late Varissian medium-acidic granites (Qi et al., 2019). The Paleozoic granites are mainly distributed northwestward in areas such as Sanchagou, Sertengshan, and Tuanyushan. Rock types include syenogranite, monzogranite, and granodiorite (Wu et al., 2004). The Sanjiaoding area is characterized by the development of numerous acidic and basic dikes at various stages (Figure 2), which provide a rich source of materials for mineralization (Gao et al., 2019). Meanwhile, the gold ore body in the Sanjiaoding mining area primarily occurs within brittle fractures and ductile shear zones within the Middle Ordovician granodiorite body, serving as significant controlling factors for mineralization.
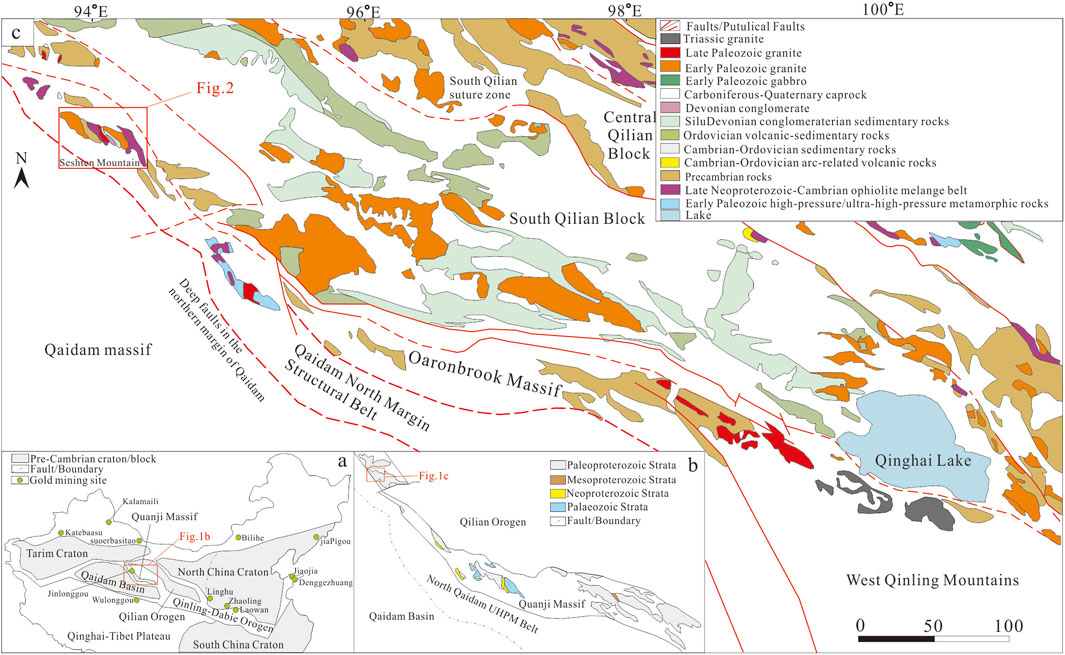
Figure 1. Geographical location of the Saishten Mountains [(a) Bi et al. (2022)] and geological map of the northern margin of Qaidam and its adjacent areas [(b), Fu et al. (2018)]. Geological sketch of Saishiteng Mountain area (c).
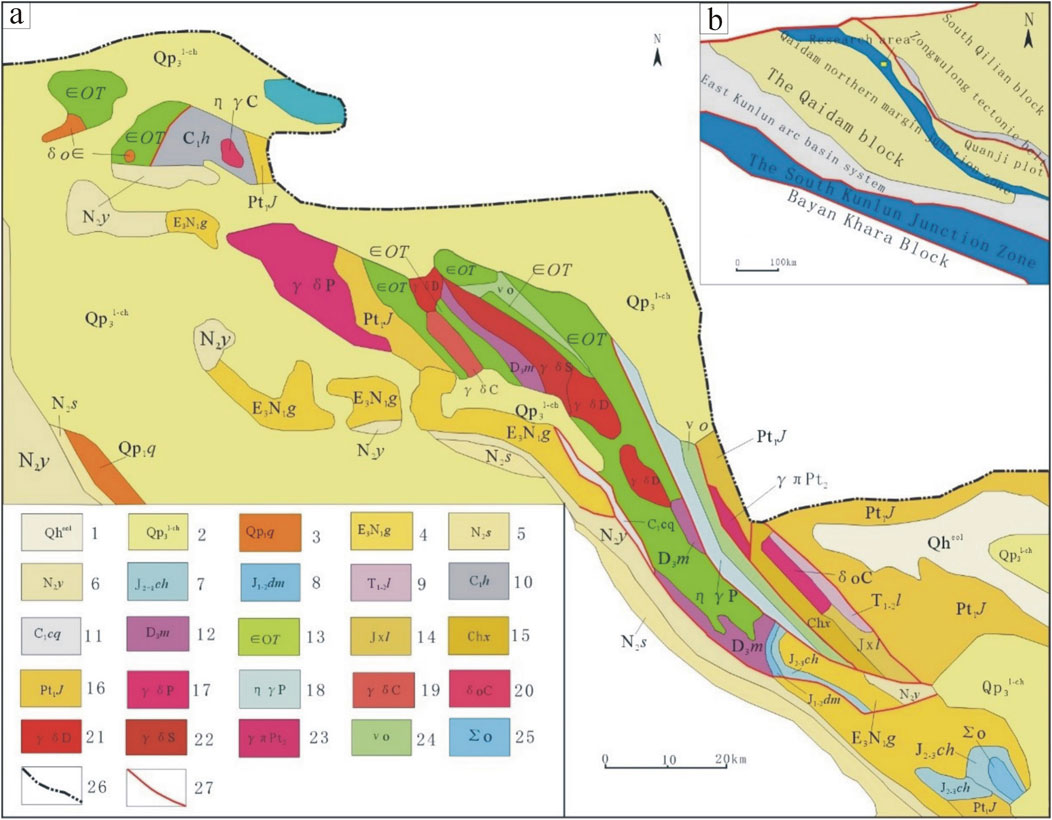
Figure 2. Geological sketch of Saishiteng Mountain area (a) and Peripheral Tectonic Map of the Qaidam Basin (b) 1- Holocene aeolian deposits; 2- Late Pleistocene Chonghu deposit; 3-Early Pleistocene Qiquan Formation; 4-Oligocene Miocene Ganchaigou Formation; 5-Upper Neozoic Shizigou Formation; 6-Upper Neozoic Youshashan Formation; 7-Changshanyu Group of Middle and late Jurassic; 8-Dameigou Formation of Early and Middle Jurassic; 9-Middle and late Triassic Longwuhe Formation; 10-Early Carboniferous Huitoutala Formation; 11 -- Early Carboniferous Huanminggou Formation; 12-Late Devonian Yakniushan Formation; 13-Cambrian-Ordovician Tanjianshan group; 14-Langyashan Formation of Jixian system; 15-Xiaomiao (Rock) Formation, Jinshuikou Group, Changcheng System; 16-Paleoproterozoic Jinshuikou Group; 17-Permian granodiorite; 18-Permian monzonitic granite; 19-Carboniferous granodiorite; 20-Carboniferous quartz diorite; 21-Devonian granodiorite; 22- Silurian granodiorite; 23- Mesoproterozoic granite porphyry dikes; 24- Ordovician gabbro dikes; 25- Ordovician ultrabasic dikes; 26- provincial boundaries; 27- Faults.
3 Characteristics of mining area
The exposed strata in the mining area comprise the Tanjianshan group of Cambrian-Ordovician and the Quaternary system. Among them, the volcanic rock series beneath the Tanjianshan group of Cambrian-Ordovician primarily consists of greenish-gray amygdaloidal basalt, greenish-gray layered altered basalt, and gray-purple siliceous rock lenses. Developed fault structures predominantly include northwest-trending faults (F2, F3, F4), north-northwest-trending faults (F5, F6, F7) and east-west-trending faults (F1, F8). The tectonic alteration zones and ductile shear zones (RF1-6) controlled by faults are distributed in a northwest or nearly east-west direction (Figure 3). The brittle fracture and ductile shear systems exert a decisive control on the morphology (Zhuang et al., 2020), orientation, scale and distribution of mineralized zones and deposits within the region. According to, the ductile shear zones significantly influence the formation of alteration skarn-type ore bodies by providing pathways and favorable conditions for hydrothermal activities related to ore genesis (Lu et al., 2019). The Saishiteng area represents an Early-Middle Ordovician granodiorite magma source region in the Cambrian neotectonic oceanic island arc (Wang et al., 2020), originating from partial melting processes occurring in active continental margin environments associated with oceanic island arcs. Quartz veins are extensively developed within the mine area, often occurring along joints and fractures of granodiorite bodies, predominantly trending northwest or northwest by west. Middle-Late Ordovician granodiorites and diorites serve as host rocks for mineralization. The primary alterations observed in these host rocks include silicitization, epidotization, and chloritization, among which silicitization is closely related to gold minification (Bao et al., 2021; Wang et al., 2015), while localized occurrences of greenschist facies metamorphism and skarnification can also be identified (Ren et al., 2018). The primary types of mineralization include quartz vein type and alteration rock type (Lu et al., 2019). The distribution of the ore body is governed by extensional fractures (Lu et al., 2021), which comprise multiple gold-bearing quartz veins, stockworks, and intervening altered rocks. Filling replacement-style gold-bearing quartz veins are controlled by joints and fractures, while silicified ductile shear zones govern the occurrence of silicified breccia-type ore bodies. Joints and fractures play a crucial role as structural controls in quartz vein-type mineralization (Lu et al., 2019).
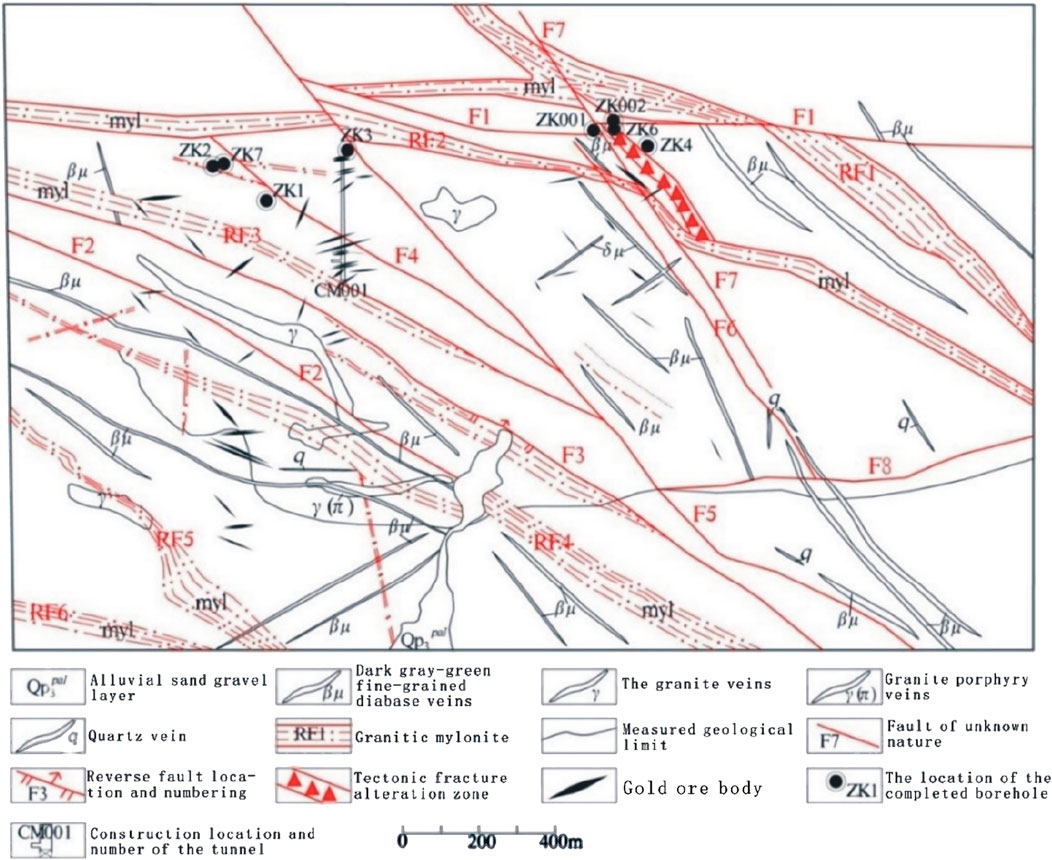
Figure 3. Structure schematic diagram of Sanjiaoding gold mine area.
4 Electrical and physical characteristics
4.1 Regional electrophysical characteristics
Induced polarization gradient measurement utilizes the physical property differences in polarization and resistivity between mineralized bodies and surrounding rocks (Ballard et al., 2002; Rowins S M, 2012), and is widely used in the search for concealed metal sulfide deposits (Fukao et al., 1994; Kearey, 2002; Rusk et al., 2008). In the study area, the gabbro, granodiorite, monzogranite, and other rock bodies and dikes are mainly distributed along the main ridge of Sertengshan. A notable feature of the Saishiteng region is the extensive exposure of acidic intrusive rocks from different periods. The early Paleozoic acidic intrusive rocks are mainly distributed along the main ridge of Sertengshan and its flanks (Wang et al., 2022). Isolated patches of Devonian quartz diorites can be found in the north of Sanjiaoding, Tuanyushan, and the northeastern part of Tanjianshan (Wu et al., 2004). The electrical conductivity results obtained from 177 surface rock ore samples collected within the study area and neighboring regions were analyzed (Qinghai Institute of Geological Survey, 2015; Qinghai Institute of Geological Survey, 2023) (Table 1). In limonized basalt, limonized granodiorite, and aplite granite, certain rocks exhibit medium to high polarizability with maximum values of 5.2%, 3.5%, and 3.95%, respectively. The average polarizability values for all three rock types exceed 2%. Additionally, the average resistivity values are measured at 244 Ω·M, 1,042 Ω·M, and 1,049 Ω·M correspondingly. Limonized granodiorite and aplite granite demonstrate notable resistivity and polarization characteristics (Figure 4).
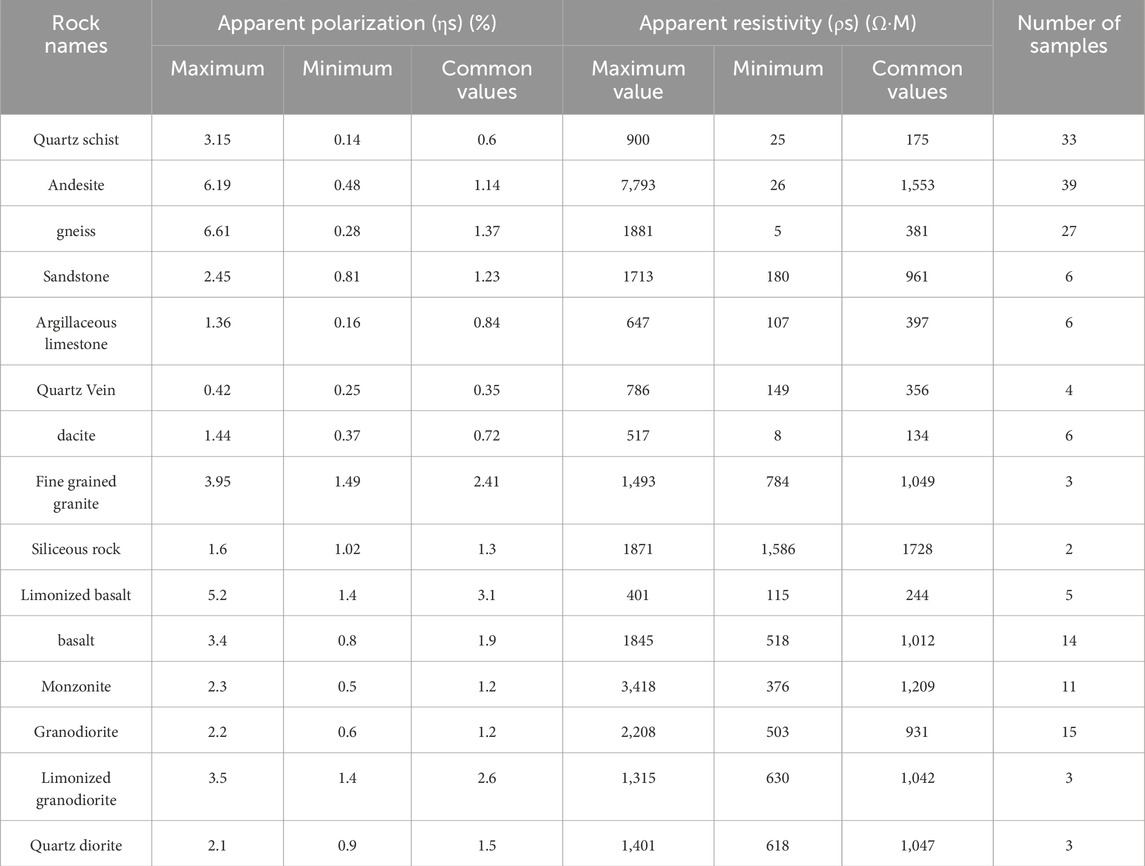
Table 1. Statistical table of the electrical properties of rocks in and around the study area.
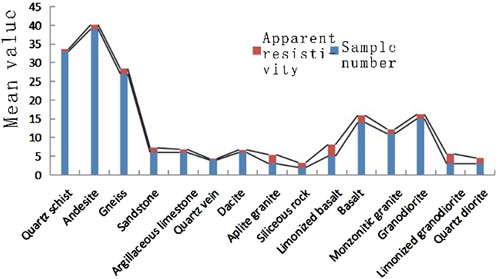
Figure 4. Statistical diagram of apparent polarization of rocks.
The limonized basalt exhibits low resistivity and high polarization characteristics, whereas other rocks demonstrate apparent polarizability ranging from 0.6% to 1.9%. Quartz schist, argillaceous limestone, quartz vein, and dacite display average apparent resistivity values of 175 Ω·M, 397 Ω·M, 356 Ω·M and 134 Ω·M, respectively, indicating relatively low resistivity levels. On the other hand, andesite and siliceous rock exhibit higher average apparent resistivity values of 1,553 Ω·M and 1,728 Ω·M, respectively (Figure 5), while the remaining rocks showcase apparent resistivities between 500 and 1,000 Ω·M. Therefore, limonized volcanic rocks in both the study area and adjacent regions lead to low-resistance, high-polarization-induced polarization anomalies. Starspot pyritized granodiorite and aplite granite can cause high-resistance, high-polarization-induced polarization anomalies (Khesin et al., 1997). Other rocks exhibit insufficient polarization rates to induce strong electrical anomalies. Based on the information above, it is speculated that high-apparent polarizability-induced polarization anomalies may be associated with deep-seated polymetallic mineralization or rock alteration.
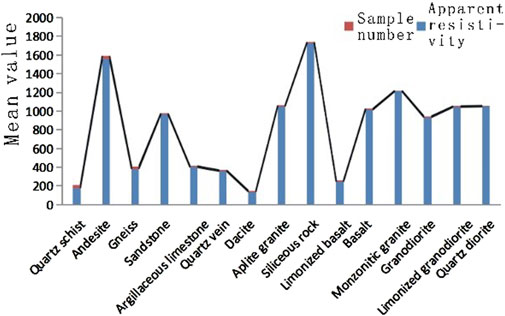
Figure 5. Statistical Diagram of apparent resistivity of rock.
4.2 Electrophysical characteristics of mining area
The mining area’s induced polarization intermediate gradient section primarily consists of Caledonian medium acid intrusive rocks, predominantly comprising Early Ordovician granodiorite, along with minor occurrences of monzonitic granite, quartz diorite and other rock masses. 162 electrical physical specimens have been collected (Table 2), encompassing five IP profiles traverse vertically through the SB2 and SB4 tectonic alteration zones, predominantly occurring within the granodiorite rock mass. These zones exhibit mainly limonized silicized cataclastic rocks (originally gabbro, basalt, and granodiorite).
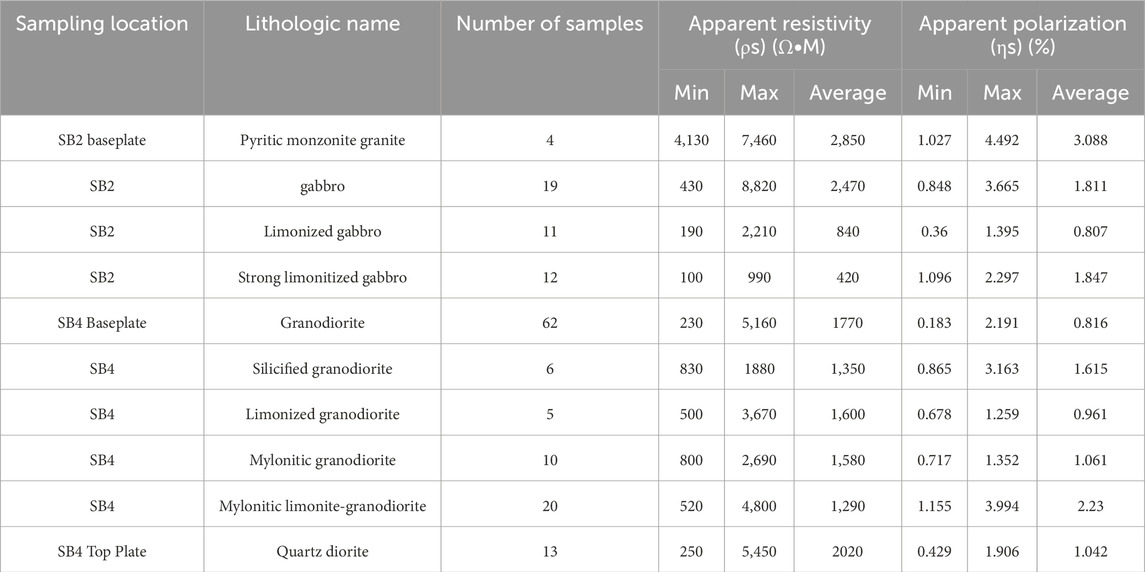
Table 2. Statistical table of electrical physical property parameters in the northern Sanjiaoding area.
The monzogranite containing pyrrhotite has a maximum apparent resistivity of 7,460 Ω·M, with an average value of 2,850 Ω·M. Additionally, it demonstrates significant polarization characteristics, with a maximum apparent polarization reaching up to 4.492% and an average polarization of 3.088%. These findings highlight the material’s exceptional resistivity and pronounced polarization properties.
In the SB2 alteration zone, the maximum apparent resistivity of gabbro can reach 8,820 Ω·M, with an average of 2,470 Ω·M. The maximum apparent polarizability is 3.665%, with an average value of 1.811%. Limonized gabbro has an average apparent resistivity of 3,730 Ω·M. Comparatively, limonization enhances the strength and gradually reduces gabbro’s resistivity while increasing its polarizability.
The granodiorite exhibits a maximum apparent resistivity of 5,160 Ω·M, with an average of 1,770 Ω·M (Figure 6). The highest apparent polarization reaches 2.191%, while the average is 0.816% (Figure 7). The increase in silicification and limonization leads to a gradual decrease in the apparent resistivity. Mylonitization and intense limonization induce alterations that reduce electrical resistance, whereas enhanced silicification and limonization show an upward trend in apparent polarization.
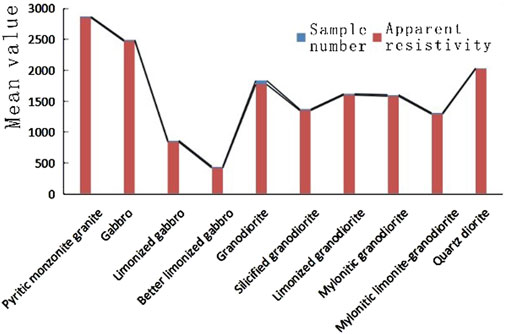
Figure 6. Statistical diagram of rock polarizability.
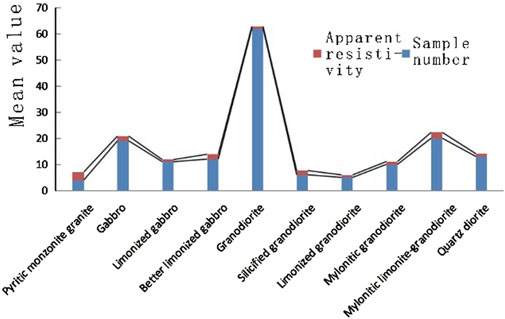
Figure 7. Statistical diagram of rock polarizability.
Therefore, in the mining area’s SB2 and SB4 alteration zones, monzogranite and gabbro with pyrite mineralization exhibit high resistivity and polarization characteristics. The granodiorite rock body shows a lower apparent polarization while ore-bearing geological bodies such as limonized granodiorite and strongly limonized gabbro in the tectonic alteration zone show higher apparent polarization, which can cause higher apparent polarization anomalies.
5 Induced polarization intermediate gradient profile characteristics
5.1 Technical method
The depth measurement of the induced polarization ladder adopts the method of ← AMNB → symmetrical quadrupole device. This work uses GPS (RTK) positioning measurement method to set up an object detection network; WDFZ-10 high-power intelligent transmitter and WDJS-2 digital DC induced polarization receiver were selected for the measurement of induced polarization; Selected power supply pole distance AB = 1,500 m, measured pole distance MN = 40m; The measurement section is 2/3 of the middle section of AB; The maximum distance between the side survey line and the main survey line is equal to 1/5 of the AB distance; Adopting a bidirectional short pulse power supply method, the power supply time is 4 s, the power-off time is 4 s, the power supply cycle is 16 s, the power-off delay is 200 ms, and the duty cycle is 1:1; The measurable parameters are apparent polarizability (ηs) and apparent resistivity (ρs). The apparent polarizability is a direct reading, while the apparent resistivity is calculated according to the formula: ρs = k ·∆ V/I (Ω· m) (where k-polarizability, ∆V- primary field potential, I - supply current). Overall, the depth measurement data and quality of induced polarization data are reliable, meeting the requirements of relevant regulations and geophysical inference interpretation.
5.2 Induced polarization intermediate gradient profile
According to the research on the geological and mineralization alteration characteristics of the study area, an induced polarization survey was conducted along exploration lines 0, 7, 8, 15, and 16 with a spacing of 160 m for control purposes at a scale of 1:2000 (Figure 8). In areas with intense mineralization alteration, point density was appropriately increased to reflect deep-seated mineralization alteration information accurately.
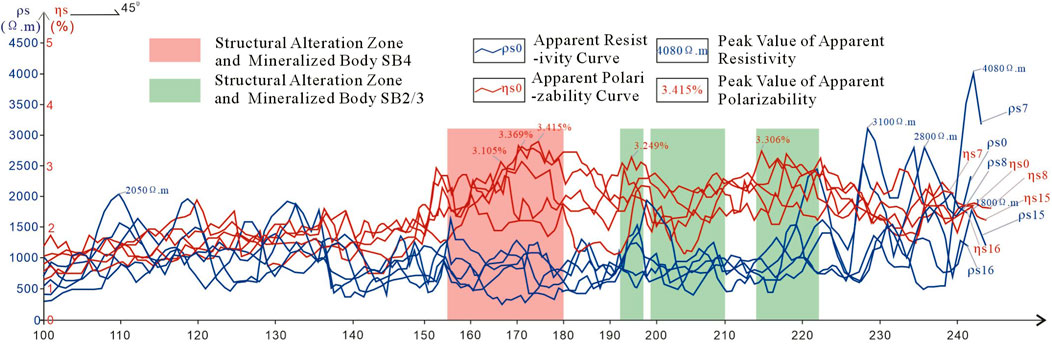
Figure 8. Apparent polarizability of structural alteration zone and apparent resistivity profile.
JD0 profile: azimuthal 45°, length 603 m. The apparent polarization curve (Figure 8) shows that the polarization anomaly is more pronounced at points 149 to 197, covering a total length of 144 m with amplitudes ranging from 1.997% to 3.369%, as depicted in Figure 9. Notably, the highest amplitude is observed at point 171. The polarization curve demonstrates a broad and gradual pattern, while the apparent resistivity varies between 411 Ω·m and 1,488 Ω·m, indicating medium-high resistance and significant polarizability characteristics. It is worth mentioning that this anomaly passes through the SB2 and SB3 tectonic alteration zones, where exposed lithology primarily comprises limonitized silicified cataclastic rock (originally gabbro, basalt, and granodiorite). The electrical physical property results reveal that cataclastic rock has high polarizability, suggesting that the tectonic alteration zones are primarily responsible for this anomaly (Figure 9).
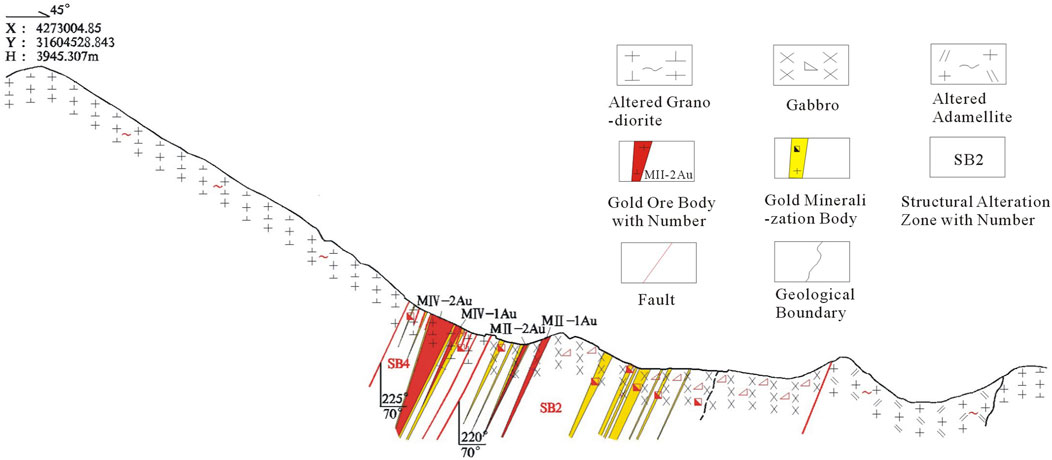
Figure 9. Geological profile of structural alteration zone (SB2, SB4).
JD7 profile: azimuth 45°, length 653 m. The apparent polarization curve (Figure 8) exhibits a clear polarization anomaly spanning points 161–192, measuring a length of 126 m and displaying amplitudes ranging from 2.141% to 3.415%. The maximum value is observed at point 173. The apparent resistivity ranges from 401 to 1186 Ω·m, indicating medium-high resistance characteristics and pronounced polarization anomalies. This anomaly intersects the SB2 and SB3 tectonic alteration zones, suggesting its primary association with these tectonic alteration zones. In addition, polarization anomalies with amplitudes ranging from 2.204% to 2.702% between points 199–210 and from 2.331% to 3.096% between points 214–222 exhibit a wider range of variations in polarization rates within the Au6 anomaly area adjacent to the northern side of the SB3 fractured alteration zone, indicating potential for exploring structurally altered rock-type gold deposits.
JD8 profile: azimuth 45°, length 603 m. The apparent polarization curve (Figure 8) shows a broad and gradual overall trend. A distinct polarization anomaly was observed from point 160 to point 246, spanning an abnormal distance of 258m, with amplitudes ranging from 2.102% to 3.249%. This anomaly comprises three abnormal peaks located at points 166 (2.928%), 196 (3.249%), and 227 (3.201%). The average resistivity value measures 777 Ω·m, indicating medium-high resistance characteristics and a high occurrence rate of polarization anomalies. This polarization anomaly primarily manifests within the SB2-SB4 tectonic alteration zone; however, the SB2 and SB3 tectonic alteration zones are divided into three sections along the JD0 profile leading up to this anomalous section, thereby expanding the width of the apparent polarization anomaly display. It can be inferred that this anomaly predominantly represents the manifestation of the SB2-SB4 tectonic alteration zone (Figure 9).
JD15 profile: azimuth 45°, length 671 m. The apparent polarization curve (Figure 8) shows two distinct anomalies. The first anomaly spans from point 155 to 180, with a length of 96 m and an amplitude ranging from 2.243% to 3.105%. It displays a bimodal abnormality, with the maximum value occurring at point 173. This segment demonstrates resistivity values between 350 Ω·m and 1136 Ω·m. As the anomaly intersects the SB2 tectonic alteration zone, it is presumed that this particular tectonic alteration zone is likely responsible for the anomaly’s presence (Figure 9). The second anomaly occurs between points 192 and 197, covering a length of 24 m with polarization rates ranging from 2.104% to 2.723%. It exhibits resistivity values between 638ω ·m and 822ω ·m. The anomaly is closely adjacent to the northern side of the SB3 tectonic alteration zone, potentially indicating its correlation with this specific zone.
JD16 profile: azimuth 45°, length 671 m. The apparent polarization curve (Figure 8) exhibits a relatively broad and gradual anomaly, roughly divided by point 157. In the southern section, from points 100 to 157, the polarization amplitude ranges from 1.472% to 2.41%, with an average resistivity of 1011 Ω·m. The granodiorite-dominated region does not exhibit a clear polarization anomaly in this section. The polarization curve primarily represents the natural background field typical of granodiorite formations. In the northern section encompassing points 158 to 233, an overall higher polarization rate is observed, ranging in amplitude from 2.038% to 3.306%, with an average value of 2.586%. This section intersects three northwest-oriented tectonic alteration zones such as SB2-SB4, implying that these three tectonic alteration zones collectively contribute to the formation of this anomaly (Figure 9).
Based on the above findings, the study area exhibits induced polarization (IP) values ranging from 2.683% to 2.778%, with a mean value of 2.697%. The apparent resistivity generally falls within the range of 350–1,186 Ω·m. At stations 155–180, a peak IP value of 3.415% and maximum apparent resistivity of 1,186 Ω·m were observed, displaying characteristics of medium-resistivity and high-polarization anomalies, which correlate well with the SB4 structural alteration zone and mineralized bodies. At stations 192–197, 199–210, and 214–222, the maximum IP value reaches 3.096% with a maximum apparent resistivity of 1,186 Ω·m, exhibiting medium-to-high resistivity and medium-to-high polarization anomalies, showing good correspondence with the SB2 and SB3 structural alteration zones and mineralized bodies.
5.3 Induced polarization anomaly
According to the measurement results of induced polarization intermediate gradient profiles, the average apparent polarisation value is 2.22%. An apparent polarization anomaly with a magnitude of 2.22% is identified, and two distinct anomalies, J1 and J2, are delineated (Figure 10). Notably, the J1 anomaly is located in the northern part of the profile and exhibits anomalous behaviour in profiles such as JDO, 7, 8, and 16. Spanning a length of 480 m and width ranging from 60 to 100m, it extends in a northwest-southeast direction (Figure 10), reaching its maximum value of 3.046% at point 219 in the JD0 profile. The primary body of this anomaly resides within Late Devonian granodiorite but extends southeast into the SB3 tectonic alteration zone, thereby showing potential for exploring structurally altered rock-type gold deposits.
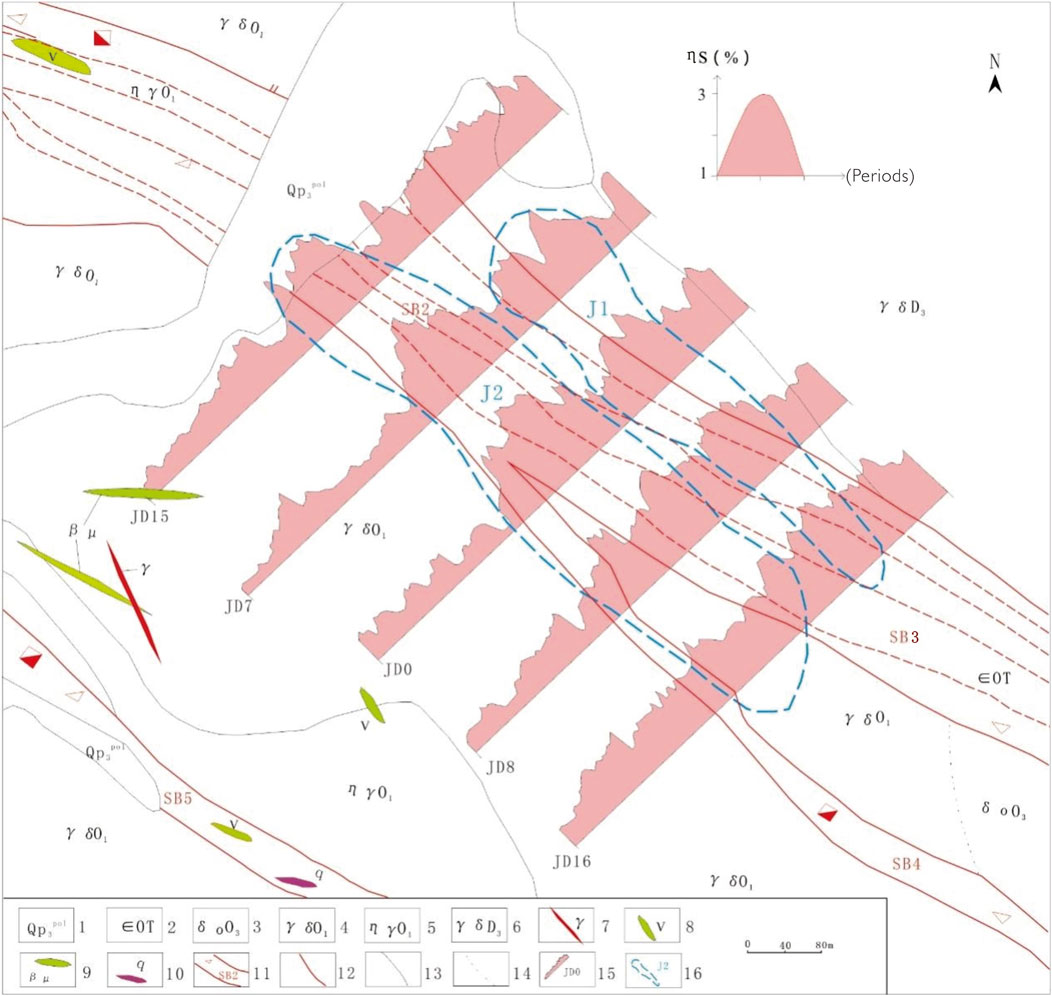
Figure 10. Survey cross-section of induced polarization intermediate gradient in mining area 1. Quaternary, 2. Tanjianshan Group, 3. Late Ordovician quartz diorite, 4. Early Ordovician granodiorite, 5. Early Ordovician monzonitic granite, 6. Late Devonian granodiorite, 7. Granitic dikes, 8. Gabbro dike, 9. Diabase porphyrite dike, 10. Quartz dike, 11. Fracture Alteration Zone and Number, 12. Fault, 13. Geological Boundary, 14. Intrusion Boundary, 15. IP profile and numbering, 16.electromagnetic anomaly and numbering.
The J2 anomaly, measuring 640 m in length and 130 m in width (Figure 10), exhibits consistency with the J1 anomaly. The maximum value reaches 3.415% in the JD7 profile. Situated within the tectonic alteration zone SB2 and SB4 (Figure 10), the main body demonstrates a higher polarization rate for limonized granodiorite based on electrical results, suggesting that this tectonic alteration contributes to the observed electrical anomaly. Furthermore, this alteration zone has identified multiple gold mineralization bodies, indicating promising prospects for exploring structurally altered rock-type gold deposits.
6 Discussion
6.1 Geophysical exploration technology
With the increasing maturity of exploration work in major mining areas around the world, the exploration targets of mineral deposits have transitioned from open-pit or near surface ore bodies to deeper buried concealed ore bodies, and the accompanying challenge is the innovation of exploration technology; The role of geophysical methods in geological exploration is becoming increasingly important. A comprehensive analysis and comparison of geophysical exploration methods for gold mines have been conducted (Yan et al., 2008; Seigel et al., 1984; Doyle, 1990; Okada, 1995; Guo et al., 1999); In the 1960s and 1970s, the American engineering and research institution Zonge first proposed the spectrum induced polarization method - complex resistivity method. Pelton et al. (1978) believed that the complex resistivity spectrum of homogeneous rocks (minerals) caused by the induced polarization effect satisfies the Cole model. The characteristics of resistivity and polarizability play a crucial role in revealing the distribution range of mineralized quartz veins in the Pajingo shallow low-temperature hydrothermal gold deposit in Australia (Hoschke and Sexton, 2005); In the exploration of polymetallic sulfide deposits, induced polarization method is a recognized and extremely effective exploration technique (Liu et al., 2008). The induced polarization method plays a significant role in the exploration of quartz vein type gold deposits containing metal sulfides (Oldenburg et al., 1997). When using induced polarization method for exploration, it is often necessary to conduct induced polarization depth measurement to understand the burial depth, geometric shape, and occurrence state of polarizers (or mineralized bodies) (Weller et al., 2000). Induced polarization gradient geophysical exploration, as an effective geophysical method in mineral exploration, is widely used for delineating mineral target areas and blind ore bodies (Wang et al., 2019). At present, the selection of exploration methods and data interpretation greatly restrict the discovery of new mineral deposits. Geophysical methods, as the most direct means of exploring the deep parts of the Earth, have increasingly obvious natural advantages in searching for deep ore bodies (Zhu, 2017; Zhou et al., 2021). The measurement of physical properties in the triangular roof mining area found significant electrical differences between the mineralized body and the intrusive rock mass and surrounding rock. For the actual prospecting work, we employed a symmetrical quadrupole arrangement to measure induced polarization at various depths. By analyzing the characteristics of electrical parameters such as apparent polarization rate and apparent resistivity, high and high polarization or low resistance and high polarization electrical anomaly zones can be divided. The differences in apparent polarization rate characteristics among different rock types are prominent, and apparent polarization rate can be used as an important parameter to indicate hidden ore bodies. Induced polarization depth measurement has determined the spatial distribution range of the ore body, which can quickly delineate the target area, narrow the exploration range, improve exploration efficiency, reduce exploration risks and costs, and play an important role in guiding mineral exploration.
During field measurements, the intermediate gradient-induced polarization method faces limitations in acquiring comprehensive three-dimensional subsurface electrical information due to various factors, including topographic conditions and the heterogeneity between mineralized bodies and host rocks (Aizebeokhai and Oyeyemi, 2014a; Wang et al., 2017). These constraints affect detection depth and exploration resolution (Schmutz et al., 2014). China’s new mineral exploration initiatives have established more stringent requirements for exploration depth and precision (Ren and Tang, 2010; 2014; Pan and Tang, 2014). Furthermore, limitations in sample collection and the lithological characteristics of ore bodies and host rocks have resulted in insufficient precision in deep exploration indicators. As with other geophysical exploration methods, the intermediate gradient method suffers from inherent ambiguity in anomaly interpretation, necessitating integrated analysis of multiple datasets, including geological, geochemical, and other geophysical data.
6.2 Application effect of mineral exploration
The Sanjiaoding gold mine is closely related to regional brittle-ductile shear deformation, as evidenced by its production characteristics, ore structure, and tectonic feature (Duan et al., 2011). Near the quartz vein-type gold deposits, different degrees of brittle-ductile tectonic zones are developed, making the tectonic location an important prerequisite for prospecting (Bao et al., 2021). Favorable enrichment sites for ore bodies can be found at intersections of different directions of structures or changes in fault structures in the mining area, and tectonic fragmentation is also an important prospecting section (Ren et al., 2018). This deposit belongs to a superimposed magmatic-hydrothermal type mountain-building gold deposit influenced by multiple mineralization events (Lu et al., 2021). Within the deposit lies one delineated anomaly (HS82 anomaly) in 1:50,000 water system sediments characterized mainly by Au element anomalies with a combination of Au-W-Ba elements. It exhibits good association with obvious concentration centers and large scale (Ren et al., 2018).
In the exploration of polymetallic sulfide deposits, induced polarization (IP) has been established as a widely recognized and highly effective prospecting technique (Weller et al., 2000; Yatini, 2013; Yatini et al., 2016). The method enables rapid and efficient detection of IP anomalies across multiple depth levels, characterized by high spatial resolution and superior penetration capabilities (Wang et al., 2017). Based on the different resistivity of ore bodies and the surrounding rocks or strata, the induced polarization intermediate gradient method can effectively identify minerals (Vallée et al. ,2011), as the resistivity data is closely related to the presence of minerals (Diquan and Qiaoxun, 2021; Arifin et al., 2019). The intermediate gradient array configuration in IP surveys has proven highly effective for areal reconnaissance (Vaudelet et al., 2011; Olowofela et al., 2012). At Zone A of Pakistan’s Reko Diq porphyry Cu-Au deposit, chargeability values range from 2.0% to 6.0%, with trench excavation revealing two mineralized zones (Huang et al., 2019). The Golden Pride gold deposit in Tanzania exhibits minimum chargeability anomalies of 1.7% with apparent resistivity of 250 Ω m, associated with structural alteration zones (Cui et al., 2015). The investigation methodology in the study area employed a hierarchical “regional-linear-detailed” approach, initiated with electrical property characterization. The exploration sequence comprised high-resolution magnetic surveys for magnetic anomaly delineation, followed by intermediate gradient IP surveys for electrical anomaly identification. Detailed profiling was then conducted across anomalous zones, culminating in IP soundings to characterize the geometry and spatial distribution of mineralization-induced anomalies. The average chargeability value of 2.697% shows strong spatial correlation with the SB2, SB3, and SB4 structural alteration zones and mineralized bodies, validating the effectiveness of the exploration strategy. The presence of limonized basalt and pyrite mineralized granodiorite in the research area and its surroundings results in low-resistance high-polarization induced polarization anomalies (Figures 11, 12). These anomalies may indicate deep-seated polymetallic mineralization or rock alteration processes.
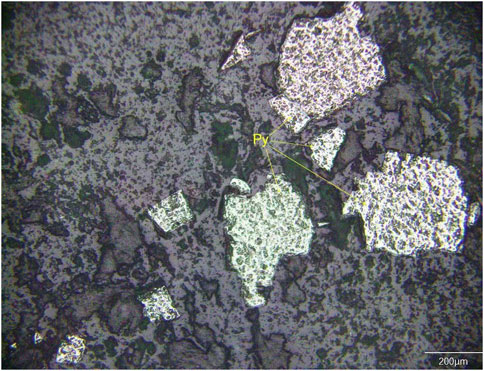
Figure 11. Microscopic characteristics of pyrite in mylonitized granodiorite, Py-pyrite.
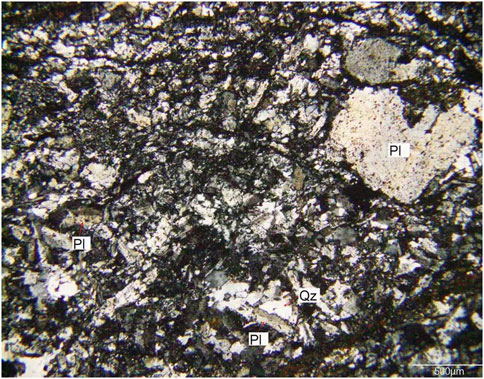
Figure 12. Microscopic characteristics of weakly altered basalt, Pl-plagioclase, Qz-quartz.
The J1 anomaly trend aligns with the gold element anomaly, exhibiting a peak polarization rate within the concentration center of the gold element anomaly, demonstrating significant overlap. Similarly, the J2 anomaly also exhibits substantial overlap with the gold element anomaly. Subsequent geophysical exploration and engineering surveys have successfully delineated 12 tectonic alteration zones, seven gold mine bodies, and over 40 gold mineralized bodies in this region. Gold grades range from 1.0 × 10⁻⁶ to 45.0 × 10⁻⁶, reaching a maximum value of 71.7 × 10⁻⁶ with thicknesses ranging from 0.1 to 2.38m; Among them, the gold mineralization of the tectonic alteration rock type is obviously controlled by the tectonic alteration zone, and is distributed in the structural zones of SB2, SB4 and SB5 (Figure 13), and the average gold grade of the delineated gold ore body MII-1 in the SB2 tectonic alteration zone is 1.70 × 10⁻⁶, and the ore-bearing lithology is fragmented lithic limonite gabbro, and the mineralization alteration is dominated by limonite mineralization and silicification (Figure 14). The average gold grades of MIV-1, MV-1 in the delineated gold ore bodies in the SB4 and SB5 structural alteration zones are 1.50 × 10⁻⁶ and 1.80 × 10⁻⁶, respectively, and the ore-bearing lithologies are all mylonite-shaped limonite granodiorite, and the mineralization alteration characteristics such as limonite, pyrite and silicification are obvious. At the same time, the quartz veins are more developed in some tectonic alteration zones, with gold mineralization and significant limonite mineralization, which provides clues to quartz vein-type gold mineralization. Intermediate gradient measurements obtained through induced polarization reflect resistivity distribution characteristics of underground geological bodies in Sanjiaoding mining area and have yielded promising outcomes for gold exploration.
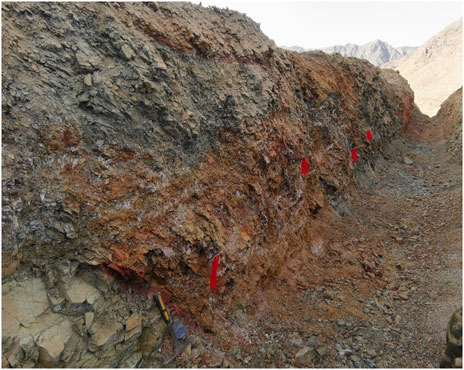
Figure 13. Characteristics of SB2 structural alteration zone.
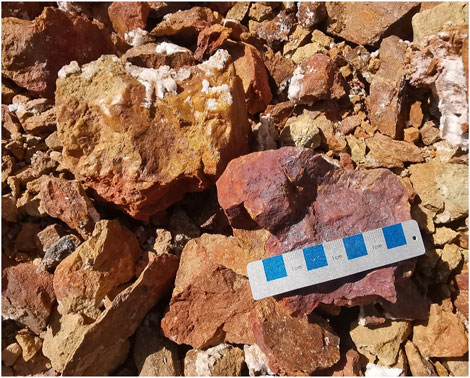
Figure 14. Limonitized gabbro in SB2 structural alteration zone.
7 Conclusion
(1) The Sanjiaoding gold mine is located in the western section of the Seshten Mountain-Alzto Mountain metallogenic belt, with vigorous early Paleozoic magmatic activity, brittle faults and ductile shear zones in the rock mass, and the gold ore metallogenic types are mainly quartz vein type and tectonic alteration rock type.
(2) The traditional controlled source electromagnetic method has limitations in data acquisition and other aspects. In contrast, the induced polarization intermediate gradient method, as an effective electromagnetic (EM) exploration technique, boasts high depth penetration, high accuracy, and strong adaptability.In the study area and adjacent regions, the localized limonized basalt exhibits low-resistance high-polarization induced polarization anomalies, while the pyritized granodiorite displays high-resistance high-polarization anomalies. The alteration zones of mineral deposits SB2 and SB4 demonstrate a characteristic of high-resistance high-polarization due to the presence of pyritic monzonitic granite and gabbro. Ore-bearing geological bodies such as limonized granodiorite and strongly limonized gabbro in the tectonic alteration zone exhibit a higher polarization rate, which can result in polarization rate anomalies.
(3) According to the anomaly characteristics of apparent polarization and apparent resistivity in the induced polarization intermediate gradient profile, two distinct areas of induced polarization anomalies are delineated. These anomalies primarily result from tectonic alteration zones and exhibit multiple occurrences of gold mineralization, suggesting potential for exploring structurally altered rock-type gold mines.
(4) After conducting advanced exploration and engineering survey verification, 12 tectonic alteration zones and over 40 gold mine bodies have been identified within the designated area. Through the specific application of the IP ladder anomaly in the mining area, it is found that the anomaly can effectively reflect the resistivity distribution characteristics of deep geological bodies, and can achieve significant prospecting outcomes in the process of gold exploration. With the rapid development of the world economy, the demand for metallic mineral resources continues to increase. The IP gradient method has been widely adopted in many countries for metallic mineral exploration due to its high efficiency, low cost, and portable equipment setup. It will undoubtedly play an even greater role in the discovery of concealed metallic deposits.
Data availability statement
The original contributions presented in the study are included in the article/supplementary material, further inquiries can be directed to the corresponding authors.
Author contributions
HZ: Writing–original draft, Writing–review and editing. SL: Writing–original draft, Writing–review and editing. YW: Writing–original draft, Data curation, Software. YL: Writing–original draft, Data curation, Conceptualization. XZ: Writing–original draft, Data curation. JF: Writing–original draft, Data curation, Investigation, Software. YY: Writing–original draft, Data curation, Validation, Software.
Funding
The author(s) declare that financial support was received for the research, authorship, and/or publication of this article. This research was jointly supported by the Qinghai Provincial Science and Technology Program (Project Number: 2024-ZJ-903) and the National Key Research and Development Program (Project Number: 2021YFC2901902).
Acknowledgments
The authors would like to extend their sincere gratitude to the reviewers for their detailed comments.
Conflict of interest
The authors declare that the research was conducted in the absence of any commercial or financial relationships that could be construed as a potential conflict of interest.
Generative AI statement
The author(s) declare that no Generative AI was used in the creation of this manuscript.
Publisher’s note
All claims expressed in this article are solely those of the authors and do not necessarily represent those of their affiliated organizations, or those of the publisher, the editors and the reviewers. Any product that may be evaluated in this article, or claim that may be made by its manufacturer, is not guaranteed or endorsed by the publisher.
References
Abubakar, A., and Habashy, T. M. (2005). A green function formulation of the extended born approximation for three-dimensional electromagnetic modelling. Wave Motion 41 (3), 211–227. doi:10.1016/j.wavemoti.2004.05.011
Aizebeokhai, A. P., and Oyeyemi, K. D. (2014a). The use of the multiple-gradient array for geoelectrical resistivity and induced polarization imaging. J. Appl. Geophys. 111, 364–376. doi:10.1016/j.jappgeo.2014.10.023
Aizebeokhai, A. P., and Oyeyemi, K. D. (2014b). The useofthe multiple-GradientArrayforGeoelectricalResistivity andInduced polarization imaging. Journalof AppliedGeophysics 11, 364–376.
An, Z., and Di, Q. (2016). Investigation of geological structures with a view to HLRW disposal, as revealed through 3D inversion of aeromagnetic and gravity data and the results of CSAMT exploration. J. Appl. Geophys 135, 204–211. doi:10.1016/j.jappgeo.2016.10.013
Arifin, M. H., Kayode, J. S., Izwan, M. K., Zaid, H. A. H., and Hussin, H. (2019). Data for the potential gold mineralization mapping with the applications of electrical resistivity imaging and induced polarization geophysical surveys. Datain Brief. 22 (22), 830–835. doi:10.1016/j.dib.2018.12.086
Ballard, J. R., Palin, M. J., and Campbell, I. H. (2002). Relative oxidation states ofmagmas inferred from Ce(IV)/Ce(III)in zircon:Application to porphyry copper deposits of northern Chile. Contributions Mineralogy Petrology 144 (3), 347–364. doi:10.1007/s00410-002-0402-5
Bao, G. P., Zhang, L., and Zhang, H. L. (2021). Characteristics and prospecting potential of quartz vein-type gold depositsin saishiteng area, qinghai province. Northwest. Geol. 54 (1), 139–147.
Bi, H. Z., Whitney, D. L., Song, S. G., and Zhou, X. (2022). HP–UHP eclogites in the east kunlun orogen, China: P–T evidence for asymmetric suturing of the Proto-Tethys Ocean. Gondwana Res. 104, 199–214. doi:10.1016/j.gr.2021.04.008
Chen, X. W. (2013). The application of induced polarization method in lead-zinc deposit exploitation of nayongzhi area of puding. Guizhou Geol. 30 (1), 23–25. doi:10.3969/j.issn.1000-5943.2013.01.005
Chernico, C., Richards, J. P., and Zappettini, E. (2002). Crustal lineament control on magmatism and mineralization in northwestern Argentina: geological, geophysical, and remote sensing evidence. Ore Geol. Rev. 21 (3–4), 127–155. doi:10.1016/s0169-1368(02)00087-2
Constable, S. C., Parker, R. L., and Constable, C. G. (1987). Occam’s inversion — a practical algorithm for generating smooth models from electromagnetic sounding data. Geophysics 52, 289–300. doi:10.1190/1.1442303
Cui, D. J., and Wang, J. W. (2009). Application of IP intem ed ia te G rad ient surveyin polm etallic deposit prospectng. Guizhou Geol. 26 (3), 218–220. doi:10.3969/j.issn.1000-5943.2009.03.014
Cui, X. J., Peng, J., Li, S. P., Meng, J. Y., Mao, B. J., and Si, T. J. (2015). Exploration methods for structural alteration-hosted gold deposits in the Tanzanian greenstone belt. Geophys. Geochem. Explor. 39 (4), 275–283. doi:10.11720/wtyht.2015.4.10
Di, Q. Y., Fang, G. Y., and Zhang, Y. M. (2013). Research of the surface electromagnetic prospecting (SEP) system. Chin. J. Geophys. 56 (11), 3629–3639. doi:10.6038/cjg20131104
Diquan, L., and Qiaoxun, Z. (2021). Application of the wide field electromagnetic method for oil and gas exploration in a red-bed basin of south China. J. Environ. Eng. Geophys. 26 (1), 25–34. doi:10.32389/jeeg20-041
Doyle, H. A. (1990). Geophysical exploration for gold-areview. Geophysics 55 (2), 134–146. doi:10.1190/1.1442820
Duan, J. H., Zhao, X. F., and Geng, A. Q. (2011). Geological feature and analysis on the ore-searching prospect in the Yeluotuoquan gold deposit. J. Qinghai Univ. 29 (3), 47–51. doi:10.3969/j.issn.1006-8996.2011.03.011
Feng, C. Y., Zhang, D. Q., She, G. Q., Li, X. D., Xu, Y. W., and Su, H. L. (2002). Structural evolution of ductile shear belt and its constraints on gold mineralizations: examplified by yeluotuoquan gold deposit, qinghai province. Mineral. Deposits 21, 582–585.
Fu, C. L., Yan, Z., Wang, Z. Q., Buckman, S., Aitchison, J. C., Niu, M. L., et al. (2018). Lajishankou ophiolite complex:Implications for Paleozoic multiple accretionary and collisional events in the South Qilian Belt. Tectonics 37 (5), 1321–1346. doi:10.1029/2017tc004740
Fukao, Y., Maruyama, S., and Obajshi, S. (1994). Geologic implication of the whole mantle P-wave tomography E. Geol. Soc. Jpn. 100 (1), 4–23. doi:10.5575/geosoc.100.4
Gao, W. L., Wang, Z. X., Li, L. L., Cui, M. M., Qian, T., and Hu, J. J. (2019). Discovery of the permian granite in saishiteng mountain of the northern qaidam basin and its tectonic significance. Acta Geol. Sin. 93 (04), 816–829. doi:10.3969/j.issn.0001-5717.2019.04.005
Goldfarb, R. J., Groves, D. I., and Gardoll, S. (2001). Orogenic gold and geologic time: a global synthesis. Ore Geol. Rev. 18 (1), 1–75. doi:10.1016/s0169-1368(01)00016-6
Goldstein, M. A. (1971). Magnetotelluric experiments employing an artificial dipole source. Canada: University of Toronto. doi:10.1190/1.1440558
Groves, D. I., Goldfarb, R. J., Gebre-Mar, I. A. M. M., Hagemann, S., and Robert, F. (1998). Orogenic gold deposits: aproposed classification in the context of their crustal distribution and relationship to other gold deposit types. Ore Geol. Rev. 13, 7–27. doi:10.1016/s0169-1368(97)00012-7
Guo, W. W., Dentith, M. C., Xu, J. L., and Ren, F. (1999). Geophysical exploration for gold in gansu province,China. Explor. Geophys. 30 (2), 76–82. doi:10.1071/eg999076
Guo, Z., Xue, G., Liu, J., and Wu, X. (2020). Electromagnetic methods for mineral exploration in China: a review. Ore Geol. Rev. 118, 118103357–103357. doi:10.1016/j.oregeorev.2020.103357
Guoqiang, X., Nannan, Z., Ruiting, W., Liu, H., and Guo, W. (2021). Exploration of lead-zinc deposits using electromagnetic method: a case study in Fengtai ore deposits in Western China. Geol. J. 56 (6), 3314–3321. doi:10.1002/gj.4103
Harrison, C. B., and Urosevic, M. (2012a). Seismic processing,inversion,and AVO for gold exploration-case study from western Australia. Geophysics 77 (5), C235–C243. doi:10.1190/geo2011-0506.1
Harrison, C. B., and Urosevic, M. (2012b). Seismic processing, inversion, and AVO for gold exploration — case study from Western Australia. Geophysics 77 (5), 235–243. doi:10.1190/geo2011-0506.1
Hoschke, T., and Sexton, M. (2005). Geophysical exploration for epithermal gold deposit sat Pajingo,north Queens land,Australia. Explor. Geophys. 36 (4), 401–406. doi:10.1071/eg05401
Huang, Y. T., Zeng, R. Y., Li, L., and Wang, R. T. (2019). Discussion on exploration methods in the peripheral areas of Reko Diq porphyry Cu-Au deposit, Pakistan. Mineral. Explor. 10 (9), 2380–2387. doi:10.3969/j.issn.1674-7801.2019.09.033
HuGe, J. L., Ma, G. D., Deng, Y. L., Zhou, P., and Du, P. S. (2018). Metallogenie conditions and modes of the qinglongou gold deposit in tanjianshan area. Northwest. Geol. 51 (3), 155–160. doi:10.3969/j.issn.1009-6248.2018.03.014
Key, K. (2009). 1D inversion of multicomponent, multi-frequency marine CSEM data:methodology and synthetic studies for resolving thin resistive layers. Geophysics 74 (2), F9–F20. doi:10.1190/1.3058434
Khesin, B. E., Alexeyev, V. V., and Eppelbaum, L. V. (1997). Rapid methods for interpretation of induced polarization anomalies. J. Appl. Geophys. 37 (2), 117–130. doi:10.1016/s0926-9851(97)00006-2
Large, R. R., Bull, S. W., and Maslennikov, V. V.(2011). A carbonaceous sedimentary source-rock model for carlin-type and orogenic gold deposits. Econ. Geol. 106(3), 331–358. doi:10.2113/econgeo.106.3.331
Linfoot, J., Mattsson, J., and Price, D. (2011). “Case study of a towed streamer EM survey over the troll field, north sea,” in 2011 SEG annual meeting (Houston, TX, United States Society of Exploration Geophysicists), 594–598.
Liu, G. X., Wang, X. C., Zhang, L. X., and Wang, Z. (2003). Thecombined application of high-power inducedpolarization andtransient electromagnetic method inthe deep mineral exploration in xitieshan area of qinghai. J. Jilin Univ. Sci. Ed. 33 (4), 551–555. doi:10.3969/j.issn.1671-5888.2003.04.030
Liu, P. A., Chu, L., Guo, F. X., and Guo, S. J. (2008). The application of the IP method to the exploration of a copper-molybdenum ore deposit in northern hebei. Geophys. Geochem. Explor. (04), 363–365.
Lu, Y. Z., Han, J., Fu, Y. W., Ma, C. B., and Yu, C. F. (2019). Geological characteristics and metallogenic model of the sanjiaoding gold deposit in the northern margin of qaidam. Mineral. Explor. 10 (12), 2919–2924. doi:10.3969/j.issn.1674-7801.2019.12.006
Lu, Y. Z., Han, J., Wang, M., Yu, C. F., Wang, S. T., and Yuan, W. B. (2021). Metallogenic characteristics and its prospecting significance of the sanjiaoding gold deposit in the northern margin of Qaidam Basin. Geoscience 35 (5), 1363–1370.
Lubben, J. D., Cline, J. S., and Barker, S. L. L. (2012). Ore fluid properties and sources from quartz-associated gold at the betze-post carlin-type gold deposit, Nevada, United States. Econ. Geol., 107(7), 1351–1385. doi:10.2113/econgeo.107.7.1351
Luo, A. H. (2011). Inference and interpretation of comprehensive anomalies in the Niuerhe survey area of Inner Mongolia. Kunming Unversity Sci. Technol.
Nakayama, K., and Saito, A. (2014). “Development of new marine TDEM systems for the ocean bottom hydrothermal deposits,” in SEG technical Program extended abstracts (Houston, TX, United States Society of Exploration Geophysicists), 850–854.
Okada, K. (1995). Geophysic alexploration for epithermal gold deposits:Case studies from the Hishikari goldmine,Kagoshima,Japan. Explor. Geophys. 26 (3), 78–83. doi:10.1071/eg995078
Oldenburg, D. W., Li, Y. G., and Ellis, R. G. (1997). Inversion of geophysical data over acopper gold porphyry deposit:A case history for Mt.Milligan. Geophysics 62 (5), 1419–1431. doi:10.1190/1.1444246
Olowofela, J. A., Akinyemi, O. D., and Ogungbe, A. S. (2012). Imaging and detecting underground contaminants in landfill sites using electrical impedance tomography (EIT): a case study of Lagos, southwestern, Nigeria. Res. J. Environ. Earth Sci. 4 (3), 270–281.
Pan, K., and Tang, J. (2014). 2.5-D and 3-D DC resistivity modelling using an extrapolation cascadic multigrid method. Geophys. J. Int. 197 (3), 1459–1470. doi:10.1093/gji/ggu094
Pelton, W. H., Ward, S. H., Hallof, P. G., Sill, W. R., and Nelson, P. H. (1978). Mineral discrimination and removal of inductive coupling with multifrequency IP. Geophysics 43 (3), 588–609. doi:10.1190/1.1440839
Puzyrev, V., Koldan, J., de la Puente, J., Houzeaux, G., Vázquez, M., and Cela, J. M. (2013). A parallel finite-element method for three-dimensional controlled-source electromagnetic forward modelling. Geophys. J.Int. 193 (2), 678–693. doi:10.1093/gji/ggt027
Qi, S. S., Li, W. F., Yu, W. J., et al. (2019). Regional geology of qinghai province. Beijing: Geology Press, 50–56.
Qi, X. Y., Zhang, S. Y., and hi, Y. B. (2008). The application of the large power induced polarization sounding method in a Mongolian lead-zinc deposit. Chin. J. Eng. Geophys. 5 (6), 719–723. doi:10.3969/j.issn.1672-7940.2008.06.017
Qinghai Institute of Geological Survey (2015). Qinghai provincial dachaidan executive committee 1:25,000 geochemical measurements in the southern part of sugan lake. Qinghai Institute of Geological Survey.
Qinghai Institute of Geological Survey (2023). Qinghai provincial dachaidan executive committeeinvestigation and evaluation of the sanjiaoding north gold polymetallic mine. Qinghai Institute of Geological Survey.
Ren, W. K., Chao, H. D., Wang, S. Y., Wu, F. S., and Ding, W. C. (2018). Geological,geochemical characteristics and prospecting direction of the sanjiaoding gold district in saishiteng mountain area,qinghai province. Gold 3 (39), 13–17. doi:10.11792/hj20180903
Ren, Z., and Tang, J. (2010). 3D direct current resistivity modeling with unstructured mesh by adaptive finite-element method. Geophysics 75 (1), H7–H17. doi:10.1190/1.3298690
Ren, Z., and Tang, J. (2014). A goal-oriented adaptive finite⁃element approach for multi-electrode resistivity system. Geophys. J. Int. 199 (1), 136–145. doi:10.1093/gji/ggu245
Rowins, S. n. M. (2012). Geoscientists and rodney dangerfield: neither gets any respect. Geosci. Can. 39, 47–51.
Rusk, B. G., Reed, M. H., and Dilles, J. H. (2008). Fluid inclusion evidence for magmatic-hydrothermal fluid evolution in the porphyry copper-molybdenum deposit at butte,Montana. Econom. ic Geol. 103 (2), 307–334. doi:10.2113/gsecongeo.103.2.307
Schmutz, M., Ghorbani, A., Vaudelet, P., and Blondel, A. (2014). Cable arrangement to reduce electromagnetic coupling effects in spectral-induced polarization studies. Geophysics 79 (2), A1–A5. doi:10.1190/geo2013-0301.1
Searle, M. P., Qi, F. J., and Du, Y. G. (1985). Geotectonics in the western Himalayan region. J. Gems and Gemmology (02), 61–68.
Seigel, H. O., Johnson, I., and Hennessey, J. (1984). Different methodology:Geophysical aidsto gold exploration. Lead. Edge 3 (6), 32–35. doi:10.1190/1.1439076
Sheard, S. N., Ritchie, T. J., Christopherson, K. R., and Brand, E. (2005). Mining, environmental, petroleum, and engineering industry applications of electromagnetic techniques in geophysics. Survey in Geophysics 26, 653–669. doi:10.1007/s10712-005-1760-0
Smith, R. (2014). Electromagnetic induction methods in mining geophysics from 2008 to 2012. Surv. Geophys. 35 (1), 123–156. doi:10.1007/s10712-013-9227-1
Strack, K.-M., Lüschen, E., and Kötz, A. W. (1990). Long-offset transient electromagnetic (LOTEM) depth soundings applied to crustal studies in the Black Forest and Swabian Alb, Federal Republic of Germany. Geophysics 55 (7), 834–842. doi:10.1190/1.1442897
Teng, J. W., Yang, L. Q., Yao, J. Q., Liu, C. H., Liu, C., Hang, G. L., and Zhang, M. X. (2007). Deep disscover ore、exploration and exploitation for metal mineral resocrces and its deep dynamical process of formation. Prog. Geophys. 22 (2), 317–334. doi:10.3969/j.issn.0001.5733.2009.07.008
Vallée, A. M., Smith, S. R., and Keating, P. (2011). Metalliferous mining geophysics — state of the art after a decade in the new millennium. Geophysics 76 (4), W31–W50. doi:10.1190/1.3587224
Vaudelet, P., Revil, A., Schmutz, M., Franceschi, M., and Bégassat, P. (2011). Changes in induced polarization associated with the sorption of sodium, lead, and zinc on silica sands. J. Colloid Interface Sci. 360 (2), 739–752. doi:10.1016/j.jcis.2011.04.077
Wang, B. Z., Fu, C. L., Pan, T., Qing, L., YongZhuo, L., and TingTing, J. (2022). Early Paleozoic magmatism in the Saishiteng area, North Qaidam and their constraint on tectonic evolution. Acta Petrol. Sin. 38 (09), 2723–2742. doi:10.18654/1000.0569/2022.09.13
Wang, C. T., Liu, J. D., Zhang, X. Y., and Yang, W. J. (2015). Geological feature and analysis on the ore prospecting in the sanjiaoding gold deposit in the town of lenghu. Gansu Metall. 37 (3), 94–97. doi:10.3969/j.issn.1672-4461.2015.03.030
Wang, D. H., Qin, J. H., Wang, C. H., Liu, S. B., and Jiang, B. (2025). Metallogenic regularity, centennial exploration results of gold deposit in China, and suggestions for a new round of prospecting: research and compilation of “geology of mineral resources of China • gold ore volume”. Acta Geosci. Sin. 46 (1), 20–34. doi:10.3975/cagsb.2024.092401
Wang, H. B., Shao, J. B., Du, P. F., Zhang, Y. F., Guo, X., and Huang, D. (2020). Application of integrated geophysical and geochemical methods in mineral exploration of the eastern Lupa goldfield. Tanzan. Mineral. Explor. 11 (10), 2254–2267. doi:10.3969/j.issn.1674-7801.2020.10.024
Wang, J. L., Lin, P. R., Wang, M., Li, D., and Li, J. H. (2017). Threedimensional tomography using high-power induced polarization with the similar central gradient array. Appl. Geophys. 14 (2), 291–300. doi:10.1007/s11770-017-0618-9
Wang, Z. L., Deng, Y. M., Meng, Y. S., and Liu, R. D. (2019). The application of integrated geophysical prospecting method to the prospecting for concealed orebodies in the north ern area of the Weilasituo copper polymetallic deposit. Geophys. Geochem. Explor. 43 (5), 958–965. doi:10.11720/wtyht.2019.0293
Weller, A., Frangos, W., and Seichter, M. (2000). Three-dimensional inversion of induced polarization data from simulated waste. J. Appl. Geophys. 44 (2/3), 67–83. doi:10.1016/s0926-9851(00)00007-0
Wright, D. A., Ziolkowski, A., and Hobbs, B. A. (2001). “Hydrocarbon detection with a multi-channel transient electromagnetic survey,” in SEG technical Program extented abstracts (Houston, TX, United States Society of Exploration Geophysicists), 1435–1438.
Wu, C. L., Yang, J. Y., Xu, Z. Q., Wooden, J. L., Ireland, T., Li, H. B., et al. (2004). Granitic magmatism on the early paleozoic uhp belt of northern qaidam,nw China. Acta Geol. Sin. 05, 658–774. doi:10.3321/j.issn:0001-5717.2004.05.010
Wu, G. X., Li, S. Y., Ren, Y. S., Chen, G. H., Wang, Y. X., and Lv, Z. G. (2006). The main factors of orebody controlling and lnduced polarization of gold finding effecting in wulaga gold deposit. Prog. Geophys. 21 (4), 1248–1251. doi:10.3969/j.issn.1004-2903.2006.04.031
Wu, S. P. (2008). The petrogenesis of paleozoic granitoids in the north margin of qaidam basin and their orogenic response. Chinese Academy of Geological Sciences.
Xu, C. K. (2011). Discussion on the specificity of metallogenic geological features and prospecting layout in qinghai province. Geol. Explor. 47 (5), 782–793.
Xue, G. Q., Chen, W. Y., Zhou, N. N., and Li, H. (2013). Short-offset TEM technique with a grounded wire source for deep sounding.Chin. J. Geophys 56 (1), 255–261. doi:10.6038/cjg20130126
Yan, J. Y., Teng, J. W., and Lv, Q. T. (2008). Geophysical exploration and application of deep metallic ore resources. Prog. Geophys. 23 (3), 871–891.
Yang, D. C., Wang, L., and Li, Z. Y. (2017). Application of induced polarization intermediate gradient survey in prospecting for lead-zinc deposit in Dingtou Mountain of Qinglong. Geol. Surv. China 4 (6), 89–98. doi:10.19388/j.zgdzdc.2017.06.13
Yatini, L. A. (2013). Influence of potential’s electrode selection on physical modeling of time domain induce polarization(TDIP),case studies of homogeneous isotropic medium. Am. Inst. Phys. 1554, 245–248. doi:10.1063/1.4820331
Yatini, S. D., Laesanpura, A., and Sulistijo, B. (2016). Influence of physical parameters to time domain induced polarization(TDIP) response. AIP Conf. Proc. 1719 (1), 030010–030011. doi:10.1063/1.4943705
Yu, F. C., Ma, G. L., Wei, G. F., Wang, Y. X., and Mei, A. J. (1998). Geological characteristics and ore-controlling factors of the tanjianshan gold deposit. Mineral. Deposits 17 (1), 47–56. doi:10.3969/j.issn.0258-7106.1998.01.005
Zhang, D. Q., Zhang, H., Feng, C. Y., She, H. Q., Li, J. W., and Li, D. X. (2007). Multiple gold mineralization in Tanjianshan gold deposit:Evidence from fluid inclusions. Mineral. Deposits 26 (5), 519–526. doi:10.3969/j.issn.0258-7106.2007.05.004
Zhang, L., Wang, C. T., and Zhang, X. Y. (2016). Mineral prospect investigation report of saishiteng area, lenghu town, qinghai province. Qinghai Institute of Geological Survey.
Zhang, S. D., Lv, Z. B., Lei, Y. X., Wang, L., and Yang, J. (2020). Application of high frequency magnetotelluric sounding and IP intermediate gradient method in gold deposit exploration. Mineral. Explor. 11 (4), 746–750. doi:10.3969/j.issn.1674-7801.2020.04.018
Zhang, X. N., Xu, S. Q., and Liu, H. J. (2010). App lication of high power lP in temediate G radientMethod in a prospecting project of an auore district. Sci. Technol. Eng. 10 (26), 6511–6514. doi:10.3969/j.issn.1671-1815.2010.26.032
Zhou, N., Zhang, Z., Wei, X., and Li, H. (2024). Electrical characteristics of ore-forming intrusion No. 2 in the Xiarihamu magmatic Ni-Cu sulfide deposit in East Kunlun Orogenic Belt. Ore Geol. Rev. 168, 168106066. doi:10.1016/j.oregeorev.2024.106066
Zhou, Y. W., Yan, Y. J., and Chen, X. C. (2021). Multiscale geophysics and mineral system detection: status and progress. Prog. Geophys. 36 (03), 1208–1225. doi:10.6038/pg2021EE0192
Zhu, X. H. (2011). Geochemical and zircon U-Pb dating studies of the volcanics of tanjianshan group in the north qaidam. NorthWest University.
Zhu, X. H. (2017). Application of IP intermediate gradient survey in gold prospecting of sanjiazi. Sci-tech Innovation Prod. (5), 110–113. doi:10.3969/j.issn.1674-9146.2017.05.110
Zhuang, Y. J., Gu, P. Y., Gao, Y. W., Peng, X., He, S. P., and Li, P. T. (2020). Petrogenesis of middle permian gabbro in saishiteng mountain of the northern qaidam basin and its constraint to the time of zongwulong ocean subduction. Acta Petrologica Mineralogica 39 (6), 718–734. doi:10.3969/j.issn.1000-6524.2020.06.004
Keywords: gold mine, apparent resistivity, apparent polarization, induced polarization anomaly, Sanjiaoding, prospecting effect
Citation: Zhou H, Li S, Wang Y, Lu Y, Zhang X, Feng J and Yuan Y (2025) Application of induced polarization gradient measurement in the exploration of the sanjiaotong gold mining area on the northern margin of the Qinghai Tibet Plateau. Front. Earth Sci. 13:1523261. doi: 10.3389/feart.2025.1523261
Received: 06 November 2024; Accepted: 26 February 2025;
Published: 17 April 2025.
Edited by:
Claudia Belviso, National Research Council (CNR), ItalyReviewed by:
Mohamed Abdelsabour Al Deep, National Research Institute of Astronomy and Geophysics, EgyptEma Abraham, Alex Ekwueme Federal University, Ndufu- Alike, Nigeria
Copyright © 2025 Zhou, Li, Wang, Lu, Zhang, Feng and Yuan. This is an open-access article distributed under the terms of the Creative Commons Attribution License (CC BY). The use, distribution or reproduction in other forums is permitted, provided the original author(s) and the copyright owner(s) are credited and that the original publication in this journal is cited, in accordance with accepted academic practice. No use, distribution or reproduction is permitted which does not comply with these terms.
*Correspondence: Shanping Li, bGlzaGFucGluZzE5NTJAMTYzLmNvbQ==