Abstract
The semi-arid Andes of South America are characterized by large areas with glacial and periglacial environments. This study focuses on the distribution and recent dynamics of glacial and periglacial landforms in the Las Veguitas catchment (3000–5500 m), Cordillera Frontal of the Andes, Argentina. A detailed geomorphological map of the catchment is presented, based on high-resolution elevation data (ALOS PALSAR), satellite imagery (WorldView 2), and field studies. First, a topographical analysis is performed for the entire Las Veguitas catchment, including elevation, slope and aspect characteristics. Second, the altitudinal range and predominant aspect of glacial features (perennial snow patches, debris-free glaciers, debris-covered glaciers and supraglacial lakes on debris-covered glaciers) and periglacial features (active, inactive and fossil rock glaciers) are analyzed. Currently, glaciers are restricted to ≥4,000 m, but moraines are identified to elevations of c. 3,200 m and lower. Active rock glaciers extend down to 3,350 m and have a more southern aspect than both inactive and fossil rock glaciers. Third, a temporal analysis of glacier and rock glacier flow in recent decades has been performed using a time series of remote sensing images. The average velocity of glacier flow of the debris-covered Vallecitos glacier is about 5.9 m/yr for the period 2006–2020. The mean velocity of the active part of two large rock glaciers is approximately 0.23 (Franke rock glacier) and 0.74 m/yr (Stepanek rock glacier) for the period 1962–2017.
1 Introduction
The Central Andes of Argentina and Chile (31–35°S) host the most extensive periglacial belt in the Southern Hemisphere (Gruber, 2012), where mountain permafrost distribution is shaped by interactions between climatic patterns, topographic features, and surface/ground characteristics. In this semi-arid region, water supply is crucially tied to the melt of snow, glaciers, and seasonally frozen soils during the dry season (Corte, 1997; Masiokas et al., 2010; Schaffer et al., 2019). Freshwater reservoirs like glaciers and rock glaciers are therefore vital, not only for sustaining ecosystems but also for supporting communities dependent on this water. Global warming poses significant threats to these reservoirs, potentially altering both water availability and chemistry (Sileo et al., 2015; Sileo et al., 2020).
The protection of glacial and periglacial environments in the Andes has grown in societal importance, as reflected by their designation as protected zones in Argentina (República Argentina, 2011:1). Yet, these environments face challenges from climate variability and anthropogenic activities like mining, making it imperative to comprehensively map and monitor their dynamics (Brenning, 2008). Mapping landforms and assessing their recent changes is crucial for understanding the interactions between climatic and geomorphological processes, particularly in mountainous regions where these processes can cause significant ecological and hydrological changes (Barsch et al., 1987).
Rock glaciers in the Andes are significant reservoirs of freshwater, particularly in semi-arid regions where water resources are predominantly supplied by snow and glacier melt during the dry season (Azócar and Brenning, 2010; Schaffer et al., 2019). Similar to other mountain ranges, such as the Alps (Barsch, 1977) and the Himalayas (Jones et al., 2018), rock glaciers in the Andes display dynamic behaviour influenced by permafrost conditions and climatic variability. For example, research conducted in the Alps has emphasized the relationship between ground ice content, surface morphology, and flow dynamics (Barsch, 1977; Janke et al., 2015). Integrating insights from these studies reveals that although Andean rock glaciers exist in distinct climatic and geological conditions, they exhibit key similarities with those found elsewhere.
Although studies of glacial and periglacial processes in the Andes have been conducted since the 1970s (e.g., Corte, 1978; Trombotto et al., 1997; Trombotto et al., 1999; Trombotto et al., 2004; Schrott, 1996), they have largely focused on broad regional overviews or specific sites outside the Las Veguitas catchment. Existing geomorphological maps (e.g., Wayne and Corte, 1983; Trombotto et al., 1997; Trombotto-Liaudat et al., 2020) cover extensive areas but often lack the resolution needed to capture detailed local dynamics. For instance, studies on debris-covered glaciers and rock glaciers, such as those by Janke et al. (2015), provide valuable insights but are limited to Chilean regions or lack temporal assessments of landform evolution in neighbouring areas. More recently, Blöthe et al. (2021), Blöthe et al. (2025) documented surface velocities of active rock glaciers in Cordón del Plata range and in the Valles Calchaquíes region in Argentina. Vivero et al. (2021), demonstrated the value of combining historical aerial photographs and provided surface kinematics from the 1950s to 2019 for the Laguna basin in the Coquimbo region of Chile. Despite these advances, the climatic and topographical nuances of the Las Veguitas catchment remain underexplored, leaving gaps in our understanding of its unique glacial and periglacial features.
This study aims to address these gaps by producing a detailed geomorphological map of the Las Veguitas catchment, focusing on the distribution of glacial and periglacial landforms and evaluating their recent dynamics through remote sensing and field data. The integration of high-resolution imagery with temporal analyses enables us to not only document current landforms but also assess changes over decades. More specifically, the temporal analysis covers the years 1962 and 2017 for the rock glaciers and for the years 2006, 2016 and 2020 for the debris-covered glacier. It offers novel contributions to understanding permafrost dynamics by correlating rock glacier activity with the lower limit of permafrost occurrence. This complements the work of Trombotto et al. (1997) on mountain permafrost monitoring in the broader Cordon del Plata region but advances it with specific spatial data for Las Veguitas. Finally, this study provides an updated perspective compared to the historical focus of Wayne and Corte (1983).
2 Study area
The Las Veguitas catchment is located between 69o 22′–69o 26′ W and 32o 57′–33o 00′ S in the Cordón del Plata range, Cordillera Frontal of the Andes, Argentina (Figures 1A,B). The study area covers approximately 28 km2 and reaches heights of nearly 5,500 m above the present sea level. The highest peaks are Cerro Rincón (5,420 m) and Cerro Vallecitos (5,426 m). The lower limit of the study area is 3,000 m, where streams from the Las Veguitas catchment join the Río Vallecitos/Río Blanco drainage (Figure 1B). The regional geology of Cordón del Plata has been summarized by Heredia et al. (2012). The study region is affected by La Jaula and El Salto east-directed thrust structures (NE-SE) and by the Vallecitos–La Hoyada fault, which has two segments in NE-SE and E-W direction. Bedrock in the Cordón del Plata range is composed of quartzites and related metasediments, rocks of volcanic origin, primarily rhyolites and andesites, and a few plutonic rocks. For the Las Veguitas catchment, bedrock in the southern part is characterized by dark-colorized quartzites, whereas its northern part is dominated by reddish-brown rhyolites (Wayne and Corte, 1983). The study area was extensively glaciated during the Late Quaternary, with morainic complexes of this age found down to 2,650 m in the Río Vallecitos valley. The timing of older and more extensive glacial episodes remains a matter of debate (Wayne and Corte, 1983; Espizúa, 1993; Moreiras et al., 2016). The thermal state of permafrost is monitored in the nearby Morenas Coloradas rock glacier, at elevations between 3,500 and 3,800 m. Active periglacial processes in the form of stripes and sorted circles were observed in the study area at around 4,150 m.
FIGURE 1

(A) Location of study area in S-America (red dot), (B) view of the las Veguitas catchment with toponyms (GL = glacier; RG = rock glacier), location of the Vallecitos weather station and permafrost monitoring sites in the nearby Morenas Coloradas rock glacier (Trombotto and Borzotta, 2009), background source ESRI.
Climatically, the study area is located in the semi-arid Andes of Central South America and serves as a representative case study for other semi-arid catchments in the Central Andes as it shares hydrological, geological, and climatic characteristics with other catchments in the region. There are few high-elevation weather stations in the region and their records are short and/or discontinuous. The nearby Vallecitos weather station (32° 59′ S, 69° 21′W; c. 2,500 m) has a mean annual temperature of 5.9 °C and mean annual precipitation of around 460 mm (Méndez, 2004). Cerro Cristo Redentor weather station (32° 54′ S, 70° 12′ W; 3,830 m) reports −1.7 °C and around 270 mm for these climate variables (Méndez et al., 2006). These numbers roughly represent the 2nd half of the 20th Century. Based on these observations we infer a lapse rate in mean annual air temperature of about 0.6 °C/100 m elevation. Furthermore, mean annual air temperature in the nearby city of Mendoza has increased by c. 1.5 °C since the beginning of meteorological observations till present (1906–2018). The current elevation of the zero annual temperature isotherm is probably at c. 3,800 m (Trombotto-Liaudat et al., 2020).
According to Lliboutry (1998), conditions for areas with this type of climate are short-lived summers and rigorous winters with low temperatures, scarce precipitation and strong winds. With the semi-arid climate, the plant cover in the Las Veguitas catchment is quite open and represented almost exclusively by shrubs, grasses and cushion plants. Denser vegetation is only present in small wetland areas on outwash plains, in slope fens and on stable surfaces of Pleistocene moraines up to 3,600 m, above which vegetation becomes very sparse. The vegetated areas are grazed by wild Guanaco, and a few horses and cows (Kuhry et al., 2022).
3 Materials and methods
Geomorphological mapping is widely used to understand landscape configuration and development (Gustavsson et al., 2006). In order to map the geomorphological processes in the Las Veguitas catchment, an integrated analysis was carried out based on a digital elevation model (DEM), interpretation of satellite images and an aerial photograph (Table 1), and field investigations (November 26–December 18, 2017). All products were projected to the Universal Transverse Mercator (UTM) 19S zone and WGS84 Datum.
TABLE 1
| Type | Date | Resolution | Source |
|---|---|---|---|
| WorldView 2 | 18–03-2017 | 0.5 m | Digital Globe |
| Aerial Photograph | 08–04-1962 | 5 m, 300 DPI,1:50.000 | Military Geographic Institute of Argentina |
| DEM (Alos Palsar) | 2011 | 12.5 m | Earth data Nasa |
| Satellite Imagery | 03–06-2006 Landsat, 20–03-2016 Airbus and 14–12-2020 Airbus | 15 m, 2.5 m and 2.5 m respectively | Google Earth Pro |
Data used in geomorphological mapping and temporal analysis.
The topographic analyses of the study area and the generation of the contours with 300 m intervals are derived from the DEM (Alos Palsar with 12.5 m resolution) using ArcGIS. Similarly, the production of the slope and the aspect map in which we recognize eight 45° aspect intervals, with North defined as 337.5°–22.5°, Northeast 22.5°–67.5°, etc., are also based on the DEM. They are generated through the Spatial Analyst toolbox on ArcGIS for slope (identification of the slope gradient from each cell of the raster) and aspect (derives the aspect from each cell of a raster surface), respectively. The land cover map is based on a maximum likelihood supervised classification and a training set of different land cover classes (see Kuhry et al., 2022).
Detailed field descriptions of landforms were made below the vegetation limit in the Veguitas catchment (<3,700 m), as well as during hikes into high-elevation terrain (up to 4,500 m). These serve as ground truth points for geomorphological mapping of the study area. Based on the georeferenced WorldView 2 image (Digital Globe, 2017) with a total RMS error of 0.9 m, visual interpretations in the field and criteria described in Table 2, we mapped active, inactive and fossil rock glaciers, debris-free glaciers, debris-covered glaciers, supraglacial lakes, moraines, cirques, floodplains, perennial snow patches, and colluvium slopes with talus. For the production of the geomorphological map, landscape elements were digitized as shapefiles (.shp) using ESRI ArcMap version 10.5.
TABLE 2
| Landform type | Identification criteria |
|---|---|
| Debris-free glacier | Exposed ice, crevassed surface, ice cliffs, radial and transverse flow structures, visible firn areas and accumulation zones, and sharp ice margins forming on high mountain slopes or in cirques in Las Veguitas catchment |
| Debris-covered glacier | Features ice under a relatively thin layer of sediments, a chaotic surface, and exposed ice at the surface due to the discontinuity of debris or thermokarst depressions among other features |
| Perennial snow | Present all year around, usually located in high elevations, shaded slopes, and near glaciers in Las Veguitas catchment |
| Supraglacial lakes | Water bodies that form on the surface of glaciers, often within depressions in the ice or between debris mounds and are surrounded by cryo-sediments in debris-covered glaciers; they vary seasonally, contribute to meltwater flow, and may drain suddenly via englacial or subglacial channels |
| Moraines | Linear or arcuate ridges of cryo-sediments and rock debris deposited by glacier movement, composed of unsorted materials (till), with no internal ice or structured layering; they mark former glacier margins, often forming lateral, medial, or terminal accumulations across valleys and slopes |
| Active rock glacier | Consists of cryo-sediments, a structured upper layer, can have thermokarst lakes, showing ongoing movement expressed by transverse ridges and furrows, a steep front (>30°), and a lobed shape along valleys or slopes |
| Inactive rock glacier | Consists of cryo-sediments, show no evidence of recent movement expressed geomorphologically as a reduction of the front angle (<30°), softened relief, and possibly inactive thermokarst features |
| Fossil rock glacier | Consists of cryo-sediments, show no evidence of recent movement expressed geomorphologically as a reduction of the fossil front angle (<20°), a chaotic surface pattern, and have oriented large angular blocks on its surface in the Las Veguitas catchment |
| Talus | Steep accumulation of angular, loose rock fragments at the base of cliffs or steep slopes, with no root zone or movement, often forming cone- or fan-shaped bodies with high surface roughness and no transverse ridges |
Identification criteria of landforms (based on Trombotto et al., 2014; Trombotto-Liaudat et al., 2020).
For the geomorphology map, distinctive landscape features are marked by symbols (glacier cirques and larger talus cones). In addition to exposed bedrock and slopes with colluvium, we have mapped the surface areas occupied by landforms of glacial character (perennial snow patches, debris-free glaciers with exposed surface ice, debris-covered glaciers, supraglacial lakes on debris-covered glaciers, moraines and glacio-fluvial outwash plains) and periglacial landforms (larger and smaller rock glaciers). The larger rock glaciers can be subdivided into their active, inactive and fossil parts.
The aerial photograph was orthorectified using ArcGIS Pro’s Ortho Mapping tools. A single historical photograph, taken on April 8, 1962, with a Wild RC-5 camera, was used. Camera calibration parameters were entered manually, including a focal length of 152.38 mm, and an approximate pixel size of 84.67 microns derived from a scan resolution of 300 dpi. As no lens distortion or principal point offset values were available, these parameters were assumed to be zero. Interior orientation was computed using visible fiducial marks on the scanned image. A high-resolution Digital Elevation Model (DEM, Alos Palsar, 12.5 m) was aligned with the photo. As only a single image was processed, an orthomosaic was not created. To ensure more accurate measurements, we used ground control points (GCPs) in the immediate vicinity of the investigated rock glacier features. The 3rd Order Polynomial algorithm was used in georeferencing as it is commonly used for complex, non-linear distortions. The Root Mean Square (RMS) error was 0.9 m. A low RMS error indicates better spatial accuracy and, in general, measures how well the georeferenced points align with the real-world coordinates. The GCPs were identified in the WorldView-2 image acquired in 2017, which served as the spatial reference layer.
For glacier flow, we counted, mapped and calculated the size of the supraglacial lakes on the debris-covered Vallecitos glacier using Google Earth imagery for the years 2006, 2016 and 2020. Based on the centroid of the lakes, the distance was measured in ArcGIS software. Due to the low resolution of the aerial photograph from 1962, these relatively small landscape features could not be identified, thus the analysis relied solely on Google Earth Pro imagery. For the Stepanek and Franke rock glacier flow, we used the displacement of large surface features like lobes and ridges on a scanned and georeferenced 1962 aerial photo and the Worldview02 2017 image. To evaluate the reliability of these measurements, we calculated the Level of Detection (LoD) at the 95th percentile (Blöthe et al., 2025) using 10+ displacement measurements from stable terrain surrounding the two rock glaciers Supplementary Figure S1 (Supplementary file). This approach provided a robust threshold for distinguishing true glacier movement from potential georeferencing and measurement error.
The velocity (v) of the glacier and rock glaciers within the study area was calculated with the Equation 1:
Where.
• v is the velocity (m/yr)
• d is the displacement (distance moved by the marker, in meters)
• t is the time interval in years
Finally, the velocity uncertainty (σu) for the glacier flow, was calculated using the following Equation 2 (Jones et al., 2009; Jones et al., 2011):
Where.
• σD is the uncertainty in displacement in meters (m)
• represent the image pixel size in meters (m)
• RMS1 and RMS2 represent the image georeferenced error in meters (m)
• t is the time interval in years (yr)
4 Results
4.1 Topographic and environmental setting of the study area
The topographic map (Figure 2A) shows the relief of the Las Veguitas catchment by 300 m contour lines. The study area extends from 3,000 m to almost 5,500 m. The slope map (Figure 2B) shows steeper slopes shaded in blue, whereas yellow represents very gentle slopes. Particularly evident are the broad and flat valleys (in yellow), typical of U-shaped terrain in (previously) glaciated terrain. The aspect map (Figure 2C) displays 45° orientation intervals. Since the study area is draining the North to South running Cordon del Plata range towards the East, areas with a western aspect are clearly under-represented. The land cover map (Figure 2D) shows the five main classes that were recognized in the study area: Snow/Ice, Barren Land, Sparse Vegetation, Dense Vegetation and Wetland (Kuhry et al., 2022). The limit of sparse vegetation is found on stable surfaces at an altitude of around 3,600 m, although single specimens of vascular plants and some lichens have been observed up to around 3,900 m. The tall shrub limit (plant height 70–100 cm) is located at elevations of around 3,250 m. Peaty wetland areas are found on outwash plains from glaciers/rock glaciers with a perennial supply of water, up to an elevation of around 3,300 m.
FIGURE 2

(A) Digital elevation model for the study area (contours 300 m); (B) slope map in degrees; (C) aspect map (eight classes); (D) land cover map (five classes), after Kuhry et al. (2022). Toponyms as in Figure 1B.
4.2 The geomorphological map
Figure 3 presents the distribution of the main glacial and periglacial landforms in the Las Veguitas catchment. We mapped the following features: 4 glacier cirques, perennial snow, 8 debris-free glaciers, debris-covered ice, supraglacial lakes, lateral moraines, medial moraines, terminal moraines and outwash plains for the glacial landforms. The periglacial landforms that we observed are small active rock glaciers and large rock glaciers subdivided into active, inactive and fossil parts, colluvium with talus and exposed bedrock.
FIGURE 3

Geomorphological map of the Las Veguitas catchment (Cordillera Frontal of the Andes, Argentina). The rectangle marks the area with morainic systems depicted in Figure 4.
FIGURE 4

Morainic systems in the lower portion of the Las Veguitas catchment (Cordillera Frontal of the Andes, Argentina). For location of the mapped area, see Figure 3.
The inset in Figure 3 marks the location of an extensive system of lateral, medial and terminal moraines in the lower part of the study area, which is reproduced in greater detail in Figure 4. Figure 3 also highlights the current largest glacial feature (Vallecitos glacier, with supraglacial lakes), the large rock glaciers (Infiernillo, Stepanek, Franke, A and B) as well as smaller rock glaciers (1–11).
4.3 The Las Veguitas morainic complexes
Former glacial advances are not the focus of this study. Nevertheless, the landscape superimposition of rock glacier features over morainic systems provides an interesting tool for the relative dating of these landforms.
At high elevations, a lateral moraine flanks the southeastern margin of the Vallecitos debris-covered glacier between around 4,500–4,200 m. Lateral moraines are also found along the northern and southern edges of the active part of the Infiernillo rock glacier, down to elevations of around 3,900 m (Figure 3). Figure 4 shows the most impressive systems of moraines found between 3,700 and 3,200 m, in what is known as the Veguitas area proper. The youngest of these moraines, proposed to be of Neoglacial age (Wayne and Corte, 1983), is found at an elevation of around 3,700–3,600 m, in the western portion of the mapped area, where it is overridden by the small active rock glacier #10 (Figure 3). Further down (multiple) lateral morainic ridges of the Vallecitos II stage (19.000–13.000 B.P.), suggested to be Late Pleistocene in age (Wayne and Corte, 1983), can be found between around 3,600–3,500 m, with a weakly developed terminal moraine (mostly a line of erratics) at around 3,450 m (Supplementary Figure S2E). Also in this case, a portion of the lateral moraine located at an elevation of around 3,550 m has been covered by the terminus of rock glacier #11 (Figure 3; see also Supplementary Figure S1D). More lateral moraines, some medial moraines and terminal moraines of the Vallecitos II stage are found down to elevations of around 3,200 m (Supplementary Figure S2F). The Late Pleistocene age of the Vallecitos II stage is corroborated by cosmogenic dating of similar morainic complexes in the nearby Angostura valley (Moreiras et al., 2016). It is important to note that the glacier that formed the Vallecitos II stage moraines did not occupy the full width of the U-shaped valley, which indicates earlier and even more extensive glacier advances. The oldest, most subdued, moraine depicted in Figure 4 corresponds to a lateral moraine flanking the northwestern edge of the Franke valley (Supplementary Figure S1G). Based on boulder-weathering criteria, this moraine was correlated by Wayne and Corte (1983) with terminal moraines of the Vallecitos I stage (>40.000 B.P.) just above the Vallecitos weather station at around 2,650 m (Figure 1B).
4.4 Spatial analyses of glacial and periglacial landform distribution
Figure 5A shows the altitudinal distribution of four types of current glacial landforms (perennial snow patches, debris-free glaciers, debris-covered glaciers and supraglacial lakes on debris-covered glaciers) within the study area. Debris-free glaciers and snow patches are found above c. 4,200 m, the debris-covered glaciers extend down to c. 4,000 m, with the supraglacial lakes on the debris-covered glaciers confined to an altitudinal range between around 4,350 and 4,700 m. Areas of debris-free glaciers and snow patches have a southeastern and southern aspect, respectively, whereas those of debris-covered glaciers and supraglacial lakes on debris-covered glaciers are predominantly oriented towards the East (Figures 6A–D). The large debris-covered Vallecitos glacier currently terminates at around 4,200 m.
FIGURE 5
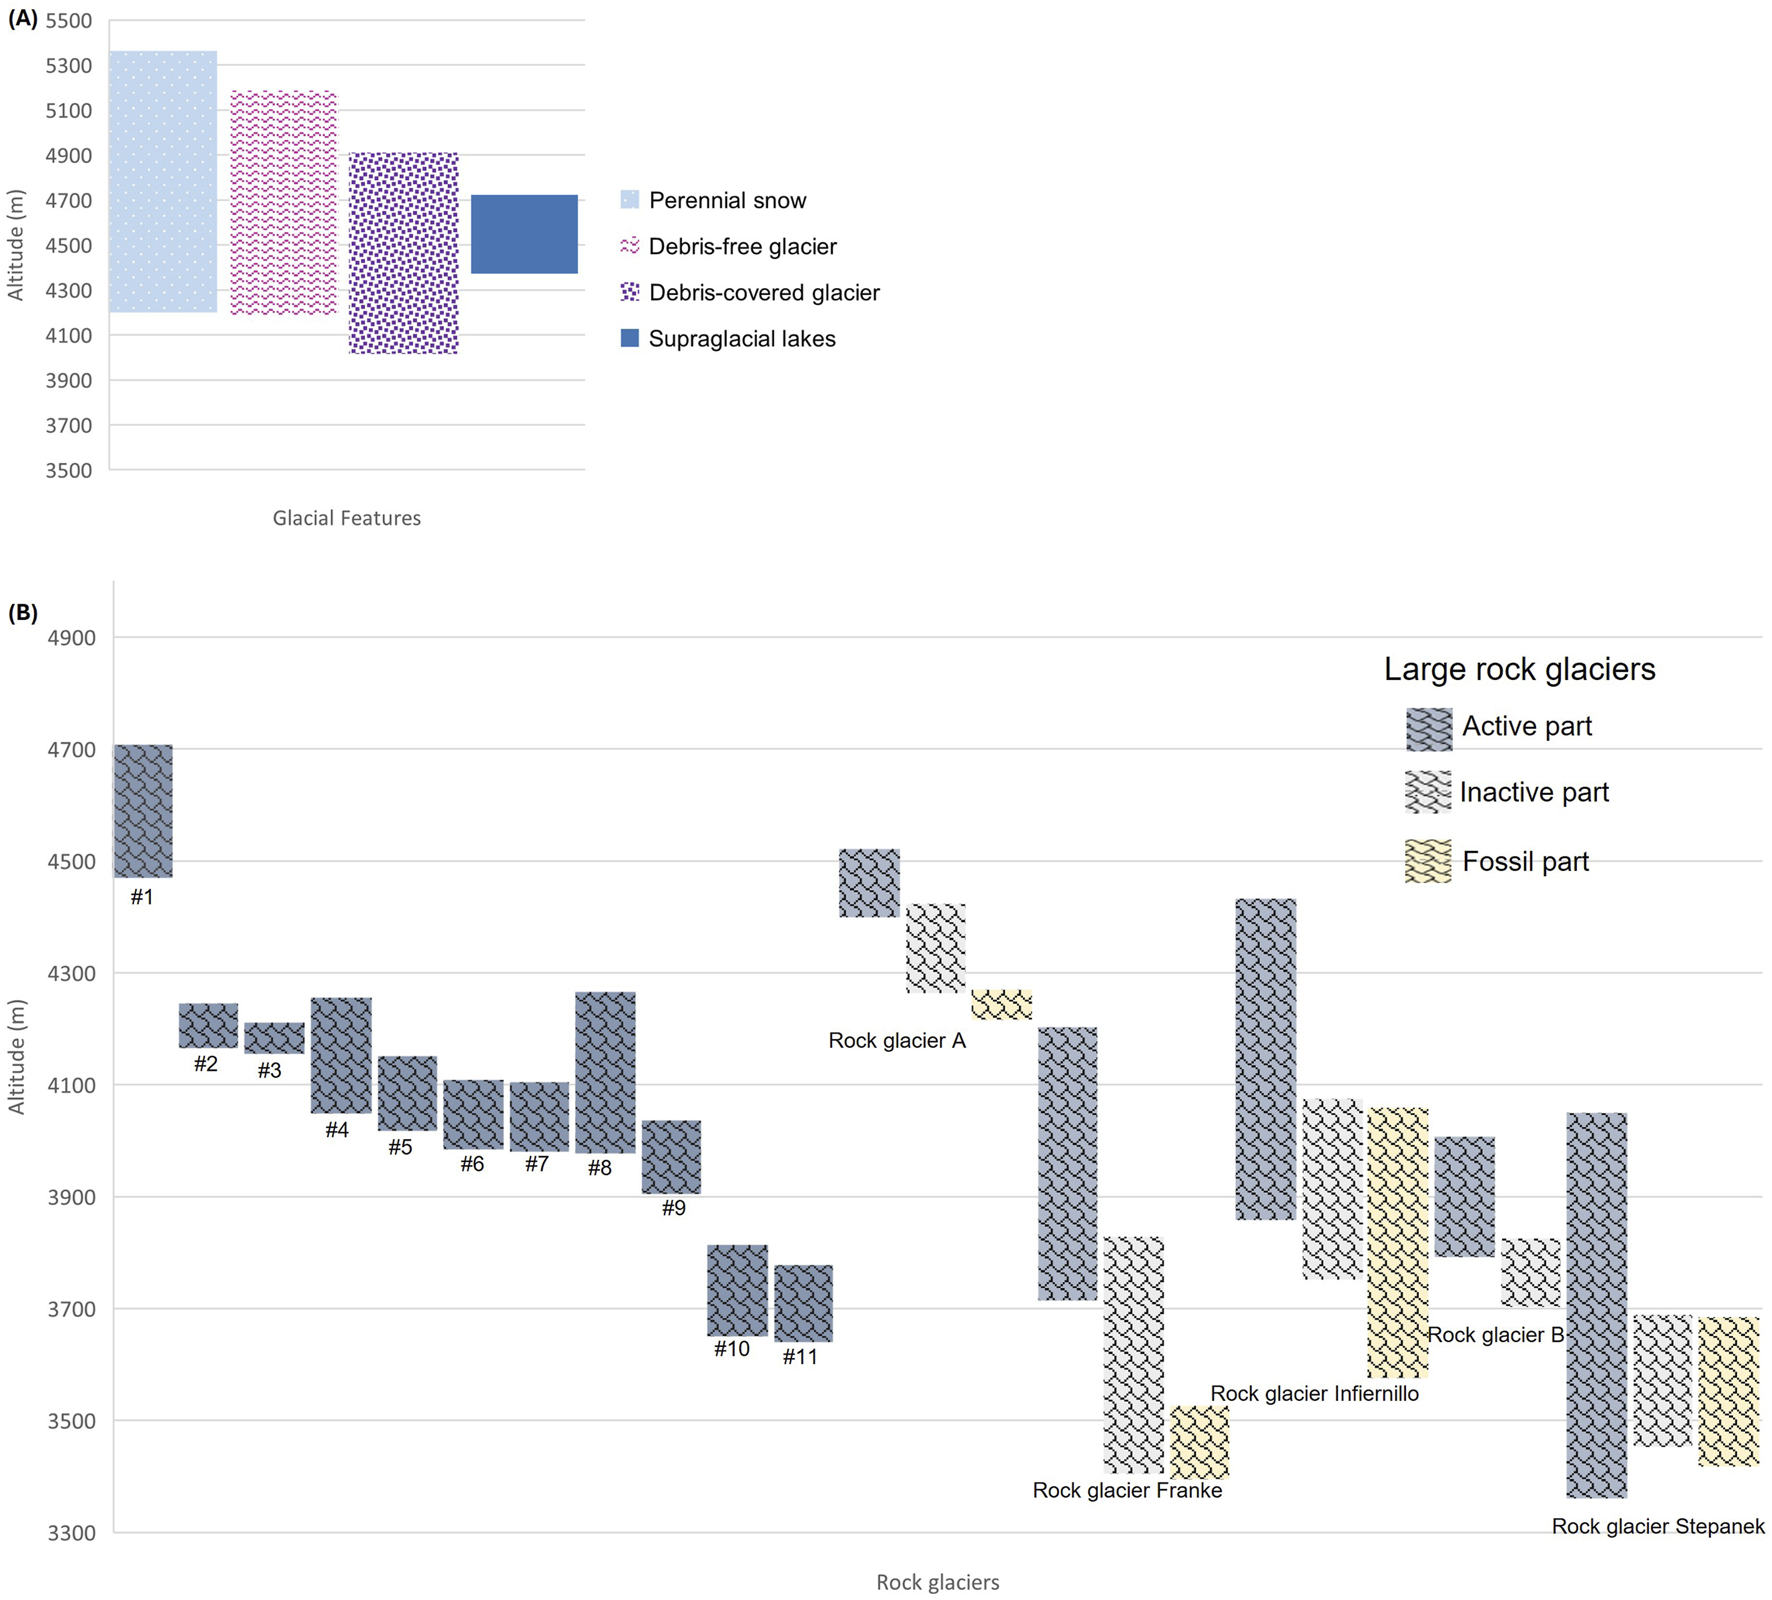
Altitudinal distribution of (A) four types of current glacial features and (B) smaller active rock glaciers and larger rock glaciers (subdivided into active, inactive and fossil parts), in the Las Veguitas catchment (Cordillera Frontal of the Andes, Argentina).
FIGURE 6

Orientation (in percent area for each aspect interval) of the study area as a whole (blue), in comparison with that of (A–D) glacial landforms and (E–H) rock glaciers (orange).
The lower limit of permafrost in the study area is the front of the active Stepanek rock glacier at about 3,350 m. Some of the smaller rock glaciers in the area terminate at around 3,650 m. A detailed analysis has been performed for the elevation and aspect of individual rock glaciers. The 11 smaller rock glaciers are all considered active. There are five larger rock glaciers, which have been subdivided into their active, inactive and/or fossil parts (Stepanek, Franke, Infiernillo, A and B). Figures 5B, 6E–H show the distribution with elevation and the orientation of these rock glaciers (and their subdivisions). For the location of the rock glaciers see Figure 3.
Most of the smaller active rock glaciers in the study area are located at altitudes above 3,900 m, the only exceptions being the two small rock glaciers #10 and #11 (Figure 5B). These have a distinctly southern aspect (Figure 3). Almost all the smaller rock glaciers rock glaciers have a predominantly South to East aspect (Figure 6E) and are flanked on their northern side by steep mountain bedrock (reducing incoming solar radiation). The one exception is rock glacier #1, which has a northern aspect but is found at elevations greater than 4,400 m (Figure 3).
Among the larger rock glaciers, the active part of Stepanek reaches the lowest elevation (terminus located at around 3,350 m). This rock glacier is flanked on its northern and northeastern side by steep mountain bedrock, and its terminus has a distinct southern aspect. As in the case with the smaller active rock glaciers, the active parts of the larger rock glaciers have often a predominant southeastern component in their aspect (Figure 6F). The exceptions are the active parts of Franke rock glacier with a northeastern aspect and of the Infiernillo rock glacier with an eastern aspect, but both are restricted to elevations of >3,900 m (Figures 3, 5B, 6F). The active and fossil parts of the larger rock glaciers are generally located between 3,400 and 4,100 m and have a more eastern to northeastern aspect. An exception is the active/fossil parts of rock glacier A that are located above 4,200 m (Figures 3, 5B, 6G,H). These anomalous high elevations can be tentatively explained by the lack of steep bedrock slopes to the immediate north of rock glacier A (for location, see Figures 2B, 3).
4.5 Temporal analysis of glacial and periglacial landform dynamics
For the temporal analysis of glacier flow, the focus has been the displacement of supraglacial lakes in the debris-covered part of the Vallecitos glacier (for location see Figure 3; see also Supplementary Figure S2C). The number of supraglacial lakes increased from 8 in 2006 to 12 in 2020. In 2020, this number had risen to 18. For the analysis of glacier flow between 2006 and 2020, five lakes were selected because they were persistent and could easily be recognized despite varying snow cover over the years of observation (Figure 7). The size of these five supraglacial lakes has consistently increased over time between 2006 and 2020, regardless of their location on the glacier, with lakes #3 and 5 decreasing somewhat in size between 2016 and 2020 (Table 3). The centroid of each supraglacial lake was used to calculate their distance of displacement from 2006 to 2020 (Table 4). The mean velocity of the debris-covered part of the Vallecitos glacier is 5.9 m/yr with an interesting observation that glacier flow velocities seem to have decreased since 2016. The velocity uncertainty for the years 2006–2016 is 6.05 m/yr, 14.6 m/yr for 2016–2020 and 4.3 m/yr for 2006–2020. While the velocities calculated for 2016–2020 are within the velocity uncertainty, and therefore not statistically valid, the results from 2006 to 2020 are valid and this longer time period shows a reduction in velocity compared to the 2006–2016 period indicating that glacier flow velocities have decreased since 2016. These results assume consistent georeferencing accuracy (RMS error ±41.5 m and pixel size 15 m for 2006 and 2.5 m for 2016 and 2020) for Google Earth images (Potere, 2008).
FIGURE 7

Displacement of five supraglacial lakes on the Vallecitos debris-covered glacier between 2006, 2016 and 2020.
TABLE 3
| No. Lake/Year | 2006 (ha) | 2016 (ha) | 2020 (ha) |
|---|---|---|---|
| 1 | 0.024 | 0.038 | 0.063 |
| 2 | 0.028 | 0.100 | 0.110 |
| 3 | 0.003 | 0.040 | 0.014 |
| 4 | 0.009 | 0.048 | 0.056 |
| 5 | 0.018 | 0.039 | 0.034 |
Size of selected supraglacial lakes on the debris-covered glacier for the years 2006, 2016 and 2020.
TABLE 4
| No. Lake/Year | 2006–2016 (m/yr) | 2016–2020 (m/yr) | 2006–2020 (m/yr) |
|---|---|---|---|
| 1 | 4.80 | 4.31 | 4.67 |
| 2 | 6.20 | 4.64 | 5.71 |
| 3 | 7.40 | 2.23 | 6.7 |
| 4 | 6.69 | 4.21 | 5.9 |
| 5 | 7.22 | 4.29 | 6.34 |
The velocity and the velocity uncertainty of glacier flow in m/yr deducted from the displacement of the selected supraglacial lakes for the years 2006, 2016 and 2020.
For rock glacier flow, we focused on the Stepanek and Franke rock glaciers (for location see Figure 3). Their downward movement was assessed by measuring the displacement of prominent ridges and lobes that could be recognized both in the 1962 aerial photograph and the 2017 satellite image. Figure 8 shows the displacement of three distinct features on the Stepanek rock glacier between 1962 and 2017. The mean velocity of the Stepanek rock glacier over these 55 years has been 0.74 m/yr and ranged between 0.51 and 1.15 m/yr (Table 5). The Level of Detection (LoD), estimated from 12 stable ground points using the 95th percentile, was 0.47 m/yr, indicating that all measured displacements on Stepanek exceed the detection threshold and are thus significant. For the Franke rock glacier, we used three points (Figure 9). The mean velocity was 0.23 m/yr and ranged between 0.16–0.30 m/yr (Table 6). The calculated LoD for Franke was 0.23 m/yr based on 13 stable ground points, placing the lowest velocity at the detection threshold. Overall, the results clearly show that the Stepanek rock glacier is moving at a significantly higher rate than the Franke rock glacier.
FIGURE 8

Stepanek rock glacier flow, between 1962 and 2017. Numbering refers to Table 5.
TABLE 5
| Location nr. | Displacement (m) | Velocity (m/yr) |
|---|---|---|
| 1 | 30.50 | 0.56 |
| 2 | 28.20 | 0.51 |
| 3 | 63.51 | 1.15 |
| Mean | 40.73 | 0.74 |
Mean velocity calculations for Stepanek rock glacier (1962–2017).
FIGURE 9

Franke rock glacier flow, between 1962 and 2017. Numbering refers to Table 6.
TABLE 6
| Location nr. | Displacement (m) | Velocity (m/yr) |
|---|---|---|
| 1 | 9.04 | 0.16 |
| 2 | 12.77 | 0.23 |
| 3 | 16.95 | 0.30 |
| Mean | 12.84 | 0.23 |
Mean velocity calculations for Franke rock glacier (1962–2017).
5 Discussion
In this study, we produced a detailed geomorphological map of the Las Veguitas catchment, focusing on the distribution of glacial and periglacial landforms and evaluating their recent dynamics. We highlighted spatial patterns in rock glacier distribution tied to elevation and aspect, as well as the transition from glacial to periglacial regimes. Our results were compared to the national glacier inventory of Argentina (Inventario Nacional de Glaciares, ING), which is the most authoritative dataset available. Both inventories identify debris-free glaciers (called exposed glaciers in the ING), debris-covered glaciers, active and inactive rock glaciers. A key difference is that the ING includes a combined category for debris-covered glaciers and rock glaciers when these cannot be easily differentiated, whereas our inventory consistently distinguishes between these two landform types. By maintaining separate categories, our inventory provides a more nuanced understanding of cryospheric processes in the Las Veguitas catchment and facilitates clearer comparisons of landform dynamics and hydrological contributions across glacial and periglacial environments. Additionally, our classification of rock glaciers includes three subcategories—active, inactive, and fossil—based on observed surface morphology and movement, while debris-covered glaciers are treated as a distinct category. Another important methodological difference is that our glacier outlines include frontal and lateral slopes, resulting in larger mapped surface areas compared to the ING inventory, which excludes these features. Furthermore, the ING classifies the Franke rock glacier only as an active debris glacier, while our study identifies and maps its inactive and fossil components as well. The features we mapped as debris-free glaciers correspond to the ING’s “exposed glaciers” category, although they are generally small in size. In addition to the features identified in the ING, our study includes several additional glaciers and glacier fragments. These were mapped using high-resolution WorldView-2 satellite imagery and verified through field observations. The enhanced spatial resolution and local ground-truthing enabled the identification of smaller or more fragmented glacial features that may have been omitted in the ING due to resolution limitations or classification thresholds. These additions contribute to a more comprehensive understanding of the catchment’s cryospheric processes. Finally, our analysis provides more detailed information on landform morphology and recent surface changes.
More specifically, a detailed temporal analysis of glacier and rock glacier flow dynamics was performed. For example, the displacement of prominent ridges and lobes on the Stepanek rock glacier between 1962 and 2017 was quantified, revealing an average surface velocity of 0.74 m yr-1. This rate is consistent with observations from rock glacier lobes in Morenas Coloradas (Trombotto and Bottegal, 2019) and in other mountain ranges, such as the Alps (Barsch, 1977) and Alaska (Wahrhaftig and Cox, 1959; Meng et al., 2023) and in Tibetan Plateau (Hu et al., 2023). However, the integration of ground-based techniques can provide valuable insights into subsurface ice content and stratigraphy, enhancing the understanding of rock glacier dynamics. Studies conducted in Colorado (Brown, 1925) and in Alps (Hausmann et al., 2007) show that these techniques can assist in better understanding rock glacier dynamics. Furthermore, regional studies contextualize these findings. Blöthe et al. (2021), Blöthe et al. (2025) analysed surface velocities of rock glaciers in the Central Andes of Argentina and in Valles Calchaquíes region, reporting similar movement magnitudes.
The findings from the Las Veguitas catchment underscore the critical role of rock glaciers as indicators of climate change and as contributors to water resources in semi-arid mountain regions. The increase in the size of supraglacial lakes observed on debris-covered glaciers suggests that these features are responding to rising mean annual temperatures. Studies from the Tibetan Plateau and Alaska reported an increase in lake numbers over the past decades (Jones et al., 2011; Luo et al., 2022). Zhou et al. (2024) linked the increase in numbers and size to rising temperatures and precipitation. Additionally, the glacier flow from the debris-covered glacier in Las Veguitas catchment showed a slowdown since 2016 as higher temperatures can enhance surface melt which may initially increase basal sliding; however, over time, glacier thinning and reduced ice thickness can slow movement (Flowers, 2018).
Previous studies in the San Juan Andes provide additional spatial variability in the distribution of rock glaciers due to differences in elevation and aspect (Angillieri, 2016). These findings complement the results from Las Veguitas, where southern and southeastern aspects were associated with lower permafrost limits. Angillieri (2016) confirmed that lower permafrost limits are associated with southern and southeastern aspects by mapping over 500 active rock glaciers with south or east facing aspect between 3,500 and 4500 m a.s.l. in San Juan.
This study also highlights the transition from a glacial to periglacial regime in the Las Veguitas catchment. The presence of small rock glaciers overriding lateral moraines in the NW corner of the Veguitas area proper (Figure 4) is particularly notable. Rock glacier #11 appears to override a lateral moraine of late MIS2 age, while rock glacier #10, which has a more intact appearance, overrides a lateral moraine of purportedly Neoglacial age. These observations suggest a considerable glacial advance during the Late Holocene, followed by retreat and the subsequent development of rock glaciers. These dynamics are consistent with other parts of the Andes, where the interplay of glacial and periglacial processes is shaped by climatic fluctuations (Trombotto and Borzotta, 2009) and in the Eastern Swiss Alps, where parts of the Bleis Marscha rock glacier were found to override older glacial landforms, including moraines (Amschwand et al., 2021).
The error analysis using the Level of Detection (LoD) method revealed clear differences between the two study sites. The velocities at Stepanek rock glacier exceed the 95th percentile LoDs, which strongly supports the conclusion of active displacement over the 55-year period. Conversely, the lower velocities recorded at Franke rock glacier were within or near the uncertainty thresholds. This suggests either lower activity levels or limitations in detecting small displacements due to co-registration inaccuracies or image quality of the 1962 aerial photo. Furthermore, these average velocities do not reflect potential interannual variability, as rock glacier movement can fluctuate significantly depending on annual meteorological conditions (Trombotto and Bottegal, 2019). These results underline the necessity of detailed error assessments in long-term glacier kinematic studies, especially when relying on manually digitized points and historical aerial imagery.
While this study provides valuable insights, several knowledge gaps remain. For instance, the stratigraphy and ice content of debris-covered glaciers versus rock glaciers in the Andes need further exploration. Investigating the flow dynamics and ice content in the Las Veguitas catchment could enhance the understanding of active zones between debris-covered glaciers and rock glaciers.
Additionally, there is a need for chronological dating of glacial and periglacial features in the area. Cosmogenic dating, as applied by Moreiras et al. (2016) in neighbouring valleys, provide valuable temporal context for understanding the evolution of these landforms. Initiating permafrost monitoring in the Las Veguitas catchment, similar to efforts in the nearby Morenas Coloradas rock glacier (Trombotto and Borzotta, 2009), would offer critical data on the thermal state of permafrost and its implications for hydrological and geomorphological assessments in the region.
6 Conclusion
This study presents a Geographic Information Systems (GIS) based geomorphological map of the glacial and periglacial landforms in the Las Veguitas catchment, Cordillera Frontal of the Andes, Argentina. The area is located between 3,000 and 5,500 m, in the semi-arid morphoclimatic region of the Andes. The mapping is based on interpretation of remote sensing data (ALOS PALSAR, Worldview 2, Google Earth, aerial photo) and field observations. This combined dataset allows a detailed topographic (elevation and aspect) analysis of landforms, as well as an assessment of their recent dynamics.
The main glacial and periglacial landforms in the Las Veguitas catchment are cirques, debris-free glaciers, debris-covered glaciers (with supraglacial lakes), small rock glaciers, large rock glaciers (with active, inactive and fossil parts), moraines and outwash plains. Currently, debris-free glaciers are located between 5,200 and 4,200 m, below well-developed cirques and they are facing mostly to the southeast. The debris-covered glaciers are located between 4,900 and 4,000 m, with supraglacial lakes developing on their surfaces between 4,700 and 4,350 m. Both the debris-covered glaciers and the supraglacial lakes have a predominant eastern aspect. The mean velocity of flow for the debris-covered part of the large Vallecitos glacier was estimated at 5.9 m/yr. Morainic ridges are found flanking the current glaciers at high elevation (>4,200 m), but also at lower elevations providing evidence for former glacial advances. Particularly, the lower part of the study area between 3,700 and 3,200 m is characterized by extensive morainic systems that have tentatively been dated to Neoglacial, MIS2 and older ages in previous studies.
Almost all active parts of rock glaciers that exist in the Las Veguitas catchment are located at altitudes above 3,900 m, with the exceptions being two small active rock glaciers (terminus at around 3,650 m) and the lower part of the large Stepanek rock glacier (terminus at around 3,350 m). These low elevations can be explained on account of their southeastern to southern orientation. The terminus of the Stepanek rock glacier at approximately 3,350 m, marking the lower limit of permafrost in the study area, well below the estimated current zero mean annual temperature isotherm at c. 3,800 m. This low limit can be ascribed to the special insulation effect of debris cover on rock glaciers, permafrost creep, as well as the southern aspect of the lower reaches of this rock glacier. The active parts of rock glaciers with a more northern aspect, like the Franke rock glacier; are located at higher elevations. The rock glacier flow in the Las Veguitas catchment was calculated for the active parts of the Stepanek and Franke rock glaciers, with mean velocities of 0.74 m/yr and 0.23 m/yr, respectively.
We conclude that the glacial and periglacial landforms of the Las Veguitas catchment can be considered a prime target for further research to determine the absolute age of Late Quaternary and Holocene glacial advances, the type of (peri-)glaciation in relation to glacial-interglacial climatic regimes, the development and dynamics of large and small rock glaciers, as well as the monitoring of the thermal state of permafrost. Glacier melt and permafrost degradation could have a profound effect on (sub-)surface hydrology, stream discharge and water chemistry, affecting vital freshwater resources in the semi-arid Andes.
Statements
Data availability statement
Additional information for the analysis can be found in Supplementary Material. Further inquiries can be directed to the corresponding author.
Author contributions
EM: Conceptualization, Data curation, Formal Analysis, Investigation, Methodology, Software, Visualization, Writing – original draft, Writing – review and editing. DT: Investigation, Supervision, Writing – review and editing. PK: Conceptualization, Funding acquisition, Investigation, Supervision, Writing – review and editing.
Funding
The author(s) declare that financial support was received for the research and/or publication of this article. Fieldwork and analyses were supported by the European Union (EU) Joint Programming Initiative (JPI) “Climate Constraining Uncertainties in the Permafrost–Climate Feedback (COUP)” consortium.
Acknowledgments
We would like to thank Mr. Didac Pascual Descarrega (Department of Physical Geography, Stockholm University) for assistance during fieldwork and Ms. Sandra Viviana Muñoz (Refugio San Bernardo) for her hospitality and support. Finally, we would like to thank the editor and the reviewers for their valuable feedback.
Conflict of interest
The authors declare that the research was conducted in the absence of any commercial or financial relationships that could be construed as a potential conflict of interest.
Generative AI statement
The author(s) declare that no Generative AI was used in the creation of this manuscript.
Any alternative text (alt text) provided alongside figures in this article has been generated by Frontiers with the support of artificial intelligence and reasonable efforts have been made to ensure accuracy, including review by the authors wherever possible. If you identify any issues, please contact us.
Publisher’s note
All claims expressed in this article are solely those of the authors and do not necessarily represent those of their affiliated organizations, or those of the publisher, the editors and the reviewers. Any product that may be evaluated in this article, or claim that may be made by its manufacturer, is not guaranteed or endorsed by the publisher.
Supplementary material
The Supplementary Material for this article can be found online at: https://www.frontiersin.org/articles/10.3389/feart.2025.1533336/full#supplementary-material
References
1
Amschwand D. Ivy-Ochs S. Frehner M. Steinemann O. Christl M. Vockenhuber C. (2021). Deciphering the evolution of the Bleis Marscha rock glacier (Val d'Err, eastern Switzerland) with cosmogenic nuclide exposure dating, aerial image correlation, and finite element modeling. Cryosphere15, 2057–2081. 10.5194/tc-15-2057-202
2
Angillieri M. Y. E. (2016). Permafrost distribution map of a San Juan Dry Andes (Argentina) based on rock glacier sites. J. S. Am. Sci.73, 42–49. 10.1016/j.jsames.2016.12.002
3
Azócar G. F. Brenning A. (2010). Hydrological and geomorphological significance of rock glaciers in the dry andes, Chile (27o-33o S). Permafr. Periglac. Process.21, 42–45. 10.1002/ppp.669
4
Barsch D. (1977). Nature and importance of mass wasting by rock glaciers in Alpine permafrost environments. Earth Surf. Process.2, 231–245. 10.1002/esp.3290020213
5
Barsch D. Fischer K. Stäblain G. (1987). Geomorphological mapping of high mountain relief, Federal Republic of Germany. Mt. Res. Dev.7, 361–374. 10.2307/3673285
6
Blöthe J. H. Halla C. Schwalbe E. Bottegal E. Trombotto Liaudat D. Schrott L. (2021). Surface velocity fields of active rock glaciers and ice-debris complexes in the Central Andes of Argentina. Earth Surf. Process. Landf.46(2), 504–522. 10.1002/esp.5042
7
Blöthe J. H. Falaschi D. Vivero S. Tadono T. (2025). Rock Glacier kinematics in the Valles Calchaquíes region, northwestern Argentina, from multi-temporal aerial and satellite imagery (1968–2023). Permafr. Periglac. Process.36 (1), 123–136. 10.1002/ppp.2260
8
Brenning A. (2008). The impact of mining on rock glaciers and glaciers: examples from Central Chile. In: OrloveB. S.WiegandtE.LuckmanB., editors. Darkening peaks: glacier retreat, science, and society. Berkeley: University of California Press. p. 196–205.
9
Brown W. H. (1925). A probable fossil glacier. J. Geol.33, 464–466. 10.1086/623211
10
Corte A. E. (1978). La distribucion de los glaciares, glaciares cubiertos y/o de escombros en la region de los Andes Centrales y su relacion con la distribucion de las precipitaciones. Inst. Argent. Nivol. Glaciol. An.1977, 21–47.
11
Corte A. (1997). Geocriología. El frío en la Tierra. Mendoza: Fundar Editorial Grafica, Ediciones Culturales de Mendoza
12
Digital Globe (2017). Worldview 2 imagery products. Westminster, CO: Digital Globe. Available online at: https://discover.digitalglobe.com/ (Accessed December 10, 2017).
13
Espizúa L. E. (1993). Quaternary glaciations in the rio mendoza valley, Argentine andes. Quat. Res.40, 150–162. 10.1006/qres.1993.1067
14
Flowers G. E. (2018). Hydrology and the future of the Greenland ice sheet. Nat. Commun.9, 2729. 10.1038/s41467-018-05002-0
15
Gruber S. (2012). Derivation and analysis of a high-resolution estimate of global permafrost zonation. Cryosphere6 (1), 221–233. 10.5194/tc-6-221-2012
16
Gustavsson M. Kolstrup E. Seijmonsbergen A. C. (2006). A new symbol-and-GIS based detailed geomorphological mapping system: renewal of a scientific discipline for understanding landscape development. Geomorphology77, 90–111. 10.1016/j.geomorph.2006.01.026
17
Hausmann H. Krainer K. Brückl E. Mostler W. (2007). Internal structure and ice content of a rock glacier in the Ötztal Alps (Austria) assessed by geophysical investigations. Permafr. Periglac. Process.18 (4), 351–367. 10.1002/ppp.595
18
Heredia N. Farias P. García-Sansegundo J. Giambiagi L. (2012). The basement of the andean frontal cordillera in the cordón del plata (Mendoza, Argentina): geodynamic evolution. Andean Geol.39 (2). 10.5027/andgeov39n2-a03
19
Hu Y. Liu L. Huang L. Zhao L. Wu T. Wang X. et al (2023). Mapping and characterizing rock glaciers in the arid Western Kunlun Mountains supported by InSAR and deep learning. J. Geophys. Res.Earth Surf.128 (9), e2023JF007206. 10.1029/2023JF007206
20
Janke J. R. Bellisario A. C. Ferrando F. A. (2015). Classification of debris-covered glaciers and rock glaciers in the Andes of central Chile. Geomorphology241, 98–121. 10.1016/j.geomorph.2015.03.034
21
Jones B. M. C. D. Arp M. T. Jorgenson K. M. Hinkel J. A. Schmutz P. L. F. (2009). Increase in the rate and uniformity of coastline erosion in Arctic Alaska. Geophys. Res. Lett.36, L03503. 10.1029/2008GL036205
22
Jones B. M. Grosse G. Arp C. D. Jones M. C. Walter Anthony K. M. Romanovsky V. E. (2011). Modern thermokarst lake dynamics in the continuous permafrost zone, northern Seward Peninsula, Alaska. J. Geophys. Res.-Biogeo.116, G00M03. 10.1029/2011JG001666
23
Jones D. B. Harrison S. Anderson K. Betts R. A. (2018). Mountain rock glaciers contain globally significant water stores. Sci. Rep.8, 2834. 10.1038/s41598-018-21244-w
24
Kuhry P. Makopoulou E. Pascual D. Pecker Marcosig I. Trombotto Liaudat D. (2022). Soil organic carbon stocks in the high mountain permafrost zone of the semi-arid Central Andes (Cordillera Frontal, Argentina). Catena217, 106434. 10.1016/j.catena.2022.106434
25
Lliboutry L. (1998). Glaciers of South America-glaciers of Chile and Argentina. Valley Drive Reston, VA: U.S Geological Survey Professional. p. 109–206.
26
Luo J. Niu F. Lin Z. Liu M. Yin G. Gao Z. (2022). Abrupt increase in thermokarst lakes on the central Tibetan Plateau over the last 50 years. Catena217, 106497. 10.1016/j.catena.2022.106497
27
Masiokas M. H. Villalba R. Luckman B. H. Mauget S. (2010). Intra-to multidecadal variations of snowpack and streamflow records in the Andes of Chile and Argentina between 30 and 37S. J. Hydrometeorol.11 (3), 822–831. 10.1175/2010jhm1191.1
28
Méndez E. (2004). La vegetación de los Altos Andes I. Pisos de vegetación del flanco oriental del Cordón del Plata, Mendoza Argentina. Bol. Soc. Argent. Bot.39, 227–253.
29
Méndez E. Martinez Carretero E. Peralta I. (2006). La vegetación del Parque Provincial Aconcagua (Altos Andes Centrales de Mendoza, Argentina). Bol. Soc. Argent. Bot.41 (2006), 41–49.
30
Meng T. M. Aguilar R. Christoffersen M. S. Petersen E. I. Larsen C. F. Levy J. S. et al (2023). Photogrammetric monitoring of rock glacier motion using high-resolution cross-platform datasets: formation age estimation and modern thinning rates. Remote Sens.15 (19), 4779. 10.3390/rs15194779
31
Moreiras S. M. Paez M. S. Lauro C. Jeanneret P. (2016). First cosmogenic ages for glacial deposits from the Plata range (33 S): new inferences for Quaternary landscape evolution in the Central Andes. Quat. Int.438, 50–64. 10.1016/j.quaint.2016.08.041
32
Potere D. (2008). Horizontal positional accuracy of Google earth's high-resolution imagery archive. Sensors (Basel)8 (12), 7973–7981. 10.3390/s8127973
33
República Argentina (2011). Boletín Oficial de la República Argentina. 1ra sección. Available online at: https://archive.org/details/Boletin_Oficial_Republica_Argentina_1ra_seccion_2011-12-27 (Accessed May 10, 2018)
34
Schaffer N. MacDonell S. Réveillet M. Yáñez E. Valois R. (2019). Rock glaciers as a water resource in a changing climate in the semiarid Chilean Andes. Reg. Environ. Change19 (5), 1263–1279. 10.1007/s10113-018-01459-3
35
Schrott L. (1996). Some geomorphological –hydrological aspects of rock glaciers in the Andes (San Juan, Argentina). Berlin: Gebruder Borntraeger. p. 161–163.
36
Sileo N. Trombotto Liaudat D. Dapeña C. (2015). Estudios preliminares del agua, nieve y hielo en la cuenca del Río Vallecitos, Mendoza, Argentina. Acta Geol. Lilloana27, 130–145.
37
Sileo N. Dapeña C. Trombotto Liaudat D. (2020). Isotopic composition and hydrogeochemistry of a periglacial andean catchment and its relevance in the knowledge of water resources in mountainous areas. Isotopes Environ. and Health Stud.56, 480–494. 10.1080/10256016.2020.1814278
38
Trombotto D. L. Borzotta E. (2009). Indicators of present global warming through changes in active layer-thickness, estimation of thermal diffusivity and geomorphological observations in the Morenas Coloradas rock glacier, Central Andes of Mendoza, Argentina. Cold regions Sci. Technol.55, 321–330. 10.1016/j.coldregions.2008.08.009
39
Trombotto D. T. Bottegal E. L. (2019). Recent evolution of the active layer in the morenas coloradas rock glacier, central andes, mendoza, Argentina and its relation with kinematics.Wahrhaftig, C. and Cox, A.,1959. Rock glaciers in the Alaska Range. Bull. Geol. Soc. Am.70, 383–436.
40
Trombotto D. Buk E. Hernández J. (1997). Monitoring of Mountain Permafrost in the Central Andes, Cordon del Plata, Mendoza, Argentina. Permafr. Periglac. Process.8, 123–129. 10.1002/(SICI)1099-1530(199701)8:1<123::AID-PPP242>3.0.CO;2-M
41
Trombotto D. L. Buk E. Hernandez J. (1999). Rock glaciers in the southern central andes (approx. 33o 34o S), Cordillera frontal, mendoza, Argentina. Bamb. Geogr. Schriften55, 145–173.
42
Trombotto D. L. Wainstein P. Arenson L. U. (2004). Terminological guide of the south American geocryology. Vazquez Mazzini, 50–52.
43
Trombotto D. L. Wainstein P. Arenson L. U. (2014). Terminological guide of the south American geocryology. Buenos Aires; Vázquez Mazzini Editores.
44
Trombotto-Liaudat D. Sileo N. Dapeña C. (2020). Periglacial water paths within a rock glacier-dominated catchment in the Stepanek area, Central Andes, Mendoza, Argentina. Permafr. Periglac Process31, 311–323. 10.1002/ppp.2044
45
Vivero S. Bodin X. Farías-Barahona D. MacDonell S. Schaffer N. Robson B. A. et al (2021). Combination of aerial, satellite, and UAV photogrammetry for quantifying rock glacier kinematics in the Dry Andes of Chile (30 S) since the 1950s. Front. Remote Sens.2, 784015. 10.3389/frsen.2021.784015
46
Wahrhaftig C. Cox A. (1959). Rock glaciers in the Alaska Range. Geol. Soc. Am. Bull.70 (4), 383–436. 10.1130/0016-7606(1959)70[383:RGITAR]2.0.CO;2
47
Wayne W. J. Corte A. E. (1983). Multiple glaciations of the Cordon del Plata, Mendoza, Argentina. Palaeoclimatol. Palaeoecol.42, 185–209. 10.1016/0031-0182(83)90044-5
48
Zhou G. Liu W. Xie C. Song X. Zhang Q. Li Q. et al (2024). Accelerating thermokarst lake changes on the Qinghai–Tibetan Plateau. Sci. Rep.14, 2985. 10.1038/s41598-024-52558-7
Summary
Keywords
geomorphological map, glaciers, supraglacial lakes, alpine permafrost, rock glaciers, andes, spatial and temporal analyses
Citation
Makopoulou E, Trombotto Liaudat D and Kuhry P (2025) Glacial and periglacial landforms and their recent dynamics in the Las Veguitas catchment, Cordillera Frontal of the Andes (Argentina). Front. Earth Sci. 13:1533336. doi: 10.3389/feart.2025.1533336
Received
23 November 2024
Accepted
22 September 2025
Published
22 October 2025
Volume
13 - 2025
Edited by
Nicole Schaffer, Centro de Estudios Avanzados en Zonas Áridas (CEAZA), Chile
Reviewed by
Rijan Bhakta Kayastha, Kathmandu University, Nepal
Gregoire Guillet, University of Oslo, Norway
Updates
Copyright
© 2025 Makopoulou, Trombotto Liaudat and Kuhry.
This is an open-access article distributed under the terms of the Creative Commons Attribution License (CC BY). The use, distribution or reproduction in other forums is permitted, provided the original author(s) and the copyright owner(s) are credited and that the original publication in this journal is cited, in accordance with accepted academic practice. No use, distribution or reproduction is permitted which does not comply with these terms.
*Correspondence: E. Makopoulou, Eirini.makopoulou@oulu.fi
Disclaimer
All claims expressed in this article are solely those of the authors and do not necessarily represent those of their affiliated organizations, or those of the publisher, the editors and the reviewers. Any product that may be evaluated in this article or claim that may be made by its manufacturer is not guaranteed or endorsed by the publisher.