 Qiang Zhou
 Jiashun Yu1*
 Jianlong Yuan
 Xiaobo Fu
- 1College of Geophysics, Chengdu University of Technology, Chengdu, Sichuan, China
- 2Academy of Urban Safety and Emergency Management of Chengdu, Chengdu, Sichuan, China
- 3Research and Development Center, BGP Inc., CNPC, Zhuozhou, Hebei, China
- 4Guangxi Geological Survey Institute, Nanning, Guangxi, China
The Ms 6.0 Changning Earthquake in 2019 caused severe damage to Gongquan Town, Sichuan. Our on-site investigation of seismic damage found that the three-dimensional topography and geological conditions of the town may have exacerbated the earthquake’s amplification effects. Research on the amplification effects of seismic ground motion will be of help to understand the local seismic damage mechanisms and provide a scientific basis for disaster prevention and reduction in the region. To this end, we deployed a seismic array in Gongquan Town to observe seismic activities and analyze the amplification effects in the area. The research results, from weak-motion seismograms of aftershocks, indicate that there is a significant seismic ground motion amplification in Gongquan Town, with an average amplification factor of 11 over the frequency range of 5–7 Hz. Additionally, the amplification varied widely among different sites in different earthquakes, with Site G09 experiencing an amplification as high as 26 times of Site G06 during one of the earthquakes. Simulation studies suggest that the extreme amplification at G09 is not caused by the soil layers directly beneath the site. Further analysis found that the extreme amplification at this site is closely related to the orientation of the seismic source, with earthquakes north-northeast to G09 more likely to cause extreme seismic motion amplification at the site. The large peak amplification at G09 of weak motion data is likely to be significantly reduced in a large earthquake due to nonlinearity. However, the phenomenon reminds us to pay special attention to the risk of significant damage caused by the combined effects of extreme amplification in future earthquake defense efforts.
1 Introduction
On 17 June 2019, at 22:55, a magnitude 6.0 earthquake occurred in Changning, Sichuan, with the epicenter located at 28.34°N, 104.90°E, and a focal at 16 km. The earthquake caused serious casualties and damage to buildings. Gongquan Town is about 12 km from the epicenter and was significantly affected (Ren et al., 2021; Hu et al., 2023; Yang et al., 2023).
Historical earthquakes show that this area is prone to seismic activity. A series of moderate earthquakes occurred, including the Ms 4.9 earthquake in Junlian on 28 January 2017, the Ms 4.9 earthquake in Gongxian on 4 May 2017, the Ms 5.7 earthquake in Xingwen on 16 December 2018, the Ms 5.3 earthquake in Gongxian on 3 January 2019, and the Ms 6.0 earthquake in Changning on 17 June 2019 (Liang et al., 2017; Yi et al., 2020; Hu et al., 2021). The locations of the earthquakes are shown in Figure 1. After the 2019 Changning earthquake, there were 96 aftershocks of magnitude 3.0 and above, among which, there were 4 earthquakes of magnitude 4.5 and above, making it one of most active seismic area in the Sichuan Basin. With densely packed buildings, many old houses, and a high population density, Gongquan Town is prone to destructive earthquake. So far, there is no research on the seismic response in Gongquan Town. The seismic site effects in earthquake damage to the town remains unknown. Therefore, it is of importance to carry out a study of the seismic ground motion characteristics in the Gongquan area for earthquake mitigation purpose.
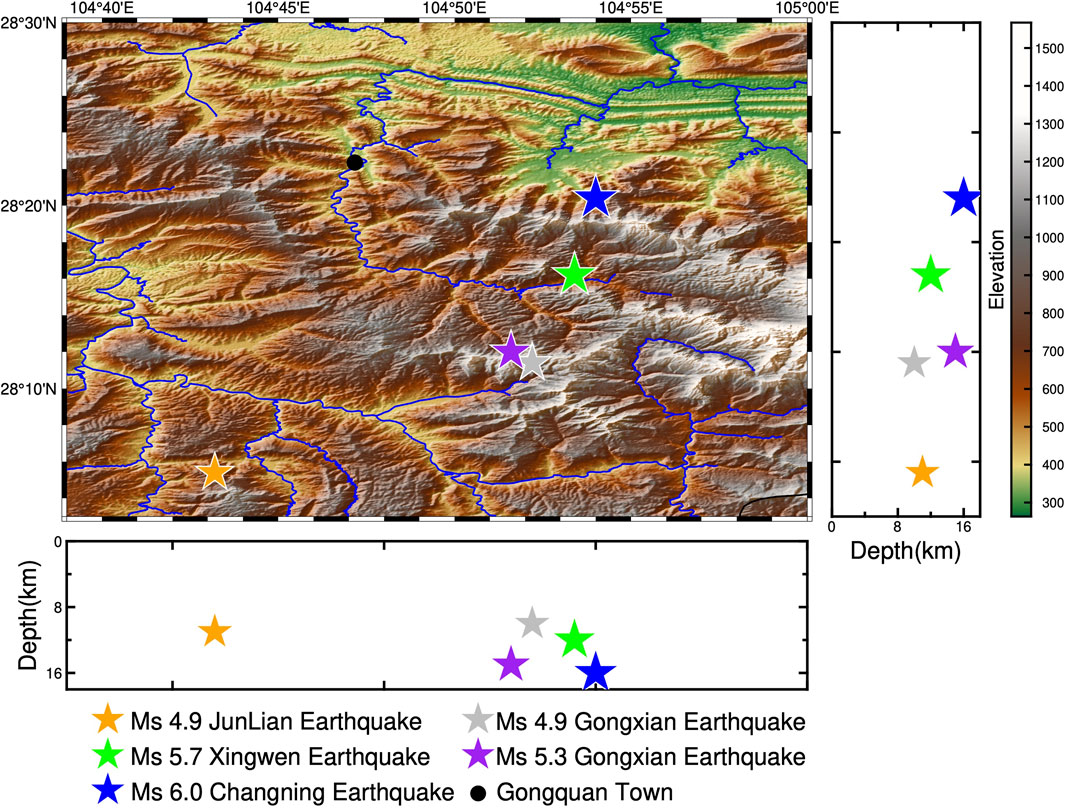
Figure 1. Historic earthquakes (pentagrams) occurred in the Gongquan (black solid circle) area in the last 8 years.
Seismic ground motion amplification is a factor playing an important role in earthquake disasters (Li and Huang, 2009). Particularly, when the main frequency of the seismic motion overlaps with the natural frequency of a building, it can cause resonance, exacerbating the destructive effects of the earthquake (Çelebi et al., 2018). We know that local surface geological conditions can lead to seismic motion amplification. During the Ms 8.0 Wenchuan Earthquake of 12 May 2008, high-intensity anomalies occurred in the alluvial plain of the Liusha River, Hanyuan, which is far from the epicenter (Li et al., 2016). Local irregular terrain of valley areas can also cause seismic motion amplification and result in severe earthquake damage (Gao et al., 2021). The impacts of this amplification effect were seen in the 6.6 magnitude earthquake near San Francisco in 1971 and the 6.7 magnitude Northridge Earthquake in Southern California in 1994 (Trifunac and Hudson, 1971; Sepúlveda et al., 2005). The Gongquan Town is located in the valley traversed by the Changning River, with its lower areas consisting of Quaternary floodplain deposits and steep mountain sides revealing rock formations, where elevation differences can reach 500 m (Figure 2), creating conditions for various causes of seismic motion amplification effects. Therefore, studying the characteristics of seismic motion amplification in Gongquan Town is of significant guiding importance for earthquake disaster prevention, regional disaster reduction, and relief efforts.
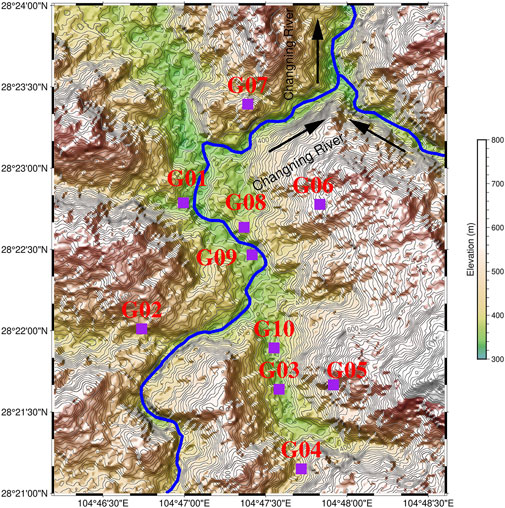
Figure 2. Topography of Gongquan valley and the seismic observation stations. The blue curve represents the river; the purple box represents the seismic observation station.
2 Data
2.1 Observations
We decided to deploy an observation array in the Gongquan Town to study the characteristics of seismic ground motion response in the area. Based on the damage caused by the Changning Earthquake and in-situ geological investigation, 10 observation sites at locations such as riverbanks and hillsides were selected for the array, which make a full coverage for Gongquan Town (Figure 2). The observation equipment used for the observation is the QS-05A portable digital seismometer, with a frequency range of 5 s to 150 Hz.
The array conducted continuous observations from September 17 to 19, 2019 (UTC+8), with the specific operating times of each station detailed in Table 1.
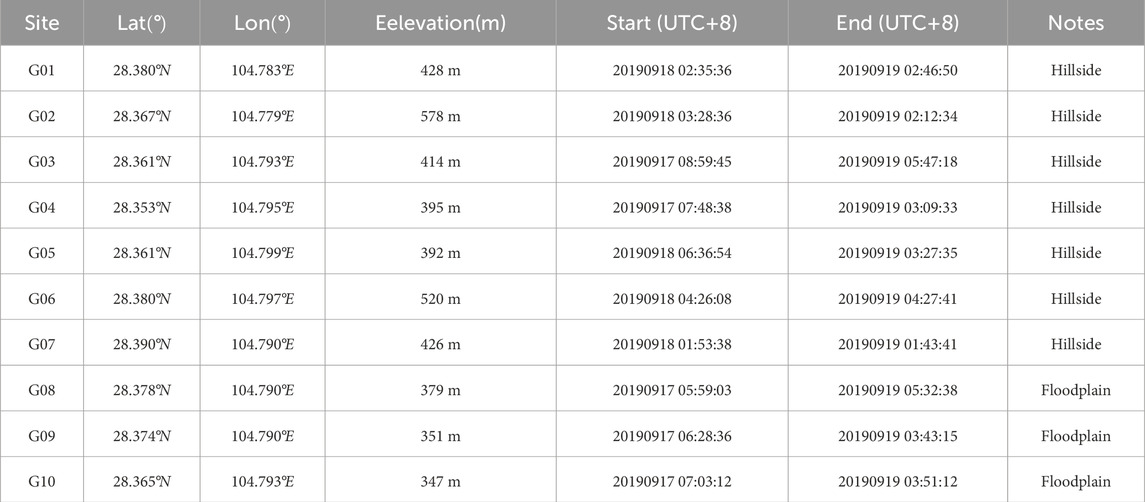
Table 1. Information of the earthquake stations.
2.2 Data processing
A total of 38 earthquake events were identified from the continuous recordings from the observation array. Referring to the earthquake catalog published by the China National Earthquake Network, the epicenter range of these earthquakes is determined to be 28.20°N to 28.48°N/104.67°E to 104.75°E. Most earthquakes extend along the Changning anticline, with magnitudes ranging from M 0.4 to 2.9 and focal depths from 1 to 15 km. The distribution of the epicenters of the events is specifically shown in Figure 3, and the parameters of each earthquake are detailed in Table 2. Figure 4 shows the three-component waveform of Event 34.
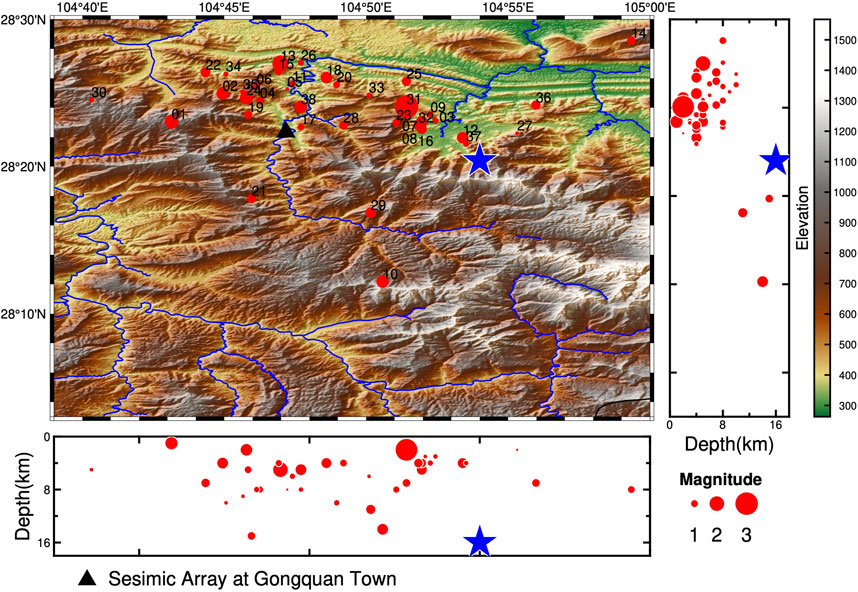
Figure 3. Locations of the earthquakes (red solid circle) recorded by the array. The blue pentagram marks the location of the main shock of the Changning Earthquake.
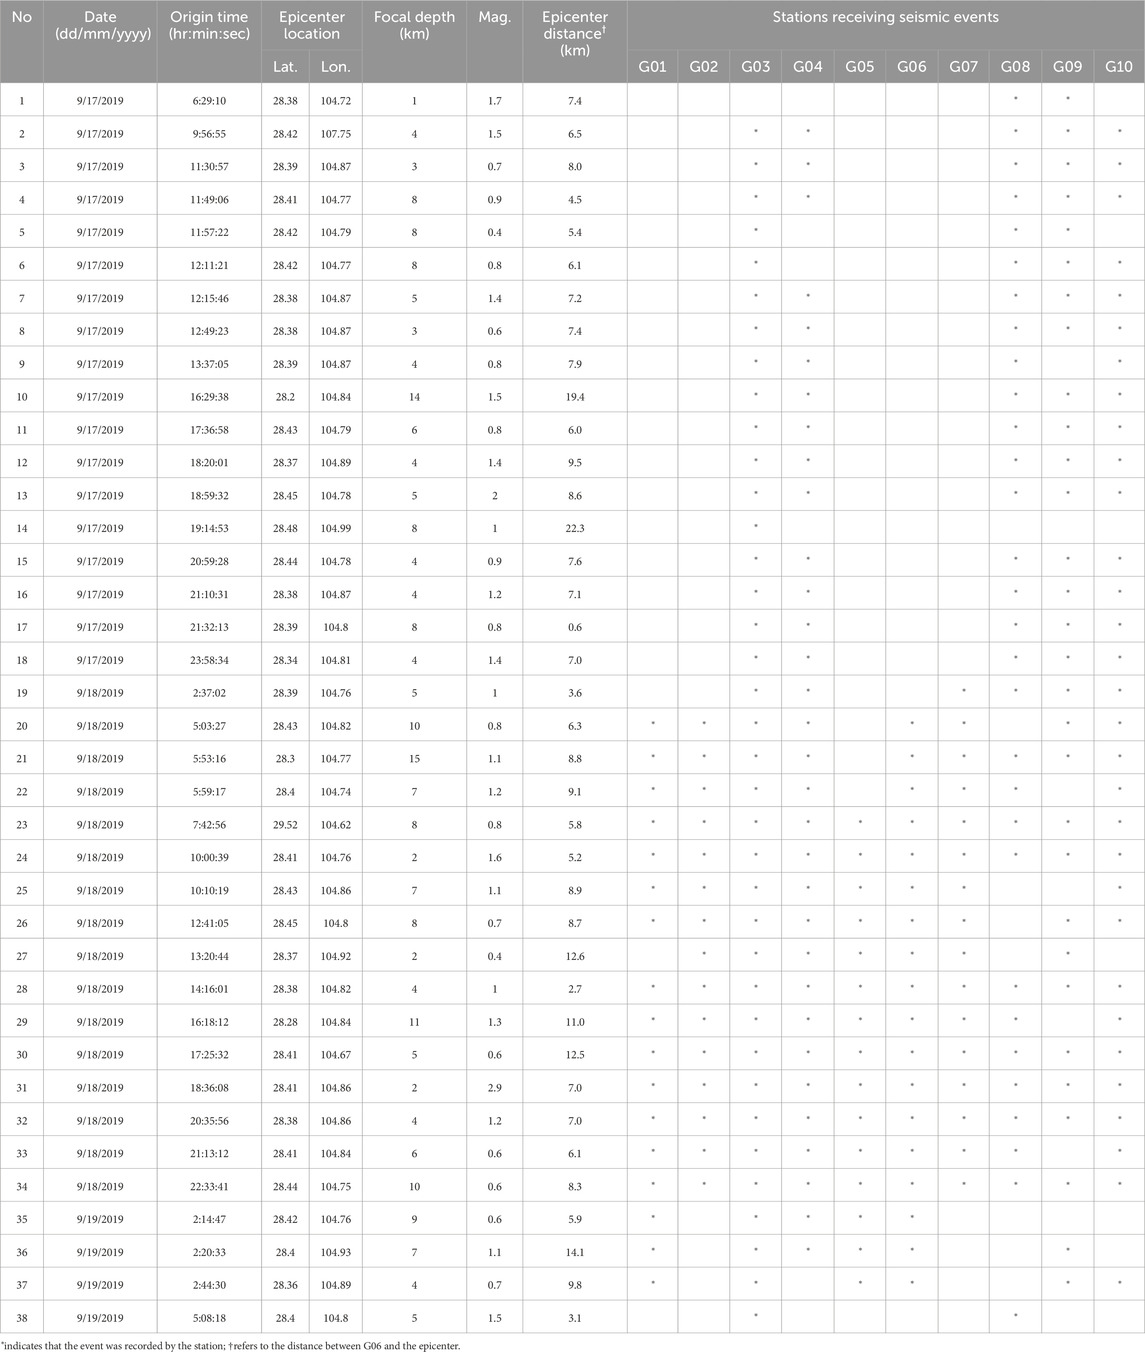
Table 2. The catalog of selected events with
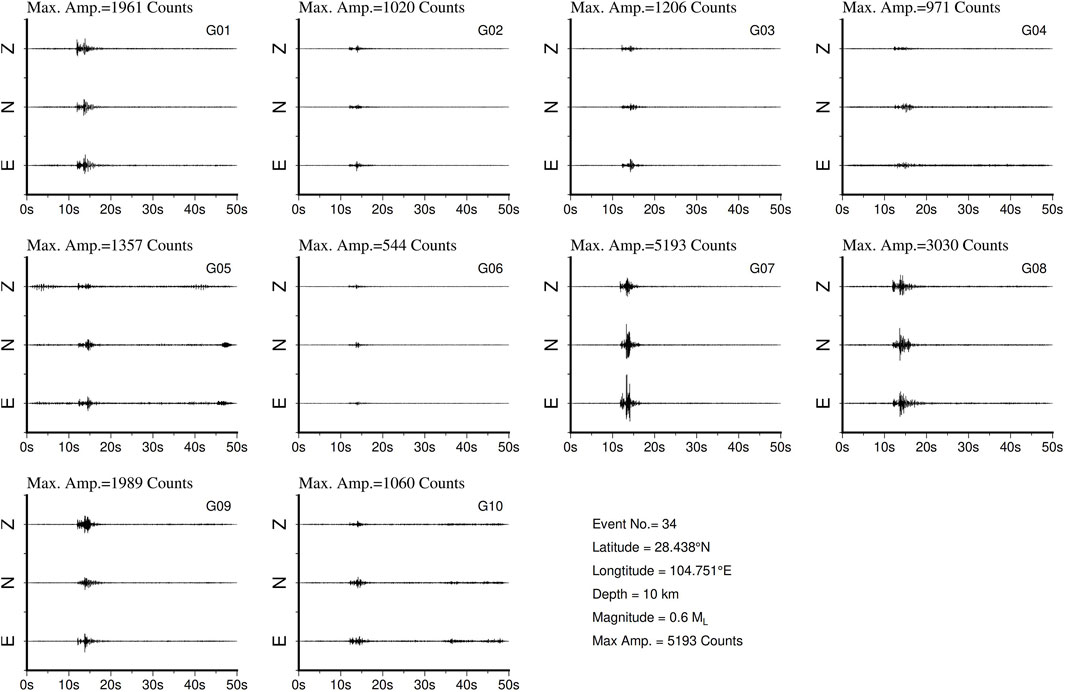
Figure 4. Waveform records of Event 34 recorded by the observation network. The seismic motion amplitudes at each station are normalized using the maximum amplitude recorded at station G07. The amplitude labels at the top of each subplot indicate the maximum amplitude among the three components for each site.
2.3 Ground motion
The ground motion amplification at a site is usually influenced by the surface topography and underground geological conditions. The horizontal amplitude of seismic ground motion is generally larger than the vertical amplitude, and the shear wave ground motion amplification at a site is primarily relevant for seismic mitigation. Therefore, when observing the particle motion trajectories of different seismic events at various observation sites, we focus primarily on the horizontal particle motion trajectories. To demonstrate the horizontal ground motion patterns in area, we plot the horizontal particle motion trajectories of 4 events in Figure 5 to show the characteristics of ground motion at each site. As can be seen that there is significant difference in the magnitude of the horizontal particle vibration amplitude at different sites, which reflects the site effects on seismic ground motion. It is particularly noteworthy that Site G06, located on the hillside east of Gongquan, consistently exhibits smaller horizontal vibration amplitudes compared to other stations over all the events.
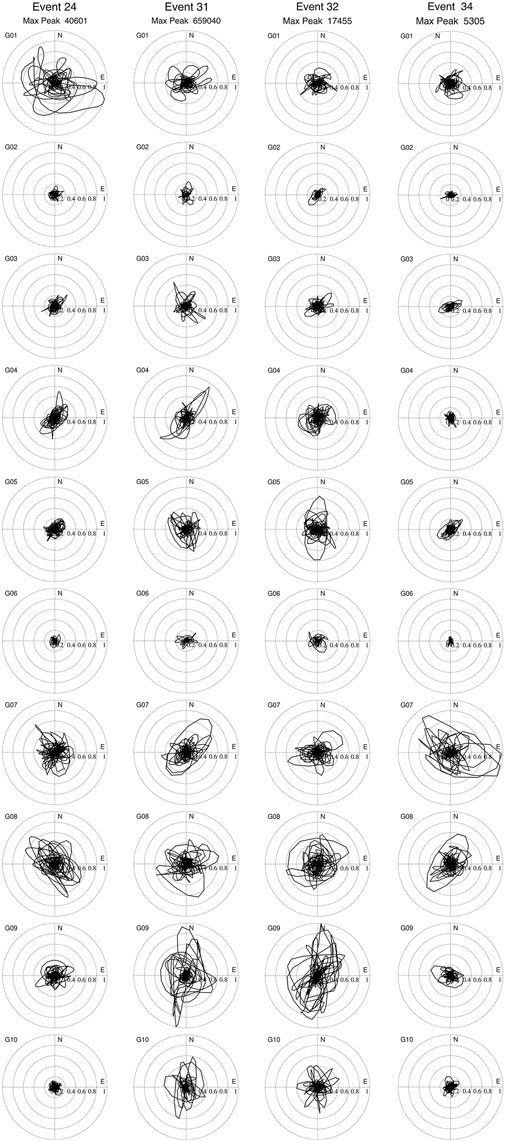
Figure 5. Horizontal vibration trajectories at each site in Events 24, 31, 32 and 34 (from the left to the right columns). There is significant difference in the magnitude of the horizontal particle vibration amplitude at different sites, reflecting the site effects on seismic ground motion. It is particularly noteworthy that Site G06 (the sixth row), located on the hillside east of Gongquan, consistently exhibits smaller horizontal vibration amplitudes compared to other stations over all the events.
2.4 Data selection
We use the Reference Site Spectral Ratio (RSSR) method by Borcherdt (1970) to analyze the seismic ground motion amplification in the Gongquan area. The application of RSSR is predicated on the assumption that the seismic wave amplitude on the ground surface at the reference site is a good approximation of that at the bedrock beneath the study site. In general, seismic data from a reference site may also be influenced by its own site effects due to weathering (Yu and Haines, 2003). However, as long as the weathering layer is thin, so that its effects are on frequencies higher than those of interest to earthquake disaster prevention, the reference site effects is insignificant on the effective frequency range of RSSR characterization for the purpose.
When the observation array was designed, the Reference Site G06 was chosen as reference as it is on the exposed Silurian Supergroup (S3) calcareous siltstone, with a calcareous matrix in the rock, exhibiting thin horizontal layering. Later seismic observation showed that the particle vibration amplitude at G06 was relatively small (See the sixth row in Figure 5), proving that our choice of the reference site at the time was reasonable.
To minimize the impact of the path term, we first excluded earthquakes that were less than 3.1 km from G06, to ensure that the distance between a study site and the reference site does not exceed the hypocentral distance, so that the path effects can be negligible (Steidl et al., 1996). In addition, we specifically analyzed factors such as distances between stations and the rupture radius of each earthquake.
According to Kanamori and Anderson (1975), based on the disc rupture model, the source rupture radius r can be determined by Equation 1, as follows
where
According to Wang (2022), who analyzed the seismic events in the southern Sichuan Basin before and after the Changning earthquake, the stress drop in the study area is between 0.5 and 30 MPa. By substituting the local magnitudes of each earthquake (see Table 2), it can be calculated that the rupture radius of all earthquakes is less than 80 m, which is much smaller than the epicentral distance. Based on the point source assumption conditions by Aki and Richards (2002), these earthquakes can all be treated as point sources. Therefore, in our subsequent analysis, we do not need to exclude observed earthquake events due to the rupture surface being too large.
In addition, we conducted a signal-to-noise ratio (SNR) analysis on the observed seismic data. We used data before the event as background noise, and extracted effective event signal data to calculate the SNR for each station from each seismic event. Finally, we selected the seismic data with a SNR higher than 3 (Table 2) for subsequent analysis of the seismic ground motion amplification effects.
3 Amplifications
3.1 Spectral ratios
We use the formula of Yu and Haines (2003), as shown in Equation 3, to calculate the amplification effect of seismic motion in the horizontal direction:
where H is the horizontal component of the seismic motion defined by Equation 4,
where
To eliminate the impact of random factors on the seismic amplification effect analysis (Borcherdt and Glassmoyer, 1992), we performed mean and variance statistical analysis on the spectral ratio functions using Equations 5, 6:
where
Using the method introduced above, spectral ratio functions, and means and standard deviations, were calculated for the data selected using the criteria as discussed in Section 2.4. According to the response frequency of the instrumentation, the calculation results have a frequency range greater than 0.2 Hz. On the other hand, considering that most buildings in Gongquan Town are 1-6 stories, we focused on studying the site earthquake amplification effect at frequencies below 12 Hz, with the specific results calculated as shown in Figure 6.
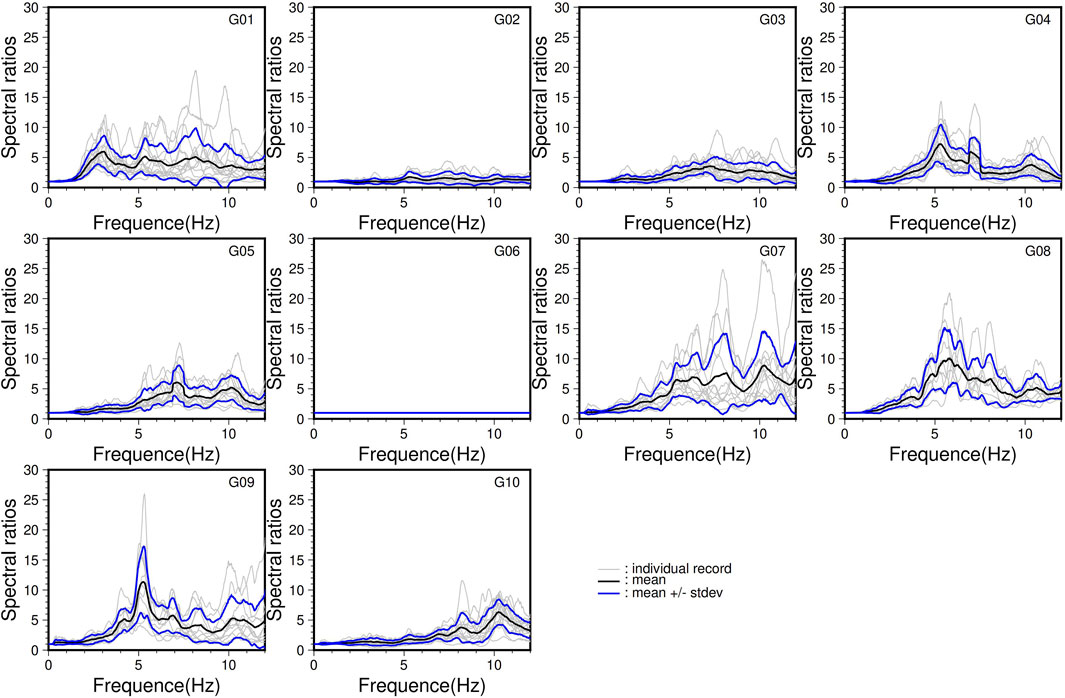
Figure 6. Horizontal component spectral ratios from each site. The black solid line represents the mean ratios, while the blue curves above and below the mean represent the mean plus and minus one standard deviation, indicating the range of variation in the seismic response functions.
Overall, Site G01 has the lowest dominant frequency of 3 Hz, with an average peak amplification over all the events at 6. Sites G02 and G03 do not show significant seismic amplification. Sites G04, G08, and G09 exhibit significant amplification at 5–6 Hz. Sites G05, G07, and G10 mainly showed amplification at higher frequencies above 7 Hz.
3.2 Spatial patterns
To more intuitively demonstrate the spatial variation of the amplification effect, the spatial distribution of the average seismic amplification over each frequency range at each site are shown in Figure 7, which provides a global overview of the seismic amplification pattern in Gongquan Town. It is evident that site effect in Gongquan is significant, and its impact on the exacerbation of earthquake disasters cannot be overlooked. Furthermore, there are notable differences in seismic amplification characteristics between various sites, which exhibit localized features, indicating that factors such as local topography and near-surface geological conditions greatly influence the distribution of seismic amplification in Gongquan Town.
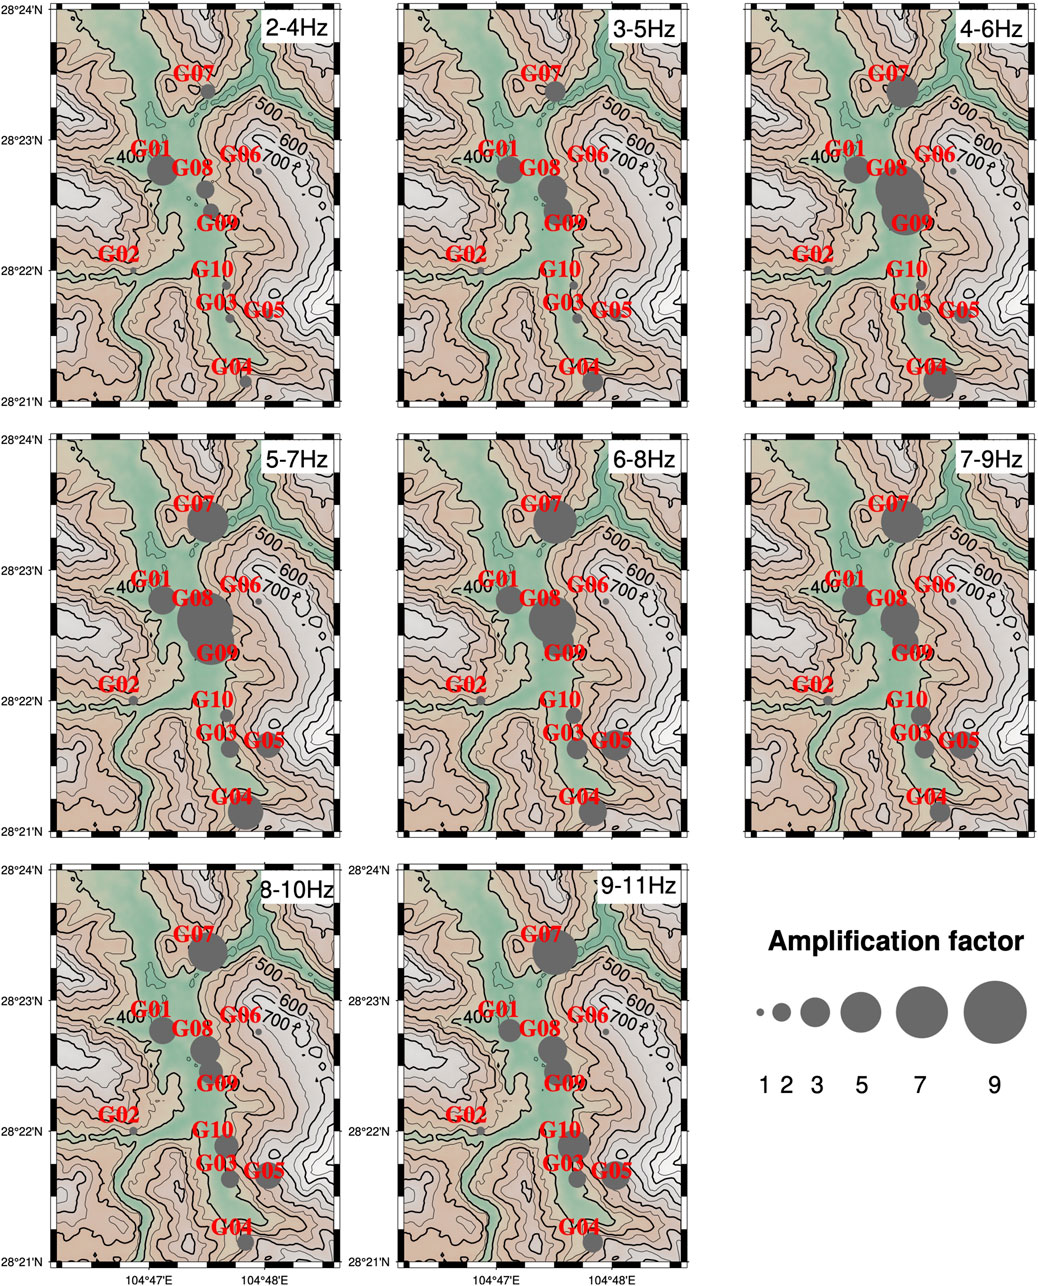
Figure 7. Distribution of average amplification factors for seismic ground motions at different frequency bands. The base map depicts the topographic contours of the study area. Gray circles indicate the amplification of seismic ground motions, with the size of the circle indicating the amplification factor.
3.3 Peak amplifications of weak-motion events
Peak amplification and the corresponding frequency, referred to as dominant frequency later, are important parameters for studying seismic ground motion amplification effects. Here, the dominant frequency and peak amplification for each site in each of the weak motion event recorded are shown in Figure 8. We found that dominant frequencies of the sites are concentrated in the range of 5–8 Hz, indicating a relatively stable characteristic. However, there are significant differences in the amplified peak values of seismic motion at different sites.
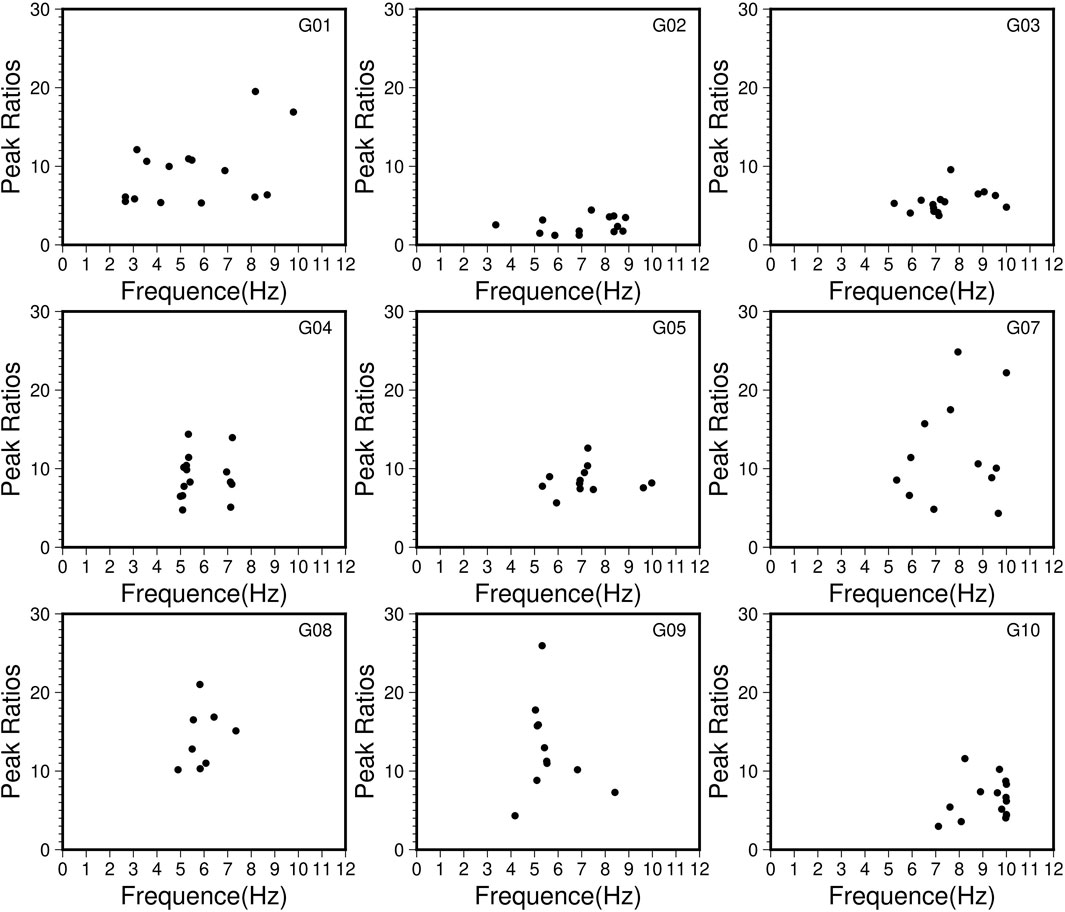
Figure 8. The dominant frequency and peak value of seismic amplification at each site. Each dot in the diagram represents the peak value over the frequency band of 0.2–12 Hz.
Figure 8 shows that G09 has peak amplifications ranging from 9 to 26 over the frequency band of 5–6 Hz. Although the peak amplification of 26 is extremely large, it is not exceptional. For example, another large peak amplification of 18 is also found at the same site, and a peak amplification of 25 found at Site G07 on a frequency of around 8 Hz. Actually, an even larger peak amplification of 30 in Lower Hutt, New Zealand, was also reported by Taber and Smith (1992). Therefore, the large amplification at G09 cannot be negligible for future earthquake hazard prevention, as, once it happens, the building structures at the site needs to withstand vibrations 26 times greater than that at the reference site G06. This will inevitably intensify the forces exerted by the earthquake on the building structures. However, it should be pointed out that the spectral ratios are determined from weak-motion events. Nonlinearity of soils is likely to reduce ground-motion amplification in a large earthquake (Field et al., 1997).
4 Analysis
4.1 Modelling of amplification due to soil layers
Site G09 is located at a river floodplain. The underground soil layer structure may have an impact on the amplification effect of seismic motion at the site. Therefore, we conducted further analysis and research on this matter.
We conducted ReMi (Louie, 2001) microtremor exploration at Site G09. An acquisition array of 19 three-component short-period seismometers, with a spacing of 5
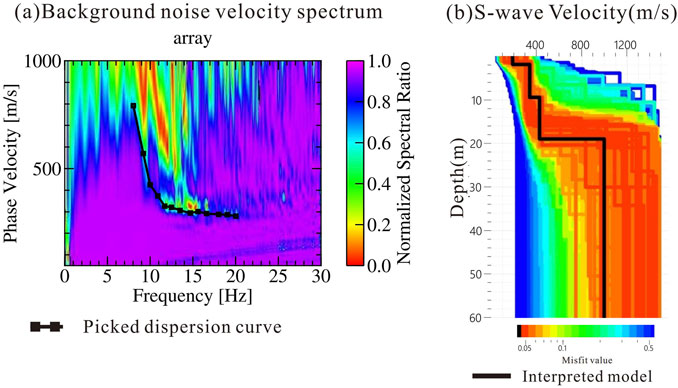
Figure 9. Inversion of shear wave velocity structure at Site G09 based on microtremor exploration data. (a) The velocity spectra from micro-motion exploration data, and the dispersion curves (black curve) extracted using the passive source ReMi method; (b) The shear wave velocity structure obtained from the inversion of the dispersion curve in (a), where the black line represents the best-fitting velocity model.
In the parameter selection for inversion, we set the range of inversion model parameters to a 10-layer structure based on geological surveys, with an inversion depth range of 1–50
The inversion results of the dispersion curve show a structure of four layers (Figure 9b), with the bottom layer being the bedrock. The depths of the interfaces of the three layers of media overlying the bedrock are 2, 9, and 19
The density of each model layer, from the top to the bottom, are given as 1.9, 2.0, 2.1 and 2.3
Based on the structural model given above, a one-dimensional SH wave forward modelling was performed using the method of Yu and He (2003), which is theoretically based on a linear attenuation model.
The modeling results are shown by the red curves in Figure 10. The dominant frequency of site amplification from the modeling is between 5 and 6 Hz, which is very close to the observed dominant frequency. However, the peak amplification from the modelling is only between 2.5 and 3.5 with the basement velocity of the model ranging from 850 to 1,200
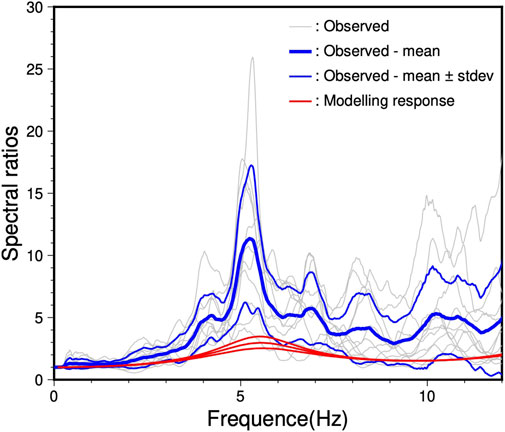
Figure 10. Comparison of the spectral ratios of seismic motion at Site G09 with modelling results. The grey curves represent the spectral ratios of the H components observed in various earthquakes. The thick blue curve is the mean spectral ratio, and the thin blue curves are the mean plus and minus one standard deviation. The 3 red curves are the seismic motion amplification functions of S-waves from one-dimensional SH modelling using shear wave velocity of 850
4.2 Azimuthal characteristics of the extreme peak amplifications
The peak amplification of 26 is from Event 31. We found that the Event 32, which occurred close to the 31st, also triggered a peak amplification of 18 at the site, indicating that the extreme amplification is not a random occurrence. A comparison of the spectral ratios of Events 31 and 32 revealed similarities of the responses of the sites to the events (Figure 11).
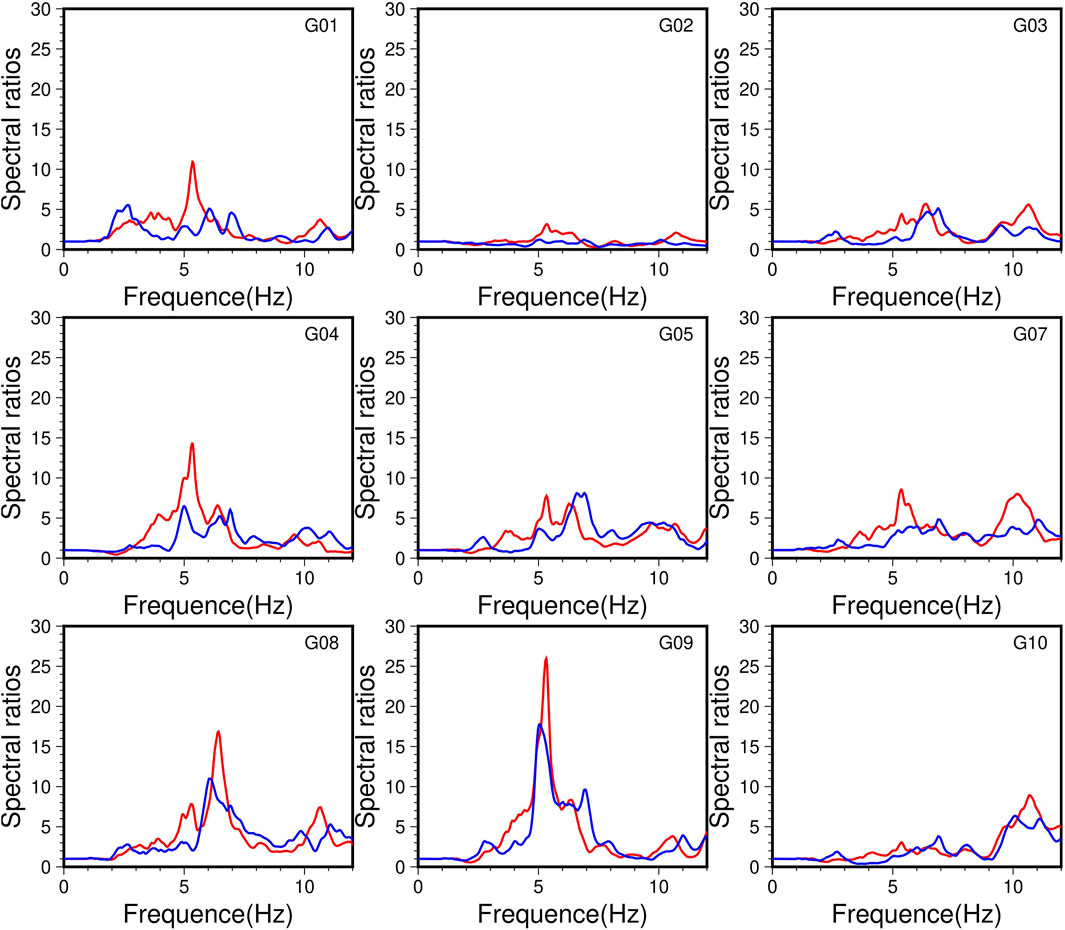
Figure 11. Spectral ratios of Events 31 (red) and 32 (blue).
Analysis reveals that the two earthquakes, 31 and 32, which caused extreme seismic amplification at G09, are both located to the NNE direction of the site. To understand the orientation distribution characteristics of the extreme seismic amplification effect, we conducted statistical analysis of the amplification effects of earthquakes within the
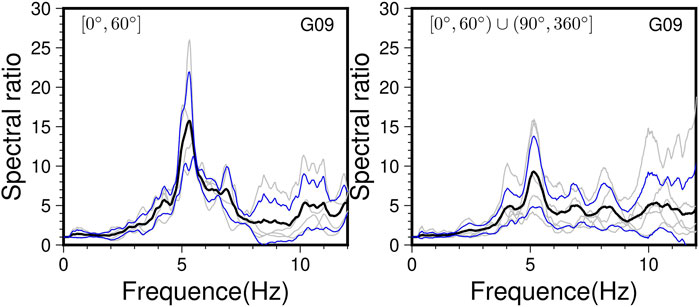
Figure 12. Comparison of the H component spectral ratios of earthquakes of different orientations at G09. The black curves represent the means of the spectral ratios, while the blue curves indicate the mean plus or minus one statistical standard deviation. Spectral ratios of earthquakes of azimuths 60° to 90° are shown on the left panel. Those of the other azimuths, i.e., 0° to 60° and 90°–360°, are shown on the right panel. The average peak amplification for earthquakes in the 60° to 90° azimuth is twice that of other azimuths, demonstrating significant differences in directional amplification characteristics.
5 Discussions
The very large ranges of peak RSSRs at most sites, especially G09, and the large ranges in peak frequencies suggest many effects may affect the RSSRs.
As we know that RSSR actually is but a ratio of the ground motion from two different sites. As source observation angle is normally different from one site to another, the source function observed at different sites can be different due to the source radiation patten. Thus, the source term cannot be completely removed from the RSSR results by the ratio cancellation. Similarly, path effect may also not be completely removed by the ratio cancellation due to the path difference of waves propagation from the source to different sites. Therefore, RSSR ratio in general contains not only the site response, but also source and path effects.
The influence of the source and path effects in the RSSR is subject to the site’s relation with the hypocentre of the earthquake of interest, including hypocentral distance, azimuth angle, and incident angels of the waves along the propagation paths from the source to the sites. Only when the factors are such that the source and path effects are negligible can the RSSR results be used directly as an interpretation of the site response.
For those events of which the hypocentral distance is not significantly much larger than the distance between the site of interest and the reference site, the source, due to radiation patten difference, and path difference between the sites, can have significant contribution to the RSSR results. In this case, the use of RSSR results as an interpretation of the site response is limited.
However, For Event 31, calculation shows that the hypocentral distance of G09 is 0.7 km longer than G06. In theory, this additional propagation distance would attenuate the wave amplitude to a certain amount for the waves to arrive at Site G09. This means that the RSSR result would underestimate the real amplification at G09, though it is unlikely to be significant as the path length difference is only 0.7 km.
In addition, calculations show that azimuth angle to the epicentre and dip angle to the hypercentre of G09 are 2.2° and 3.6°, respectively, different from those of G06. These small angle differences confine the path difference between G09 and G06 and suggest that the influence of the path on the RSSR for Site G09 should be minor. Similarly, given the small angle differences, the source effects on the RSSR result due to radiation patten of Event 31 should also be minor as well. Therefore, it is reasonable to believe that the RSSR of Site G09 in Event 31 mainly reflects the localized effect at, or around, the site.
The localized effects here may include the wave attenuation along its upward passage through the soil layers beneath the site, the resonance between the free ground surface and the soil basement interface at the site, the three-dimensional resonance of a basin structure in which the site is located, the basin edge effects, the three-dimensional topography effect, and nonlinearity in soil layers, etc.
In Section 4.1, we studied the site effects of G09 due to attenuation and resonance by one-dimensional modelling. The results suggest that the remarkable amplification is unlikely to be due to the one-dimensional resonance in the soil layers at the site.
In addition, it is obvious that the geology in the study area does not provide structure conditions for the basin edge seismic resonance to occur at Site G09.
Therefore, the factors to account for the extremely large amplification at Site G09 would possibly be a combination of the azimuth effect of the incident seismic waves to the site, as discussed in Section 4.2, and the effect of the three-dimensional topography.
Finally, it is important to note that the seismic data studied in this paper mainly come from aftershock events. These data are recordings of weak-ground motion. The insights gained reflect only the linear behavior of the sites rather than the nonlinear phenomena during a strong earthquake. Nevertheless, given that the extreme amplification effect at the G09 site is so large that this phenomenon should not be ignored.
6 Conclusion
Based on the study of the seismic ground motion amplification effect in the valley of Gongquan Town, we can derive the following understandings.
1. There is a significant ground motion amplification effect in the Gongquan valley, with considerable differences in seismic motion at different observation sites. The reference site G06 shows a distinctly lower seismic motion compared to other sites.
2. The average spectral ratio amplification at each observation site ranges from 1 to 11, demonstrating significantly localized site effects, notable ground motion amplification effect in the Gongquan valley.
3. Site G09 shows an extremely large seismic ground motion amplification phenomenon, with maximum peak values of 26. In addition, the results also reveal that the extreme amplification has an event orientation feature. Earthquakes to NNE direction of the site are likely to cause extreme amplification, to which special attention should be paid in future earthquake resistance and disaster prevention efforts.
4. It is important to note that the seismic data studied in this paper mainly comes from aftershock events which are usually of small magnitudes and the insights gained may not fully reflect the nonlinear phenomena present during strong earthquakes. Nevertheless, given that the extreme amplification effect at the G09 site is so large that this phenomenon should not be ignored.
5. The amplification factors from the one-dimensional simulation on the velocity structure of Site G09 are significantly smaller than the observed results, indicating that the local one-dimensional site effect is unlikely to be the main factor causing the large amplification at the site. The mechanisms responsible for the extreme ground motion amplification effects are complex, possibly related to the three-dimensional topography. Future research on this is desired to reveal the mechanisms behind the extreme seismic ground motion amplification effects.
Data availability statement
The raw data supporting the conclusions of this article will be made available by the authors, without undue reservation.
Author contributions
QZ: Writing – original draft, Visualization. JsY: Funding acquisition, Writing – review and editing. CH: Writing – review and editing. JlY: Funding acquisition, Writing – review and editing. XbF: Data curation, Writing – review and editing. KY: Data curation, Writing – review and editing. XH: Data curation, Writing – review and editing. XrF: Data curation, Writing – review and editing.
Funding
The author(s) declare that financial support was received for the research and/or publication of this article. This research is supported by the Sichuan Science and Technology Program, China (2025HJPJ0007 to J Yu and 2025ZNSFSC0314 to J Yuan).
Acknowledgments
This study utilized seismic event data from the China National Seismic Network. Data processing and figure generation were conducted using Geopsy (Wathelet et al., 2020), Seismic Analysis Code (SAC) v.101.6a (Goldstein et al., 2003) and GMT (Wessel et al., 2013) software packages. The research was supported by the Sichuan Science and Technology Program, China (2025HJPJ0007 to J Yu, and 2025ZNSFSC0314 to J Yuan).
Conflict of interest
Author XbF was employed by Research and Development Center, BGP Inc.
The remaining authors declare that the research was conducted in the absence of any commercial or financial relationships that could be construed as a potential conflict of interest.
Generative AI statement
The author(s) declare that no Generative AI was used in the creation of this manuscript.
Any alternative text (alt text) provided alongside figures in this article has been generated by Frontiers with the support of artificial intelligence and reasonable efforts have been made to ensure accuracy, including review by the authors wherever possible. If you identify any issues, please contact us.
Publisher’s note
All claims expressed in this article are solely those of the authors and do not necessarily represent those of their affiliated organizations, or those of the publisher, the editors and the reviewers. Any product that may be evaluated in this article, or claim that may be made by its manufacturer, is not guaranteed or endorsed by the publisher.
References
Borcherdt, R. (1970). Effects of local geology on ground motion near San Francisco Bay. Bull. Seismol. Soc. Am. 60, 29–61. doi:10.1785/BSSA0600010029
Borcherdt, R., and Glassmoyer, G. M. (1992). On the characteristics of local geology and their influence on ground motions generated by the Loma prieta earthquake in the San Francisco Bay region, California. Bull. Seismol. Soc. Am. 82, 603–641. doi:10.1785/bssa0820020603
Çelebi, M., Sahakian, V. J., Melgar, D., and Quintanar, L. (2018). The 19 September 2017 M 7.1 Puebla–Morelos earthquake: Spectral ratios confirm Mexico City zoning. Bull. Seismol. Soc. Am. 108, 3289–3299. doi:10.1785/0120180100
Field, E., Johnson, P., Beresnev, I., and Zeng, Y. (1997). Nonlinear ground-motion amplification by sediments during the 1994 northridge earthquake. Nature 390, 599–602. doi:10.1038/37586
Gao, Y., Dai, D., and Zhang, N. (2021). Progress and prospect of topographic amplification effects of seismic wave in canyon sites. J. Disaster Prev. Mitig. Eng. 41, 734–752. doi:10.13409/j.cnki.jdpme.2021.04.004
Goldstein, P., Dodge, D., Firpo, M., and Minner, L. (2003). Sac2000: signal processing and analysis tools for seismologists and engineers. Int. Geophys. 81, 1613–1614. doi:10.1016/S0074-6142(03)80284-X
Hu, X., Cui, X., Zhang, G., Wang, G., Zang, A., Shi, B., et al. (2021). Analysis on the mechanical causes of the complex seismicity in changning area, China. Chin. J. Geophys. 64, 1–17. doi:10.6038/cjg2021O0232
Hu, G., Zhang, G., and Liang, S. (2023). Study on the spatial distribution of seismic activity in the changning area, Sichuan Province. Earthquake Research in China 39, 883–892. doi:10.3969/j.issn.1001-4683.2023.04.015
Kanamori, H., and Anderson, D. (1975). Theoretical basis of some empirical relations in seismology. Bulletin of the Seismological Society of America 65, 1073–1095. doi:10.1785/BSSA0650051073
Li, Y., and Huang, R. (2009). Earthquake damage effects of towns and reconstruction site selection in wenchuan earthquake on May 12, 2008. Chinese Journal of Rock Mechanics and Engineering 28, 1370–1376. doi:10.3321/j.issn:1000-6915.2009.07.010
Li, P., Liu, H., Bo, J., Li, X., and Yu, X. (2016). Effects of river valley topography on anomalously high intensity in the hanyuan town during the wenchuan Ms 8.0 earthquake. Chinese Journal of Geophysics 59, 174–184. doi:10.6038/cjg20160115
Liang, H., Mao, L., Benfu, X., Zhaoheng, Y., Liu, Y., Yan, J., et al. (2017). Preliminary analysis on the seismic disaster characteristics and the intensity abnormal points of junlian M4.9 earthquakes on 28 January 2017. Earthquake Research in Sichuan 3, 10–14. doi:10.13716/j.cnki.1001-8115.2017.03.003
Louie, J. (2001). Faster, better: shear-wave velocity to 100 meters depth from refraction microtremor arrays. Bulletin of the Seismological Society of America 91, 347–364. doi:10.1785/0120000098
Ren, J., Li, Z., and Li, X. (2021). Contrastive analysis of the accuracy of rapid assessment of earthquake disaster losses by sichuan changning Ms 6.0 earthquake on June 17, 2019. Seismological and Geomagnetic Observation and Research 42, 67–79. doi:10.3969/j.issn.1003-3246.2021.04.009
Sepúlveda, S., Murphy, W., Jibson, R., and Petley, D. (2005). Seismically induced rock slope failures resulting from topographic amplification of strong ground motions: the case of pacoima canyon California. Engineering Geology 80, 336–348. doi:10.1016/j.enggeo.2005.07.004
Steidl, J. H., Tumarkin, A. G., and Archuleta, R. J. (1996). What is a reference site? Bulletin of the Seismological Society of America 86, 1733–1748. doi:10.1785/bssa0860061733
Taber, J. B. J., and Smith, E. G. C. (1992). Frequency dependent amplification of weak ground motions in porirua and lower hutt, New Zealand. Bulletin of the N. Z. Society for Earthquake Engineering 25, 303–331. doi:10.5459/bnzsee.25.4.303-331
Trifunac, M. D., and Hudson, D. E. (1971). Analysis of the pacoima dam accelerogram-San fernando, California, earthquake of 1971. Bulletin of the Seismological Society of America 61, 1393–1411. doi:10.1785/BSSA0610051393
Wang, S. (2022). A study on the characteristics of source parameters in the basin in southern sichuan. Beijing: China University of Petroleum. Master’s thesis.
Wang, Z., Street, R., Woolery, E., and Harris, J. (1994). Qs estimation for unconsolidated sediments using first-arrival SH wave critical refractions. Journal of Geophysical Research Solid Earth 99, 13543–13551. doi:10.1029/94jb00499
Wathelet, M., Jongmans, D., Ohrnberger, M., and Bonnefoy-Claudet, S. (2008). Array performances for ambient vibrations on a shallow structure and consequences over Vs inversion. Journal of Seismology 12, 1–19. doi:10.1007/s10950-007-9067-x
Wathelet, M., Chatelain, J.-L., Cornou, C., Di Giulio, G., Guillier, B., Ohrnberger, M., et al. (2020). Geopsy: a user-friendly open-source tool set for ambient vibration processing. Seismological Research Letters 91, 1878–1889. doi:10.1785/0220190360
Wessel, P., Smith, W., Scharroo, R., Luis, J., and Wobbe, F. (2013). Generic mapping tools: improved version released. Eos, Transactions American Geophysical Union 94, 409–410. doi:10.1002/2013eo450001
Yang, Y., Bai, W., Dai, J., and Chen, X. (2023). Investigation and analysis of building damage caused by Ms6.0 changning earthquake in Sichuan Province. Building Structure 53, 738–743. doi:10.19701/j.jzjg.23S2713
Yi, G., Zhou, L., Zhang, L., Long, F., and Gong, Y. (2020). Predictive efficiency tests of moderate earthquakes with sizes Ms ≥4.5 in low seismicity regions within sichuan basin. Journal of Seismological Research 43, 262–269. doi:10.3969/j.issn.1000-0666.2020.02.007
Yu, J., and Haines, J. (2003). The choice of reference sites for seismic ground amplification analyses: case study at parkway, New Zealand. Bulletin of the Seismological Society of America 93, 713–723. doi:10.1785/0120010289
Yu, J., and He, Z. (2003). Precise modeling of SH propagation in subsurface multi-layer media. Journal of Seismological Research 26, 14–19. doi:10.3969/j.issn.1000-0666.2003.01.003
Keywords: changning earthquake, ground motion, extreme amplification, site effect, azimuthal characteristics
Citation: Zhou Q, Yu J, Han C, Yuan J, Fu X, Yu K, Hou X and Fan X (2025) Study on the extremely large seismic ground motion amplification on weak-motion seismograms from the Gongquan valley. Front. Earth Sci. 13:1537480. doi: 10.3389/feart.2025.1537480
Received: 30 November 2024; Accepted: 30 September 2025;
Published: 23 October 2025.
Edited by:
Yongsheng Zhou, Institute of Geology, China Earthquake Administration, ChinaReviewed by:
Mihaela Kouteva-Guentcheva, University of Architecture, Civil Engineering and Geodesy, BulgariaSeth Carpenter, University of Kentucky, United States
Copyright © 2025 Zhou, Yu, Han, Yuan, Fu, Yu, Hou and Fan. This is an open-access article distributed under the terms of the Creative Commons Attribution License (CC BY). The use, distribution or reproduction in other forums is permitted, provided the original author(s) and the copyright owner(s) are credited and that the original publication in this journal is cited, in accordance with accepted academic practice. No use, distribution or reproduction is permitted which does not comply with these terms.
*Correspondence: Jiashun Yu, ai55dUBjZHV0LmVkdS5jbg==