 Michel Laurin
 Gilles Didier
- 1CR2P, CNRS/MNHN/Sorbonne Université, Muséum National d’Histoire Naturelle, Paris, France
- 2IMAG, Université de Montpellier, CNRS, Montpellier, France
Study of past biological crises is now a timely topic because we may be in the midst of an anthropogenic mass extinction event. A skyline Fossilized Birth-Death (FBD) analysis of a dataset of 21 varanopid taxa, ranging in geological age from the mid-Pennsylvanian to the late Guadalupian, was undertaken to assess the impact of putative mass extinction events on the Varanopidae. Our results suggest that this clade diversified in the Pennsylvanian but dwindled in diversity in the Cisuralian. This is reminiscent of the evolution of biodiversity displayed by ophiacodontids, edaphosaurids and sphenacodontids (abbreviated “the OES grade” from here on) in the same time interval. These patterns are possibly linked to a warming and aridification trend (perhaps local and linked to movements of plates in Pangea) that spanned most of the Early Permian. However, contrary to these last three clades (OES), varanopids survived until near the end of the Capitanian; this differential fate may be linked to differences in habitat use (mainly lowland for the OES grade; often more upland for varanopids). Models that include a mass extinction event that eliminated all varanopids in the late Capitanian, when a mass extinction event has been recognized by previous studies, have the most support from the data. This suggests that the last varanopids were among the many victims of the Capitanian crisis. Our analyses also support the existence of a previously unrecognized moderate extinction event in the Asselian.
1 Introduction
The evolution of biodiversity through time and extinction events are now timely topic because we are arguably in the midst of the sixth (Wake and Vredenburg, 2008) or seventh (Rampino and Shen, 2021) mass extinction, one that we are causing. The fossil record documents the mid-to long-term biodiversity patterns that show declines of biodiversity that can be very sudden (in terms of geological time) in the case of mass extinction events (Benton, 2003; Ward et al., 2005; Viglietti et al., 2021), and it documents the timing of post-crisis ecosystem and biodiversity recovery (Chen and Benton, 2012; Ezcurra and Butler, 2018) at a timescale (in the order of 105–106 years) that is impossible to achieve by studying the extant biota. Paleontological studies on this topic (e.g., Didier and Laurin, 2021; 2024) benefit from recent developments, notably the Fossilized Birth-Death model (FBD from here on).
Recent studies have suggested that up to four mass extinction events may have taken place in the Permian, which makes that period especially relevant to studies of past biological crises: a first in the Sakmarian (Benton, 1985; Brocklehurst et al., 2013), a second around the Kungurian/Roadian stage boundary (Lucas, 2017; Brocklehurst, 2018), a third one in the Capitanian (Day et al., 2015; Lucas, 2017), which might possibly represent two crises in close succession linked to the Emeishan large igneous province (Huang et al., 2019), and last but not least, at the end of the Permian (Ward et al., 2005; Viglietti et al., 2021), which is reputedly the most intensive of these events, and probably, of the Phanerozoic (Benton, 2003). While we (Didier and Laurin, 2021; 2024) found no evidence of the first (Sakmarian) event in our previous studies on three large clades of eupelycosaurs (informally defined as synapsids that are more closely related to therapsids than to caseids), we found that the second event, marked notably by the extinction of three major clades of eupelycosaurs, Ophiacodontidae, Edaphosauridae and Sphenacodontidae (the OES grade from here on) actually results from a slow decline that started in the Sakmarian and spanned the last 20 Ma of the Cisuralian.
Eupelycosaurs are a good model to study the evolution of continental Permo-Carboniferous vertebrates because of their abundance in the fossil record. In previous studies, we focused on Ophiacodontidae, Edaphosauridae and Sphenacodontidae, which all became extinct near the end of the Cisuralian or in the early Guadalupian (Didier and Laurin, 2021; 2024). The present study will focus on Varanopidae, which originated in the Pennsylvanian (Maddin et al., 2020), along with the OES grade. Varanopids, despite their modest diversity, are highly relevant because they survived the longest, well into the Capitanian (Modesto et al., 2011).
Varanopids have generally been considered to be early synapsids (Romer and Price, 1940; Reisz, 1986), but MacDougall et al. (2018) found varanopids (and the old ophiacodontid Archaeothyris, known from fragmentary material) to be basal sauropsids, a result that persists if cline characters are ordered (Laurin and Piñeiro, 2018), and more recently, Ford and Benson (2020) found them to be nested deeper into Sauropsida in their amniote phylogeny. However, Benoit et al. (2021) found compelling evidence in the maxillary canal morphology to support the traditional position of varanopids, and the recent analysis of Simões et al. (2022) found varanopids among synapsids, and we will consider them as such here, even though this has no impact on our results and is relevant mostly for the discussion. Nevertheless, some taxa previously assigned to the Varanopidae were found to be sauropsids in a recent, preliminary analysis (Jenkins et al., 2024). Our analyses take this possibility into consideration by excluding these taxa from one of our analyses.
Did varanopid diversity start declining around the Asselian/Sakmarian boundary as happened for the OES grade? If so, did they experience a recovery in the Guadalupian, as happened to many clades after a major biological crisis (Chen and Benton, 2012), including their endothermic therapsid relatives? The long survival of varanopids into the Capitanian also raises the possibility that their final demise resulted from the Capitanian crisis. That crisis is not one of the “big five” mass extinction events traditionally recognized, perhaps because its taxonomic severity was only moderate (it has ranked third to ninth according to that criterion, by various studies), but according to (McGhee et al., 2013: table 9), the severity of its ecological impact makes it the fifth most severe crisis, and Rampino and Shen (2021) also consider that the end-Capitanian event had an impact similar in severity to that of the better-known end-Cretaceous and Late Devonian mass-extinction events. Lucas (2021) also included it in the six most severe mass extinction events (at least in the seas) and explained that it was long overlooked because it was lumped with the end-Permian event in many previous studies (see also Fielding et al., 2023).
The extinction of varanopids may also mark the demise of the last remaining ectothermic synapsids, given that endothermy may have appeared at (or very near) the base of Therapsida (Faure-Brac and Cubo, 2020), depending on the position of dicynodonts among therapsids. However, endothermy in synapsids may possibly have appeared significantly later, in Triassic cynodonts (Araújo et al., 2022; Norton et al., 2023) or even in Middle Jurassic crown mammals (Newham et al., 2022). Under these alternatives, varanopids were not the last ectothermic synapsids (far from it). In any case, varanopid extinction has not been studied using FBD modeling, even though that relatively small clade exhibited remarkable longevity, and thus deserves additional scrutiny, which this study aims at tackling.
2 Methods
2.1 Geological ages and time scale
We updated the ages of the formations in our database using the September 2023 timescale (Cohen et al., 2023) and the literature cited in Didier and Laurin (2024). Within some formations, we distinguish between varanopid-bearing levels and other levels (orange in Figure 1), when relevant. This applies to the Chickasha, Clear Fork, and the Arroyo del Aqua formations. This is to clarify the age of the varanopid fossils contained therein. For instance, the Chickasha Formation extends up into the early Wordian, but the vertebrate-bearing levels are restricted to the lower portion of the formation and probably date from the early Roadian (Laurin and Hook, 2022: figure 2). As in Didier and Laurin (2024), our starting point for the correlations between the Texas basins, the German basins, and the geological time scale (GST from now on) was figure 23 in Menning et al. (2022).
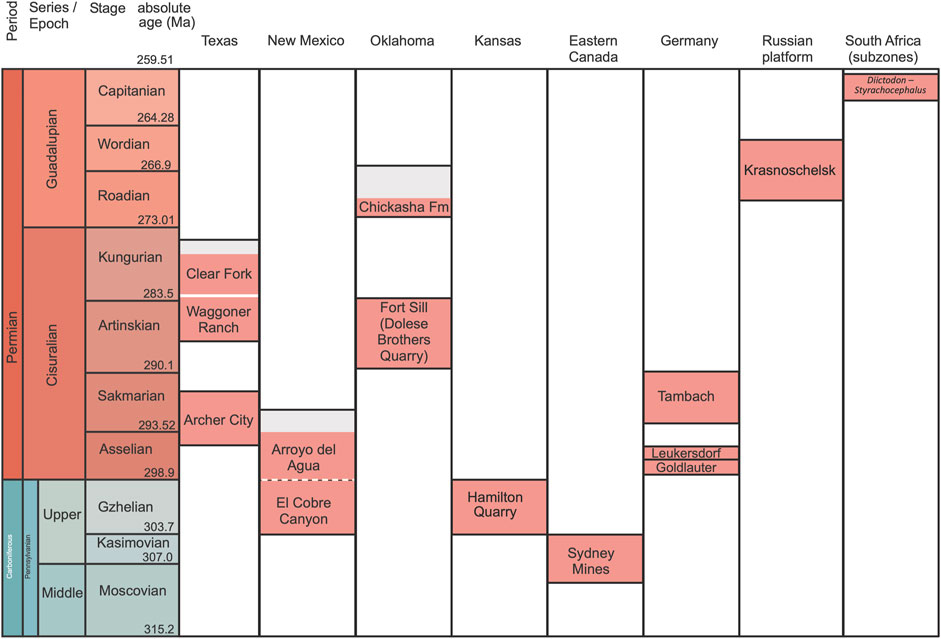
Figure 1. Stratigraphic correlations and range of possible absolute ages of the formations that have yielded varanopid remains (other coeval formations in the various regions covered by the chart are not shown). Names emphasize formations, with a few exceptions: the Fort Sill fissure fill deposits do not belong to a formation, and for South Africa, an assemblage subzone is shown. When a portion of a given formation that represents a significant thickness (and presumably much time) has not yielded varanopid remains, this is indicated by grey shading (orange shading indicates fossiliferous portions, incorporating age uncertainty). The contact between El Cobre and Arroyo del Aqua formations is gradual and conformable, both vertically and laterally. To reflect this, the contact between these formations is represented by a dashed line.
The range of possible ages shown for each formation in Figure 1 generally reflects the sum of the actual inferred duration and age uncertainty. Thus, even if varanopid fossils are found in a single stratum of a given lithological unit, the duration indicated in the table can represent a few million years because the absolute age of a given stratum is often not more precisely known. This chart should thus not be interpreted as implying that any formation or deposit necessarily lasted several million years. For instance, the Fort Sill (Dolese Brothers Quarry) deposits might represent a short duration but both their age and their duration are poorly constrained, so the height of that deposit on the chart represents much more uncertainty than duration. Recent geochronological studies of these deposits deserve comments. (Woodhead et al., 2010: 455) obtained “a well-defined age of 289 ± 0.68 Ma” U-Pb radiometric age determination from a speleothem, which translates into a [288.32–289.68 Ma] age interval. MacDougall et al. (2017) reported dates from two new speleothem samples that yielded ages of “286.7 ± 2.9 Ma [283.8–289.6 Ma], and 286.2 ± 0.2Ma [286–286.4 Ma] (uncertainties quoted as 2 sigma)”. Note the non-overlapping age intervals between the date reported by Woodhead et al. (2010) and the most precise of the two dates reported by MacDougall et al. (2017), which reflects either unaccounted for dating uncertainty, or duration of speleothem formation. Furthermore, these are the ages of the speleothems, and the fissure fills should logically be somewhat more recent (how much is difficult to determine). Last but not least, (Woodhead et al., 2010: 455) admitted, about the use of speleothem records in geochronology, that “Until recently, their utility was limited to the latter part of the Quaternary”. Until more studies have been conducted to validate the use of this method for Paleozoic speleothems, it seems prudent to view ages produced by this method with some skepticism. Because of all these considerations, the age that we assign to the Fort Sill deposits spans most of the Artinskian, an age that is consistent with biostratigraphic data (Figure 1).
Even when some units are temporally better constrained, we have been very conservative in the temporal resolution, whenever possible. For instance, there is evidence that the Hamilton Quarry deposits are mid-Gzhelian, especially from conodont zonation. Barrick et al. (2022: figure 3) indicated that the Topeka cyclothem is in the Streptognathodus virgilicus zone, and their figure 14 shows that the same zone is in the mid-Gzhelian, equivalent to the Russian Pavlovoposadian and early Noginskian substages. Given the current geological time scale (Cohen et al., 2023), this implies an age of about 301 Ma, or slightly less, because the Hamilton deposits are in a channel fill eroded into the underlying Topeka limestone. However, while the stage-level stratigraphic resolution is fairly well-constrained (at least for the maximal age), the absolute age is less certain. There are no radiometric ages for the Hamilton Quarry deposits, and even the ages of stage boundaries of the GST have changed in the recent past and will likely continue to do so in the near future. For instance, the Roadian GSSP (Global Stratotype Section and Point) was dated from 274.4 Ma in the 2020 GST from Gradstein and Ogg (2020), whereas it is dated from 273.01 Ma in the GST used here (Cohen et al., 2023), a difference of 1.4 Ma. The Gzhelian does not even have a GSSP yet (Lucas et al., 2022), so the age estimate of its lower boundary could certainly be revised in the future. Furthermore, no varanopid fossils occur in levels immediately below the Hamilton Quarry level, so setting the maximal age of these deposits a bit lower than suggested by the current literature may better account for the various sources of uncertainty without risking inverting the relative ages of varanopid fossils analyzed here.
Conversely, the stratigraphic chart (Figure 1) also accounts for the principle of superposition in a given basin, as well as some thorough studies (such as Menning et al., 2022) that correlated formations of various basins of a given area. This sometimes forced us to attribute a given formation a slightly narrower temporal range than the age uncertainty would warrant, as for the Goldlauter and Leukersdorf formations, in which we did not want to alter the relationships proposed by Menning et al. (2022).
Varanopid occurrences were extracted from the Paleobiology Database (PBDB from now on, available at https://paleobiodb.org/, consulted in October 2024) and from the primary literature. However, the age ranges indicated in the PBDB and in the primary literature were not used directly; these were assessed using our global stratigraphic correlations explained in the previous paragraph.
2.2 Reference phylogenies
The Moscovian varanopid Dendromaia unamakiensis was added to our dataset, last used by Didier and Laurin (2024), by inserting the scores from Maddin et al. (2020) for that taxon. We also added the scores for Milosaurus mccordi from Maddin et al.’s (2020) matrix, plus their character 245, and updated the state definitions for character 164. This was facilitated by the fact that we had selected the matrix from Mann and Paterson (2020), which is based on Brocklehurst and Fröbisch (2017), itself based on Brocklehurst et al. (2016). This last reference is also the source of Maddin et al.’s (2020) matrix, via the intermediate matrices of Brocklehurst and Fröbisch 2018 (on Milosaurus), itself based on Brocklehurst and Fröbisch (2017). As in our previous analyses (Didier et al., 2017; Didier and Laurin, 2021; 2024), we used topological constraints to specify affinities of the taxa that were not included in the matrix to reflect those in the literature. For instance, given that Spindler et al. (2018) found Ascendonanus to be the sister-group of Apsisaurus, and that only the latter is included in the matrix of Mann and Paterson (2020), our topological constraint places these two taxa as sister-groups. The dataset, with topological constraint, the exhaustive set of most parsimonious trees, the random samples of these parsimonious trees, and a majority-rule consensus tree, can be found in the supplements.
The resulting dataset comprises 161 terminal taxa that represent Permo-Carboniferous Cotylosauria. The taxa scored for less than 25% of the characters were removed, except for varanopids. This has three advantages. First, this should allow finding the globally shortest trees, rather than those that are optimal when varanopids are considered in isolation. Second, this simplifies the search, which should improve the probability that the phylogenetic analysis will find the shortest trees for the dataset. Indeed, Didier and Laurin (2020: 14) reported finding 200,000 trees, but there were surely more, and there is no guarantee that these were indeed the shortest trees, even though a reasonable effort was made to ensure this. Third, a greater proportion of the equiparsimonious trees will capture topological variations within Varanopidae, rather than in other parts of the tree, where it is irrelevant for this study.
We then pruned the trees to retain only the 21 varanopid taxa because the Fossilized Birth-Death model analysis requires no outgroup and it is best conducted on a clade from its origin to a given time. Thus, including a subset of other synapsid clades would have hampered the analysis, rather than help it. Also, we want to study the diversification dynamics of Varanopidae, so other taxa would have blurred that signal. Finally, the old consensus about varanopids being synapsids has been questioned recently by a few studies, as mentioned above. While our working hypothesis is that varanopids are synapsids, a reasonable doubt now exists, and this also makes analysis of Varanopidae in isolation desirable.
There are also some doubts about the composition of Varanopidae, because some taxa previously attributed to this taxon may belong elsewhere, and others may not be valid. The affinities of Pyozia mesenensis have been questioned by (Campione and Reisz, 2010: 739), who stated that “Its interpretation as a varanopid (Anderson and Reisz, 2004) is based on a specimen that does not preserve several key characters diagnostic of Varanopidae.” However, this statement is ambiguous because it could either mean that the relevant anatomical regions are preserved and lack the expected varanopid apomorphies, or that these regions are not preserved. The first case would raise more serious doubts about varanopid affinities than the second. However, Benson’s (2012) analyses based on the complete dataset (his figure 3) and on cranial characters (his figure 4), placed Pyozia among varanopids. Only the analysis based exclusively on postcranial characters (Benson, 2012: figure 5A) and including all taxa fails to support varanopid affinities (without disproving them) because it yields a poorly-resolved polytomy consisting of most synapsid terminal taxa, including Pyozia. However, even well-accepted clades such as Caseasauria, Caseidae, Ophiacodontidae, Sphenacodontidae, and Therapsida are not recovered, so we do not consider that this analysis raises serious doubts about the affinities of Pyozia. More recently, Brocklehurst and Fröbisch (2018) reassessed its affinities and confirmed that it appears to be a varanopid.
Ruthiromia elcobriensis likewise may not be a varanopid. Eberth and Brinkman (1983), who erected this taxon, considered it to be a varanopid, but Spielmann and Lucas (2010) argued that it was best interpreted as an ophiacodontid. However, Benson (2012) consistently found it among Varanopidae, except in the analysis that yielded a huge polytomy with very little resolution (Benson, 2012: figure 5A). Brocklehurst et al. (2016), who used an expanded version of Benson’s data matrix, also recovered Ruthiromia in the Varanopidae, and this result was accepted by Spindler et al. (2018), whose analysis, based on a new matrix, also placed Ruthiromia in the Varanopidae.
More problematic is the status of Anningia megalops and Microvaranops parentis. A. megalops was declared a nomen vanum by Reisz and Dilkes (1992) because the material (a fragmentary skull) is not diagnostic. Spindler et al. (2018: 351) disagreed and retained it as a distinct taxon. Spindler et al. (2018: 352) erected the taxon Microvaranops parentis for material initially attributed to Heleosaurus scholtzi by Botha-Brink and Modesto (2007), but Modesto does not agree with this new interpretation of the material and does not recognize M. parentis as a valid taxon (S. P. Modesto, pers. comm. 21 May, 2023). Sibiya (2024) went further and synonymized all South African varanopids (including Elliotsmithia) with Heleosaurus scholtzi.
A recent study suggested that Varanopidae, as currently delimited, might be polyphyletic. Namely, Jenkins et al. (2024) suggested that Ascendonanus nestleri and Cabarzia trostheidei were sauropsids, rather than forming a clade with other varanopids.
In light of these problems, we conducted two sets of analyses: one with the 21 varanopid taxa, and one with only 16 taxa (Ascendonanus, Cabarzia trostheidei, Anningia megalops, Microvaranops parentis and Elliotsmithia longiceps were excluded). That way, we bracketed our results between a maximal known varanopid biodiversity (21 taxa), and a minimal (most conservative) one (16 taxa). Comparison of the results should indicate the sensitivity of our results to these divergent interpretations. We also considered two other reduced datasets with 15 and 17 taxa, but these were less justifiable given the literature on varanopids, and their results were very similar to those of the dataset with 16 taxa, so they are not presented below, to avoid unduly burdening the reader with unnecessary detail.
We did not include SAM-PK-K10407, the youngest specimen of varanopids, because according to Spindler et al. (2018: 351), that specimen “does not exhibit any distinction from Elliotsmithia, the holotype of Heleosaurus, or BP/I/5678.” Thus, it is unclear if it belongs to a distinct lineage, or represents a stratigraphic range extension of Elliotsmithia or Heleosaurus. That specimen is only very slightly more recent than other varanopid specimens because it was reported from the lowest part of the Pristerognathus Assemblage Zone (Modesto et al., 2011). That (small) part of the Pristerognathus Assemblage Zone is now considered to be part of the Diictodon - Styracocephalus subzone of the Tapinocephalus Assemblage Zone (Day and Rubidge, 2020: 158), contrary to the bulk of the Pristerognathus Assemblage Zone, which has been incorporated into the Endothiodon Assemblage Zone (Day and Smith, 2020). Heleosaurus occurs through most of that subzone (Day and Rubidge, 2020: figure 7). The age of that subzone was constrained by Day et al. (2022) to 262–260 Ma (late Capitanian). Thus, SAM-PK-K10407 could be about 100,000 to 300,000 years younger than the last specimens of Heleosaurus and could have only minimal impact on the probable time of extinction of Varanopidae.
The data matrix was analyzed using PAUP for Macintosh version 4.0a (build 169). The search parameters included 50 random addition sequence replicates and tree-bisection-reconnection (TBR). As in our previous analyses, cline characters were ordered because simulations show that this yields better results (Rineau et al., 2015; Rineau et al., 2018).
2.3 The skyline FBD model
As in Didier and Laurin (2024), we consider the skyline FBD model (Gavryushkina et al., 2014 and Zhang et al., 2016). This model assumes that the diversification process starts with a single lineage at the origin time, which is a parameter of the model. Next, each lineage is subject to three types of events: speciation/cladogenesis, extinction, and fossilisation, which occur at rates λ, μ and ψ respectively, which are also parameters of the model. These rates are piecewise-constant wrt time. Namely, the diversification time is divided into time slices during which the rates are constant but these rates can change between time slices. Moreover, the lineages alive at the end of a time slice of the model are sampled with a survival probability ρ, which gives the possibility to model mass extinction events of various intensities (or not, by setting ρ to 1).
Our implementation of the skyline FBD model, presented in Didier and Laurin (2024), is based on the computation of the probability density of a phylogenetic tree with fossils, which does not require the knowledge of the diversification times, only that of the fossil ages. Our software allows us to specify various constraints on the parameters of the model (e.g., to constrain the fossilization rate to be constant through all the time slices) and to perform various analyses. In particular, we compare the accuracy of “model specifications” or “models” (i.e., the number of time slices, their boundaries and the constraints over the parameters) by considering the corresponding AIC (Akaike, 1998). The AIC of a model specification requires to compute the maximum likelihood associated to a dataset. For technical reasons, we consider the maximum likelihood not only with respect to the model parameters but also with respect to the fossil ages. Specifically, the likelihood is maximized both over the model parameters and over the fossil ages within their stratigraphic intervals. It follows that the maximum likelihood thus obtained is associated with a particular configuration of fossil ages.
In the present work, we use an improved implementation of our software in which:
1. the computation of the maximum likelihood is obtained numerically by using the Nelder-Mead simplex algorithm (Nelder and Mead, 1965) from the NLopt library (Johnson, 2014), rather than approximated by the maximum likelihood observed during MCMC runs as in the previous version of the software;
2. the boundaries of the time slices may be treated as parameters, thus inferred or sampled.
2.4 Simulated dataset and related models
In order to illustrate these new features, we applied the new version of the software to the simulated dataset of Didier and Laurin (2024), which is displayed in Figure 2. This dataset was simulated under a model with three time slices [350, 250], [250, 200] and [200, 0] Ma, and birth, death and fossilization rates 0.03, 0.01 and 0.02 during [350, 250], 0.1, 0.01 and 0.02 during [250, 200] and 0.01, 0.01 and 0.02 during [200, 0]. The lineages alive at 250 (at the end of the first time slice) are sampled with survival probability 0.2, while those alive at 200 and 0 are fully sampled (see Didier and Laurin, 2024: figure 1). Moreover, the exact fossil ages of the simulation were replaced by intervals of length 10 Ma uniformly drawn around them (i.e., randomly, such that the actual age of the fossil can be located anywhere in that interval), in order to account for the uncertainty on the fossil ages in real life datasets.
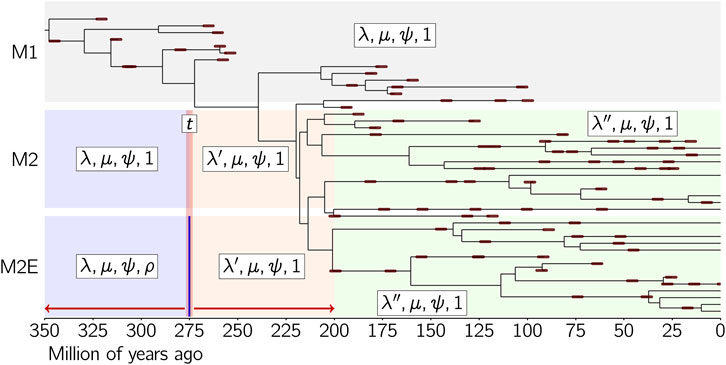
Figure 2. The simulated dataset from Didier and Laurin (2024), where fossils are represented as thick brown lines encompassing their stratigraphic interval (which represents uncertainty on the age of the fossil, rather than duration), and the three models considered. M1 has a single time slice with full sampling at the end. M2 and M2E have three time slices, the age of the boundary between the first two time slices being a parameter t. The extinction and fossilization rates are constrained to be constant for all the time slices for both M2 and M2E, while the speciation rate is allowed to change between time slices. The sampling probability at time t is a parameter ρ for model M2E, while is assumed to be equal to 1 for model M2. The parameters of each time slice are displayed in boxes in the following order: cladogenesis, extinction, fossilization rates and the survival probability at the end of the time slice.
We shall consider three models M1, M2 and M2E, defined as follows (Figure 2). Model M1 has a single time slice [350, 0] with full sampling at the end (M1 is the model M0 of Didier and Laurin, 2024). Models M2 and M2E have three time slices [350, t], [t, 200] and [200, 0], where the boundary between the two first time slices is a parameter t. Each time slice of M2 and M2E has a specific speciation rate but all share the same extinction and fossilization rates. The sampling probabilities at times 200 and 0 are 1 for both M2 and M2E, while the sampling probability at t is set to 1 for M2 and is a parameter to be estimated for M2E. In other words, the only difference between M2 and M2E is that a mass extinction event is allowed at t for M2E but not for M2. Model M1 has three parameters, λ, μ and ψ, the cladogenesis, extinction and fossilization rates of its single time slice. Model M2E has seven parameters: t, λ, λ′, λ'', μ, ψ and ρ, while M2 has six parameters: t, λ, λ′, λ'', μ and ψ (Figure 2). Note that the dataset of Didier and Laurin (2024: figure 1), considered here, was simulated by using model M2E with parameters t = 250, λ = 0.03, λ' = 0.10, λ'' = 0.01, μ = 0.01, ψ = 0.02 and ρ = 0.2.
2.5 Models considered on the biological datasets
Since it cannot lead to any confusion, we use the same notations for the models considered on the empirical datasets as those for the simulated dataset, though they do differ in particular on the constraints on their parameters.
For all the models considered on the empirical datasets, we assume that the fossilization remains constant during the whole diversification process. Namely, all the models below contain the constraint that the fossilization rate is the same for all the time slices. We also assume that the diversification of the Varanopidae started at 350 Ma.
We are mainly interested in the two following questions:
• Were the Varanopidae affected by a (total) mass extinction at the end of the Capitanian?
• How complex was their diversification?
Since no varanopid fossils are dated after the Capitanian, the most likely models that include a mass extinction event at the end of the Capitanian have a survival probability of zero at this time (giving the absence of observed fossils afterward a probability of 1). In order to answer the first question, we shall consider the support of models with or without such a total mass extinction event at the end of Capitanian.
About the second question, the complexity of the varanopid diversification has to be understood here in terms of the number of time slices and of mass extinction events required to accurately model it. Due to the size of the empirical datasets, we shall consider only models with one or two time slices, with or without a mass extinction at the end of the first time slice in the latter case. To sum up, we shall consider the support of six models M1, M2, M2E, M1T, M2T and M2ET defined as follows (Figure 3). Models ending with “T” include a total mass extinction event at the end of the Capitanian. Models with “1” in their identifier have a single time slice (M1 and M1T), while those with “2” have two time slices (M2, M2E, M2T and M2ET), the boundary between the time slices of the latter models being a parameter t to be estimated. In biological terms, parameter t represents the time at which the diversification process changes (in rate of cladogenesis, extinction, or both) in Varanopidae, before the clade becomes extinct. Lastly, models with two time slices may contain a mass extinction event (whatever its intensity) at the end of the first time slice, in which case there is an “E” in their identifier (M2E and M2ET), or no mass extinction event at the end of the first time slice (M2 and M2T).
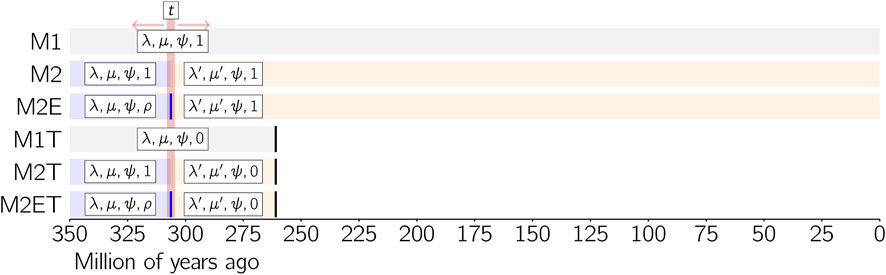
Figure 3. The six models considered on the two empirical datasets. Parameters associated to each time slice of a model are displayed in boxes. When a same parameter appears in several time slices, it means that it is constrained to be the same among them (here, the fossilization rate ψ for models M2, M2E, M2T and M2ET).
3 Results
3.1 Geological ages and time scale
The postulated stratigraphic correlations and absolute ages of the various formations that have yielded varanopids are summarized in Figure 1. We note that the Hamilton quarry deposits have usually been indicated as being a channel fill in the Calhoun Shale (e.g., Reisz and Dilkes, 2003), but the channel fill is mostly in the lower Topeka limestone, which is above the Calhoun Shale (Leonard, 1991; Cunningham et al., 1993: figure 2; Salley et al., 2005; Ezerendu, 2012), and it is unclear how much younger than the Topeka limestone these channel fill deposits may be (Salley et al., 2005).
The late Kungurian gap in the North American synapsid fossil record discussed by Laurin and Hook (2022: 19–20) is visible in the upper portion of the Clear Fork Formation (typically considered a group in older studies), although its vertical extent is a bit exaggerated in Figure 1 by the fact that we did not include the San Angelo Formation, which has yielded synapsids, but not varanopids, and which is slightly older (probably earliest Roadian) than the Chickasha Formation (Laurin and Hook, 2022: figure 2).
3.2 Simulation of the skyline FBD process
Our model selection procedure among M1, M2 and M2E on the simulated dataset yields fairly good results (Table 1). We first observe that the numerical optimization of the log-likelihood to get its maximum improves the MCMC approximation computed by the previous version of the software for the model M1: −597.34 vs. −600.14 (Didier and Laurin, 2024: table 1; where M0 corresponds to model M1 in the present study).
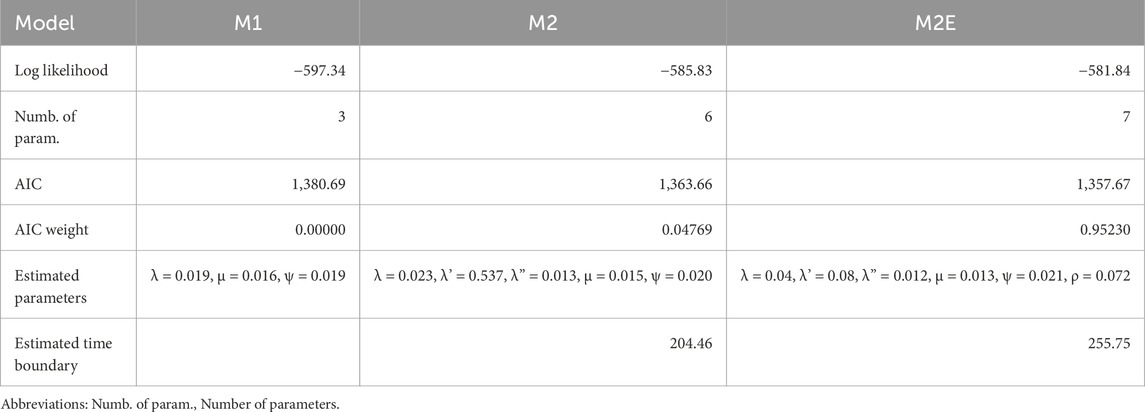
Table 1. Fit of models M1, M2 and M2E obtained by numerical optimization on the simulated dataset displayed in Figure 2, which shows that the method usually selects the correct model with good support. The AIC computation takes into account its number of fossils, i.e. 90.
Next, the best supported model is M2E, with an AIC weight over 95%, which is perfectly consistent with the way in which the dataset was simulated. Model M1 (the one with a single time slice) has an insignificant AIC weight, while Model M2—essentially ‘M2E without a mass extinction event at the end of the first time slice’—is only weakly supported, with an AIC weight below 5%.
Lastly, the maximum likelihood estimates of all the parameters of M2E are quite close to those used for the simulation except that of the survival probability at the end of the first time slice, which is estimated to be nearly one-third of the probability used to simulate the dataset. This survival probability was expected to be challenging to estimate, especially with such a small dataset. We refer readers to Didier and Laurin (2024) for a more detailed discussion of this point, but we note that the survival probability estimated for the simulated dataset is less under-estimated by the numerical optimization than by the MCMC procedure that we had used previously (Didier and Laurin, 2024). More interestingly, the new feature of our software estimates the boundary time t to be 255.75 Ma. This is actually quite close to the 250 Ma boundary time used to simulate the dataset, especially when considering the uncertainty that we added in fossil ages (10 Ma).
3.3 Biodiversity evolution
The FBD analysis shows that the Varanopidae started diversifying only a little earlier than the oldest known varanopid (Figure 4). The latter is Dendromaia unamakiensis, from Point Aconi, coeval and geographically close to Florence (Nova Scotia), which Maddin et al. (2020) suggested were of late Moscovian age. However, these localities could also date from the Kasimovian (Brikiatis, 2020), and we consequently set the range of possible ages of Dendromaia as encompassing both proposed ages (309–307.7 Ma). The peak probability density for the basalmost divergence in Varanopidae is in the mid-Moscovian (about 314.3 Ma, central 95% CI [322.8, 307.2]), which implies that the first varanopid fossil dates only from 7 Ma after the origin of Varanopidae. Using the reduced dataset of 16 taxa does not change significantly this result (Figure 5), given that this yields a peak probability density of about 315.7 Ma, with a central 95% CI that extends from 320.6 to 303.6 Ma.
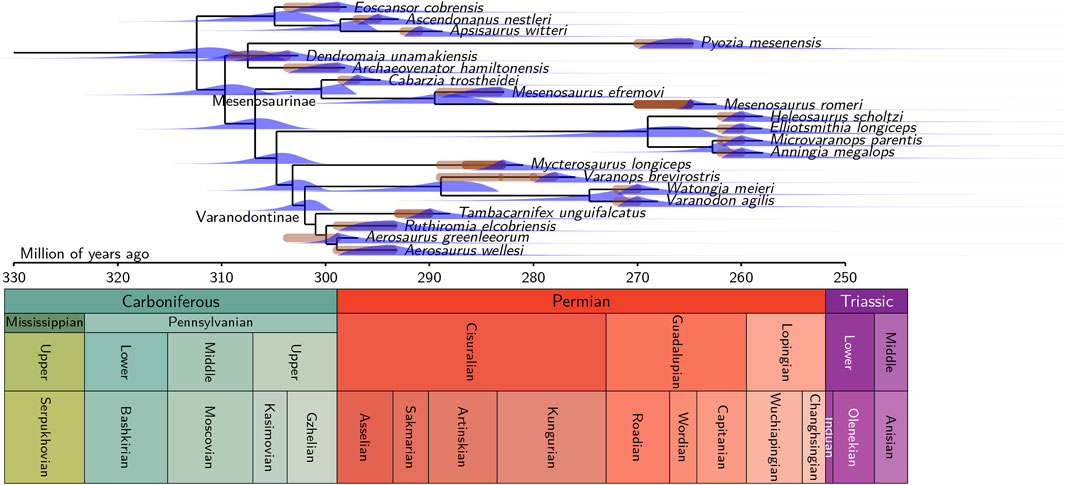
Figure 4. Timetree of varanopidae, with the full dataset (21 taxa) obtained through FDB, showing the probability densities of extinction times for all terminal lineages, and of divergence times for most nodes (a few omitted for lack of space). The phylogenetic definition of Varanodontinae proposed by Modesto et al. (2001), “a stem-based group that includes Varanodon agilis and all varanopseids related more closely to it than to Mycterosaurus longiceps” is followed here. Mycterosaurinae, as defined in the same paper, includes only Mycterosaurus longiceps, so it is redundant. We provide an informal phylogenetic definition of Mesenosaurinae, a taxon erected but not phylogenetically defined by Spindler et al. (2018) as the largest clade that includes Mesenosaurus romeri Efremov 1938 but not Mycterosaurus longiceps Williston 1915.
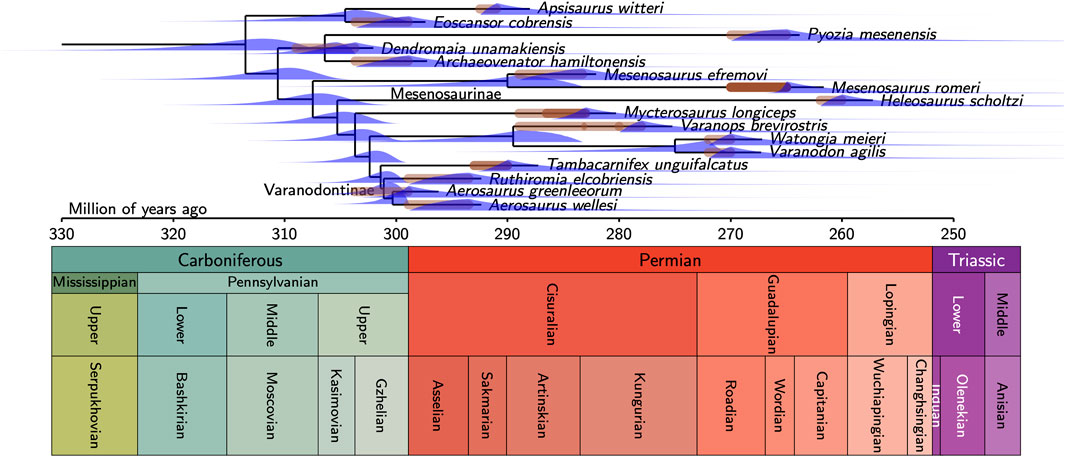
Figure 5. Timetree of varanopidae, with the reduced dataset (16 taxa).
The FBD analysis confirms that the Varanopidae survived at least until the Capitanian crisis, with the best-supported models including a total extinction event at the end of the Capitanian. Under the assumption that no mass extinction event occurred, Varanopidae may have persisted until the Carnian with a significant probability, but the corresponding models are very poorly supported by both empirical datasets (Tables 2, 3). The exact timing of the event on land is uncertain, but it is almost certainly in the last two-thirds of the Capitanian (Lucas, 2021; Fielding et al., 2023), and at least among large fusulinids in the seas, Arefifard and Payne (2020) made a strong case for a single extinction event at the end of the Capitanian. A late Capitanian mass extinction event is supported by the analyses based on both datasets. On the exhaustive (21 taxa) dataset (Table 2), the three models with a Capitanian total extinction event (marked by a final “T” in their name) collectively represent more than 99.7% of the AIC weight, and the best model without such a total extinction event barely gets 0.18% support; in the reduced (17 taxa) dataset (Table 3), the three models with a Capitanian total extinction event collectively represent more than 93% of the AIC weight. Thus, models where varanopids survived beyond the Capitanian are not significantly supported by either of the datasets.
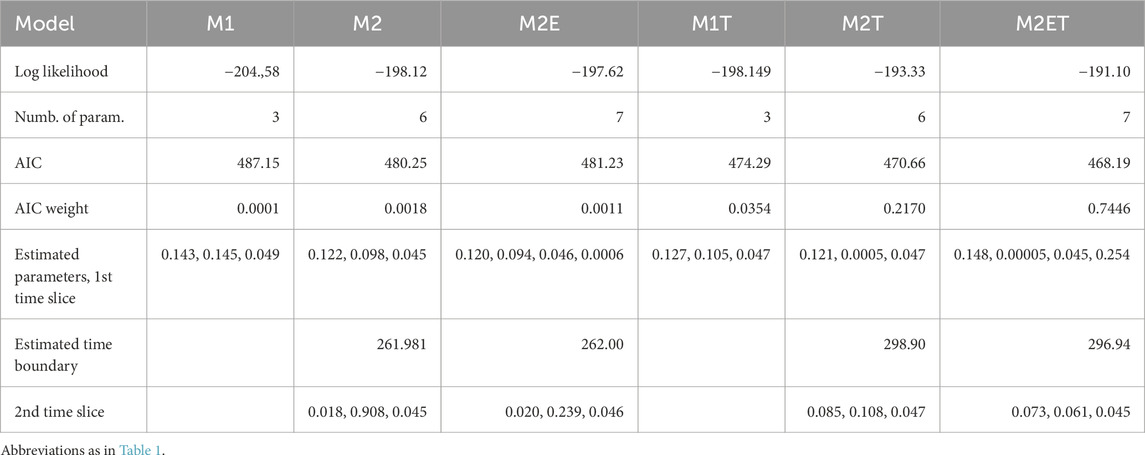
Table 2. Fit of the FBD models of varanopid biodiversity evolution through time, for the complete dataset (21 taxa). Models have either a single time slice (M1, M1T) or two slices (M2, M2E, M2T, M2ET). Models with a mass extinction event that did not eliminate all varanopids at the end of the first slice have an “E” in their name (M2E and M2ET). Models with a total extinction event (i.e., a boundary with a null survival probability) at 259.51 Ma, the end of the Capitanian, have a “T” in their name (M1T, M2T and M2ET). The boundary between the first two time slices is estimated from the dataset (Figure 3). The estimated parameters are given in the following order: cladogenesis, extinction, fossilization rates and the survival probability at the end of the time slice, when a mass extinction event is modeled (M2E and M2ET).
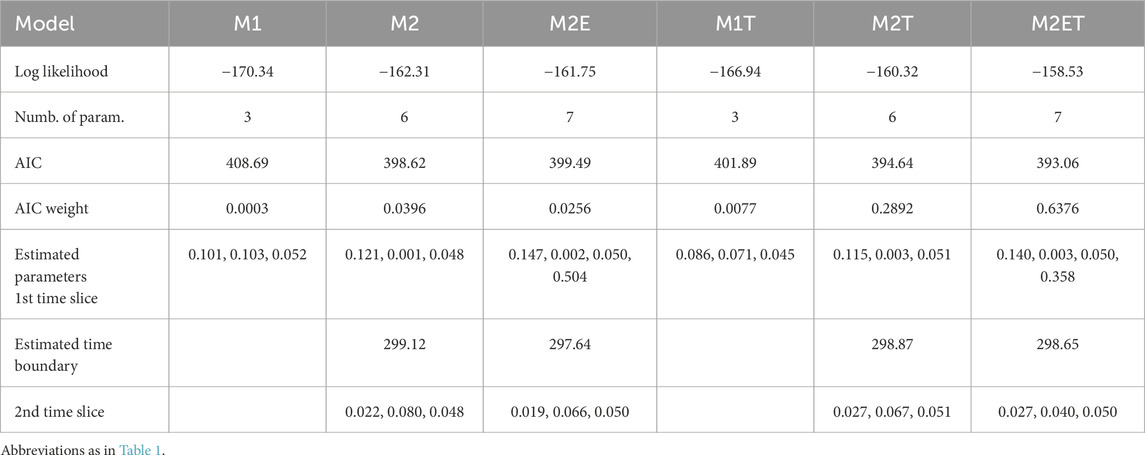
Table 3. Fit of the FBD models of varanopid biodiversity evolution through time, for the restricted dataset (16 taxa). Models have either a single time slice (M1, M1T) or two slices (M2, M2E, M2T, M2ET). Models with a mass extinction event that did not eliminate all varanopids at the end of the first slice have an “E” in their name (M2E and M2ET). Models with a total extinction event (i.e., a boundary with a null survival probability) at 259.51 Ma, the end of the Capitanian, have a “T” in their name (M1T, M2T and M2ET). The boundary between the first two time slices is estimated from the dataset (Figure 3). The estimated parameters are given in the following order: cladogenesis, extinction, fossilization rates and the survival probability at the end of the time slice, when a mass extinction event is modeled (M2E and M2ET).
Surprisingly, the best model for both datasets (full and reduced) supports the existence of a moderate extinction event in the Asselian, which was never recognized before, as far as we know. Support for this is only moderate, however, with an AIC weight of 74.5% on the full dataset, and 63.8% on the reduced dataset. The inferred survival probability is relatively low according to both dataset (25.4% in the complete and 35.8% in the reduced dataset). According to these models, this event qualifies as a mass extinction event of moderate intensity, so this intriguing finding deserves additional scrutiny. Unexpectedly, no model suggests a mass extinction event (or even a limit between time slices) around the Kungurian/Roadian boundary, when the OES grade disappears from the fossil record (Didier and Laurin, 2021; 2024).
The difference in AIC weight between the best-supported model and the other models is about as large as in our previous study (Didier and Laurin, 2024), at least for the complete dataset (Table 2). For the reduced dataset (Table 3), the difference in support between the best and second-best models is slightly less (though still more than two-fold), but these two models differ mostly in the presence, in the best-supported model (M2ET), of a partial mass extinction event near the Permo/Carboniferous boundary, and its absence in the second-best model (M2T).
Both best-supported models on the complete dataset, which collectively represent more than 96% of the AIC weight, infer a time boundary between the two time slices in the Asselian, just after the Permo/Carboniferous boundary, at 296.94 and 298.9 Ma (Table 2). The two best-supported models of the reduced dataset, which collectively represent more than 92% of the AIC weight, also infer time boundaries around that time: at 298.6 Ma for the best model and 298.9 Ma for the second-best model (Table 3). These results differ only slightly from the results of Didier and Laurin (2024), in which the limits between time slices were set a priori on stage boundaries. In that study, the best model (with an AIC weight of 65%) included a boundary at the end of the Asselian, rather than in the middle of the Asselian for both the complete and reduced datasets here. The second-best model (with an AIC weight of 22%) found by Didier and Laurin (2024) featured a slightly earlier boundary, at the beginning of the Asselian, which is very close to the results under the two best models for the two varanopid datasets. Our findings that the limit between these two time slices could actually be in the Asselian in these three cases would explain the moderate difference in AIC weight between the two best-supported models in Didier and Laurin (2024).
The best-supported models include two time slices, although support for the presence of two time slices is a bit weaker in the complete dataset, in which these models collectively represent more than 96% of the AIC weight (Table 2), than in the reduced dataset, in which these models represent about 99.2% of the AIC weight (Table 3). In both cases, these models (described above) support a boundary between these slices located near the Permo/Carboniferous boundary, but two models, with very low support, suggest a very narrow time slice located in the mid-Capitanian boundary, at 262 Ma. However, these models, both for the full dataset, consistently have very low support, between 0.11% and 0.18%. They are actually very similar to model M1T, which features a single time slice ending with the total extinction event at the end of the Capitanian. Specifically, the survival probability at the end of the first time slice in M2E is nearly zero, and the extinction rate in the second time slice of M2 is high relative to the rates of cladogenesis and fossilization, leading to a similar pattern. The inference that the end of the first time slice occurred in the mid-Capitanian, rather than at its end as defined in M1T, is likely a consequence of maximizing the likelihood with respect to the fossil ages (the mid-Capitanian corresponds to the lower bound of the most recent stratigraphic intervals).
As in our previous study on other eupelycosaurs (Didier and Laurin, 2024), the rates of cladogenesis fall between the first and the second time slices in the best models, but not nearly as much. Rather than seeing a ten-fold decrease in these rates, the decrease is only by about a third to a little more than 80%, according to the best models (M2T and M2ET) on both datasets. Another difference is that we also detect a strong increase in extinction rates, rising from nearly zero in the first time slice to levels that range from only slightly less than those of cladogenesis rates (M2ET in the complete dataset) to nearly two and a half time higher (M2T, reduced dataset). However, contrary to our previous study, in the two best-supported models, it is unclear if the extinction rate remained below the origination rate (M2ET on the complete dataset), or raised above it (M2T on the full dataset, and both models on the reduced dataset).
None of the models suggests a significant recovery of varanopid taxonomic diversity in the Cisuralian or in the Guadalupian (Tables 2, 3). All models with two time slices feature a sharp increase in extinction rate, and the most supported models all feature an origination rate at best slightly above the extinction rate. Only poorly-supported models that place a second time slice in the Capitanian feature an extinction rate much greater than the origination rate. This characterizes two models for the full dataset (Table 2). However, support for these models is less than 0.2%, and the parameter estimates of these models are based on so few data that they are probably unreliable. The high extinction rate of these models is an alternative way of explaining the extinction of Varanopidae around the end of the Capitanian, without resorting to a mass extinction event, and is probably an artifact of accepting the validity of 4 varanopid taxa in the Capitanian of the Karoo Basin, rather than a single taxon, as advocated by the latest taxonomic revision of that material (Sibiya, 2024).
4 Discussion
4.1 Drop in eupelycosaur paleobiodiversity in the cisuralian and possible environmental causes
Didier and Laurin (2024: 292) noted a sharp drop in diversification rates of the OES grade starting around the Asselian/Sakamarian boundary and until their extinction in the Kungurian or Roadian, and we likewise find evidence for a negative change in diversification dynamics in varanopids around that time, though of a much lower amplitude and possibly slightly earlier, in the Asselian. Didier and Laurin (2024) did not identify a probable cause for this decline.
A look at the paleoclimatological data leads us to revise our opinion on this point. The slow demise of these four clades (although varanopids persisted longer than the three other clades) might have resulted from climatic changes, given that various data sources suggest a warming and aridification trend starting around that time. Namely, Hembree (2022) described ichnological and pedotype evidence that suggests a trend of decreasing and more seasonal precipitation in the Appalachian Basin in a 8–10 million year interval around the Permo/Carboniferous boundary, and Henderson et al. (2020: 895) reported that “A fluctuating trend around a mean δ18O value of 22 begins in the Sakmarian and continues through much of the remaining Permian indicating an overall warmer climate following glaciation.”
Several studies suggested gradual but marked warming and drying from around the Permo/Carboniferous boundary through the Kungurian, if not later (Montañez, 2016; Qie et al., 2019). Marchetti et al. (2022) found evidence for a decrease in hygromorphic taxa and an increase in xeromorphic taxa in stegocephalian ichnofossils, in plant macrofossils, and in sporomorphs from the southern Alps (Italy). They concluded that the most spectacular change that they identified occurred around the mid-Artinskian, but their study emphasized only three time bins (required to get a large enough sample size), namely, one in the Asselian, a second one in the Sakmarian and early Artinskian, and a third one in the late Artinskian and Kungurian. This low temporal resolution could hide a more complex pattern, and indeed, their results for sporomorphs from Europe and North Africa (Marchetti et al., 2022: figure 16) and those of megascopic plant remains from North America (Marchetti et al., 2022: figure 17) suggest that the warming and drying trend started around the Asselian/Sakmarian transition. The decrease in anamniotic stegocephalians (“amphibians” in their nomenclature) and the increase in reptiles suggest a similar climatic trend (Marchetti et al., 2022: figures 16, 17).
A possible cause of the inferred warming (which was associated with a drier climate) may be two LIPs (Large Igneous Provinces): the Tarim LIP of NW China, and the Panjal Traps from Kashmir. The Tarim LIP covers an area of about 250,000 km2, it may represent a deposit of more than 300,000 km3, and it formed mostly around 291–287 Ma ago (Wei et al., 2020: 2), which spans the Sakmarian/Artinskian boundary. However, the time of deposition of these basalts extends over a longer period, from 295 to 282 Ma approximately (Wei et al., 2020: table 1), which spans the late Asselian to early Kungurian, and this timing is compatible with the hypothesis that these deposits and the associated CO2 release could explain the decrease in eupelycosaur diversity observed by Didier and Laurin (2024). The exposed area of the Panjal Traps is smaller, at only about 10,000 km2, but the Himalayan volcanic areas to which they belong may cover as much as 200,000 km2 (Shellnutt et al., 2011: 4), so the latter may also have been a major contributor to Cisuralian climate change. The Panjal Traps are dated at 289 ± 3 Ma (around the early Artinskian), which makes them approximately contemporary with the Tarim LIP.
Ironically, just before this period of gradual warming, there was a very fast cooling event that may also have played a role in the demise of many eupelycosaurs. Simões et al. (2022: 4) noted that the Permian included “several points peaking above 3°C/Ma and two above the critical 5.2°C/Ma rate level—a recently recognized critical threshold common to all periods of climate change directly related to major mass extinctions”. This hypothesis is supported by the recent analyses of Song et al. (2021), which showed that magnitude and rate of change in temperature are positively correlated with extinction rate in marine animals. Simões et al. (2022: 4) even attributed the Sakmarian-Artinskian Crisis to a major glaciation event. Their supplementary data file S1 shows that this peak in temperature drop is around 294 Ma, which is very close to the Asselian/Sakmarian boundary (293.52 Ma) according to the 2023 timescale (Cohen et al., 2023). That peak thus temporally coincides approximately with the drastic regime change (ten-fold drop in diversification rates) found by Didier and Laurin (2024) in ophiacodontids, edaphosaurids and sphenacodontids, and with a less spectacular change in varanopid diversification rate over the same period identified by the best-supported models. That is also approximately the time of the maximal glaciation of the Late Paleozoic Ice Age that is inferred to be around the Gzhelian/Asselian boundary (Wang et al., 2013).
That peak in temperature drop also matches approximately the age of the moderate extinction event that we identify in the Asselian. No extinction event had been identified at that time (at least among vertebrates) as far as we know, although methodological differences (notably the use of time binning with relatively long time bins, at least one geological stage in duration) might explain why some studies (Benton, 1985; 1989; Brocklehurst et al., 2013) reported such an event slightly later, in the Sakamrian, and possibly in the Artinskian. Alternatively, for varanopids, this event may not have been recognized earlier simply because much of the Carboniferous and Asselian diversity in the clade (Eoscansor, Dendromaia, Cabarzia and Ascendonanus) was described recently, between 2017 and 2022, after most previous studies on biodiversity evolution in early synapsids were published.
Both this study and our previous work (Didier and Laurin, 2024) failed to detect an end-Kungurian extinction event. This negative result is interesting and deserves a few comments. This lack of late Kungurian event is unlikely to be a false negative because our simulations (Table 1) show that the method is powerful; it selects the model with a mass extinction event in 95% of the cases, in the tested parameter space. This suggests that contrary to the phylogenetic taxon count method (incorporating ghost ranges) tested by Lane et al. (2005), our method does not magnify the Signor-Lipps effect and thus, does not miss signals of a genuine crisis. Admittedly, our scheme allowed no more than two mass extinction events (one at the end of the Capitanian and an earlier one, at the transition between two time slices), and this may have constrained our results, to an extent. However, an important mass extinction event should have overwhelmed a moderate diversification and extinction rate change at other times and should have resulted in a delimitation of time slices reflecting that event. Furthermore, Didier and Laurin (2024) specifically checked for an end-Kungurian extinction, but that model had very little support (model Me5, with an AIC weight well below 1%).
Clearly, the floristic and ichnological evidence for climate change and for intense volcanic activity cannot be explained by the filling of some basins in the SW USA and associated evaporite deposits (evoked by Laurin and Hook, 2022: 20), but along with the latter, they provide a plausible explanation to the eupelycosaur biodiversity pattern observed by Didier and Laurin (2024). Our new results even support the existence of a biological crisis in varanopids, along with a diversification dynamic shift toward the beginning of the Permian. All these data suggest a plausible scenario in which climate change (towards a warmer, drier climate), possibly caused partly by volcanic activity, caused the demise of Ophiacodontidae, Edaphosauridae and Sphenacodontidae (Didier and Laurin, 2024), along with a crisis and slower decline of varanopids.
A rather different scenario can be envisioned under alternative paleogeographic reconstructions. Kent and Muttoni (2020: 14) argued that the apparent aridification seen in several Permo-Carboniferous basins (notably those that yielded Cisuralian synapsid fossils) reflects their northward movement out of the tropical humid zone and into the tropical (and subtropical) arid zone. If so, the decline in diversity of the four eupelycosaur clades mentioned above in the late Cisuralian and Guadalupian might be a local phenomenon. Possibly, these clades (Varanopidae, Ophiacodontidae, Edaphosauridae and Sphenacodontidae) might have persisted elsewhere beyond the time at which they seem to vanish from the fossil record of Permo-Carboniferous continental vertebrates, which is geographically very restricted (essentially to what is now parts of Europe and North America).
4.2 The different fate of varanopids and therapsids
Why did varanopids become extinct much later than ophiacodontids, edaphosaurids and sphenacodontids? Varanopids were apparently affected by the environmental changes that took place in the Cisuralian, but contrary to what happened to the OES grade, varanopids survived well after the Kungurian, and did not become extinct before the Capitanian (when taking the fossil record at face value). There is even a very slight probability that this extinction took place much later, as late as the Carnian, under the assumption that no rate shift and no mass extinction event took place, in other words, that model M1 holds. However, model M1 has a very low support (0.24% AIC weight or less on both datasets, Tables 2, 3), so it should be viewed as a remote possibility.
It might be tempting to view this differential fate as a confirmation of the interpretation of varanopids as sauropsids rather than synapsids, as suggested by some recent studies (MacDougall et al., 2018; Ford and Benson, 2020). However, the fact that casesaurs (whose synapsid status has not been questioned recently, as far as we know) similarly extend into the Guadalupian (but probably not beyond the Roadian) is not consistent with this simple phylogenetic explanation.
A more plausible alternative is that varanopids appear to have occupied upland environments, as suggested by the presence of two varanopid taxa (Varanops and Mycterosaurus) at Richards Spur, also known as Fort Sill. That locality also produced a caseid and a small Dimetrodon taxon, but no ophiacodontid and no edaphosaurid (Brink et al., 2019: table 1). In fact, Brink et al. (2019: 8) concluded that “varanopids were the apex predators in the uplands”. Caseids, which also survived well after the end of the Cisuralian, also appeared to have occurred fairly frequently in upland environments, and may even have originated there (Reisz, 2005). On the contrary, the OES grade is known mostly from the lowlands (Reisz, 2005; Brink et al., 2019) and may have occupied mostly these habitats. These differences in preferred habitats may explain why varanopids (and apparently caseids) may have been less adversely affected by the climatic changes that occurred in the Cisuralian (our best-supported models suggest that varanopids were affected, but probably to a lesser extent than the OES grade).
Synapsid recovery (through therapsids) in the Guadalupian, if it is not a taphonomic artifact, could be related to a cooler climate. Henderson et al. (2020: 895) reported that “Though not apparent in the oxygen-18 curve, there is faunal evidence for significant cooling after the early Roadian in the Sverdrup Basin continuing for most of the rest of the Permian (Beauchamp, 1994; Henderson, 2002) and cooling in the Capitanian in the Salt Range, indicating bipolarity in cooling during much of the Middle Permian.” Perhaps, varanopids managed to survive until climate started improving, in the Guadalupian, and this facilitated their survival until the late Capitanian.
Alternatively, therapsid diversification in the Guadalupian may be explained partly by the latitudinal movements in Pangea described by Kent and Muttoni (2020), to the extent that the sites in European Russia, which yielded many Guadalupian therapsids, are in an area that moved out of the arid tropical zone (where it had been in the Cisuralian) to the more humid temperate zone in the Guadalupian. Southern Africa does not seem to have moved much between the Cisuralian and Guadalupian, but the large glaciers that seem to have covered part of that area in the Cisuralian had disappeared by the Guadalupian (Kent and Muttoni, 2020: figure 6), which presumably resulted in a more suitable habitat for amniotes. Both regions yielded varanopids in the Guadalupian, and that clade is unknown from other regions at that time. This geographic distribution may either reflect a genuine pattern linked to environmental preferences of varanopids, or the geographically restricted fossil record of continental vertebrates in the Guadalupian, which is especially scant in the Roadian (Olroyd and Sidor, 2017).
The implications of the possible global or local climate change for therapsid evolutionary radiation remain unclear given that the timing of this radiation is poorly constrained; a literal reading of the fossil record suggests temporal coincidence, but the long ghost lineage at the base of Therapsida, which harks back to the late Carboniferous, raises doubts about an eventual link. Therapsids were almost certainly present in the Cisuralian because the sister-group relationships between Therapsida and Sphenacodontidae, which has long been accepted (Sidor, 2001), implies an origin in the Pennsylvanian. However, before the Roadian, therapsids may be documented solely by one to three taxa: first, Tetraceratops (Amson and Laurin, 2011), which was found in what was formerly called the Arroyo Formation, now Clear Fork Formation, Kungurian (Laurin and Hook, 2022; Menning et al., 2022), although its therapsid status has been questioned (Liu et al., 2009; Spindler, 2020; Matamales-Andreu et al., 2024); second and much more tentatively, by a string of vertebrae that might belong to the earliest therapsid (Spindler, 2014), from the Late Carboniferous of Florence, Nova Scotia that was plausibly interpreted as a sphenacodontid by Reisz (1972) and is too fragmentary for a more categorical conclusion about its affinities; third, by an undetermined gorgonopsian from Mallorca of poorly constrained age that probably dates from the Artinskian to the Roadian (Matamales-Andreu et al., 2024). The timetree proposed by (Matamales-Andreu et al., 2024: figure 4) also suggests that therapsids underwent a first phase of modest diversification in the second half of the Cisuralian. The evolutionary radiation of therapsids in the late Carboniferous and Cisuralian is thus fairly cryptic in the low-latitude localities that are well-documented at those times.
The cryptic (and possibly modest) Cisuralian therapsid evolutionary radiation may have occurred in high-latitude environments that have yielded few or no terrestrial vertebrate fossils. In Russia, the terrestrial cisuralian stegocephalian fauna is known chiefly from the Inta assemblage, which records mostly aquatic or amphibious taxa (temnospondyls and embolomeres), along with scant remains of captorhinids and bolosaurids (Sennikov and Golubev, 2017; Brocklehurst et al., 2017). The contemporary Pechora locality similarly documents a mostly aquatic vertebrate community (Lozovsky, 2005). Thus, the Cisuralian terrestrial amniote fauna from Russia is so poorly known that we cannot exclude the hypothesis that therapsids were already reasonably abundant there in the Kungurian, but have simply not been discovered so far. Similarly, Cisuralian vertebrates are known from high-latitude mesosaur-bearing localities from the southern hemisphere in what is now South America and Africa, but these also document an aquatic community, and no terrestrial amniotes are known from these sites (Piñeiro et al., 2012; de Queiroz et al., 2020). Only additional field work in such high-latitude localities could allow testing this hypothesis in the future.
Therapsids apparently developed endothermy early in their evolutionary history, given that a parsimony optimization of inferred metabolic regime over synapsid phylogeny suggests that endothermy is a synapomorphy of Therapsida (Faure-Brac and Cubo, 2020), or potentially of the taxon that includes most known therapsids except for Tetraceratops and potentially, dinocephalians. The metabolic regime of Tetraceratops has not been assessed and the fragmentary nature of the only known specimen (Laurin and Reisz, 1996) does not allow to envision producing histological sections to do this in the near future. Thus, therapsid endothermy might possibly have appeared in the Cisuralian (but see above for studies that suggest a later appearance of endothermy in synapsids). The first endothermic therapsids may have had more problems than their ectothermic eupelycosaurian relatives to cope with the high temperatures of the equatorial Cisuralian climate, where the richly fossiliferous exposures have preserved eupelycosaurs, such as in the SW USA. Simões et al. (2022: 6) suggested that such warm climates favored reptiles of small body size because their greater area/volume ratio facilitates heat exchange. A similar reasoning suggests that a very warm climate might favor ectotherms over endotherms because the former have a lower metabolic rate than the latter, and hence, produce less heat. This difference in difficulty with coping with a warm climate may possibly have been greater in early endothermic vertebrates, if they initially lacked some of the adaptations to dissipate excess heat, such as sweat glands, which leave no direct trace in the fossil record and whose appearance is thus difficult to date precisely.
The final demise of varanopids, sometime after the early Capitanian, may be linked to the Capitanian mass extinction event. The stratigraphic range of varanopids in the Karoo basin ends approximately at the same time as that of the dinocephalians (Day et al., 2015: figure 1), which are the clade that was perhaps most affected by this crisis; indeed, it has been nicknamed the “dinocephalian extinction event” (Lucas, 2017). The extinction time probability densities that we calculated for varanopids using our simplest model (M1) actually extend well into the Triassic, but this is under a model that does not incorporate Capitanian and end-Permian mass extinction events. What these results show is that it is extremely likely that varanopids survived at least until the Capitanian mass extinction event. Our results do not preclude completely a survival of varanopids after that crisis, but there is currently no evidence for it, and there is, on the contrary, strong support for models that include a severe (total) mass extinction event for varanopids at the end of the Capitanian. We thus conclude that varanopids most probably became extinct at about the same time as dinocephalians, in the Capitanian. However, large geographic gaps remain in the fossil record of Guadalupian and Lopingian vertebrates, which require us to remain cautious about these conclusions. These gaps are dwindling gradually, as field work is conducted in various areas outside the South African Karroo Basin and outside of the Russian platform, as in Niger (Tabor et al., 2011), Morocco (Jalil and Janvier, 2005), or Germany (Witzmann et al., 2019), among others. Survival of Varanopidae into the Lopingian thus appears unlikely, and given the intensity of the end-Permian event (Benton, 2003; Ward et al., 2005; Viglietti et al., 2021), it is even less likely that varanopids extended into the Triassic, contrary to what the simplest (and least supported) FBD model suggests.
Data availability statement
The datasets presented in this study can be found in online repositories. The names of the repository/repositories and accession number(s) can be found below: https://github.com/gilles-didier/TimePiecewiseFBD.
Author contributions
ML: Conceptualization, Data curation, Investigation, Visualization, Writing–original draft, Writing–review and editing. GD: Conceptualization, Formal Analysis, Investigation, Methodology, Software, Visualization, Writing–original draft, Writing–review and editing.
Funding
The author(s) declare that financial support was received for the research, authorship, and/or publication of this article. ML was funded by the recurring grant to the CR2P. GD was funded by the recurring grant to the IMAG.
Acknowledgments
We thank Robert W. Hook (U. of Texas at Austin) for sending us information about the various lithological units in which varanopids were found and for comments on Figure 1; this does not imply that he endorsed the contents of this draft. Matt Celeskey (New Mexico Museum of Natural History and Science, Albuquerque) sent us the matrix that includes the scores for Eoscansor for the matrix of Maddin et al. (2020). This is the PBDB official publication #521.
Conflict of interest
The authors declare that the research was conducted in the absence of any commercial or financial relationships that could be construed as a potential conflict of interest.
The authors declared that ML was an editorial board member of Frontiers at the time of submission. This had no impact on the peer review process and the final decision.
Correction note
This article has been corrected with minor changes. These changes do not impact the scientific content of the article.
Generative AI statement
The author(s) declare that no Generative AI was used in the creation of this manuscript.
Publisher’s note
All claims expressed in this article are solely those of the authors and do not necessarily represent those of their affiliated organizations, or those of the publisher, the editors and the reviewers. Any product that may be evaluated in this article, or claim that may be made by its manufacturer, is not guaranteed or endorsed by the publisher.
References
Akaike, H. (1998). “Information theory and an extension of the maximum likelihood principle,” in Selected Papers of Hirotugu Akaike. Editors E. Parzen, K. Tanabe, and G. Kitagawa (Springer, NY, New York: Springer Series in Statistics). doi:10.1007/978-1-4612-1694-0_15
Amson, E., and Laurin, M. (2011). On the affinities of Tetraceratops insignis, an Early Permian synapsid. Acta palaeont. Pol. 56, 301–312. doi:10.4202/app.2010.0063
Anderson, J. S., and Reisz, R. R. (2004). Pyozia mesenensis, a new, small varanopid (Synapsida, Eupelycosauria) from Russia: “pelycosaur” diversity in the Middle Permian. J. Vertebr. Paleontol. 24, 173–179. doi:10.1671/1940-13
Araújo, R., David, R., Benoit, J., Lungmus, J. K., Stoessel, A., Barrett, P. M., et al. (2022). Inner ear biomechanics reveals a Late Triassic origin for mammalian endothermy. Nature 607, 726–731. doi:10.1038/s41586-022-04963-z
Arefifard, S., and Payne, J. L. (2020). End-Guadalupian extinction of larger fusulinids in central Iran and implications for the global biotic crisis. Palaeogeogr. Palaeoclimatol. Palaeoecol. 550, 109743. doi:10.1016/j.palaeo.2020.109743
Barrick, J. E., Alekseev, A. S., Blanco-Ferrera, S., Goreva, N. V., Hu, K., Lambert, L. L., et al. (2022). Carboniferous conodont biostratigraphy. Geol. Soc. Spec. Publ. 512, 695–768. doi:10.1144/SP512-2020-38
Beauchamp, B. (1994). Permian climatic cooling in the Canadian Arctic. Geol. Soc. Am. Spec. Pap. 288, 229–246. doi:10.1130/SPE288-p229
Benoit, J., Ford, D. P., Miyamae, J. A., and Ruf, I. (2021). Can maxillary canal morphology inform varanopid phylogenetic affinities? Acta palaeont. Pol. 66, 389–393. doi:10.4202/app.00816.2020
Benson, R. B. J. (2012). Interrelationships of basal synapsids: cranial and postcranial morphological partitions suggest different topologies. J. Syst. Palaeontol. 10, 601–624. doi:10.1080/14772019.2011.631042
Benton, M. J. (1985). Mass extinction among non-marine tetrapods. Nature 316, 811–814. doi:10.1038/316811a0
Benton, M. J. (1989). Mass extinctions among tetrapods and the quality of the fossil record. Phil. Trans. R. Soc. B 325, 369–385. doi:10.1098/rstb.1989.0094
Benton, M. J. (2003). When life nearly died: the greatest mass extinction of all time. London: Thames and Hudson.
Botha-Brink, J., and Modesto, S. P. (2007). A mixed-age classes ‘pelycosaur’ aggregation from South Africa: earliest evidence of parental care in amniotes?. Proc. R. Soc. Lond. B. 274, 2829–2834. doi:10.1098/rspb.2007.0803
Brikiatis, L. (2020). An early Pangaean vicariance model for synapsid evolution. Sci. Rep. 10, 13091. doi:10.1038/s41598-020-70117-8
Brink, K. S., MacDougall, M. J., and Reisz, R. R. (2019). Dimetrodon (Synapsida: Sphenacodontidae) from the cave system at Richards Spur, OK, USA, and a comparison of Early Permian–aged vertebrate paleoassemblages. Sci. Nat. 106, 2. doi:10.1007/s00114-018-1598-1
Brocklehurst, N. (2018). An examination of the impact of Olson’s extinction on tetrapods from Texas. PeerJ 6, e4767. doi:10.7717/peerj.4767
Brocklehurst, N., Day, M. O., Rubidge, B. S., and Fröbisch, J. (2017). Olson's Extinction and the latitudinal biodiversity gradient of tetrapods in the Permian. Proc. R. Soc. B 284, 20170231. doi:10.1098/rspb.2017.0231
Brocklehurst, N., and Fröbisch, J. (2017). A re-examination of the enigmatic Russian tetrapod Phreatophasma aenigmaticum and its evolutionary implications. Foss. Rec. 20, 87–93. doi:10.5194/fr-20-87-2017
Brocklehurst, N., and Fröbisch, J. (2018). A reexamination of Milosaurus mccordi, and the evolution of large body size in Carboniferous synapsids. J. Vertebr. Paleontol. 38, e1508026. doi:10.1080/02724634.2018.1508026
Brocklehurst, N., Kammerer, C. F., and Fröbisch, J. (2013). The early evolution of synapsids, and the influence of sampling on their fossil record. Paleobiology 39, 470–490. doi:10.1666/12049
Brocklehurst, N., Reisz, R. R., Fernandez, V., and Fröbisch, J. (2016). A Re-description of ‘Mycterosaurus’ smithae, an Early Permian eothyridid, and its impact on the phylogeny of pelycosaurian-grade synapsids. PLoS ONE 11, e0156810. doi:10.1371/journal.pone.0156810
Campione, N. S. E., and Reisz, P. R. (2010). Varanops brevirostris (Eupelycosauria: Varanopidae) from the Lower Permian of Texas, with discussion of varanopid morphology and interrelationships. J. Vertebr. Paleontol. 30, 724–746. doi:10.1080/02724631003762914
Chen, Z.-Q., and Benton, M. J. (2012). The timing and pattern of biotic recovery following the end-Permian mass extinction. Nat. Geosci. 5, 375–383. doi:10.1038/ngeo1475
Cohen, K. M., Harper, D., Gibbard, P., and Car, N. (2023). International chronostratigraphic chart. Int. Comm. Stratigr. Available at: https://stratigraphy.org/chart#latest-version.
Cunningham, C. R., Feldman, H. R., Franseen, E. K., Gastaldo, R. A., Mapes, G., Maples, C. G., et al. (1993). The Upper Carboniferous Hamilton fossil-Lagerstätte in Kansas: a valley-fill, tidally influenced deposit. Lethaia 26, 225–236. doi:10.1111/j.1502-3931.1993.tb01524.x
Day, M., and Rubidge, B. (2020). Biostratigraphy of the Tapinocephalus assemblage zone (Beaufort group, Karoo Supergroup), South Africa. S. Afr. J. Geol. 123, 149–164. doi:10.25131/sajg.123.0012
Day, M., and Smith, R. (2020). Biostratigraphy of the Endothiodon assemblage zone (beaufort group, Karoo supergroup). South Afr. S. Afr. J. Geol. 123, 165–180. doi:10.25131/sajg.123.0011
Day, M. O., Ramezani, J., Bowring, S. A., Sadler, P. M., Erwin, D. H., Abdala, F., et al. (2015). When and how did the terrestrial mid-Permian mass extinction occur? Evidence from the tetrapod record of the Karoo Basin, South Africa. Proc. R. Soc. Lond. B 282, 20150834. doi:10.1098/rspb.2015.0834
Day, M. O., Ramezani, J., Frazer, R. E., and Rubidge, B. S. (2022). U-Pb zircon age constraints on the vertebrate assemblages and palaeomagnetic record of the Guadalupian Abrahamskraal Formation, Karoo Basin, South Africa. J. Afr. Earth Sci. 186, 104435. doi:10.1016/j.jafrearsci.2021.104435
De Queiroz, L. C., Carlisbino, T., Agressott, E. V., Paschoal, A. R., Paulo De Tarso, C. F., Neto, B. C. V., et al. (2020). Paleoenvironmental interpretations of Irati and Mangrullo Formations (Permian of Paraná Basin) based on rocks and fossil bones through spectroscopy techniques. Vibrat. Spectrosc. 110, 103110. doi:10.1016/j.vibspec.2020.103110
Didier, G., Fau, M., and Laurin, M. (2017). Likelihood of tree topologies with fossils and diversification rate estimation. Sys. Biol. 66, 964–987. doi:10.1093/sysbio/syx045
Didier, G., and Laurin, M. (2020). Exact distribution of divergence times from fossil ages and tree topologies. Syst. Biol. 69, 1068–1087. doi:10.1093/sysbio/syaa021
Didier, G., and Laurin, M. (2021). Distributions of extinction times from fossil ages and tree topologies: the example of mid-Permian synapsid extinctions. PeerJ 9, e12577. doi:10.7717/peerj.12577
Didier, G., and Laurin, M. (2024). Testing extinction events and temporal shifts in diversification and fossilization rates through the skyline Fossilized Birth-Death (FBD) model: the example of some mid-Permian synapsid extinctions. Cladistics 40, 282–306. doi:10.1111/cla.12577
Eberth, D. A., and Brinkman, D. (1983). Ruthiromia elcobriensis, a new pelycosaur from El Cobre canyon, New Mexico. Breviora 474, 1–26.
Ezcurra, M. D., and Butler, R. J. (2018). The rise of the ruling reptiles and ecosystem recovery from the Permo-Triassic mass extinction. Proc. R. Soc. B 285, 20180361. doi:10.1098/rspb.2018.0361
Ezerendu, F. O. (2012). Stratigraphic history, deposition and lithologic study of the Topeka Limestone in greenwood county. Kansas: Emporia State University. Available at: http://hdl.handle.net/123456789/1973.
Faure-Brac, M. G., and Cubo, J. (2020). Were the synapsids primitively endotherms? A palaeohistological approach using phylogenetic eigenvector maps. Phil. Trans. R. Soc. B 375, 20190138. doi:10.1098/rstb.2019.0138
Fielding, C. R., Bryan, S. E., Crowley, J. L., Frank, T. D., Hren, M. T., Mays, C., et al. (2023). A multidisciplinary approach to resolving the end-Guadalupian extinction. Evol. Earth 1, 100014. doi:10.1016/j.eve.2023.100014
Ford, D. P., and Benson, R. B. (2020). The phylogeny of early amniotes and the affinities of Parareptilia and Varanopidae. Nat. Ecol. Evol. 4, 57–65. doi:10.1038/s41559-019-1047-3
Gavryushkina, A., Welch, D., Stadler, T., and Drummond, A. J. (2014). Bayesian inference of sampled ancestor trees for epidemiology and fossil calibration. PLoS Comput. Biol. 10, e1003919. doi:10.1371/journal.pcbi.1003919
Gradstein, F., and Ogg, J. (2020). “The chronostratigraphic scale,” in Geologic time scale 2020. Editors F. M. Gradstein, J. G. Ogg, M. D. Schmitz, and G. M. Ogg (Amsterdam: Elsevier), 21–32. doi:10.1016/B978-0-12-824360-2.00002-4
Hembree, D. I. (2022). Early effects of the late Paleozoic climate transition on soil ecosystems of the Appalachian Basin (Conemaugh, Monongahela, and Dunkard groups): evidence from ichnofossils. Palaios 37, 671–690. doi:10.2110/palo.2021.071
Henderson, C. M. (2002). “Kungurian to Lopingian correlations along western Pangea,” in Abstracts with Programs, 36th Annual Meeting of GSA south-central section 34, A–30.
Henderson, C., Shen, S., Gradstein, F., and Agterberg, F. (2020). “The Permian period,” in Geologic time scale 2020 (Elsevier), 875–902. doi:10.1016/B978-0-12-824360-2.00024-3
Huang, Y., Chen, Z.-Q., Wignall, P. B., Grasby, S. E., Zhao, L., Wang, X., et al. (2019). Biotic responses to volatile volcanism and environmental stresses over the Guadalupian-Lopingian (Permian) transition. Geology 47, 175–178. doi:10.1130/G45283.1
Jalil, N.-E., and Janvier, P. (2005). Les pareiasaures (Amniota, Parareptilia) du Permien supérieur du Bassin d’Argana, Maroc. Geodiversitas 27, 35–132. Available at: https://sciencepress.mnhn.fr/en/periodiques/geodiversitas/27/1/les-pareiasaures-amniota-parareptilia-du-permien-superieur-du-bassin-d-argana-maroc.
Jenkins, X., Benson, R. B., Ford, D. P., Browning, C., Fernandez, V., Dollman, K., et al. (2024). Stepwise assembly of crown reptile anatomy clarified by jate Paleozoic outgroups of Neodiapsida. bioRxiv, 2011–2025. doi:10.1101/2024.11.25.625221
Johnson, S. G. (2014). The NLopt nonlinear-optimization package. Available at: http://github.com/stevengj/nlopt.
Kent, D. V., and Muttoni, G. (2020). Pangea B and the Late Paleozoic ice age. Palaeogeogr. Palaeoclimatol. Palaeoecol. 553, 109753. doi:10.1016/j.palaeo.2020.109753
Lane, A., Janis, C. M., and Sepkoski, J. J. (2005). Estimating paleodiversities: a test of the taxic and phylogenetic methods. Paleobiology 31, 21–34. doi:10.1666/0094-8373(2005)031<0021:EPATOT>2.0.CO;2
Laurin, M., and Hook, R. (2022). The age of North America’s youngest Paleozoic continental vertebrates: a review of data from the Middle Permian Pease River (Texas) and El Reno (Oklahoma) Groups. Bull. Soc. Géol. Fr. 193, 10–30. doi:10.1051/bsgf/2022007
Laurin, M., and Piñeiro, G. (2018). Response: commentary: A reassessment of the taxonomic position of mesosaurs, and a surprising phylogeny of early amniotes. Front. Earth Sci. 6, 1–9. doi:10.3389/feart.2018.00220
Laurin, M., and Reisz, R. R. (1996). The osteology and relationships of Tetraceratops insignis, the oldest known therapsid. J. Vertebr. Paleontol. 16, 95–102. doi:10.1080/02724634.1996.10011287
Leonard, K. W. (1991). A log of ten cores of the Deer Creek Limestone, Calhoun Shale, Topeka Limestone, and Hamilton lagerstätte (Virgilian, upper Pennsylvanian) from the Hamilton area, Greenwood county, Kansas. Kans. Geol. Surv. 91, 1–17.
Liu, J., Rubidge, B. S., and Li, J. (2009). New basal synapsid supports Laurasian origin for therapsids. Acta palaeont. Pol. 54, 393–400. doi:10.4202/app.2008.0071
Lozovsky, V. R. (2005). Olson's gap or Olson's bridge, that is the question. NMMNH Bull. 30 (The Nonmarine Permian), 179–184.
Lucas, S. (2017). Permian tetrapod extinction events. Earth-Sci. Rev. 170, 31–60. doi:10.1016/j.earscirev.2017.04.008
Lucas, S. G., Schneider, J. W., Nikolaeva, S., and Wang, X. (2022). The Carboniferous timescale: an introduction, 512, 1–17. doi:10.1144/SP512-2021-16
MacDougall, M. J., MoDesto, S. P., Brocklehurst, N., Verrière, A., Reisz, R. R., and Fröbisch, J. (2018). Commentary: a reassessment of the taxonomic position of mesosaurs, and a surprising phylogeny of early amniotes. Front. Earth Sci. 6, 99. doi:10.3389/feart.2018.00099
MacDougall, M. J., Tabor, N. J., Woodhead, J., Daoust, A. R., and Reisz, R. R. (2017). The unique preservational environment of the Early Permian (Cisuralian) fossiliferous cave deposits of the Richards Spur locality, Oklahoma. Okla. Palaeogeogr. Palaeoclimatol. Palaeoecol. 475, 1–11. doi:10.1016/j.palaeo.2017.02.019
Maddin, H. C., Mann, A., and Hebert, B. (2020). Varanopid from the Carboniferous of Nova Scotia reveals evidence of parental care in amniotes. Nat. Ecol. Evol. 4, 50–56. doi:10.1038/s41559-019-1030-z
Mann, A., and Paterson, R. S. (2020). Cranial osteology and systematics of the enigmatic early ‘sail-backed’ synapsid Echinerpeton intermedium Reisz, 1972, and a review of the earliest ‘pelycosaurs’. J. Syst. Palaeontol 18, 529–539. doi:10.1080/14772019.2019.1648323
Marchetti, L., Forte, G., Kustatscher, E., Dimichele, W. A., Lucas, S. G., Roghi, G., et al. (2022). The Artinskian Warming Event: an Euramerican change in climate and the terrestrial biota during the early Permian. Earth-Sci. Rev. 226, 103922. doi:10.1016/j.earscirev.2022.103922
Matamales-Andreu, R., Kammerer, C. F., Angielczyk, K. D., Simões, T. R., Mujal, E., Galobart, À., et al. (2024). Early–middle Permian Mediterranean gorgonopsian suggests an equatorial origin of therapsids. Nat. Commun. 15, 10346. doi:10.1038/s41467-024-54425-5
Mcghee Jr, G. R., Clapham, M. E., Sheehan, P. M., Bottjer, D. J., and Droser, M. L. (2013). A new ecological-severity ranking of major Phanerozoic biodiversity crises. Palaeogeogr. Palaeoclimatol. Palaeoecol. 370, 260–270. doi:10.1016/j.palaeo.2012.12.019
Menning, M., Glodny, J., Boy, J., Gast, R., Kowalczyk, G., Martens, T., et al. (2022). The Rotliegend in the stratigraphic table of Germany 2016 (STG 2016). Z. Dt. Ges. Geowiss. 173, 3–139. doi:10.1127/zdgg/2022/0311
Modesto, S., Sidor, C. A., Rubidge, B. S., and Welman, J. (2001). A second varanopseid skull from the Upper Permian of South Africa: implications for Late Permian ‘pelycosaur’ evolution. Lethaia 34, 249–259. doi:10.1111/j.1502-3931.2001.tb00053.x
Modesto, S. P., Smith, R. M. H., Campione, N. S. E., and Reisz, R. R. (2011). The last “pelycosaur”: a varanopid synapsid from the Pristerognathus Assemblage Zone, Middle Permian of South Africa. Naturwissenschaften 98, 1027–1034. doi:10.1007/s00114-011-0856-2
Montañez, I. P. (2016). A Late Paleozoic climate window of opportunity. Proc. Natl. Acad. Sci. U.S.A. 113, 2334–2336. doi:10.1073/pnas.1600236113
Nelder, J. A., and Mead, R. (1965). A simplex method for function minimization. Comput. J. 7, 308–313. doi:10.1093/comjnl/7.4.308
Newham, E., Gill, P. G., and Corfe, I. J. (2022). New tools suggest a middle Jurassic origin for mammalian endothermy: advances in state-of-the-art techniques uncover new insights on the evolutionary patterns of mammalian endothermy through time. Bioessays 44, 2100060. doi:10.1002/bies.202100060
Norton, L. A., Abdala, F., and Benoit, J. (2023). Craniodental anatomy in Permian–Jurassic Cynodontia and Mammaliaformes (Synapsida, Therapsida) as a gateway to defining mammalian soft tissue and behavioural traits. Phil. Trans. R. Soc. B 378, 20220084. doi:10.1098/rstb.2022.0084
Olroyd, S. L., and Sidor, C. A. (2017). A review of the Guadalupian (middle Permian) global tetrapod fossil record. Earth-Sci. Rev. 171, 583–597. doi:10.1016/j.earscirev.2017.07.001
Piñeiro, G., Ramos, A., Goso, C., Scarabino, F., and Laurin, M. (2012). Unusual environmental conditions preserve a Permian mesosaur-bearing Konservat-Lagerstätte from Uruguay. Acta palaeont. Pol. 57, 299–318. doi:10.4202/app.2010.0113
Qie, W., Algeo, T. J., Luo, G., and Herrmann, A. (2019). Global events of the Late Paleozoic (Early Devonian to Middle Permian): a review. Palaeogeogr. Palaeoclimatol. Palaeoecol. 531, 109259. doi:10.1016/j.palaeo.2019.109259
Rampino, M. R., and Shen, S.-Z. (2021). The end-Guadalupian (259.8 Ma) biodiversity crisis: the sixth major mass extinction? Hist. Biol. 33, 716–722. doi:10.1080/08912963.2019.1658096
Reisz, R. R. (1972). Pelycosaurian reptiles from the middle Pennsylvanian of North America. Bull. Mus. Comp. Zool. Harv. 144, 27–62.
Reisz, R. R. (1986). “Pelycosauria”, in Encyclopedia of paleoherpetology. Editor P. Wellnhofer (Stuttgart: Gustav Fischer), 1–102.
Reisz, R. R. (2005). Oromycter, a new caseid from the Lower Permian of Oklahoma. J. Vertebr. Paleontol. 25, 905–910. doi:10.1671/0272-4634(2005)025[0905:OANCFT]2.0.CO;2
Reisz, R. R., and Dilkes, D. W. (1992). The taxonomic position of Anningia megalops, a small amniote from the Permian of South Africa. Can. J. Earth Sci. 29, 1605–1608. doi:10.1139/e92-126
Reisz, R. R., and Dilkes, D. W. (2003). Archaeovenator hamiltonensis, a new varanopid (Synapsida: Eupelycosauria) from the Upper Carboniferous of Kansas. Can. J. Earth Sci. 40, 667–678. doi:10.1139/e02-063
Rineau, V., Grand, A., Zaragüeta, R., and Laurin, M. (2015). Experimental systematics: sensitivity of cladistic methods to polarization and character ordering schemes. Contrib. Zool. 84, 129–148. doi:10.1163/18759866-08402003
Rineau, V., Zaragüeta I Bagils, R., and Laurin, M. (2018). Impact of errors on cladistic inference: simulation-based comparison between parsimony and three-taxon analysis. Contr. Zool. 87, 25–40. doi:10.1163/18759866-08701003
Salley, S., Morales, M., and Sleezer, R. (2005). Surficial geology of the Hamilton quarry area. Kans. Geol. Surv. Open File Rep. 2005-13, 16. Available at: https://www.kgs.ku.edu/Publications/OFR/2005/OFR05_13/index.html.
Sennikov, A., and Golubev, V. (2017). Sequence of Permian tetrapod faunas of eastern Europe and the Permian–Triassic ecological crisis. Paleont. Jour. 51, 600–611. doi:10.1134/S0031030117060077
Shellnutt, J., Bhat, G., Brookfield, M., and Jahn, B. M. (2011). No link between the Panjal Traps (Kashmir) and the Late Permian mass extinctions. Geophys. Res. Lett. 38. doi:10.1029/2011GL049032
Sibiya, Z. (2024). The taxonomy and phylogeny of Varanopidae from the middle Permian of South Africa. Johannesburg: University of the Witwatersrand. MSc thesis.
Sidor, C. A. (2001). Simplification as a trend in synapsid cranial evolution. Evolution 55, 1419–1442. doi:10.1111/j.0014-3820.2001.tb00663.x
Simões, T. R., Kammerer, C. F., Caldwell, M. W., and Pierce, S. E. (2022). Successive climate crises in the deep past drove the early evolution and radiation of reptiles. Sci. Adv. 8, eabq1898. doi:10.1126/sciadv.abq1898
Song, H., Kemp, D. B., Tian, L., Chu, D., Song, H., and Dai, X. (2021). Thresholds of temperature change for mass extinctions. Nat. Commun. 12, 4694. doi:10.1038/s41467-021-25019-2
Spielmann, J. A., and Lucas, S. G. (2010). Re-evaluation of Ruthiromia elcobriensis (Eupelycosauria: Ophiacodontidae?) from the Lower Permian (Seymouran?) of Canon del Cobre, northern New Mexico. N. M. Mus. Nat. Hist. Sci. Bull. 49, 151–158.
Spindler, F. (2014). Reviewing the question of the oldest therapsid. Freiberger forschungsh. C 548 (22), 1–7.
Spindler, F. (2020). The skull of Tetraceratops insignis (Synapsida, Sphenacodontia). Palaeovertebrata 43, 1–11. doi:10.18563/pv.43.1.e1
Spindler, F., Werneburg, R., Schneider, J. W., Luthardt, L., Annacker, V., and Rößler, R. (2018). First arboreal ‘pelycosaurs’ (Synapsida: Varanopidae) from the early Permian Chemnitz Fossil Lagerstätte, SE Germany, with a review of varanopid phylogeny. PalZ 92, 315–364. doi:10.1007/s12542-018-0405-9
Tabor, N. J., Smith, R. M., Steyer, J. S., Sidor, C. A., and Poulsen, C. J. (2011). The Permian Moradi Formation of northern Niger: paleosol morphology, petrography and mineralogy. Palaeogeogr. Palaeoclimatol. Palaeoecol. 299, 200–213. doi:10.1016/j.palaeo.2010.11.002
Viglietti, P. A., Benson, R. B., Smith, R. M., Botha, J., Kammerer, C. F., Skosan, Z., et al. (2021). Evidence from South Africa for a protracted end-Permian extinction on land. Proc. Natl. Acad. Sci. U.S.A. 118, e2017045118. doi:10.1073/pnas.2017045118
Wake, D. B., and Vredenburg, V. T. (2008). Are we in the midst of the sixth mass extinction? A view from the world of amphibians. Proc. Natl. Acad. Sci. U.S.A. 105, 11466–11473. doi:10.1073/pnas.0801921105
Wang, X., Qie, W., Sheng, Q., Qi, Y., Wang, Y., Liao, Z., et al. (2013). Carboniferous and Lower Permian sedimentological cycles and biotic events of South China. Geol. Soc. Spec. Publ. 376, 33–46. doi:10.1144/SP376.11
Ward, P. D., Botha, J., Buick, R., De Kock, M. O., Erwin, D. H., Garrisson, G. H., et al. (2005). Abrupt and gradual extinction among late Permian land vertebrates in the Karoo Basin, South Africa. Science 307, 709–714. doi:10.1126/science.1107068
Wei, B., Yang, X., Cheng, X., Domeier, M., Wu, H., Kravchinsky, V. A., et al. (2020). An absolute paleogeographic positioning of the early Permian Tarim large igneous province. J. Geophys. Res. Solid Earth 125, e2019JB019111. doi:10.1029/2019JB019111
Witzmann, F., Sues, H.-D., Kammerer, C. F., and Fröbisch, J. (2019). A new bystrowianid from the Upper Permian of Germany: first record of a Permian chroniosuchian (Tetrapoda) outside Russia and China. J. Vertebr. Paleontol. 39, e1667366. doi:10.1080/02724634.2019.1667366
Woodhead, J., Reisz, R., Fox, D., Drysdale, R., Hellstrom, J., Maas, R., et al. (2010). Speleothem climate records from deep time? Exploring the potential with an example from the Permian. Geology 38, 455–458. doi:10.1130/G30354.1
Keywords: Amniota, Synapsida, Carboniferous, Permian, mass extinction event, diversification, biodiversity evolution, skyline fossilized-birth-death process
Citation: Laurin M and Didier G (2025) The rise and fall of Varanopidae† (Amniota, Synapsida). Front. Earth Sci. 13:1544451. doi: 10.3389/feart.2025.1544451
Received: 12 December 2024; Accepted: 29 January 2025;
Published: 20 March 2025; Corrected: 02 July 2025.
Edited by:
Peter David Roopnarine, California Academy of Sciences, United StatesReviewed by:
Christian Kammerer, North Carolina Museum of Natural Sciences, United StatesNeil Brocklehurst, Syngenta UK Limited, United Kingdom
Copyright © 2025 Laurin and Didier. This is an open-access article distributed under the terms of the Creative Commons Attribution License (CC BY). The use, distribution or reproduction in other forums is permitted, provided the original author(s) and the copyright owner(s) are credited and that the original publication in this journal is cited, in accordance with accepted academic practice. No use, distribution or reproduction is permitted which does not comply with these terms.
*Correspondence: Michel Laurin, bWljaGVsLmxhdXJpbkBtbmhuLmZy