 Katherine A. Deakin
 Ian C. Willis
 Rebecca L. Dell
- Scott Polar Research Institute, University of Cambridge, Cambridge, United Kingdom
The presence and storage of meltwater on Antarctic ice shelves has implications for ice-shelf stability and collapse, while meltwater on grounded tributary glaciers, if able to access the bed, could affect their dynamics. Given the significance of Antarctica’s ice shelves for grounded ice contributions to global mean sea levels, there have been many efforts to map their meltwater extents, whereas far fewer efforts have been made to map water on Antarctica’s grounded ice. Most previous mapping has used optical imagery, which is limited to mapping surface water on cloud-free days during the austral summer. Conversely, research into the prevalence of wintertime and shallow subsurface meltwater storage is scarce. Here, we analyse synthetic aperture radar (SAR) backscatter time series between 2015 and 2021 for a selected number of large, late- and early-summer meltwater bodies on George VI Ice Shelf (GVIIS) and surrounding glaciers through intervening winters. Variable rates of surface or shallow subsurface freeze-through and melt onset are identified, alongside two locations where meltwater appears to have been stored throughout the 2019 winter. One of these sites, a large shallow subsurface meltwater body on grounded ice, appears to have retained liquid water throughout all 6 years, including during winter. This site would be valuable for further exploring how surface and shallow subsurface meltwater bodies may influence Antarctic glacier dynamics through drainage to the bed.
1 Introduction
The Antarctic Ice Sheet is experiencing increasing rates of mass loss and, in turn, enhanced contributions to sea-level rise, with an average loss of 92 ± 18 Gt yr−1 between 1992 and 2020 (Otosaka et al., 2023) and a 5.2-mm contribution to sea level between 2003 and 2019 (Smith et al., 2020). On the Antarctic Peninsula, amplified rates of atmospheric and ocean warming (Siegert et al., 2019; Smith et al., 2020) have contributed to the full or partial collapse of its peripheral ice shelves (Scambos et al., 2000; Cook and Vaughan, 2010; Banwell et al., 2013), thereby reducing the buttressing of grounded ice (Dupont and Alley, 2005; Fürst et al., 2016) and enhancing grounded ice discharge to the ocean (Rignot et al., 2004; Wuite et al., 2015). Across the Peninsula, several collapse events have been attributed to the development of extensive surface hydrological networks, which act as a load on the ice-shelf surface and encourage ice flexure and fracture (e.g., Scambos et al., 2000; Glasser et al., 2009; Banwell et al., 2013; Banwell et al., 2019; Banwell et al., 2024; Banwell and MacAyeal, 2015; Bell et al., 2018). Given the significance of this meltwater for ice-shelf stability, it is important that the full extent of each ice shelf’s hydrological network is characterised (Arthur et al., 2020a).
Surface and shallow subsurface hydrological networks on grounded ice have the potential to enhance glacier flow if they deliver water, via crevasses or moulins, to the base of the glaciers, as occurs around the margins of the Greenland Ice Sheet (Bartholomew et al., 2010; Sundal et al., 2011; Banwell et al., 2016; Poinar et al., 2019). To date, there have been no direct observations of surface or shallow subsurface water reaching the bed to influence the ice flow of Antarctic glaciers, but indirect observations on the Peninsula suggest that it is a possibility (Tuckett et al., 2019; Boxall et al., 2022a; 2024; Wallis et al., 2023). Given this, it is also important to characterise hydrological networks across glaciers feeding ice shelves (Bell et al., 2018).
In attempts to document spatiotemporal variations in ice-shelf hydrological networks, and, in a few instances, those on grounded ice, many studies have mapped surface lakes during summer melt seasons, when the polar day allows for optical imagery acquisition and when the majority of surface melting occurs (e.g., Kingslake et al., 2017; Stokes et al., 2019; Arthur et al., 2020b; Halberstadt et al., 2020; Moussavi et al., 2020; Tuckett et al., 2021; Dell et al., 2024a). Studies of summer meltwater storage have also increasingly used synthetic aperture radar (SAR)-based methods to map surface meltwater, enabled by microwave sensitivity to liquid water (e.g., Liang et al., 2021; Dirscherl et al., 2021a; Zhu et al., 2024). This is because, unlike optical sensors, SAR can image the ice sheet surface even under cloudy conditions and at night, expanding spatial and temporal coverage of meltwater extents. Liang et al. (2021) implemented a co-orbit normalisation technique using Sentinel-1 (S1) images to produce monthly melt extent products across all Antarctic ice shelves. A similar approach was later used to map meltwater extents across Greenland (Hu et al., 2022). In north-east Greenland, Shu et al. (2023) used state-space modelling of S1 backscatter time series, informed by optical imagery and climate model output, to map melt and other surface facies. Recent advances have used deep learning methods, such as convolutional neural networks, which are able to identify and extract spatial patterns from large amounts of SAR imagery; these have been used to resolve summer meltwater patterns on the surface of Antarctic ice shelves at temporal resolutions of up to 12 h (de Roda Husman et al., 2024) and spatial resolutions of up to 10 m (Dirscherl et al., 2021a; Zhu et al., 2024).
It is increasingly acknowledged, however, that water may be stored in subsurface water bodies (Dunmire et al., 2020; Scambos et al., 2022) and that surface or subsurface water bodies may continue to grow and shrink during winter (Kuipers Munneke et al., 2018; Spergel et al., 2021; Li et al., 2021). Although previous studies on the Greenland Ice Sheet have used SAR to identify winter lake drainage events (Schröder et al., 2020; Benedek and Willis, 2021; Maier et al., 2023) and potential over-winter meltwater persistence (Lampkin et al., 2020; Law et al., 2020; Schröder et al., 2020; Dunmire et al., 2021; Zheng et al., 2023; Zhu et al., 2023), comparatively little research has been conducted on winter meltwater dynamics in Antarctica (e.g., Kuipers Munneke et al., 2018; Dunmire et al., 2020). The persistence of meltwater storage into winter months may present further potential for lake drainage via hydrofracture, with important implications for ice-shelf stability (Scambos et al., 2000; Banwell et al., 2019; Dunmire et al., 2020) or glacier flow (Maier et al., 2023). It may also lower the surface albedo or alter the internal energy budget of the ice shelf or glaciers (Jakobs et al., 2021; Amory et al., 2024), encouraging meltwater ponding during subsequent summers (Spergel et al., 2021) or allowing ice to deform more readily (Ranganathan et al., 2023).
Of the current Antarctic Peninsula ice shelves, George VI Ice Shelf (GVIIS) shows especially widespread surface meltwater ponding; in 2019/20, it showed the greatest melt extent in 32 years, with total surface meltwater covering ∼15% of the northern ice shelf at the height of summer (Banwell et al., 2021). With such extensive summer meltwater storage, it is likely that many meltwater bodies do not drain or refreeze completely by the start of the winter, particularly in high-melt years. There is potential, therefore, for meltwater storage to persist into winter. Although its compressive flow regime provides stability, full-scale collapse of GVIIS would remove a significant buttressing force to Palmer Land glaciers, which could contribute up to 8 mm of sea-level rise by 2100 (Schannwell et al., 2018). Studying the prevalence of winter meltwater storage on GVIIS and its tributary glaciers is therefore particularly important for assessing potential ice-shelf instabilities, grounded ice discharge, and ice sheet mass loss (Trusel et al., 2015; DeConto and Pollard, 2016; Lai et al., 2020; Gilbert and Kittel, 2021; Mottram et al., 2021). Although previous studies have quantified summer surface meltwater extents across GVIIS (LaBarbera and MacAyeal, 2011; Banwell et al., 2021; Dirscherl et al., 2021a; Dell et al., 2024a), investigations into the over-winter persistence of surface and shallow subsurface meltwater storage are lacking.
Here, we examine the extent to which meltwater is stored on or near the surface of GVIIS and its tributary glaciers during winter months between 2015 and 2021, contributing to a greater understanding of the seasonal evolution of meltwater storage. We identify times and locations where meltwater is visible at the end of one summer and/or the beginning of the next in optical and/or SAR satellite imagery, before using SAR imagery to examine the extent to which meltwater storage persists in these areas throughout the intervening winters.
2 Study area
GVIIS is the second largest ice shelf on the Antarctic Peninsula, with an area of ∼23,500 km2 (Rignot et al., 2013; Banwell et al., 2021) (Figure 1). Located on the western Peninsula between Palmer Land and Alexander Island, it calves along two ice fronts: Marguerite Bay in the north and Ronne Entrance in the south. These fronts are separated by ∼450 km of ice shelf and have undergone retreat since the late 20th century (Lucchitta and Rosanova, 1998; Holt et al., 2013; Holt and Glasser, 2022). Ice inputs to the ice shelf are mostly from Palmer Land and, to a lesser extent, Alexander Island (Boxall et al., 2022a), resulting in compressive flow, heavy ice foliation, and fracturing along its western grounding line (Hambrey et al., 2015). Ice thickness varies with ice flow, reaching ∼600 m in its centre and decreasing to ∼100 m at its two calving fronts (Morlighem et al., 2020).
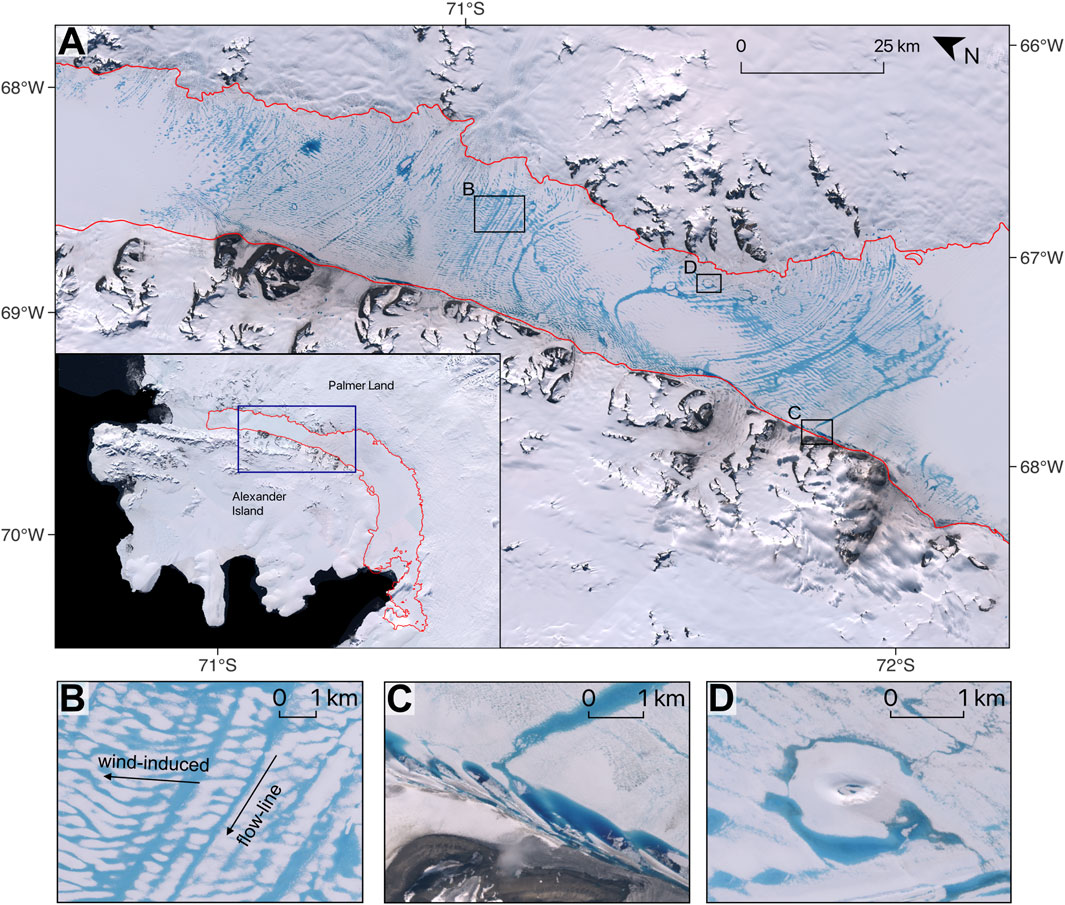
Figure 1. Meltwater storage on George VI Ice Shelf (GVIIS). (A) Sentinel-2 image mosaic of a northern section of GVIIS on 19 January 2020, with the ice-shelf grounding lines shown in red. Inset shows the location of GVIIS on the southwest Antarctic Peninsula, using imagery from the Landsat Image Mosaic of Antarctica (Bindschadler et al., 2008). Red line demarcates the GVIIS boundary, which includes grounding lines and calving fronts; boundary data are from Dell et al. (2024b) and include ice shelf grounding lines from Gerrish et al. (2020), which were modified using the Making Earth System Data Records for Use in Research Environments (MEaSUREs) v.2 database (Mouginot et al., 2017). Blue box shows the area over which meltwater bodies were sampled (see Figure 2). (B) Examples of “flow-line” lakes formed parallel to the direction of ice flow and wind-induced “ribbon” lakes. (C) “Travelling” lakes formed near the western grounding line. (D) Doline with surface meltwater at its centre.
As elsewhere on the Peninsula, GVIIS experiences high summer surface melt rates associated with warming atmospheric temperatures (Morris and Vaughan, 2003; Scambos et al., 2003). This surface melting is located predominantly on the northern GVIIS, whereas accumulation dominates the southern part of the ice shelf (Trusel et al., 2012; Banwell et al., 2021). Net ablation, however, is largely ocean driven, with high basal melt rates (up to 6 m yr-1) linked to the south-to-north circulation of warm Circumpolar Deep Water beneath the ice shelf (Smith et al., 2007; Smith et al., 2020; Jenkins and Jacobs, 2008; Adusumilli et al., 2020). Seasonal variations in both surface melt rates above the ice-shelf grounding lines and Circumpolar Deep Water incursions to the grounding lines have been suggested as potential contributors to the observed summer speed-up and winter slowdown of glaciers feeding the ice shelf (Boxall et al., 2022a; Boxall et al., 2024).
Extensive summer surface ponding on the northern GVIIS has been observed since the 1940s and is attributed to the region’s low firn air content (Fleming et al., 1938; Wager, 1972; Pearson and Rose, 1983; Reynolds and Hambrey, 1988) (Figure 1A). Four surface lake types have been identified. First, the dominant “flow-line” lake type forms in surface undulations sculpted by ice flow units, lying parallel to the ice flow direction (Reynolds, 1981) (Figure 1B). Second, depressions formed by prevailing winds are often filled by smaller, ribbon lakes which reappear in similar locations each year due to the compressive ice flow which limits advection (Reynolds, 1981; Arthur et al., 2020b; Banwell et al., 2021) (Figure 1B). Third, “travelling” lakes migrate along the western grounding line, developing in deep pressure ridges formed by westward ice flow (LaBarbera and MacAyeal, 2011) (Figure 1C). Finally, dolines, with a central basin below the average height of the surrounding shelf and an encircling annular ring elevated above it, are sites of former drained lakes that may still fill and drain on an annual basis (Banwell et al., 2024) (Figure 1D).
3 Data and methods
3.1 Summer melt products
To identify sites of potential overwinter meltwater storage, we started with three summer meltwater extent products that were generated using machine learning classification of satellite images from Landsat 8 (L8) [produced using the methods of Dell et al. (2021)], Sentinel-2 (S2) [Dirscherl et al. (2021b), as described in Dirscherl et al. (2021a)], and S1 [Dirscherl et al. (2021c), as described in Dirscherl et al. (2021a)]. Each dataset we used is a bimonthly (1st–15th and 16th–end of month) time series of rasters, showing surface meltwater bodies for the six summers between 2015 and 2021. The L8 product shows areas of ponded water and slush and was generated using a random forest classifier, trained on surface classes identified by k-means cluster analysis (Dell et al., 2021). We used the original ponded water classifications of Dell et al. (2021) and discarded their slush classifications. The L8 images used had a solar angle >20° and a cloud cover <40%, and were masked for cloud and cloud shadows using the Landsat 8 Quality Assessment Bands prior to classification. Further information on the methods used to generate the L8 product is provided in Dell et al. (2021). The S2 product was also generated using a random forest classifier, this time trained with spectral information from S2 bands and spectral indices, alongside variables derived from a TanDEM-X digital elevation model (Dirscherl et al., 2021a). The classifier was applied to preprocessed level-1C S2 images with <75% cloud cover and distinguished between water and non-water pixels (Dirscherl et al., 2020; Dirscherl et al., 2021a). Finally, the S1 product was generated using a convolutional neural network trained using image patches from manually labelled S1 scenes (Dirscherl et al., 2021a). The S1 images used were acquired in ground range detected (GRD) format, interferometric wide (IW) swath mode, and HH polarisation. This dataset excludes subsurface lakes that are located beneath a thick ice layer but does not preclude shallow subsurface water bodies covered by a thin layer of ice, slush, or snow (Dirscherl et al., 2021a, Dirscherl et al., 2021d). The full methodologies used to produce the S2 and S1 datasets are provided in Dirscherl et al. (2021a). The L8 product includes surface lakes across GVIIS up to the grounding lines, whereas the S2 and S1 products also extend up to ∼25 km above the grounding lines. The L8 data extend from November to February, whereas both Sentinel datasets also include March of each year.
The L8 product was resampled from 30 m to 10 m pixel resolution using nearest-neighbour resampling to match that of S2, before the two products were merged to produce a combined “optical lakes” product, which we refer to as “S2L8.” The Sentinel-1 product, referred to as “S1,” is derived from SAR at 10 m resolution. Examples of the derivation of each dataset are shown in Supplementary Figure S1.
Merging the two surface lake extents from L8 and S2 imagery helped compensate for data loss caused by cloud cover in the individual datasets (Dell et al., 2020), as well as for lake pixels that may have been omitted by either classifier. In this respect, it is more likely to overestimate rather than underestimate lake pixels. As the L8 lake products were only available up to February of each summer, surface lake extents for March were derived from S2 images only; in this respect, fewer late summer lakes may be identified than early summer lakes.
3.2 Selection of meltwater bodies for winter analysis
We used the S2L8 and S1 datasets described in Section 3.1 to identify meltwater bodies that were most likely to show evidence for over-winter meltwater presence and persistence. Such water bodies were identified in three ways, producing three groups: i) those that were present at the start of summer (1st–15th November), which may, therefore, have contained water during the previous winter; ii) those that were present at the end of summer (16th–31st March), which may have held water during the subsequent winter; and iii) those that were present at both the end of one summer and the beginning of the next summer, which, arguably, may show the greatest likelihood of containing water throughout the intervening winter. The L8, S2, and S1 products described in Section 3.1 have reported classification accuracies ranging from 70% to 95%, with potential limitations in areas of cloud shadow and radar shadow (Dell et al., 2021; Dirscherl et al., 2021a). Therefore, to help with water body identification, optical and SAR images were also inspected manually to exclude false-positive water bodies that appeared to be misclassifications of shadow or variations in surface topography (Fu et al., 2020).
To derive groups i and ii (meltwater bodies present at the start and end of the summer, respectively), we selected the three largest water bodies in the relevant half-month period, across the S2L8 and the S1 datasets; potential meltwater bodies with an area below 0.01 km2 were excluded. As subsequent analysis of winter meltwater body evolution relied on the examination of SAR backscatter changes (Section 3.3), meltwater body selection was restricted to those present within the same S1 relative orbit (in this case, relative orbit 169) to reduce backscatter variations associated with different SAR look angles (Benedek and Willis, 2021).
For group i, due to the exclusion of smaller meltwater bodies and potential misclassifications, no meltwater bodies were sampled for November 2015, and only one suitable meltwater body was identified in November 2016. Thus, group i consists of a sample of 13 meltwater bodies. For group ii, there were no large water bodies for late March 2016, giving a total of three water bodies from each of the remaining 5 years. Thus, group ii is a sample of 15 meltwater bodies.
Most end-of-summer water bodies (13 of 15) were identified from the S1 dataset, except for late March 2020 when extensive surface ponding was visible in the S2L8 dataset. Many of the largest water bodies present in late March 2020, at the end of the record-breaking 2019/20 melt season (Banwell et al., 2021), comprised multiple lakes, formed in ice-surface undulations and joined by overspilling at their edges. This included the largest water body spanning approximately half of the width of GVIIS, covering an area of ∼20 km2. These “joined lakes” were not chosen for analysis because averaging SAR backscatter across their large areas would mask the local variations in meltwater refreezing, drainage, or persistence that we are interested in. Instead, the three largest “single lakes” were chosen for March 2020.
To identify meltwater present at the end of one summer and the beginning of the next (group iii), all possible combinations of the S2L8 and S1 datasets were used to identify areas where meltwater storage occurred at both times. The resulting pixel clusters do not represent the full extent of the water bodies they were part of during either late March or early November but show only where meltwater was present during both periods. Hence, they were not filtered by area (as was done for groups i and ii). Only four such sites were identified across the 6-year period, meaning that group iii is a sample of four meltwater bodies.
Of the 32 meltwater bodies identified above, one appeared across multiple years (Section 4.3) and appeared in more than one of the three groups. This was one of the four meltwater bodies identified in group iii (i.e., it was present at the end of one summer and the beginning of the next), which also appeared repeatedly in group i (in November 2016, 2018, 2019, and 2020) and in group ii (in March 2018, 2019, and 2021). To avoid repetition, this water body was analysed as part of group iii only; four more lakes were chosen for November of the repeating years, and three more lakes were chosen for March of the repeating years (in each case, the next, fourth largest water body) to maintain 13 water bodies in group i and 15 in group ii. One meltwater body appeared as one of the three largest water bodies during both the start and end of the 2017/18 melt season; this was analysed twice to investigate both early- and late-summer meltwater dynamics (sites N3 and M5). In total, 32 water bodies were sampled due to their potential for over-winter meltwater presence or persistence (Figure 2; Supplementary Table S1).
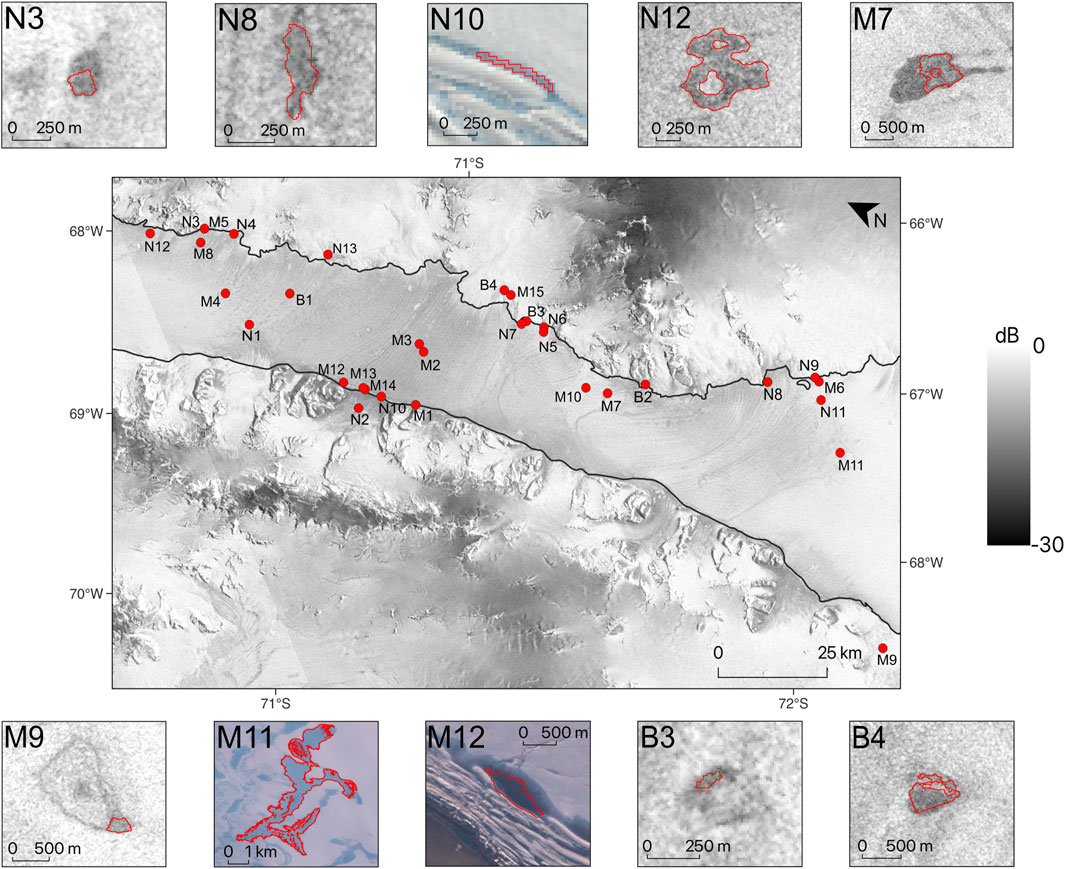
Figure 2. Locations of the meltwater bodies analysed for over-winter persistence on the northern George VI Ice Shelf (GVIIS; Figure 1A). Red dots show sites classified as meltwater in either November (N1–13) or March (M1–15), or both March and the following November (B1–4). Lake locations are superimposed upon a mosaic of two Sentinel-1 images (23 and 26 July 2019). The surrounding images show a selection of the meltwater bodies sampled, from Sentinel-1 (N3, N8, N12, M7, M9, B3, and B4), Sentinel-2 (M11 and M12), and Landsat 8 (N10) imagery; red polygons delineate the area that was classified as meltwater in optical or SAR imagery, and the area over which mean backscatter was calculated. Grounding lines are shown in black and are from Dell et al. (2024b). Sentinel data courtesy of Copernicus/European Space Agency (2024); Landsat 8 imagery courtesy of the US Geological Survey.
3.3 Sentinel-1 backscatter analysis
For the 32 meltwater bodies identified in Section 3.2, winter S1 backscatter signatures were analysed in Google Earth Engine (GEE; Gorelick et al., 2017). Water is identifiable as low backscatter caused by the absorption of microwaves or, in the case of open water that is clear of ice, the specular reflection of the microwave signal away from the sensor (Ulaby et al., 1986). As meltwater refreezes, volume scattering increases due to bubbles within the refrozen ice, causing an increase in backscatter (Miles et al., 2017; Spergel et al., 2021). Thus, SAR backscatter patterns between March and November can be used to deduce the rates and timings of water refreezing, melt onset, and the likelihood of overwinter meltwater storage (Li et al., 2021).
The S1 images used for analysis were GRD in IW swath mode and HH polarisation, at 10 m pixel resolution. They had been preprocessed in GEE through the application of orbital information, thermal noise removal, radiometric calibration, and terrain correction (Gorelick et al., 2017). As discussed in Section 3.2, the selected S1 images were filtered to those from relative orbit 169.
Time series of the mean and standard deviation of backscatter were calculated from all of the pixels representing each meltwater body. Mean backscatter signatures were compared to the mean baseline backscatter of the surrounding ice surface during the same time period (Benedek and Willis, 2021; Li et al., 2021). This was necessary to distinguish changing meltwater storage within each meltwater body from that occurring across the surrounding ice, as ice surfaces undergo a seasonal cycle in SAR backscatter associated with melting and refreezing (Freer, 2020; Liang et al., 2021). The area over which mean baseline backscatter was calculated was defined by a rectangular buffer zone, with each edge extending 5 km from the northernmost, easternmost, southernmost, and westernmost tips of the meltwater body. Different buffer zone distances were tested to assess their influence on mean baseline backscatter values. Mean backscatter was insensitive to buffers ≥5 km, and so this value was used. Within each buffer zone, rock outcrops were masked using the rock outcrop dataset from the Scientific Committee for Antarctic Research Antarctic Digital Database (Cooper et al., 2020) as these often show very high or low backscatter values, depending on the SAR look angle (Schellenberger et al., 2016). For each winter, shapefiles of total summer meltwater extent (derived by stacking all optical- and SAR-derived meltwater extent maps from the previous summer) were used to mask areas within the bounding rectangles where meltwater or refreezing signatures in other meltwater bodies may have biased the baseline mean.
4 Results and interpretation
4.1 Meltwater bodies present in early November
For the 13 meltwater bodies present in early November, the S1 backscatter timeseries reveal three broad types of behaviour (Figure 3). First, for one meltwater body, backscatter decreased simultaneously with and by similar amounts to background backscatter, beginning in early November, with no evidence of an earlier decrease (Figure 3, site N10). Second, for four meltwater bodies, backscatter decreased simultaneously with but by a greater amount than background backscatter, again beginning in early November or late October; although some showed fluctuations in backscatter during the previous winter, meltwater body backscatter values did not deviate consistently from the baseline until late October to early November (Figure 3, sites N3, N4, N12, and N13). Finally, for eight meltwater bodies, background backscatter decreased from early November, but meltwater body backscatter started to decrease earlier (Figure 3, sites N1, N2, N5–9, and N11). Although backscatter in most of these meltwater bodies began to decrease during late winter (September to October), there was some variation within this group in the magnitude and timing of winter backscatter decrease. For example, although backscatter began to decrease as early as May–June in one case (N1), meltwater body and baseline errors at this site continued to overlap throughout the winter, whereas meltwater body backscatter at another site (N8) began to deviate from the baseline as early as August with no overlap in calculated errors.
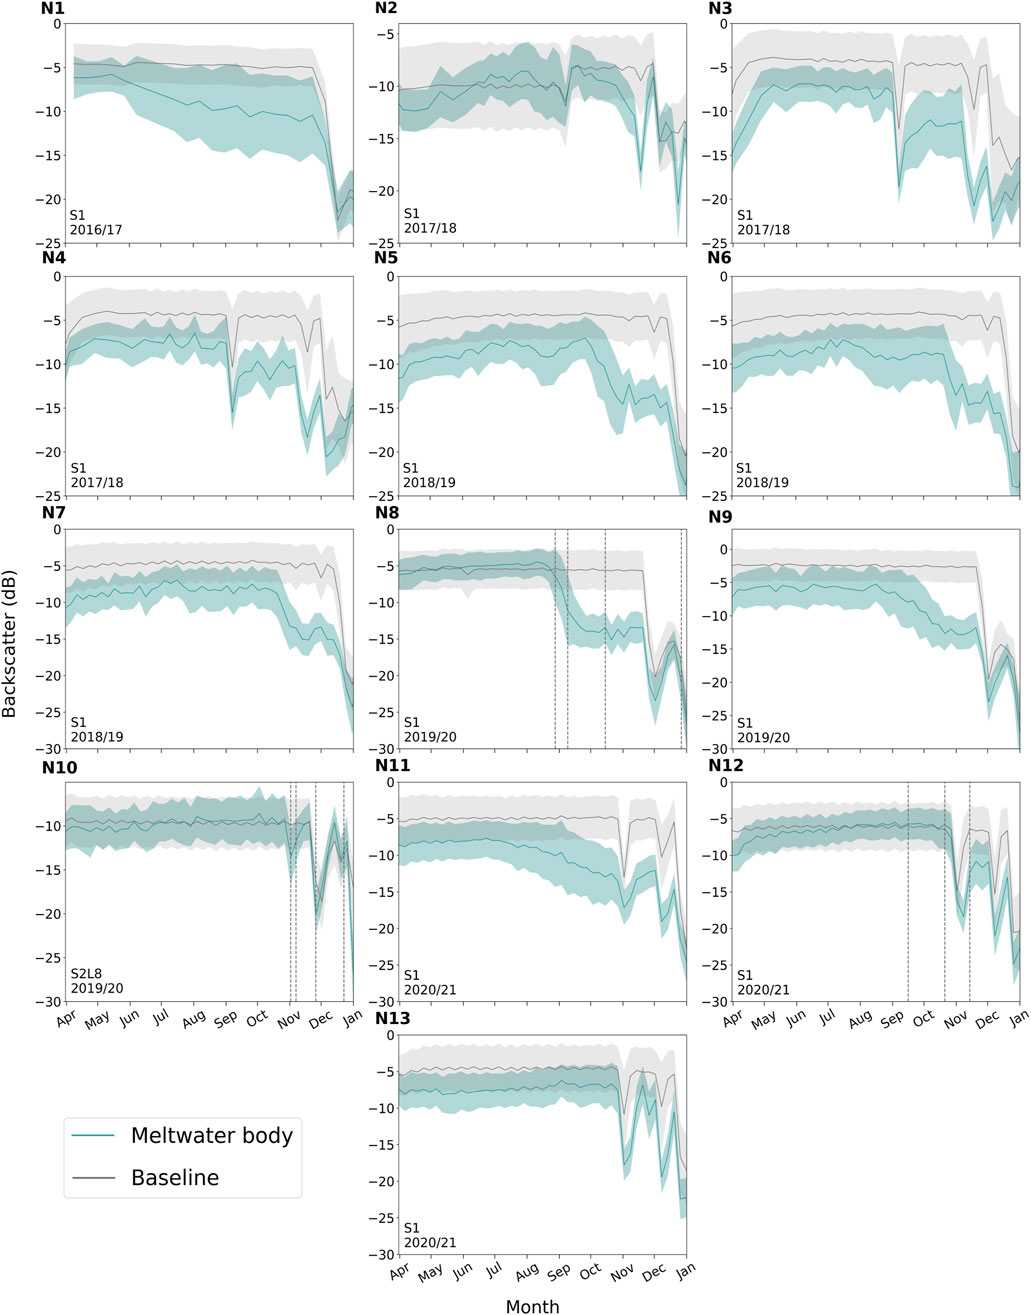
Figure 3. Time series of mean Sentinel-1 backscatter during the previous winter for sites where meltwater was identified during early November in either optical (“S2L8”) or SAR (“S1”) images. Each panel corresponds to a different meltwater body, N1–13, shown in Figure 2. Mean backscatter is shown for the corresponding water body in blue and the surrounding ice shelf (“baseline”) in grey. Shaded regions show ±1 standard deviation. Each panel is labelled with the relevant melt season (e.g., 2019/20 corresponds to meltwater bodies observed in early November 2019). Dashed vertical lines marked on panels N8, N10, and N12 correspond to the dates of the satellite images shown in Figures 6, 4 and 5 respectively.
Images from an example of the first case are shown in Figure 4 (site N10 in Figures 2, 3). The similarity of the meltwater body and baseline backscatter signatures between April and October 2019 implies that any water at this site from the previous summer remained frozen throughout the winter. The subsequent decrease in baseline backscatter in November is likely associated with the widespread onset of melt (as also found in Luckman et al., 2014; Freer, 2020; Johnson et al., 2020; Li et al., 2021), representing increased microwave absorption by wet snow (Ulaby et al., 1986). Mean lake backscatter decreased to ∼3 dB below the baseline mean in early November, although with substantial overlap in their calculated errors. Nonetheless, there is a visible difference between what appears to be the lake surface and the surrounding snow/ice in coincident optical imagery (Figure 4), suggesting that the decrease in backscatter represents microwave specular reflection from the lake surface (Ulaby et al., 1986; Luckman et al., 2014).
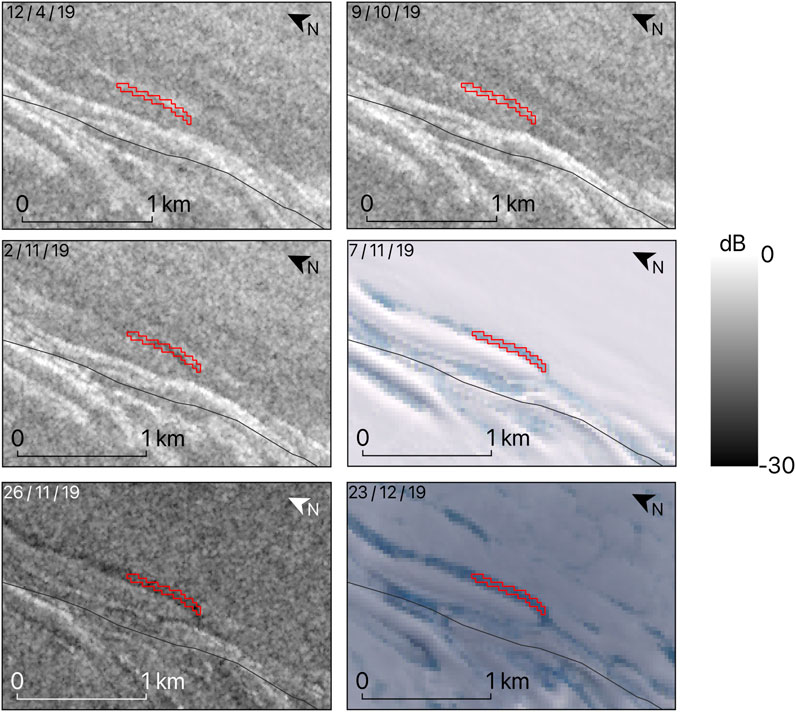
Figure 4. Spatiotemporal evolution of a meltwater body and the surrounding ice-shelf surface in the winter of 2019 and early 2019/20 melt season. Meltwater body (red polygon; site N10 in Figure 2) was present in the first half of November 2019 in optical (S2L8) imagery. Optical images shown (7/11/19 and 23/12/19) are from Landsat 8. Grounding line (black line) is from Dell et al. (2024b).
Images from an example of the second case are shown in Figure 5 (site N12 in Figures 2, 3). As with the first case, the water body and baseline backscatter signatures suggest that any water froze over winter and melt onset occurred in November. The enhanced backscatter decrease in the water body compared to that in the surrounding area (lower by ∼6 dB) implies that water accumulated preferentially at this location at the beginning of the melt season. The fact that water was not visible in optical imagery suggests that it accumulated only in the shallow subsurface (cf. Miles et al., 2017; Dunmire et al., 2020).
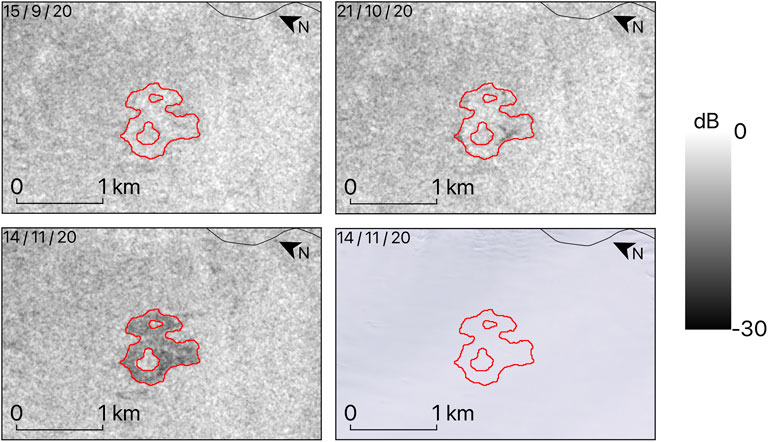
Figure 5. Spatiotemporal evolution of a meltwater body and the surrounding ice-shelf surface in late winter and early summer of 2020/2021. Meltwater body (red polygon; site N12 in Figure 2) was present in the first half of November 2020 in Sentinel-1 imagery. Optical image shown (14/11/20) is from Sentinel-2. Grounding line (black line) is from Dell et al. (2024b).
Figure 6 shows images from an example of the third type of winter-to-early-summer backscatter evolution (site N8 in Figures 2, 3). It shares many of the same characteristics as for the second case (Figure 5), again suggesting shallow subsurface water storage. In this case, however, water body backscatter decreased gradually during late winter (from late August to late September), with no corresponding decrease in baseline backscatter. Water body backscatter remained below that of the background until late November, after which both water body and background backscatter decreased to similar intensities. S1 imagery shows that a small patch of low backscatter developed at the site from late August, yet surface meltwater was not visible in optical imagery until late December (Figure 6). Surface meltwater ponding was visible in mid-January 2020 as a “moat” surrounding the original water body identified by S1 image classification (Figure 6). In late January, the original water body was still not visible in optical imagery but continued to be identifiable in S1 imagery as a patch of low backscatter, as did the surrounding ponded surface “moat” (Figure 6). Collectively, this suggests that meltwater began to accumulate in the shallow subsurface during late winter but only began to accumulate on the surrounding ice surface later in the summer.
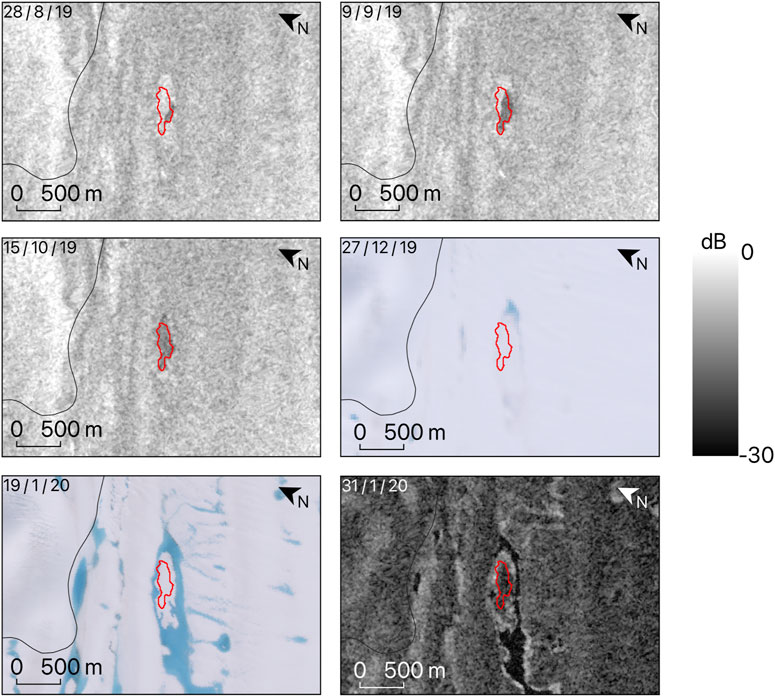
Figure 6. Spatiotemporal evolution of a meltwater body and the surrounding ice-shelf surface from late winter 2019 to mid-summer 2020. Meltwater body (red polygon; site N8 shown in Figure 2) was present in the first half of November 2019 in Sentinel-1 imagery. Landsat 8 image is from 27/12/19; Sentinel-2 image is from 19/1/20. Grounding line (black line) is from Dell et al. (2024b).
4.2 Meltwater bodies present in late March
From the 15 late-summer water bodies analysed, we again identify three types of behaviour. First, in three instances, water body and baseline backscatter increased almost simultaneously during late summer, with water body backscatter reaching a winter value ∼2–5 dB below that of background (Figure 7, sites M2, M3, and M11). Second, on seven occasions, baseline backscatter increased in late summer and quickly reached a new winter value, as for case 1, but water body backscatter increased more gradually over 2–8 months, eventually attaining levels ∼2–6 dB below baseline (Figure 7, sites M4–M9 and M15). Included in this group is site M5, which reached near-baseline backscatter values in April–May; however, backscatter began to decrease again in June, perhaps suggesting that subsequent melt onset occurred towards mid to late winter. Finally, on five occasions, baseline and water body backscatter showed similar late-summer increases to those observed in case 2, but water body backscatter reached winter values approximately equal to or greater than baseline (Figure 7, sites M1, M10, and M12–M14).
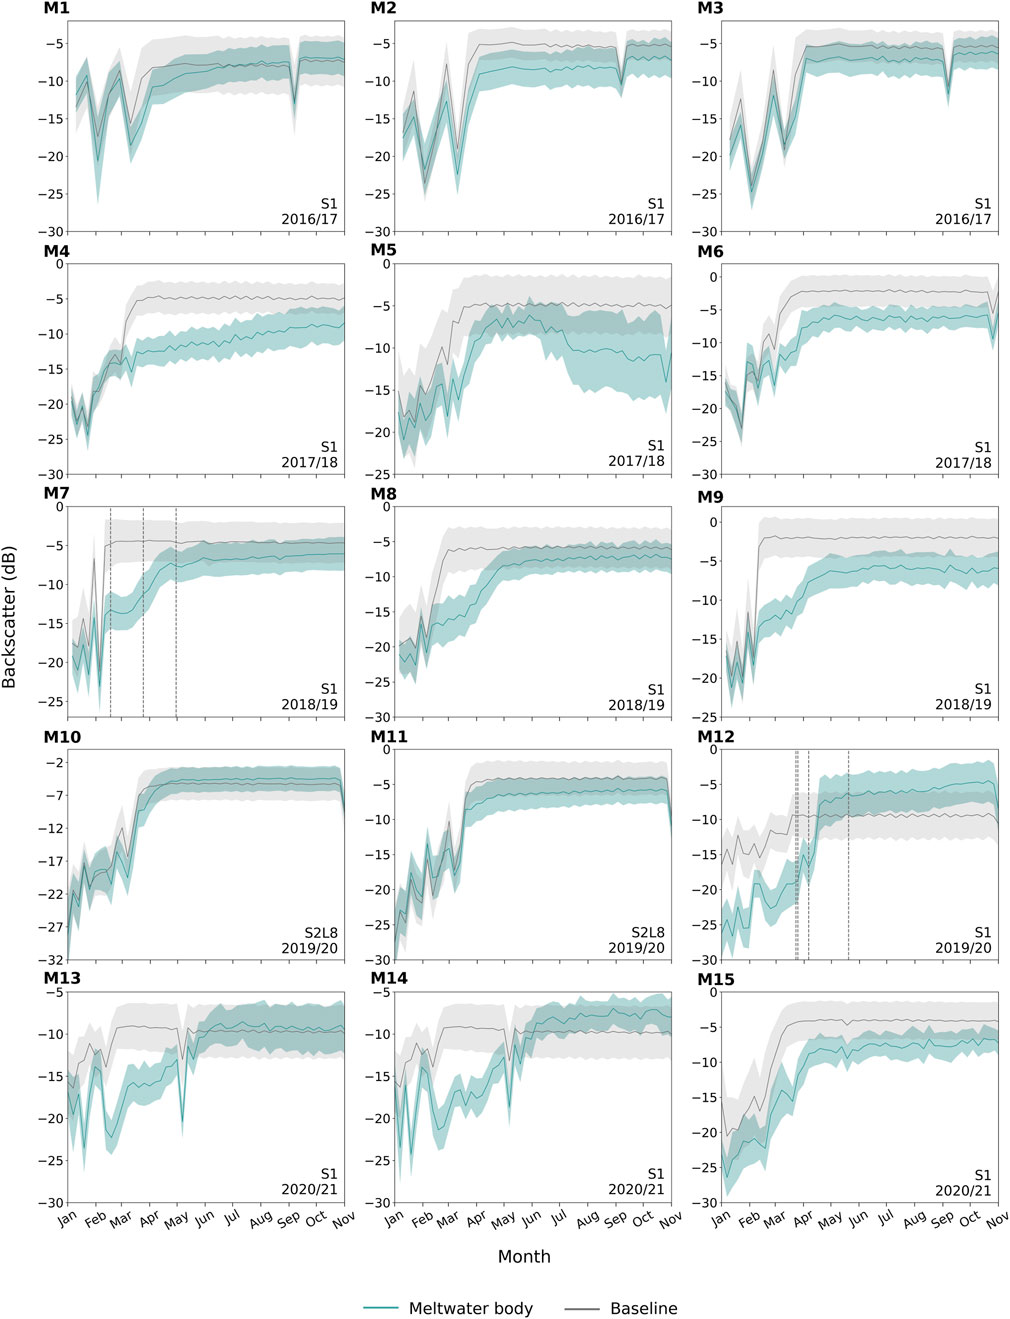
Figure 7. Time series of mean Sentinel-1 backscatter during subsequent winters for sites where meltwater was identified during late March in either optical (“S2L8”) or SAR (“S1”) images. Each panel corresponds to a different meltwater body, M1–15, shown in Figure 2. Mean backscatter is shown for the corresponding water body and the surrounding ice shelf (“baseline”). Shaded regions show ±1 standard deviation. Each panel is labelled with the relevant melt season (e.g., 2019/20 corresponds to meltwater bodies observed in late March 2020). Dashed vertical lines marked on panels M7 and M12 correspond to the dates of the satellite images shown in Figures 8, 9, respectively.
The first case is interpreted as a marked reduction in surface melting and rapid onset of freezing towards the end of the melt season, with water body backscatter quickly approximating background intensities due to the relatively rapid freeze-through of a shallow water body (Liang et al., 2019; Freer, 2020; Li et al., 2021). The fact that water body backscatter remained just below background values may be due to reduced volume scattering at the refrozen water body surface compared to the surrounding snow/firn (Luckman et al., 2014).
Images from an example of the second case are shown in Figure 8 (site M7 in Figures 2, 7). The water body is visible in SAR imagery in February but not in optical imagery, suggesting that meltwater was present only in the shallow subsurface (Miles et al., 2017; Dunmire et al., 2020). Compared to the first case, the more gradual evolution of the water body backscatter from low to high values may be interpreted as the slower rate of freeze-through of a deeper water body (Antonova et al., 2016).
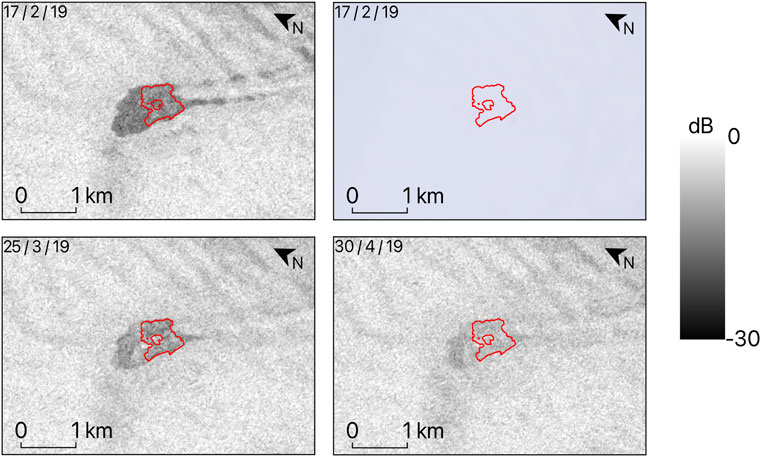
Figure 8. Spatiotemporal evolution of a meltwater body and the surrounding ice-shelf surface from late summer to the following winter of 2019. Meltwater body (red polygon; site M7 shown in Figure 2) was present in the second half of March 2019 in Sentinel-1 imagery. Optical image shown (17/2/19) is from Sentinel-2.
Figure 9 shows images from an example of the third case (site M12 in Figures 2, 7). The meltwater body is visible as a surface lake in optical and SAR imagery during late March 2020. The ∼10 dB difference between lake and baseline backscatter at this time is likely explained as enhanced microwave absorption and/or specular reflection from the lake surface (Ulaby et al., 1986). As with the second case, the relatively slow evolution of water body backscatter is interpreted as slow freeze-through, which is supported by the late March optical image showing a large and seemingly deep lake; relative lake depth is inferred from the darker blue at its centre compared to surrounding visible meltwater (Figure 9). The fact that water body backscatter increased to above background levels may have been linked to the internal structure of the refrozen ice (Freer, 2020) or the lake’s position within a high compressive zone near the north-western grounding line, which contributes to snow grain size variations (Ulaby et al., 1986; Suhn et al., 1999; Holt et al., 2013). Alternatively, this may be due to the formation of an ice lid at the surface of the meltwater body, with higher backscatter values produced at the ice–water interface (Spergel et al., 2021).
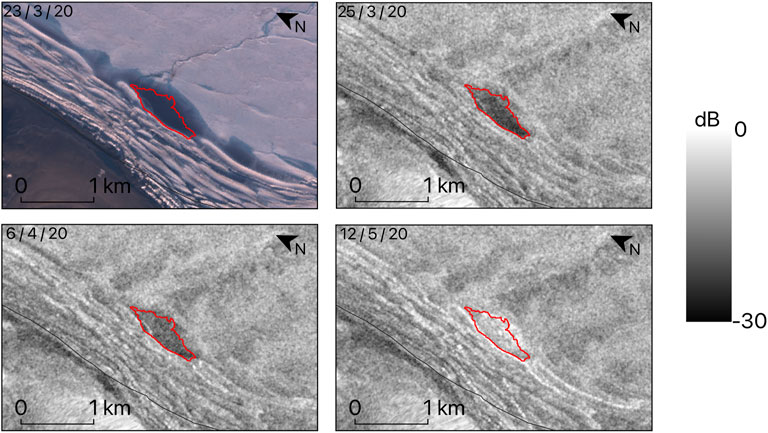
Figure 9. Spatiotemporal evolution of a meltwater body and the surrounding ice-shelf surface from late summer to the following winter of 2020. Meltwater body (red polygon; site M12 shown in Figure 2) was identified in the second half of March 2020 in Sentinel-1 imagery. Optical image shown (23/3/20) is from Sentinel-2. Grounding line (black line) is from Dell et al. (2024b).
4.3 Over-winter meltwater persistence from late March to early November
Four potentially persistent meltwater bodies were identified, present at the end and the beginning of successive melt seasons (Figure 10). At two of these sites, backscatter increased to near-baseline values (∼1–4 dB lower than baseline) over the winter (Figure 10, sites B1 and B2), suggesting that meltwater froze after late March but accumulated in the same locations again the following November (Johansson and Brown, 2012; Arthur et al., 2022).
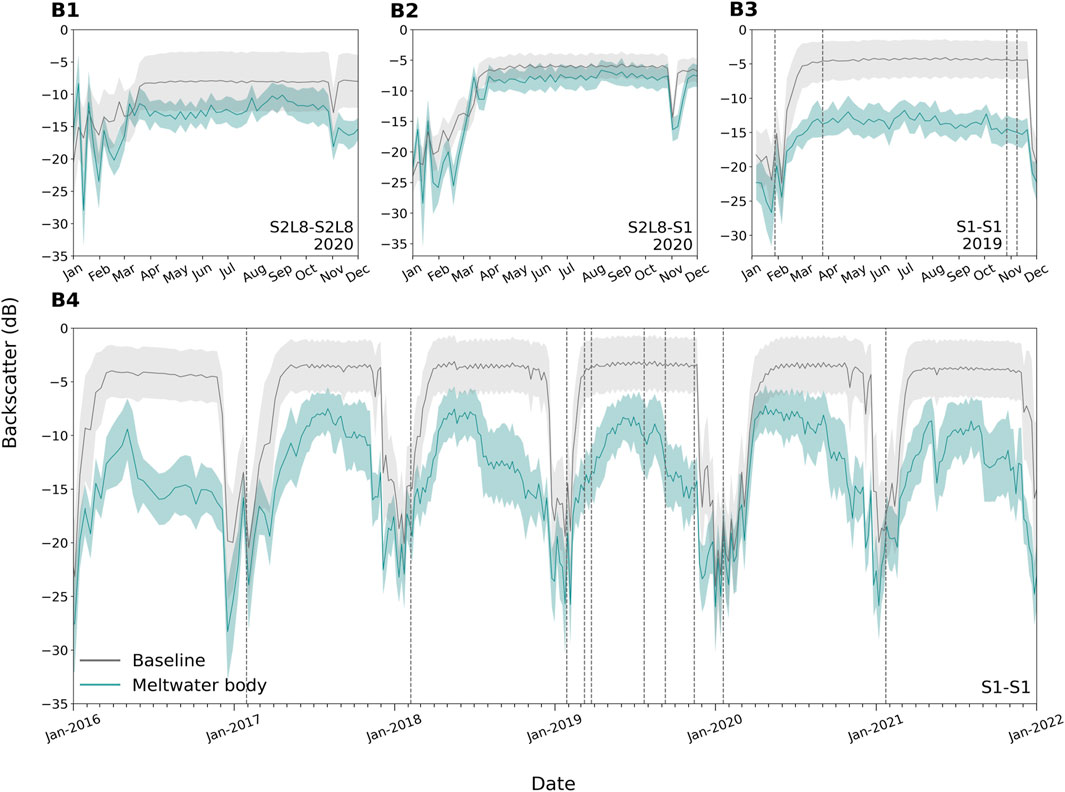
Figure 10. Time series of mean Sentinel-1 backscatter during intervening winters for sites where meltwater was present during the second half of March and the first half of November of consecutive melt seasons, identified from either optical (“S2L8”) or SAR (“S1”) images. Each panel corresponds to a different meltwater body, B1–4, shown in Figure 2. Bottom panel shows mean Sentinel-1 backscatter across all winters during the study period for site B4. Mean backscatter is shown for the corresponding water body in blue and the surrounding ice shelf (“baseline”) in grey. Shaded regions show ±1 standard deviation. “S2L8” and “S1” denote the satellite imagery from which meltwater bodies were identified, in March (left) and November (right). Each panel is labelled with the year in which the meltwater body was observed, except for site B4, which was observed in multiple years. Dashed vertical lines marked on panels B3 and B4 correspond to the dates of the satellite images shown in Figures 11, 12, respectively.
In the remaining two meltwater bodies (Figure 10, sites B3 and B4), mean backscatter remained lower than the surrounding baseline backscatter by up to ∼9 dB throughout the winter. At site B3, an optical image from late January 2019 shows a snow-covered water body with visible surface meltwater nearby (Figure 11). SAR images of the site from late March, late October, and early November show a small expansion of the low-backscatter area, suggesting that the feature was part of a larger water body which had grown by the start of the 2019/20 melt season (Figure 11). The circular shape of the overall feature is indicative of a doline, a depression in the ice-shelf surface caused by lake drainage (Mellor, 1960; Warner et al., 2021; Banwell et al., 2024); the pattern of low backscatter at the centre of the feature suggests that shallow subsurface water remained in the deepest part of the doline basin during the winter.
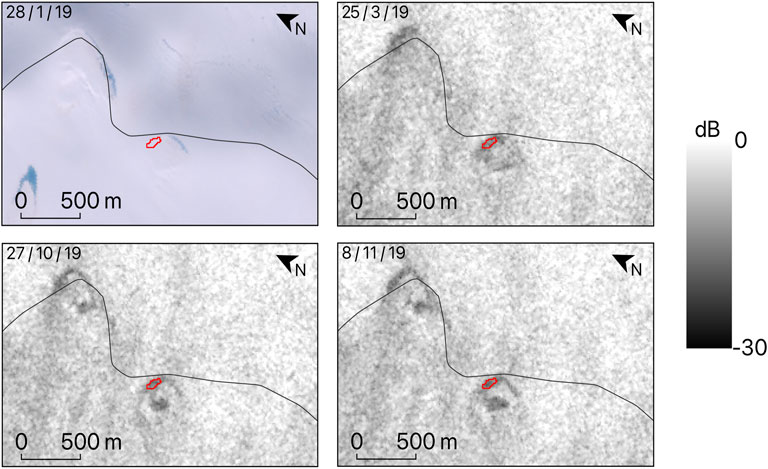
Figure 11. Spatiotemporal evolution of a meltwater body and the surrounding ice-shelf surface throughout the winter, from late summer 2018/19 to the following summer of 2019/20. Meltwater body (red polygon; site B3 in Figure 2) was present in the second half of March 2019 and the first half of November 2019 in Sentinel-1 imagery. Optical image shown (28/1/19) is from Sentinel-2. Grounding line (black line) is from Dell et al. (2024b).
At site B4, mean water body backscatter values remained lower than the baseline mean by ∼3–12 dB during every summer and winter between 2015 and 2021 (Figure 10). Meltwater was detected at this site in March and November of both 2018 and 2019 using S1 imagery (Dirscherl et al., 2021a). Optical imagery of this site in late January 2019 reveals a snow-covered water body with water visible around its edges (Figure 12A), like that observed at site B3 (Figure 11). By early March 2019, the area was entirely snow-covered, and surface water was no longer visible (Figure 12A). Despite this, low SAR backscatter remained in the area throughout late summer, the following winter, and into September 2019 (Figure 12A). Therefore, evidence suggests that the surface meltwater visible in late January 2019 was part of a larger shallow subsurface water body, which persisted through the winter, insulated by overlying ice and snow (Dunmire et al., 2020). Alternatively, the reduced backscatter relative to the background may be attributed to variations in local topography due to the site’s position within a surface depression (Suhn et al., 1999). Nonetheless, meltwater was visible in optical imagery during mid-summer in four other melt seasons (Figure 12B), suggesting that the persistent low backscatter represents a relatively large perennial water body.
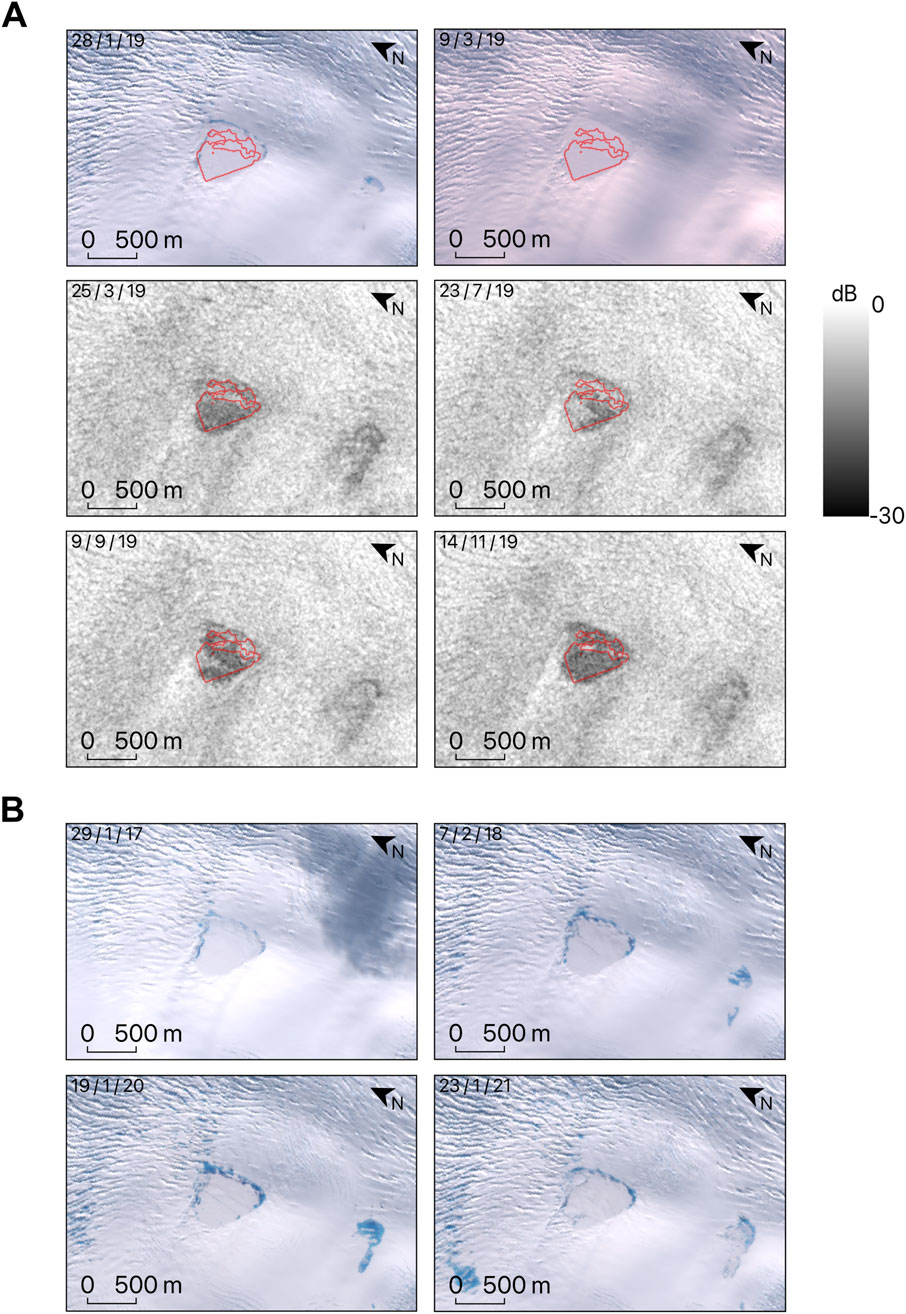
Figure 12. Spatiotemporal evolution of a meltwater body and the surrounding ice-shelf surface. Meltwater body (red polygon; site B4 shown in Figure 2) was detected from its presence in both the second halves of March 2018 and 2019 and in the first halves of November 2018 and 2019 in Sentinel-1 imagery. (A) Sequence of Sentinel-2 optical images and Sentinel-1 backscatter images of the meltwater body and surrounding ice-shelf surface from mid-summer 2018/19 to early summer 2019/20. (B) Sentinel-2 images of the meltwater body in the summers of 2017, 2018, 2020, and 2021.
5 Discussion
Of the 32 meltwater bodies analysed, the majority showed no or limited evidence of meltwater persistence throughout the winter. Most water bodies observed in late March had largely disappeared by May of the same year, and although most meltwater bodies present in early November showed earlier decreases in SAR backscatter, comparison to baseline backscatter values suggests that the majority had formed either at or just prior to the start of summer. Backscatter changes in these meltwater bodies were gradual, suggesting that meltwater accumulated slowly near the start of summer and froze at the end of summer. This is consistent with most previous observations of Antarctic supraglacial lake dynamics (Johansson and Brown, 2012; Langley et al., 2016; Arthur et al., 2020b; Tuckett et al., 2021) but contrasts with a smaller number of studies in Antarctica (Dunmire et al., 2020; Trusel et al., 2022) and Greenland (Miles et al., 2017; Benedek and Willis, 2021), where large, anomalous, sudden, and sustained increases in backscatter were inferred to be indicative of lake drainage events. Although we have identified a doline-like feature (Figure 11), typically indicative of past and/or current vertical lake drainage (Stephenson and Fleming, 1940; Reynolds, 1981; Banwell et al., 2024), our backscatter timeseries show no evidence for such drainage events in this or any of the other sampled meltwater bodies.
The duration of meltwater freeze-through into the winter varied between the sampled meltwater bodies (Figures 7–9). This is likely a function of water body volume, local variations in climate and snow properties, and the amount of refreezing that had already occurred during the melt season (Law et al., 2020; Spergel et al., 2021). Although exact dates of lake cessation were not determined, most of the meltwater bodies had comparable freeze-through durations to that of a large ephemeral surface lake observed on the Amery Ice Shelf in 2017, where freeze-through lasted >60 days and extended into late April/early May (Spergel et al., 2021). A small number of water bodies (Figure 7, sites M4–M9 and M15) underwent longer periods of freeze-through lasting until June–August, which is likely indicative of greater water volumes (Antonova et al., 2016).
Late-winter backscatter signatures of meltwater bodies identified in early November suggest that the onset of meltwater storage may have begun as early as August prior to the 2019/20 melt season (site N8, Figures 3, 6). Early summer optical imagery showed no evidence of surface water in these locations, suggesting that water accumulated in the shallow subsurface during the winter (cf. Miles et al., 2017; Bevan et al., 2018) but did not sufficiently saturate the firn column to initiate surface ponding (van Wessem et al., 2023). Wintertime surface melting events, inferred from C- and Ku-band radar scatterometry, have become increasingly frequent across the Antarctic Peninsula over recent decades (Zheng et al., 2020), likely driven by warm, föhn winds (Kuipers Munneke et al., 2018; Wiesenekker et al., 2018; Turton et al., 2020; Laffin et al., 2021) and possibly associated with atmospheric rivers (Maclennan et al., 2023).
Over-winter meltwater persistence was identified in two meltwater bodies (Figures 11, 12). Like the above, one of these bodies (Figure 11) is inferred to have been present in the ice-shelf’s shallow subsurface during the 2019 winter. Such instances of winter subsurface meltwater storage could have provided a foundation for earlier firn saturation and surface albedo lowering in the following melt season, contributing to greater surface ponding (Leeson et al., 2020; Jakobs et al., 2021; Amory et al., 2024). This is consistent with the large surface lake extents observed during the 2019/2020 summer (Banwell et al., 2021). Although GVIIS is thought to be relatively resilient to hydrofracture due to its compressive flow regime (Holt et al., 2013), extensive surface ponding may cause areas of its eastern grounding zone to become vulnerable (Figure 4 of Lai et al., 2020). Thus, enhanced winter meltwater storage could cause GVIIS to become increasingly vulnerable to oceanic and atmospheric drivers of instability (Smith et al., 2020; Gilbert and Kittel, 2021).
Although the first persistent meltwater body we identified was located adjacent to and downstream of the eastern grounding line, the latter was located in a surface depression on Ryder Glacier (Figure 12). Comparison of grounding line products (Rignot et al., 2016; Mohajerani et al., 2021; Boxall et al., 2022b; Dell et al., 2024b) suggests that this water body was ∼2–2.5 km upstream of the grounding line. Evidence suggests that this was a perennial shallow subsurface water body, with surface water visible only during the mid-summer. The presence of surface water may reflect the saturation of a surface snow layer above an ice-covered subsurface lake, or the exposure and melting of the ice layer itself (cf. Johansson and Brown, 2012; Schröder et al., 2020). The fact that the water body did not freeze through completely during any of the six winters in our study period suggests that it was deep enough to remain liquid, likely enabled by glacier surface topography and insulation from a thin surface ice layer (Dunmire et al., 2021).
The persistence of this latter meltwater body could have implications for the flow of grounded ice to GVIIS (Boxall et al., 2022a; Boxall et al., 2024). Links between surface and shallow subsurface meltwater storage and ice flow are well established on the Greenland Ice Sheet (Zwally et al., 2002; Bartholomew et al., 2010; Tedesco et al., 2013; Poinar et al., 2019) and valley glaciers (Mair et al., 2002; Rippin et al., 2005), where meltwater inputs from surface streams, lakes, and firn aquifers to the subglacial hydrological system cause increases in basal water pressure and subsequent glacier acceleration (Schoof, 2010). Although observations of these relationships on the Antarctic Ice Sheet are much less prevalent (Tuckett et al., 2019; Rott et al., 2020; Wallis et al., 2023), evidence for the persistence of meltwater storage on Ryder Glacier supports the possibility of such processes occurring (Bell et al., 2018). Indeed, Boxall et al. (2022a) found seasonal variability in the flow of Ryder Glacier and other Palmer Land and Alexander Island glaciers, with the greatest seasonal velocity anomalies detected close to glacier grounding lines. These flow variations were attributed by Boxall et al. (2024) primarily to surface forcing via meltwater inputs, mediated by ocean-driven ice-shelf thinning, with ice flow acceleration occurring 0–1 month after increases in surface meltwater extent. With minimal surface ponding observed upstream of the GVIIS grounding line, they suggested that meltwater may access the glacier bed through the growth of englacial water stores such as crevasses, eventually triggering hydrofracture (Boxall et al., 2024). Sites of persistent meltwater storage, particularly those that are close to crevasse fields, such as the meltwater body observed on Ryder Glacier (Figure 12), may show higher potential for the initiation of hydrofracture. If this were to occur, subsequent inputs of surface meltwater to the glacier bed may contribute to glacier flow variability which, in turn, could have significant implications for the stress patterns and stability of the ice shelves they feed (Holt and Glasser, 2022).
6 Conclusions
Through analysis of winter SAR backscatter patterns, we have found that meltwater bodies on GVIIS persisted into winter in relatively few locations between 2015 and 2021. Most of the meltwater bodies underwent gradual freeze-through at the end of the summer, with no lake drainage events observed. Patterns of meltwater onset showed greater likelihood of winter meltwater presence, with over half of sites identified in November showing backscatter patterns suggestive of meltwater accumulation, typically in the shallow subsurface, prior to November. Although in most cases these meltwater bodies formed near to the start of the summer, one site accumulated water as early as August, showing evidence for winter melt events that may have been driven by föhn winds (Kuipers Munneke et al., 2018; Wiesenekker et al., 2018; Turton et al., 2020; Laffin et al., 2021). Close to the eastern grounding line, another site showed evidence of shallow subsurface meltwater storage persisting throughout the 2019 winter. Earlier firn saturation and surface albedo lowering in such areas could enhance summer surface melting, encouraging the growth of larger lakes (Jakobs et al., 2021; Dell et al., 2024a). This would increase the vulnerability of such areas to hydrofracture.
A perennial shallow subsurface lake was identified on Ryder Glacier, upstream of the grounding line, with surface meltwater visible at the height of five out of six melt seasons. Such meltwater persistence could have implications for the delivery of surface water to the base of Antarctic glaciers, and locations of such persistence may be hotspots of glacier flow variability (Tuckett et al., 2019; Boxall et al., 2022a; Boxall et al., 2024; Wallis et al., 2023). The resulting variations in glacier flow may have significant implications for future ice-shelf stability (Holt and Glasser, 2022).
Examination of SAR imagery has revealed meltwater body persistence into the early winter due to the slow freeze-through of deep summer lakes and meltwater accumulation in the late winter due to winter melt events. In two locations, our analysis has revealed long-term meltwater persistence throughout one or more winters. Furthermore, SAR imagery has revealed meltwater storage in shallow subsurface locations, a finding that could not have been determined using optical imagery alone. Collectively, we hope that our findings provide impetus for future research into winter meltwater storage on Antarctic ice shelves and help in planning for future field-based investigations into the hydrological and dynamic implications of surface and shallow subsurface meltwater bodies on Antarctic ice shelves and glaciers.
Data availability statement
The original contributions presented in the study are publicly available. This data can be found here: https://doi.org/10.17863/CAM.119115.
Author contributions
KD: Conceptualization, Formal Analysis, Investigation, Methodology, Visualization, Writing – original draft, Writing – review and editing. IW: Conceptualization, Supervision, Writing – review and editing. RD: Conceptualization, Supervision, Writing – review and editing.
Funding
The author(s) declare that financial support was received for the research and/or publication of this article. The work was accomplished while ICW was in receipt of a United Kingdom Natural Environment Research Council grant (NE/T006234/1), and RLD was supported by a European Space Agency, Climate Change Initiative fellowship (ESA ESRIN/ contract no. 4000134462/21/I-NB).
Acknowledgments
The authors thank Mariel Dirscherl [formerly of German Aerospace Center (DLR)] for providing her Sentinel-1- and Sentinel-2-derived lake masks and for her help with the early stages of their work. The authors also thank Bryony Freer (Scripps Institution of Oceanography, formerly University of Leeds, British Antarctic Survey), Devon Dunmire (KU Leuven, the University of Colorado Boulder), and Corinne Benedek (Scott Polar Research Institute) for helpful conversations regarding the use of Sentinel-1 imagery for lake detection. The authors also thank Bryony for sharing the findings of her Edinburgh University Master’s research, which were helpful when interpreting the results.
Conflict of interest
The authors declare that the research was conducted in the absence of any commercial or financial relationships that could be construed as a potential conflict of interest.
Generative AI statement
The author(s) declare that no Generative AI was used in the creation of this manuscript.
Publisher’s note
All claims expressed in this article are solely those of the authors and do not necessarily represent those of their affiliated organizations, or those of the publisher, the editors and the reviewers. Any product that may be evaluated in this article, or claim that may be made by its manufacturer, is not guaranteed or endorsed by the publisher.
Supplementary material
The Supplementary Material for this article can be found online at: https://www.frontiersin.org/articles/10.3389/feart.2025.1545009/full#supplementary-material
References
Adusumilli, S., Fricker, H. A., Medley, B., Padman, L., and Siegfried, M. R. (2020). Interannual variations in meltwater input to the Southern Ocean from Antarctic ice shelves. Nat. Geosci. 13 (9), 616–620. doi:10.1038/s41561-020-0616-z
Amory, C., Buizert, C., Buzzard, S., Case, E., Clerx, N., Culberg, R., et al. (2024). Firn on ice sheets. Nat. Rev. Earth and Environ. 5, 79–99. doi:10.1038/s43017-023-00507-9
Antonova, S., Duguay, C. R., Kääb, A., Heim, B., Langer, M., Westermann, S., et al. (2016). Monitoring bedfast ice and ice phenology in lakes of the Lena River Delta using TerraSAR-X backscatter and coherence time series. Remote Sens. 8 (11), 903. doi:10.3390/rs8110903
Arthur, J. F., Stokes, C., Jamieson, S. S., Carr, J. R., and Leeson, A. A. (2020a). Recent understanding of Antarctic supraglacial lakes using satellite remote sensing. Prog. Phys. Geogr. Earth Environ. 44 (6), 837–869. doi:10.1177/0309133320916114
Arthur, J. F., Stokes, C. R., Jamieson, S. S. R., Carr, J. R., and Leeson, A. A. (2020b). Distribution and seasonal evolution of supraglacial lakes on Shackleton Ice Shelf, East Antarctica. Cryosphere 14 (11), 4103–4120. doi:10.5194/tc-14-4103-2020
Arthur, J. F., Stokes, C. R., Jamieson, S. S. R., Rachel Carr, J., Leeson, A. A., and Verjans, V. (2022). Large interannual variability in supraglacial lakes around East Antarctica. Nat. Commun. 13 (1), 1711. doi:10.1038/s41467-022-29385-3
Banwell, A., Hewitt, I., Willis, I., and Arnold, N. (2016). Moulin density controls drainage development beneath the Greenland Ice Sheet. J. Geophys. Res. Earth Surf. 121 (12), 2248–2269. doi:10.1002/2015JF003801
Banwell, A. F., Datta, R. T., Dell, R. L., Moussavi, M., Brucker, L., Picard, G., et al. (2021). The 32-year record-high surface melt in 2019/2020 on the northern George VI Ice Shelf, Antarctic Peninsula. Cryosphere 15 (2), 909–925. doi:10.5194/tc-15-909-2021
Banwell, A. F., and Macayeal, D. R. (2015). Ice-shelf fracture due to viscoelastic flexure stress induced by fill/drain cycles of supraglacial lakes. Antarct. Sci. 27 (6), 587–597. doi:10.1017/S0954102015000292
Banwell, A. F., MacAyeal, D. R., and Sergienko, O. V. (2013). Breakup of the Larsen B Ice Shelf triggered by chain reaction drainage of supraglacial lakes. Geophys. Res. Lett. 40 (22), 5872–5876. doi:10.1002/2013GL057694
Banwell, A. F., Willis, I. C., Macdonald, G. J., Goodsell, B., and MacAyeal, D. R. (2019). Direct measurements of ice-shelf flexure caused by surface meltwater ponding and drainage. Nat. Commun. 10 (1), 730. doi:10.1038/s41467-019-08522-5
Banwell, A. F., Willis, I. C., Stevens, L. A., Dell, R. L., and MacAyeal, D. R. (2024). Observed meltwater-induced flexure and fracture at a doline on George VI Ice Shelf, Antarctica. J. Glaciol. 70, e47–14. doi:10.1017/jog.2024.31
Bartholomew, I., Nienow, P., Mair, D., Hubbard, A., King, M. A., and Sole, A. (2010). Seasonal evolution of subglacial drainage and acceleration in a Greenland outlet glacier. Nat. Geosci. 3 (6), 408–411. doi:10.1038/ngeo863
Bell, R. E., Banwell, A. F., Trusel, L. D., and Kingslake, J. (2018). Antarctic surface hydrology and impacts on ice-sheet mass balance. Nat. Clim. Change 8 (12), 1044–1052. doi:10.1038/s41558-018-0326-3
Benedek, C. L., and Willis, I. C. (2021). Winter drainage of surface lakes on the Greenland Ice Sheet from Sentinel-1 SAR imagery. Cryosphere 15 (3), 1587–1606. doi:10.5194/tc-15-1587-20211587-2021
Bevan, S. L., Luckman, A. J., Kuipers Munneke, P., Hubbard, B., Kulessa, B., and Ashmore, D. W. (2018). Decline in surface melt duration on larsen C Ice Shelf revealed by the advanced scatterometer (ASCAT). Earth Space Sci. 5 (10), 578–591. doi:10.1029/2018EA000421
Bindschadler, R., Vornberger, P., Fleming, A., Fox, A., Mullins, J., Binnie, D., et al. (2008). The Landsat image mosaic of Antarctica. Remote Sens. Environ. 112 (12), 4214–4226. doi:10.1016/j.rse.2008.07.006
Boxall, K., Christie, F. D. W., Willis, I. C., Wuite, J., and Nagler, T. (2022a). Seasonal land-ice-flow variability in the Antarctic Peninsula. Cryosphere 16 (10), 3907–3932. doi:10.5194/tc-16-3907-2022
Boxall, K., Christie, F. D. W., Willis, I. C., Wuite, J., and Nagler, T. (2022b). West Antarctic Peninsula grounding line location datasets supporting “Seasonal land-ice-flow variability in the Antarctic Peninsula”. Cambridge, UK: Apollo - University of Cambridge Repository. [Dataset]. doi:10.17863/CAM.82248
Boxall, K., Christie, F. D. W., Willis, I. C., Wuite, J., Nagler, T., and Scheiblauer, S. (2024). Drivers of seasonal land-ice-flow variability in the Antarctic Peninsula. J. Geophys. Res. Earth Surf. 129 (6), e2023JF007378. doi:10.1029/2023JF007378
Cook, A. J., and Vaughan, D. G. (2010). Overview of areal changes of the ice shelves on the Antarctic Peninsula over the past 50 years. Cryosphere 4, 77–98. doi:10.5194/tc-4-77-201077-2010
Cooper, P., Fretwell, P. T., and Gerrish, L. (2020). Medium resolution vector polygons of Antarctic rock outcrop (7.3). [Dataset]. Cambridge, UK: UK Polar Data Centre, Natural Environment Research Council, UK Research and Innovation. doi:10.5285/077E1F04-7068-4327-A4F2-71D863F70064
DeConto, R. M., and Pollard, D. (2016). Contribution of Antarctica to past and future sea-level rise. Nature 531 (7596), 591–597. doi:10.1038/nature17145
Dell, R., Willis, I., Arnold, N., Banwell, A., and De Roda Husman, S. (2024b). Research data supporting “Substantial contribution of slush to meltwater area across Antarctic ice shelves”. Cambridge, UK: Apollo - University of Cambridge Repository. [Dataset]. doi:10.17863/CAM.108421
Dell, R. L., Arnold, N., Willis, I., Banwell, A., Williamson, A., Pritchard, H., et al. (2020). Lateral meltwater transfer across an Antarctic ice shelf. Cryosphere 14 (7), 2313–2330. doi:10.5194/tc-14-2313-2020
Dell, R. L., Banwell, A. F., Willis, I. C., Arnold, N. S., Halberstadt, A. R. W., Chudley, T. R., et al. (2021). Supervised classification of slush and ponded water on Antarctic ice shelves using Landsat 8 imagery. J. Glaciol. 68, 401–414. doi:10.1017/jog.2021.114
Dell, R. L., Willis, I. C., Arnold, N. S., Banwell, A. F., and de Roda Husman, S. (2024a). Substantial contribution of slush to meltwater area across Antarctic ice shelves. Nat. Geosci. 17 (7), 624–630. doi:10.1038/s41561-024-01466-6
de Roda Husman, S., Lhermitte, S., Bolibar, J., Izeboud, M., Hu, Z., Shukla, S., et al. (2024). A high-resolution record of surface melt on Antarctic ice shelves using multi-source remote sensing data and deep learning. Remote Sens. Environ. 301, 113950. doi:10.1016/j.rse.2023.113950
Dirscherl, M., Dietz, A. J., Kneisel, C., and Kuenzer, C. (2020). Automated mapping of Antarctic supraglacial lakes using a machine learning approach. Remote Sens. 12 (7), 1203. doi:10.3390/rs12071203
Dirscherl, M. C., Dietz, A. J., and Kuenzer, C. (2021a). Seasonal evolution of Antarctic supraglacial lakes in 2015–2021 and links to environmental controls. The Cryosphere 15 (11), 5205–5226. doi:10.5194/tc-15-5205-2021
Dirscherl, M. C., Dietz, A. J., and Kuenzer, C. (2021b). Sentinel-2 classified lake extents for George VI Ice Shelf, 2015 – 2021, supporting ‘Seasonal evolution of Antarctic supraglacial lakes in 2015–2021 and links to environmental controls’ [Dataset]. doi:10.17863/CAM.119115
Dirscherl, M. C., Dietz, A. J., and Kuenzer, C. (2021c). Sentinel-1 classified lake extents for George VI Ice Shelf, 2015 – 2021, supporting ‘Seasonal evolution of Antarctic supraglacial lakes in 2015–2021 and links to environmental controls’ [Dataset]. doi:10.17863/CAM.119115
Dirscherl, M., Dietz, A. J., Kneisel, C., and Kuenzer, C. (2021d). A novel method for automated supraglacial lake mapping in Antarctica using Sentinel-1 SAR imagery and deep learning. Remote Sens. 13 (2), 197. doi:10.3390/rs13020197
Dunmire, D., Banwell, A. F., Wever, N., Lenaerts, J. T. M., and Datta, R. T. (2021). Contrasting regional variability of buried meltwater extent over 2 years across the Greenland Ice Sheet. Cryosphere 15 (6), 2983–3005. doi:10.5194/tc-15-2983-2021
Dunmire, D., Lenaerts, J. T. M., Banwell, A. F., Wever, N., Shragge, J., Lhermitte, S., et al. (2020). Observations of buried lake drainage on the Antarctic Ice Sheet. Geophys. Res. Lett. 47 (15), e2020GL087970. doi:10.1029/2020GL087970
Dupont, T. K., and Alley, R. B. (2005). Assessment of the importance of ice-shelf buttressing to ice sheet flow. Geophys. Res. Lett. 32 (4). doi:10.1029/2004GL022024
Fleming, W. L. S., Stephenson, A., Roberts, B. B., and Bertram, G. C. L. (1938). Notes on the scientific work of the British Graham Land Expedition, 1934-37. Geogr. J. 91 (6), 508–528. doi:10.2307/1787413
Freer, B. (2020). A multi-year assessment of the Synthetic Aperture Radar (SAR) signature of supraglacial lake evolution on the George VI Ice Shelf, Antarctic Peninsula. MSc Thesis. Edinburgh, UK: University of Edinburgh. Available online at: https://era.ed.ac.uk/handle/1842/37630?show=full.Summary. (Accessed February 3, 2022).
Fu, W., Li, X., Wang, M., and Liang, L. (2020). Delineation of radar glacier zones in the Antarctic Peninsula using polarimetric SAR. Water 12 (9), 2620. doi:10.3390/w12092620
Fürst, J. J., Durand, G., Gillet-Chaulet, F., Tavard, L., Rankl, M., Braun, M., et al. (2016). The safety band of Antarctic ice shelves. Nat. Clim. Change 6 (5), 479–482. doi:10.1038/nclimate2912
Gerrish, L., Fretwell, P., and Cooper, P. (2020). High resolution vector polygons of the Antarctic coastline (7.3). Cambridge, UK: UK Polar Data Centre, Natural Environment Research Council, UK Research and Innovation. [Data set]. doi:10.5285/0a6d85d7-fc9c-4d68-a58d-e792f68ae9f4
Gilbert, E., and Kittel, C. (2021). Surface melt and runoff on Antarctic ice shelves at 1.5°C, 2°C, and 4°C of future warming. Geophys. Res. Lett. 48 (8), e2020GL091733. doi:10.1029/2020GL091733
Glasser, N. F., Kulessa, B., Luckman, A., Jansen, D., King, E. C., Sammonds, P. R., et al. (2009). Surface structure and stability of the Larsen C Ice Shelf, Antarctic Peninsula. J. Glaciol. 55 (191), 400–410. doi:10.3189/002214309788816597
Gorelick, N., Hancher, M., Dixon, M., Ilyushchenko, S., Thau, D., and Moore, R. (2017). Google Earth Engine: planetary-scale geospatial analysis for everyone. Remote Sens. Environ. 202, 18–27. doi:10.1016/j.rse.2017.06.031
Halberstadt, A. R. W., Gleason, C. J., Moussavi, M. S., Pope, A., Trusel, L. D., and DeConto, R. M. (2020). Antarctic supraglacial lake identification using Landsat-8 image classification. Remote Sens. 12 (8), 1327. doi:10.3390/rs12081327
Hambrey, M. J., Davies, B. J., Glasser, N. F., Holt, T. O., Smellie, J. L., and Carrivick, J. L. (2015). Structure and sedimentology of George VI Ice Shelf, Antarctic Peninsula: implications for ice-sheet dynamics and landform development. J. Geol. Soc. 172 (5), 599–613. doi:10.1144/jgs2014-134
Holt, T., and Glasser, N. F. (2022). Changes in area, flow speed and structure of southwest Antarctic Peninsula ice shelves in the 21st century. J. Glaciol., 1–19. doi:10.1017/jog.2022.7
Holt, T. O., Glasser, N. F., Quincey, D. J., and Siegfried, M. R. (2013). Speedup and fracturing of George VI Ice Shelf, Antarctic Peninsula. Cryosphere 7 (3), 797–816. doi:10.5194/tc-7-797-20137-797-2013
Hu, J., Zhang, T., Zhou, X., Jiang, L., Yi, G., Wen, B., et al. (2022). Extracting time-series of wet-snow facies in Greenland using Sentinel-1 SAR data on Google Earth Engine. IEEE J. Sel. Top. Appl. Earth Observations Remote Sens. 15, 6190–6196. doi:10.1109/JSTARS.2022.3192409
Jakobs, C. L., Reijmer, C. H., van den Broeke, M. R., van de Berg, W. J., and van Wessem, J. M. (2021). Spatial variability of the snowmelt-albedo feedback in Antarctica. J. Geophys. Res. Earth Surf. 126 (2), e2020JF005696. doi:10.1029/2020JF005696
Jenkins, A., and Jacobs, S. (2008). Circulation and melting beneath George VI Ice Shelf, Antarctica. J. Geophys. Res. Oceans 113 (C4). doi:10.1029/2007JC004449
Johansson, A. M., and Brown, I. A. (2012). Observations of supra-glacial lakes in west Greenland using winter wide swath Synthetic Aperture Radar. Remote Sens. Lett. 3 (6), 531–539. doi:10.1080/01431161.2011.637527
Johnson, A., Fahnestock, M., and Hock, R. (2020). Evaluation of passive microwave melt detection methods on Antarctic Peninsula ice shelves using time series of Sentinel-1 SAR. Remote Sens. Environ. 250, 112044. doi:10.1016/j.rse.2020.112044
Kingslake, J., Ely, J. C., Das, I., and Bell, R. E. (2017). Widespread movement of meltwater onto and across Antarctic ice shelves. Nature 544 (7650), 349–352. doi:10.1038/nature22049
Kuipers Munneke, P., Luckman, A. J., Bevan, S. L., Smeets, C. J. P. P., Gilbert, E., van den Broeke, M. R., et al. (2018). Intense winter surface melt on an Antarctic ice shelf. Geophys. Res. Lett. 45 (15), 7615–7623. doi:10.1029/2018GL077899
LaBarbera, C. H., and MacAyeal, D. R. (2011). Traveling supraglacial lakes on George VI Ice Shelf, Antarctica. Geophys. Res. Lett. 38 (24). doi:10.1029/2011GL049970
Laffin, M. K., Zender, C. S., Singh, S., van Wessem, J. M., Smeets, C. J. P. P., and Reijmer, C. H. (2021). Climatology and evolution of the Antarctic Peninsula föhn wind-induced melt regime from 1979–2018. J. Geophys. Res. Atmos. 126 (4), e2020JD033682. doi:10.1029/2020JD033682
Lai, C. Y., Kingslake, J., Wearing, M. G., Chen, P. H. C., Gentine, P., Li, H., et al. (2020). Vulnerability of Antarctica’s ice shelves to meltwater-driven fracture. Nature 584 (7822), 574–578. doi:10.1038/s41586-020-2627-8
Lampkin, D. J., Koenig, L., Joseph, C., and Box, J. E. (2020). Investigating controls on the formation and distribution of wintertime storage of water in supraglacial lakes. Front. Earth Sci. 8. doi:10.3389/feart.2020.00370
Langley, E. S., Leeson, A. A., Stokes, C. R., and Jamieson, S. S. R. (2016). Seasonal evolution of supraglacial lakes on an East Antarctic outlet glacier. Geophys. Res. Lett. 43 (16), 8563–8571. doi:10.1002/2016GL069511
Law, R., Arnold, N., Benedek, C., Tedesco, M., Banwell, A., and Willis, I. (2020). Over-winter persistence of supraglacial lakes on the Greenland Ice Sheet: results and insights from a new model. J. Glaciol. 66 (257), 362–372. doi:10.1017/jog.2020.7
Leeson, A. A., Forster, E., Rice, A., Gourmelen, N., and van Wessem, J. M. (2020). Evolution of supraglacial lakes on the Larsen B Ice Shelf in the decades before it collapsed. Geophys. Res. Lett. 47 (4), e2019GL085591. doi:10.1029/2019GL085591
Li, W., Lhermitte, S., and López-Dekker, P. (2021). The potential of synthetic aperture radar interferometry for assessing meltwater lake dynamics on Antarctic ice shelves. Cryosphere 15 (12), 5309–5322. doi:10.5194/tc-15-5309-2021
Liang, D., Guo, H., Zhang, L., Cheng, Y., Zhu, Q., and Liu, X. (2021). Time-series snowmelt detection over the antarctic using Sentinel-1 SAR images on Google Earth Engine. Remote Sens. Environ. 256, 112318. doi:10.1016/j.rse.2021.112318
Liang, L., Li, X., and Zheng, F. (2019). Spatio-temporal analysis of ice sheet snowmelt in Antarctica and Greenland using microwave radiometer data. Remote Sens. 11 (16), 1838. doi:10.3390/rs11161838
Lucchitta, B. K., and Rosanova, C. E. (1998). Retreat of northern margins of George VI and Wilkins ice shelves, Antarctic Peninsula. Ann. Glaciol. 27, 41–46. doi:10.3189/1998AoG27-1-41-46
Luckman, A., Elvidge, A., Jansen, D., Kulessa, B., Munneke, P. K., King, J., et al. (2014). Surface melt and ponding on Larsen C Ice Shelf and the impact of föhn winds. Antarct. Sci. 26 (6), 625–635. doi:10.1017/S0954102014000339
Maclennan, M. L., Lenaerts, J. T., Shields, C. A., Hoffman, A. O., Wever, N., Thompson-Munson, M., et al. (2023). Climatology and surface impacts of atmospheric rivers on West Antarctica. Cryosphere 17 (2), 865–881. doi:10.5194/tc-17-865-2023
Maier, N., Andersen, J. K., Mouginot, J., Gimbert, F., and Gagliardini, O. (2023). Wintertime supraglacial lake drainage cascade triggers large-scale ice flow response in Greenland. Geophys. Res. Lett. 50 (4), e2022GL102251. doi:10.1029/2022gl102251
Mair, D., Nienow, P., Sharp, M., Wohlleben, T., and Willis, I. (2002). Influence of subglacial drainage system evolution on glacier surface motion: Haut Glacier d’Arolla, Switzerland. J. Geophys. Res. Solid Earth 107 (B8), EPM 8 1–13. doi:10.1029/2001JB000514
Mellor, M. (1960). Antarctic ice terminology: ice dolines. Polar Rec. 10 (64), 92. doi:10.1017/S0032247400050786
Miles, K. E., Willis, I. C., Benedek, C. L., Williamson, A. G., and Tedesco, M. (2017). Toward monitoring surface and subsurface lakes on the Greenland Ice Sheet using Sentinel-1 SAR and Landsat-8 OLI imagery. Front. Earth Sci. 5. doi:10.3389/feart.2017.00058
Mohajerani, Y., Jeong, S., Scheuchl, B., Velicogna, I., Rignot, E., and Milillo, P. (2021). Automatic delineation of glacier grounding lines in differential interferometric synthetic-aperture radar data using deep learning. Dryad 11, 4992. [Dataset]. doi:10.1038/s41598-021-84309-3
Morlighem, M., Rignot, E., Binder, T., Blankenship, D., Drews, R., Eagles, G., et al. (2020). Deep glacial troughs and stabilizing ridges unveiled beneath the margins of the Antarctic Ice Sheet. Nat. Geosci. 13 (2), 132–137. doi:10.1038/s41561-019-0510-8
Morris, E. M., and Vaughan, D. G. (2003). Spatial and temporal variation of surface temperature on the Antarctic Peninsula and the limit of viability of ice shelves. in: Antarctic Peninsula climate variability: historical and paleoenvironmental perspectives. Washington, DC: American Geophysical Union, 61–68. p. doi:10.1029/AR079p0061
Mottram, R., Hansen, N., Kittel, C., van Wessem, J. M., Agosta, C., Amory, C., et al. (2021). What is the surface mass balance of Antarctica? An intercomparison of regional climate model estimates. Cryosphere 15 (8), 3751–3784. doi:10.5194/tc-15-3751-2021
Mouginot, J., Scheuchl, B., and Rignot, E. (2017). MEaSUREs Aantarctic boundaries for IPY 2007-2009 from satellite radar, version 2. Boulder, Colorado, USA: NASA National Snow and Ice Data Center Distributed Active Archive Center. [Data Set]. doi:10.5067/AXE4121732AD
Moussavi, M., Pope, A., Halberstadt, A. R. W., Trusel, L. D., Cioffi, L., and Abdalati, W. (2020). Antarctic supraglacial lake detection using Landsat 8 and Sentinel-2 imagery: towards continental generation of lake volumes. Remote Sens. 12 (1), 134. doi:10.3390/rs12010134
Otosaka, I. N., Shepherd, A., Ivins, E. R., Schlegel, N. J., Amory, C., van den Broeke, M. R., et al. (2023). Mass balance of the Greenland and Antarctic ice sheets from 1992 to 2020. Earth Syst. Sci. Data 15, 1597–1616. doi:10.5194/essd-15-1597-2023
Pearson, M. R., and Rose, I. H. (1983). The dynamics of George VI Ice Shelf. Br. Antarct. Surv. Bull. 52, 205–220.
Poinar, K., Dow, C. F., and Andrews, L. C. (2019). Long-term support of an active subglacial hydrologic system in Southeast Greenland by firn aquifers. Geophys. Res. Lett. 46 (9), 4772–4781. doi:10.1029/2019gl082786
Ranganathan, M., Barotta, J. W., Meyer, C. R., and Minchew, B. (2023). Meltwater generation in ice stream shear margins: case study in Antarctic ice streams. Proc. R. Soc. A 479 (2273), 20220473. doi:10.1098/rspa.2022.0473
Reynolds, J. M. (1981). Lakes on George VI Ice Shelf, Antarctica. Polar Rec. 20 (128), 425–432. doi:10.1017/S0032247400003636
Reynolds, J. M., and Hambrey, M. J. (1988). The structural glaciology of George VI Ice Shelf. Antarct. Penins. 79, 79–95.
Rignot, E., Casassa, G., Gogineni, P., Krabill, W., Rivera, A., and Thomas, R. (2004). Accelerated ice discharge from the Antarctic Peninsula following the collapse of Larsen B Ice Shelf. Geophys. Res. Lett. 31 (18). doi:10.1029/2004GL020697
Rignot, E., Jacobs, S., Mouginot, J., and Scheuchl, B. (2013). Ice-shelf melting around Antarctica. Science 341 (6143), 266–270. doi:10.1126/science.1235798
Rignot, E., Mouginot, J., and Scheuchl, B. (2016). MEaSUREs Antarctic grounding line from differential satellite radar interferometry, Version 2. Boulder, CO, USA: NASA National Snow and Ice Data Center Distributed Active Archive Center. doi:10.5067/IKBWW4RYHF1Q
Rippin, D. M., Willis, I. C., Arnold, N. S., Hodson, A. J., and Brinkhaus, M. (2005). Spatial and temporal variations in surface velocity and basal drag across the tongue of the polythermal glacier midre Lovénbreen, Svalbard. J. Glaciol. 51 (175), 588–600. doi:10.3189/172756505781829089
Rott, H., Wuite, J., De Rydt, J., Gudmundsson, G. H., Floricioiu, D., and Rack, W. (2020). Impact of marine processes on flow dynamics of northern Antarctic Peninsula outlet glaciers. Nat. Commun. 11 (1), 2969. doi:10.1038/s41467-020-16658-y
Scambos, T., Hulbe, C., and Fahnestock, M. (2003). Climate-induced ice shelf disintegration in the Antarctic Peninsula. in: Antarctic Peninsula climate variability: historical and paleoenvironmental perspectives. Washington, DC: American Geophysical Union, 79–92. doi:10.1029/AR079p0079
Scambos, T., Miller, J., Culberg, R., Shuman, C., Montgomery, L., Miège, C., et al. (2022). Antarctic ice shelf aquifers: characteristics and potential contributions to ice shelf loss. Vienna, Austria: EGU General Assembly, EGU22–820. doi:10.5194/egusphere-egu22-820
Scambos, T. A., Hulbe, C., Fahnestock, M., and Bohlander, J. (2000). The link between climate warming and break-up of ice shelves in the Antarctic Peninsula. J. Glaciol. 46 (154), 516–530. doi:10.3189/172756500781833043
Schannwell, C., Cornford, S., Pollard, D., and Barrand, N. E. (2018). Dynamic response of Antarctic Peninsula Ice Sheet to potential collapse of Larsen C and George VI Ice Shelves. Cryosphere 12 (7), 2307–2326. doi:10.5194/tc-12-2307-2018
Schellenberger, T., van Wychen, W., Copland, L., Kääb, A., and Gray, L. (2016). An inter-comparison of techniques for determining velocities of maritime Arctic glaciers, Svalbard, using radarsat-2 wide fine mode data. Remote Sens. 8 (9), 785. doi:10.3390/rs8090785
Schoof, C. (2010). Ice-sheet acceleration driven by melt supply variability. Nature 468 (7325), 803–806. doi:10.1038/nature09618
Schröder, L., Neckel, N., Zindler, R., and Humbert, A. (2020). Perennial supraglacial lakes in Northeast Greenland observed by polarimetric SAR. Remote Sens. 12 (17), 2798. doi:10.3390/rs12172798
Shu, Q., Killick, R., Leeson, A., Nemeth, C., Fettweis, X., Hogg, A., et al. (2023). Characterising the ice sheet surface in Northeast Greenland using Sentinel-1 SAR data. J. Glaciol. 69 (278), 1834–1845. doi:10.1017/jog.2023.64
Siegert, M., Atkinson, A., Banwell, A., Brandon, M., Convey, P., Davies, B., et al. (2019). The Antarctic Peninsula under a 1.5◦C global warming scenario. Front. Environ. Sci. 7, 102. doi:10.3389/fenvs.2019.00102
Smith, B., Fricker, H. A., Gardner, A. S., Medley, B., Nilsson, J., Paolo, F. S., et al. (2020). Pervasive ice sheet mass loss reflects competing ocean and atmosphere processes. Science 368 (6496), 1239–1242. doi:10.1126/science.aaz5845
Smith, J. A., Bentley, M. J., Hodgson, D. A., and Cook, A. J. (2007). George VI Ice Shelf: past history, present behaviour and potential mechanisms for future collapse. Antarct. Sci. 19 (1), 131–142. doi:10.1017/S0954102007000193
Spergel, J. J., Kingslake, J., Creyts, T., van Wessem, M., and Fricker, H. A. (2021). Surface meltwater drainage and ponding on Amery Ice Shelf, East Antarctica, 1973–2019. J. Glaciol. 67 (266), 985–998. doi:10.1017/jog.2021.46
Stephenson, A., and Fleming, W. L. S. (1940). King George the Sixth Sound. Geogr. J. 96 (3), 153–164. doi:10.2307/1788550
Stokes, C. R., Sanderson, J. E., Miles, B. W. J., Jamieson, S. S. R., and Leeson, A. A. (2019). Widespread distribution of supraglacial lakes around the margin of the East Antarctic Ice Sheet. Sci. Rep. 9 (1), 13823. doi:10.1038/s41598-019-50343-5
Suhn, H. G., Jezek, K., Baumgartner, F., Forster, R., and Mosley-Thompson, E. (1999). Radar backscatter measurements from RADARSAT SAR imagery of South Pole Station, Antarctica. in: IEEE 1999 International Geoscience and Remote Sensing Symposium. IGARSS’99 (Cat. No.99CH36293) 5; 1999 June 28–July 02; Hamburg, Germany: IEEE. p. 2360–2362. doi:10.1109/IGARSS.1999.771509
Sundal, A. V., Shepherd, A., Nienow, P., Hanna, E., Palmer, S., and Huybrechts, P. (2011). Melt-induced speed-up of Greenland Ice Sheet offset by efficient subglacial drainage. Nature 469 (7331), 521–524. doi:10.1038/nature09740
Tedesco, M., Willis, I. C., Hoffman, M. J., Banwell, A. F., Alexander, P., and Arnold, N. S. (2013). Ice dynamic response to two modes of surface lake drainage on the Greenland Ice Sheet. Environ. Res. Lett. 8 (3), 034007. doi:10.1088/1748-9326/8/3/034007
Trusel, L. D., Frey, K. E., and Das, S. B. (2012). Antarctic surface melting dynamics: enhanced perspectives from radar scatterometer data. J. Geophys. Res. Earth Surf. 117 (F2). doi:10.1029/2011JF002126
Trusel, L. D., Frey, K. E., Das, S. B., Karnauskas, K. B., Kuipers Munneke, P., van Meijgaard, E., et al. (2015). Divergent trajectories of Antarctic surface melt under two twenty-first-century climate scenarios. Nat. Geosci. 8 (12), 927–932. doi:10.1038/ngeo2563
Trusel, L. D., Pan, Z., and Moussavi, M. (2022). Repeated tidally induced hydrofracture of a supraglacial lake at the Amery Ice Shelf grounding zone. Geophys. Res. Lett. 49 (7), e2021GL095661. doi:10.1029/2021GL095661
Tuckett, P. A., Ely, J. C., Sole, A. J., Lea, J. M., Livingstone, S. J., Jones, J. M., et al. (2021). Automated mapping of the seasonal evolution of surface meltwater and its links to climate on the Amery Ice Shelf, Antarctica. Cryosphere 15 (12), 5785–5804. doi:10.5194/tc-15-5785-2021
Tuckett, P. A., Ely, J. C., Sole, A. J., Livingstone, S. J., Davison, B. J., van Wessem, J. M., et al. (2019). Rapid accelerations of Antarctic Peninsula outlet glaciers driven by surface melt. Nat. Commun. 10 (1), 4311. doi:10.1038/s41467-019-12039-2
Turton, J. V., Kirchgaessner, A., Ross, A. N., King, J. C., and Kuipers Munneke, P. (2020). The influence of föhn winds on annual and seasonal surface melt on the Larsen C Ice Shelf, Antarctica. Cryosphere 14 (11), 4165–4180. doi:10.5194/tc-14-4165-2020
Ulaby, F. T., Moore, R. K., and Fung, A. K. (1986). Microwave remote sensing: active and passive. in: Microwave remote sensing fundamentals and radiometry, 1. Boston, Massachusetts: Addison Wesley.
van Wessem, J. M., van den Broeke, M. R., Wouters, B., and Lhermitte, S. (2023). Variable temperature thresholds of melt pond formation on Antarctic ice shelves. Nat. Clim. Change 13 (2), 161–166. doi:10.1038/s41558-022-01577-1
Wager, A. C. (1972). Flooding of the ice shelf in George VI Sound. Br. Antarct. Surv. Bull. 28, 71–74.
Wallis, B. J., Hogg, A. E. M., Melchior van Wessem, J., Davison, B. J., and van den Broeke, M. R. (2023). Widespread seasonal speed-up of west Antarctic Peninsula glaciers from 2014 to 2021. Nat. Geosci. 16, 231–237. doi:10.1038/s41561-023-01131-4
Warner, R. C., Fricker, H. A., Adusumilli, S., Arndt, P., Kingslake, J., and Spergel, J. J. (2021). Rapid Formation of an ice doline on Amery Ice Shelf, East Antarctica. Geophys. Res. Lett. 48 (14), e2020GL091095. doi:10.1029/2020GL091095
Wiesenekker, J. M., Kuipers Munneke, P., van den Broeke, M. R., and Smeets, C. J. P. P. (2018). A multidecadal analysis of föhn winds over Larsen C Ice Shelf from a combination of observations and modeling. Atmosphere 9 (5), 172. doi:10.3390/atmos9050172
Wuite, J., Rott, H., Hetzenecker, M., Floricioiu, D., De Rydt, J., Gudmundsson, G. H., et al. (2015). Evolution of surface velocities and ice discharge of Larsen B outlet glaciers from 1995 to 2013. Cryosphere 9 (3), 957–969. doi:10.5194/tc-9-957-2015
Zheng, L., Li, L., Chen, Z., He, Y., Mo, L., Chen, D., et al. (2023). Multi-sensor imaging of winter buried lakes in the Greenland Ice Sheet. Remote Sens. Environ. 295, 113688. doi:10.1016/j.rse.2023.113688
Zheng, L., Zhou, C., and Wang, K. (2020). Enhanced winter snowmelt in the Antarctic Peninsula: automatic snowmelt identification from radar scatterometer. Remote Sens. Environ. 246, 111835. doi:10.1016/j.rse.2020.111835
Zhu, D., Zhou, C., Zhu, Y., Wang, T., and Zhang, C. (2023). Monitoring of supraglacial lake distribution and full-year changes using multisource time-series satellite imagery. Remote Sens. 15 (24), 5726. doi:10.3390/rs15245726
Zhu, Q., Guo, H., Zhang, L., Liang, D., Wu, Z., de Roda Husman, S., et al. (2024). Automated surface melt detection over the Antarctic from Sentinel-1 imagery using deep learning. Int. J. Appl. Earth. Obs. Geoinf. 130, 103895. doi:10.1016/j.jag.2024.103895
Keywords: ice-shelf hydrology, glaciers, Antarctica, supraglacial lakes, synthetic aperture radar, meltwater
Citation: Deakin KA, Willis IC and Dell RL (2025) Winter meltwater storage on Antarctica’s George VI Ice Shelf and tributary glaciers, from synthetic aperture radar. Front. Earth Sci. 13:1545009. doi: 10.3389/feart.2025.1545009
Received: 13 December 2024; Accepted: 28 May 2025;
Published: 21 July 2025.
Edited by:
Mathias Bavay, WSL Institute for Snow and Avalanche Research SLF, SwitzerlandReviewed by:
Jan Kavan, Masaryk University, CzechiaHyangsun Han, Kangwon National University, Republic of Korea
Copyright © 2025 Deakin, Willis and Dell. This is an open-access article distributed under the terms of the Creative Commons Attribution License (CC BY). The use, distribution or reproduction in other forums is permitted, provided the original author(s) and the copyright owner(s) are credited and that the original publication in this journal is cited, in accordance with accepted academic practice. No use, distribution or reproduction is permitted which does not comply with these terms.
*Correspondence: Katherine A. Deakin, a2F0aGVyaW5lLmEuZGVha2luQGR1cmhhbS5hYy51aw==; Ian C. Willis, aXcxMDJAY2FtLmFjLnVr
‡Present address:Katherine A. Deakin, Department of Geography, Durham University, Durham, United Kingdom
†ORCID: Katherine A. Deakin, orcid.org/0009-0001-0881-6384; Ian C. Willis, orcid.org/0000-0002-0750-7088; Rebecca L. Dell, orcid.org/0000-0001-6617-3906