 Peng Zhang
 Bo-Chao Wang2*
- 1School of Management, Harbin University of Commerce, Harbin, China
- 2Harbin Center for Integrated Natural Resources Survey, Geological Survey of China, Harbin, China
This study investigates Xunke agates from Ating River alluvial gravels (Northeast, NE China) using optical microscopy, electron probe microanalyzer mapping (EPMA), and laser ablation–inductively coupled plasma–mass spectrometry (LA–ICP–MS) to constrain the formation mechanisms of basalt-hosted agate deposits. Xunke’s secondary gravel agates are genetically associated with Early Cretaceous Ganhe (GH) Formation basalts in Mesozoic fault-depression basins. The basalt serves as the primary ore-forming fluid reservoir. Two distinct structural sequences are found. Type I (colloform–cryptocrystalline–fibrous–crystalline quartz) reflects rapid cooling-induced fluid mixing, evidenced by the co-enrichment of Na-K-U-Ge in crystalline layers (U up to 1.541 ppm) indicative of a sustained low-temperature acidic condition in the ore-forming fluid. Type II (micro-granular–fibrous–crystalline quartz(–fibrous)–cryptocrystalline–crystalline quartz) forms at a higher temperature, marked by micro-granular texture chalcedony initial layers. There is a depletion of Al-K-Na in the spherulitic layers and Ge depletion (0.24 ppm) in Type II’s nucleation layers. Si and Ti-Ga-Ge substitution coupled with Ce and Eu negative anomalies fingerprint hybrid fluids mixing magmatic (basalt-derived) and meteoric components. Outer-to-inner Hf depletion (0.24→0.07 ppm) tracks fluid evolution toward lower H2O content and higher acidity. Band redness correlates with Fe concentration gradients (4,635→1.202 ppm), controlled by oxidation state fluctuations.
1 Introduction
The study of agate has a long-standing history; however, many aspects of its formation and geochemical characteristics remain elusive. The terminology “agate” has been used since 350 BC, and research into its chemical composition, properties, and genesis dates back to the 19th century (Götze et al., 2020b). While agate deposits worldwide are genetically affiliated with three principal volcanic lithologies (rhyolite, andesite, and basalt), discriminative criteria for their metallogenic mechanisms lack systematic constraints (Dumanska-Slowik et al., 2013; Fallick et al., 1985; Gliozzo et al., 2019; Götze et al., 2020b; Götze et al., 2024; Götze et al., 2016; Götze et al., 2001a; Götze et al., 2001b; Heaney, 1993; Moxon et al., 2013; Pabian and Zarins, 1994; Powolny et al., 2019; Zhang et al., 2020). Previous research on agates has focused on various aspects such as banding, formation environments, and age determination (Gliozzo et al., 2019; Götze et al., 2024; Götze et al., 2016; Heaney and Davis, 1995; Merino et al., 1995); however, studies on the geochemical composition and origin of alluvial agate gravels related to volcanic formation environments are limited (Gliozzo et al., 2019; Götze et al., 2020b; Götze et al., 2024; Götze et al., 2001a). Although some research has explored the relationship between SiO2 crystallinity, water content, and major trace element changes in fully crystallized agate in magmatic fluids (Lee, 2007; Mrozik et al., 2023; Stoch et al., 1985), the understanding of trace element distribution characteristics in different textures of agate remain insufficient.
While agate mineralization in volcanic settings has been extensively documented globally, critical knowledge gaps persist regarding basalt-hosted systems—particularly in resolving fluid source signatures, texture-dependent trace element partitioning, and modeling of the formation process. The Xunke agate deposits (Northeast, NE China) represent one of the largest basalt-related gemstone reserves in China and provide an exceptional natural laboratory to address these challenges. Building upon limited prior geochemical research (Lu et al., 2020; Shen et al., 2022), this study employs an integrated microtextural–geochemical approach combining high-resolution electron probe microanalyzer mapping (EPMA) mapping and laser ablation–inductively coupled plasma–mass spectrometry (LA–ICP–MS) microstratigraphy to decode ore-forming fluid evolution. Crucially, the first process–response model that directly links the elemental and physicochemical evolution of ore-forming fluids to oscillatory crystallization mechanisms is established. These advances not only redefine genetic criteria for basalt-associated agate formation but also provide a transferable framework for interpreting trace element stratigraphy in banded siliceous deposits globally.
2 Geological background
2.1 Regional geology
The agate associated with basalt in NE China is predominantly found in the Greater and Lesser Hinggan Range (Lu et al., 2020; Ma et al., 2023; Shen et al., 2022) along the Heilongjiang River, located in the south of the suture zone in the junction of the North China Craton and the Siberia Craton, and the north part of the Solonker–Xilinhot–Hegenshan fault system (Figure 1A) (Zhang et al., 2010). The suture zone between the northern margin of the North China Craton and the Mongolian plate (Li et al., 2018; Zhang et al., 2010). The Mid-Ordovician to Early Silurianfophiolite suites are related to the closure of the paleo-Asian and Mongolia–Okhotsk Oceans, indicating multiple stages of oceanic subduction and continent–arc collisions (Xiao et al., 2003; Li et al., 2018; Zhang et al., 2010). The amalgamation of the Hinggan and Songnen–Zhangguangcai Range massifs occurred in the Early Cretaceous (Li et al., 2014; Wu et al., 2015; Li et al., 2018; Zhang et al., 2010). The Hinggan Massif was an extensional setting with various intrusive rocks, facilitated by the combined tectonic influence of the Mongol–Okhotsk regime and the subduction of the Paleo–Pacific Plate (Li et al., 2018; Zhang et al., 2010). Since the Middle Jurassic, the oblique subduction of the Izanagi–Pacific Plate beneath the eastern margin of the Chinese continent has resulted in the formation of Mesozoic magmatic belts trending in a north–northeastern direction, the development of north–northeastern strike-slip faults, and the evolution of a basin-and-range tectonic pattern (Li et al., 2018; Zhang et al., 2010).
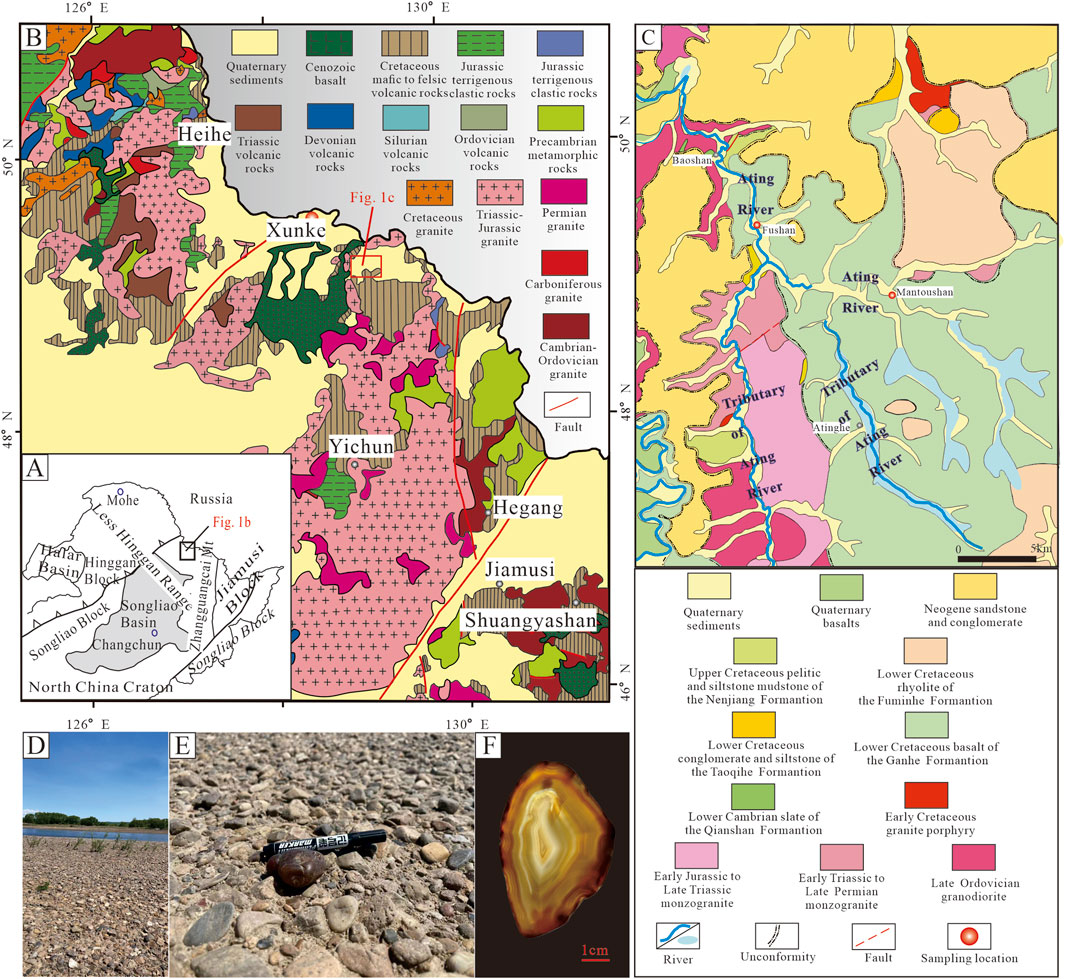
Figure 1. (A) Simplified tectonic map of NE China (Fan et al., 2003; Zhang et al., 2010). (B) Regional Geological Map of the Northern Foothills of the Lesser Hinggan Mountains (Ma et al., 2002; Han, 2013; Zhang et al., 2010). (C) Geological map of Xunke district (H.G.I.G.E.R., 2009). (D) Outcrop photographs of the bank of the Ating River; (E) Alluvial gravel deposited by the Ating River, which exhibits no banded structure on the surface; (F) Typical banded structure revealed within the sliced section of the sample in (E).
The stratigraphic sequence in this region encompasses four tectonostratigraphic units, as illustrated in Figure 1B. Precambrian metamorphic basement rocks, submarine sedimentary rocks from the Cambrian and Permian periods, terrigenous clastic and volcanic rocks spanning from the Jurassic to Cretaceous periods, and Cenozoic coarse clastic and continental basaltic rocks (Han, 1995; Li et al., 2018; Yin and Ran, 1997).
Precambrian metamorphic rocks, which are comparatively scarce, overlaid by Cambrian strata that contain dolomitic marble, phyllite, and carbonaceous slate (Ma et al., 2023; Zhang et al., 2010). The Early Jurassic terrigenous clastic rocks discordantly overlie the Permian strata, consisting of conglomerate to siltstone intercalated with coal seams (Ma et al., 2023; Zhang et al., 2010). Throughout the entire belt, Early Cretaceous volcanic rocks are widely distributed and encompass a variety of lava flows, including basaltic, trachyandesitic, and rhyolitic (Ma et al., 2023; Zhang et al., 2010). Sandstone and conglomerate of the Oligocene to Pliocene are also extensively distributed, covering the Pre-Cenozoic strata (Ma et al., 2023; Zhang et al., 2010).
The volcanic sequences of the Early Cretaceous period can be divided according to their lithological correlations and interrelationships, including the Fuminhe (FM), Taoqihe (TQ), and Ganhe (GH) Formations (Li et al., 2018; Zhang et al., 2010; Yang et al., 2022). The FM Formation is predominantly composed of rhyolitic and dacitic lava flows, as well as tuff and perlite (Li et al., 2018; Yang et al., 2022; Zhang et al., 2010). The TQ Formation, consisting of conglomerate, sandstone, and siltstone, overlays the FM Formation (Li et al., 2018; Yang et al., 2022; Zhang et al., 2010). At the bottom of the sequence, the GH Formation is mainly composed of porous and almond-structured basalt, along with dense, massive basaltic rocks (Li et al., 2018; Yang et al., 2022; Zhang et al., 2010).
These complex regional geological processes set the stage for the formation and distribution of agate deposits in the area. The multiple tectonic movements, such as oceanic subduction and continent–arc collisions, led to the formation of diverse volcanic rocks and created a series of cavities within the GH formation basalt. These cavities served as channels for fluid migration and provided spaces for agate mineral precipitation. Moreover, the basaltic rocks in the GH Formation, played a crucial role as potential sources of the elements necessary for agate formation.
2.2 Deposit geology
Renowned as China’s most prominent agate deposit, Xunke agates are distinguished by their occurrence as the alluvial gravels deposited along the Ating River (Shen et al., 2022). The Baoshan region located in the southeast of Xunke is predominantly underpinned by GH basalt, FM rhyolite, and monzogranite spanning from the Early Jurassic to the Late Triassic, the majority of which have been overlain by quaternary sediments (Figure 1C) (Li et al., 2018; Yang et al., 2022; Zhang et al., 2010). SHRIMP U-Pb zircon dating of the FM rhyolite is 108.1 ± 2.4 Ma (Zhang et al., 2010), while 40Ar/39Ar dating of the GH basalt is 110–120 Ma (Yang et al., 2022), indicating a Lower Cretaceous origin that can be further subdivided into distinctive geochemical units.
The typical geological occurrences of Xunke agate can be divided into two categories. One is the primary agate deposit occurring in the form of amygdales in the basic volcanic rocks of the GH Formation (Lu et al., 2020; Shen et al., 2022). The other is the secondary alluvial placer-deposit agate formed by the weathering, leaching, and river transportation of primary agate (Lu et al., 2020; Shen et al., 2022). Both types are spatially controlled by the widely developed Mesozoic fault-depression basins of the GH Formation volcanic rocks (Figure 1C). The two peneplanation events during the Mesozoic and Pleistocene epochs provided a favorable paleo–natural–geographical environment for the formation of secondary agate placer deposits (Lu et al., 2020; Shen et al., 2022). Currently, all agate ore occurrences in the Baoshan area of Xunke County, Heihe City, are of the secondary alluvial placer deposit (Lu et al., 2020; Shen et al., 2022). Samples in this study were gathered southeast of Xunke, Baoshan region, in proximity to the contact zone with the Lower Cretaceous basalt of the GH Formation (Figures 1C–F).
3 Analytical methods
In this study, agate samples were collected from the riverbed and gravel layer along the bank of the Ating River, specifically in the Baoshan region of Xunke. A total of five samples were collected. The agate samples exhibit a preferential color range from a light yellow to a dark brownish red. BH3 (Figure 2A) and BH2 (Figure 2B) show a complete and symmetrical structural sequance. The samples were divided into two groups for research. One group is Type I (BH3, 4; Figures 2A,C), in which no apparent crystalline quartz grains can be identified in the cores of these agate samples using the naked eye. The other group is Type II (BH2, 6, 5; Figures 2B,D,E), in which crystalline quartz grains in the cores of these samples are visible to the naked eye. These characteristics render them representative of the agate population in this area and suitable for studying their geochemical properties.
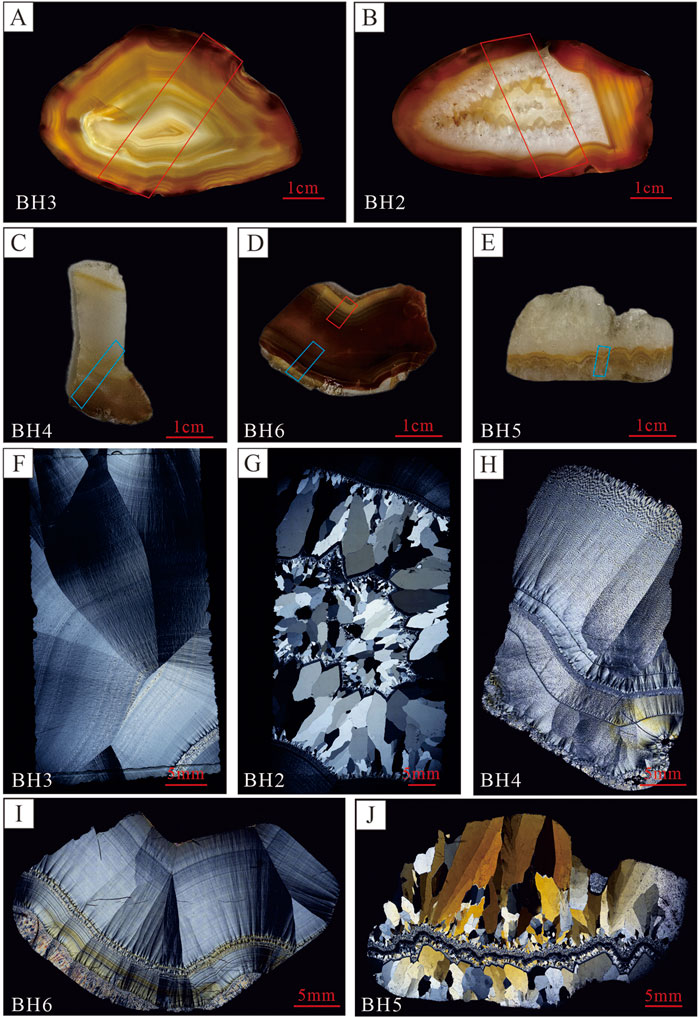
Figure 2. Xunke agate samples and the thin section under polarized light microscopy. These layers vary in color, ranging from white to pale brown. (A, F) Sample BH3 displays a distinct pattern of rhythmic layers from micro-granular to fibrous texture chalcedony layers and prismatic quartz crystals in the core; (B, G) Sample BH2 displays a distinct pattern of rhythmic chalcedony layers forming a micro-granular texture, cryptocrystalline texture to prismatic quartz crystals; (C, H) Sample BH4 displays a distinct pattern of rhythmic chalcedony layers, characterized by alternating zones of white color and translucency. (D, I) Sample BH6 displays a distinct pattern of rhythmic layers forming a micro-granular fibrous texture, cryptocrystalline texture to prismatic quartz crystals; (E, J) Sample BH5 exhibits a distinct pattern, consisting of colloform, cryptocrystalline and micro-granular layers that are found within coarse prismatic quartz crystals. The area in red rectangles indicates where the LA–ICP–MS analysis was performed. The area in the blue rectangle indicates where both the LA–ICP–MS analysis and EPMA mapping were performed.
3.1 Optical microscopy
For the optical microscopy analysis, thin sections (with a thickness of 0.03 mm) of the five specimens were examined. The thin sections of the specimens were examined under a Nikon LV100 polarized-light microscope (Nikon, Tokyo, Japan) utilizing polarized light microscopy. A ×10 objective lens was used in conjunction with the Sony IMX264LQR camera. Magnifications ranging from ×50 to ×500 under transmitted and reflected light modes were employed to analyze the sample comprehensively. The results of the optical microscopy analysis are presented through detailed descriptions of the microstructural features observed under different magnifications. In addition, photomicrographs are included in the manuscript to illustrate the observed features.
3.2 Electron probe microanalysis mapping
The EPMA element mapping of three agate samples (BH4, 5, 6), which feature easily recognizable and representative structures, collected from Xunke was conducted utilizing a JEOL JXA-iSP100 instrument. The analytical conditions were an acceleration voltage of 15 kV, a beam current of 50 nA, a pixel interval of 20.0 μm, and a dwell time of 50.00 ms. The analysis employed characteristic X-rays and analyzed crystals tailored for specific elements. Raw data were subsequently processed using the atomic number, absorption, and fluorescence (ZAF) correction method through proprietary Shimadzu software. The EPMA mapping results and element maps of the analyzed samples are presented, showing the distribution of nine major elements, including Si, Fe, Ti, Na, K, Mn, P, Al, and Ca, within the agate samples.
3.3 LA–ICP–MS trace element analysis
In the case of the LA–ICP–MS trace elements analysis, five agate samples (BH2, 3, 4, 5, 6) that feature continuous banded structural variations were analyzed on polished thick sections to acquire the geochemical characteristics of the agate. The LA–ICP–MS analysis of polished thick sections was performed at the In Situ Mineral Geochemistry Lab of ODEC, Hefei University of Technology, China. The analysis was conducted using an Agilent 7900 Quadrupole ICP-MS instrument coupled with a Photon Machines IRIDIA 193-nm ArF Excimer Laser Ablation system, with argon as the make-up gas mixed with the carrier gas via a T-connector before introduction into the ICP (Wang et al., 2017; Liu et al., 2008). In conducting each analysis, a consistent spot size diameter of 35 mm was employed at a frequency of 7 Hz, with an energy density of approximately 2.5 J/cm2 maintained for 40 s, preceded by a 20-s gas blank measurement (Liu et al., 2008; Liu et al., 2010). To establish the calibration curve, NIST SRM 610, 612, and BCR-2G were utilized as external benchmarks (Liu et al., 2008; Liu et al., 2010). The concentrations of elements for the USGS reference glasses were referenced from the GeoReM database (http://georem.mpch-mainz.gwdg.de). To ensure accuracy, standard reference materials were analyzed after every series of 10 unknowns (Liu et al., 2008). During each spot analysis, detection limits for each element were computed (Liu et al., 2008). Data processing was facilitated by the ICPMSDataCal program (Liu et al., 2008; Liu et al., 2010). The trace element compositions of agate samples were calibrated against multiple reference materials without the need for internal standardization, with the sum of all element concentrations being considered as 100% m/m (Liu et al., 2008; Liu et al., 2010). The results are presented to illustrate the relative abundances of trace elements across the various samples.
4 Results
4.1 Petrography
Xunke agates are usually found as alluvial gravels along the Ating River, with sizes up to several centimeters (Figure 2). They are mainly composed of silica phases with diverse textures, including colloform, micro-granular, fibrous, and cryptocrystalline chalcedony layers, along with crystalline quartz and minor Fe compounds (as illustrated in Figures 2, 3).
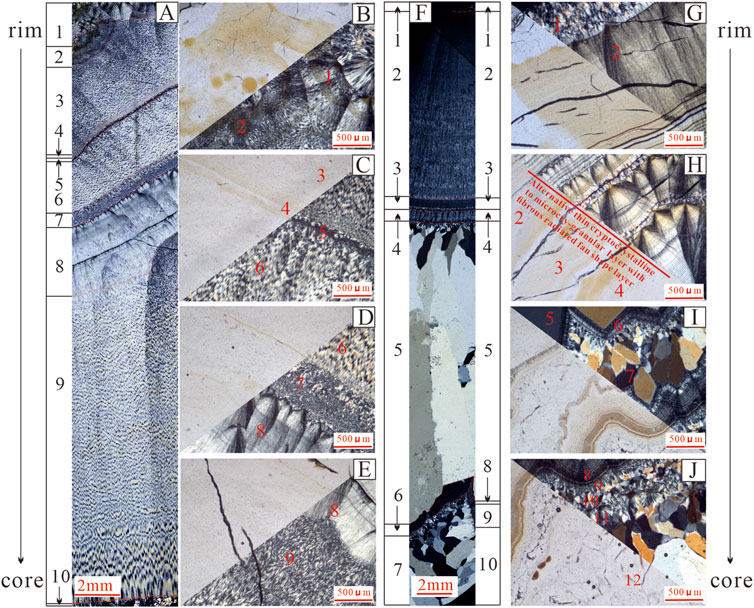
Figure 3. Microscopic characteristics of xunke alluvial agates. (A–E) Type I Structural Sequence; (B) Spherulitic structures displaying colloform texture (layer 1), followed by cryptocrystalline texture (layer 2); (C) Fibrous texture (layer 3) intertwined with spherulitic structures (layer 4) and cryptocrystalline features (layer 5); (D) Fibrous texture (layer 6), succeeded by micro-granular texture accompanied by cryptocrystalline characteristics (layer 7); (E) Fibrous texture (layer 8), followed by a transition layer from cryptocrystalline to fibrous texture (layer 9); (A) Microcrystalline prismatic quartz crystals (layer 10). (F–J) Type II Structural Sequence; (G) Initial layer characterized by micro-granular texture (layer 1), followed by a radiated fan-shape layer with fibrous texture (layer 2); (H) Alternating thin layers of micro-granular to cryptocrystalline texture with a fibrous radiated fan-shape layer exhibiting colloform texture (layer 3), and the radiated fan-shape layer contains alternating sublayers of cryptocrystalline texture (layer 4); (I) Crystalline prismatic quartz (layer 5), followed by cryptocrystalline texture (layer 6) and a crystalline layer (layer 7); (J) Fibrous texture layer (layer 8), succeeded by a cryptocrystalline texture layer (layer 9), a microcrystalline texture layer (layer 10), a fibrous radiated fan-shape layer (layer 11), and a prismatic quartz crystalline layer (layer 12). The upper left portion of photographs (B–E) and the lower left portion of photographs (G–J) are acquired under plane-polarized light (PPL), while the remaining portions are acquired under cross-polarized light (CPL).
Two distinct structural sequences, Type I (Figures 3A–E) and Type II (Figures 3F–J), are observed, characterized by alternating layers in colors from white to pale and dark brown. Concentric and rhythmic banding, due to composition and/or texture variations and accentuated by variable Fe contents, is a prominent feature, indicating a multi-faceted and prolonged formation process.
The initial layer of Type I agates has spherulites with a colloform texture originating from nucleation and growth along the wall of the vesicle in basalt (layer 1 in Figures 3A,B). Then, the primary zone is fibrous chalcedony layers (layers 2–9 in Figures 3C,D). In the central part, there is a transition from a fibrous texture layer to microcrystalline quartz (layer 10 in Figure 3A). The outermost layer is rich in spherulitic structures, followed by layers from cryptocrystalline to fibrous texture, and the final layer is microcrystalline prismatic quartz. Microscopically, different texture chalcedony layers are mainly length-fast with interspersed length-slow chalcedony layers.
The initial layer of Type II agates contains radiated structures with a micro-granular texture (layer 1 in Figure 3F,G). Then, the primary zone is fibrous texture chalcedony layers, and there is a shift from fibrous or cryptocrystalline texture chalcedony layers to granular quartz in the central part. The outermost layer is micro-granular texture chalcedony, followed by colloform to fibrous texture layers, and subsequent layers have micro-to macro-crystalline prismatic quartz interwoven with colloform and fibrous textures (layers 2–7 in Figures 3F–I). Certain layers have a sequence of crystalline quartz, cryptocrystalline texture chalcedony layer, and crystalline quartz again (layers 2–5 and 8–10 in Figures 3F–H,J). Microscopically, different texture chalcedony in different layers varies in grain size and morphology, mainly as length-slow chalcedony layers. At the core, there is a sharp transition from a fibrous or cryptocrystalline texture chalcedony layer to prismatic quartz with inclusions, with layering at the contact zone.
4.2 Element distribution in agate
EPMA mapping, in conjunction with optical microscopy, secondary electron detector (SED), and back-scattered electron detector (BED) analyses of samples BH4, BH5, and BH6, indicates a significant correlation exists between texture variations and compositional differences within these agates.
In the Type I agate sample BH4 (Figure 4A), the cryptocrystalline texture chalcedony layer and fan-shaped regions exhibit relatively lower contents of Al, Na, and K. The micro-granular textures with cryptocrystalline features have reduced Ca levels, while colloform with spherulites and cryptocrystalline textures display elevated Fe concentrations. In these samples, large fan-shaped and thin alternating layers demonstrate diverse trends in Al and K concentrations (Figure 4B). In the Type II agate sample BH5 (Figure 4C), the colloform fibrous layer is characterized by lower Al and K contents but higher Fe and Ca contents. Moreover, the elements are more uniformly distributed in fan-shaped and fibrous texture layers compared with alternating bands (e.g., in BH4 and BH6; Figures 4A,B). Generally, micro-granular and crystalline textures contain lower K, whereas Fe is relatively enriched in spherulitic, fan-radiated, or fibrous textures.
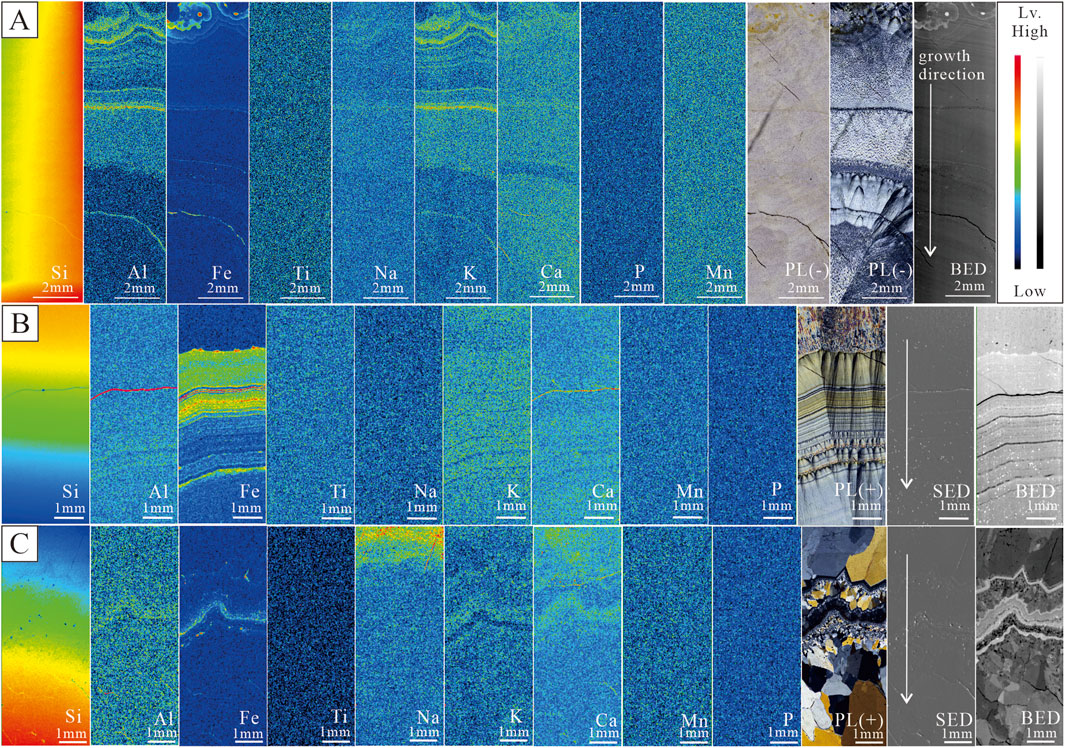
Figure 4. EPMA element distribution maps of agate showing the distribution characteristics of Xunke agate. PL means polarized light; SED means secondary electron detector image; BED means back-scattered electron detector image. (A) Sample BH4. (B) Sample BH6. (C) Sample BH5.
The elemental trends vary among samples from the outer to the inner layers along the growth direction. For instance, the behavior of Si differs in BH4, BH5, and BH6, with Ca, K, and Na typically showing contrasting trends (Figures 4A–C). Color zonation in agate bands correlates with Fe enrichment, where ochre bands exhibit elevated Fe coupled with depleted Al, K, and Ca (Figures 4A–C). While Mn shows no chromatic relevance, fracture-associated colloidal textures in BH4 and BH6 display localized Al and Fe enrichment (Figures 4A,B). Notably, Ti, Mn, and P concentrations remain texturally invariant.
4.3 Element composition in agate
LA–ICP–MS analysis was performed on 77 spots of chalcedony layers with various textures and crystalline quartz from the Xunke agate samples (Supplementary Table S1). These data revealed the typical agate composition, with minimal contents of trace elements (Merino et al., 1995; Mockel et al., 2009; Gliozzo et al., 2019; Götte et al., 2009; Götze et al., 2020b; Götze et al., 2016; Götze et al., 2001a; Götze et al., 2001b). Generally, measurable trace elements were present in agate from the Xunke area (Supplementary Table S1).
Fe was the primary trace element, ranging from 1.2 to 4,635 ppm (avg. 486 ppm). Notable trace elements included Al, Na, K, and Ca, with concentrations averaging 131 ppm (excluding BH6–3), 114 ppm, 118 ppm, and 116 ppm, respectively. Mg, P, and Zn were consistently detected, averaging 10.11 ppm, 28.06 ppm, and 15.08 ppm, respectively. Cr, Mn, Cu, Ge, Ba, Pb, and La typically exhibited average concentrations of less than 7.086 ppm, with other elements averaging less than 1 ppm. Strong geochemical coherence emerges among Al-K-Rb-Na, with pairwise correlations (Figures 5A–F, R2 = 0.623–0.782) demonstrating significant covariance (e.g., Al-Na: 0.748, Figure 5A; K-Na: 0.643, Figure 5B). The Rb-K system exhibits the strongest linear coupling (R2 = 0.782, Figure 5F).
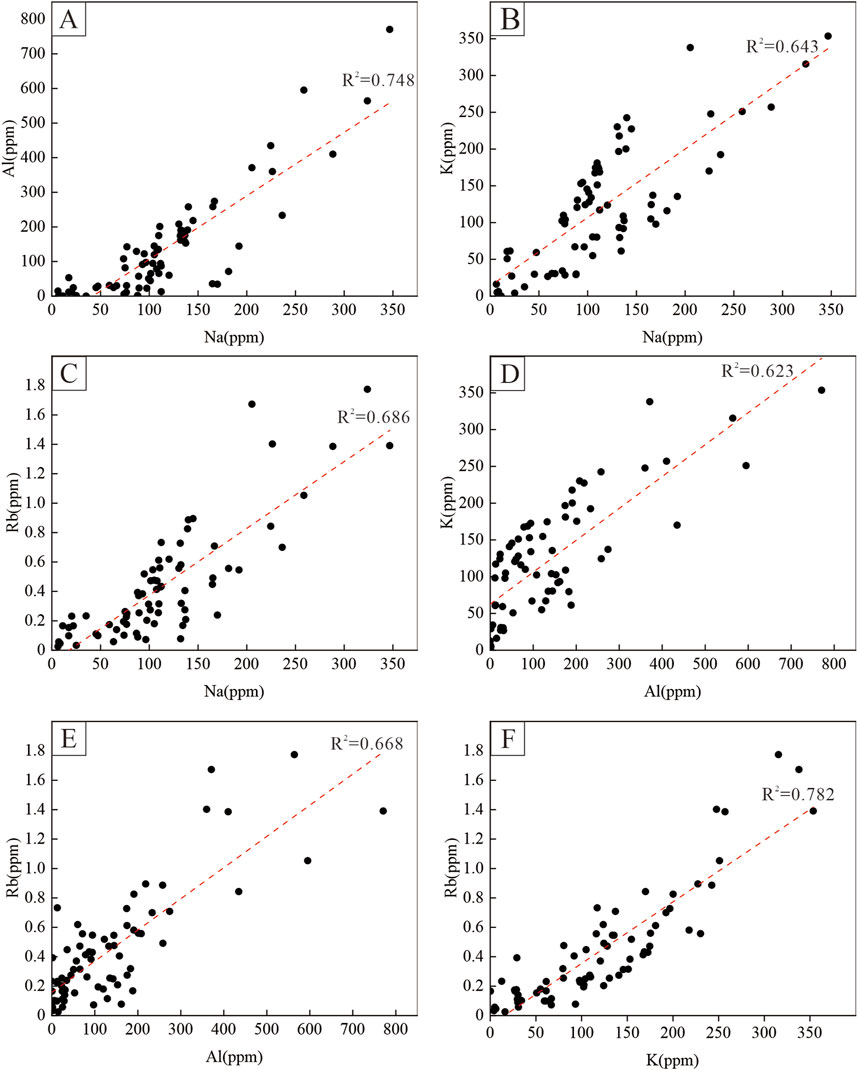
Figure 5. Binary plots showing the element correlations and their R2 calculations of agate samples. (A) Al (ppm) versus Na (ppm). (B) K (ppm) versus Na (ppm). (C) Rb (ppm) versus Na (ppm). (D) K (ppm) versus Al (ppm). (E) Rb (ppm) versus Al (ppm). (F) Rb (ppm) versus K (ppm).
The measured trace element profiles (Supplementary Table S1; Figures 6, 7) indicate that the agate bands with darker colors have the highest Fe content. Agate samples revealed regular trends in the growth direction of the agates. As Na, K, Al, Cu, U, Sr, and Hf showed higher concentrations in the initial layer compared with the inner layer.
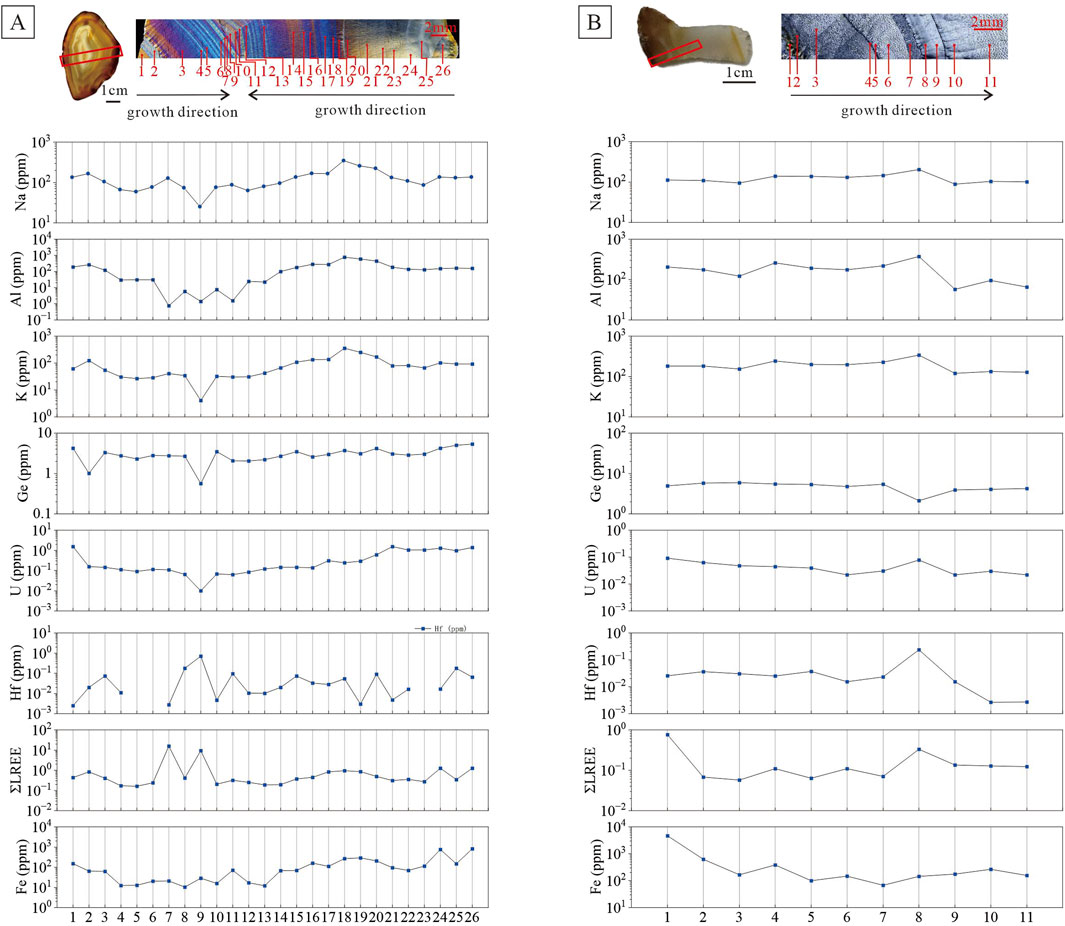
Figure 6. Spatial distribution of selected trace elements in Type I agates measured using LA–ICP–MS. (A) Sample BH3; (B) Sample BH4.
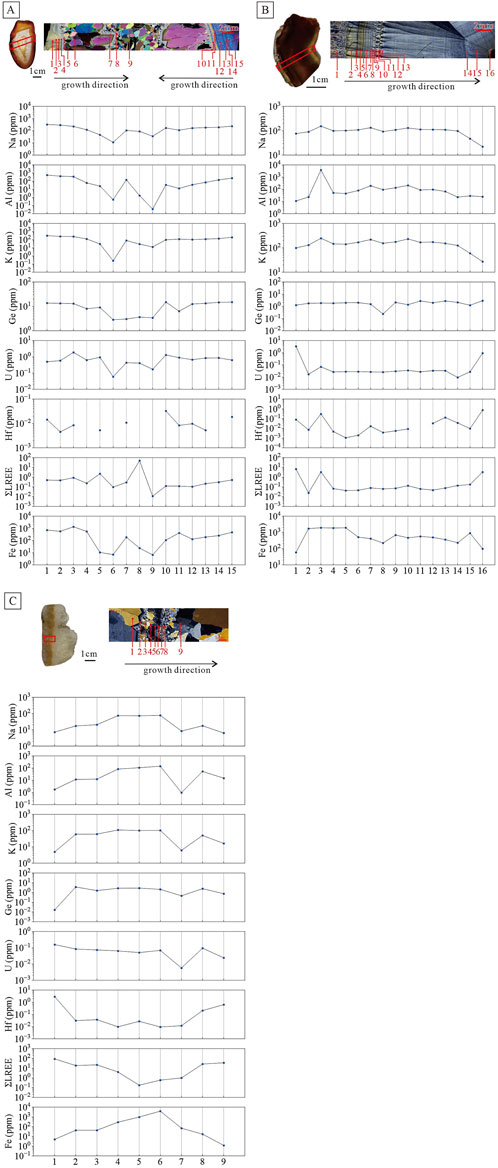
Figure 7. Spatial distribution of selected trace elements in Type II agates measured using LA–ICP–MS. (A) Sample BH2; (B) Sample BH6; (C) Sample BH5.
Significant differences exist in the distribution patterns of trace elements between Type I agate (Figure 6, samples BH3 and BH4) and Type II agate (Figure 7, samples BH2, BH5, and BH6).
In Type I agate (Figure 6), alkali metal elements such as Na and K vary in different growth layers and are closely related to the growth structure of the agate. For example, sample BH3 (Figure 6A) from the central crystalline quartz to the outer concentric length-fast layers and micro-granular texture layers, Na and K show a similar pattern, suddenly increasing at the crystalline quartz (Figure 6A, no. 9). In addition, the same trend is observed for the elements U and Ge. For the trivalent metal element Al, it shows a sudden decrease in the micro-granular texture chalcedony layers (Figure 6A, no. 7 and 11) and the crystalline quartz (Figure 6A, no. 9). For transition metal elements such as Fe, it shows a fluctuating downward trend from the outer layer toward the inner layer, consistent with the growth direction. In terms of the light rare earth elements (LREEs), they are enriched in the central crystalline quartz (Figure 6A, no. 9), and the micro-granular texture chalcedony layers (Figure 6A, no. 7), and the element Hf also shows a similar regular change.
In Type II agate (Figure 7), the variations in trace elements are more complex. In addition to being related to the growth structure, unique content change characteristics appear in certain special texture layers. For example, in the layer rich in spherulitic structure (Figure 7C, no. 7 of sample BH5), alkali metal and trivalent metal elements such as Na, Al, and K decrease sharply. In the nucleation layer (Figure 7B, no. 8 of sample BH6), Ge shows a decrease in content, but they are almost uniformly distributed in other layers.
As depicted in Figures 8A–E, agate layers with diverse textures and crystalline quartz display distinct chemical compositions. The concentrations of most elements, including Na, K, Rb, Ba, Mg, Al, Ca, Sc, Mn, Fe, and Cu, are higher in chalcedony layers of different textures compared with crystalline quartz layers (Figures 8A–D). Conversely, Cs, Th, La, Eu, and Σheavy rare earth elements (HREE) exhibit relatively higher concentrations in both the micro-granular texture layers and crystalline quartz (Figures 8A,C,E).
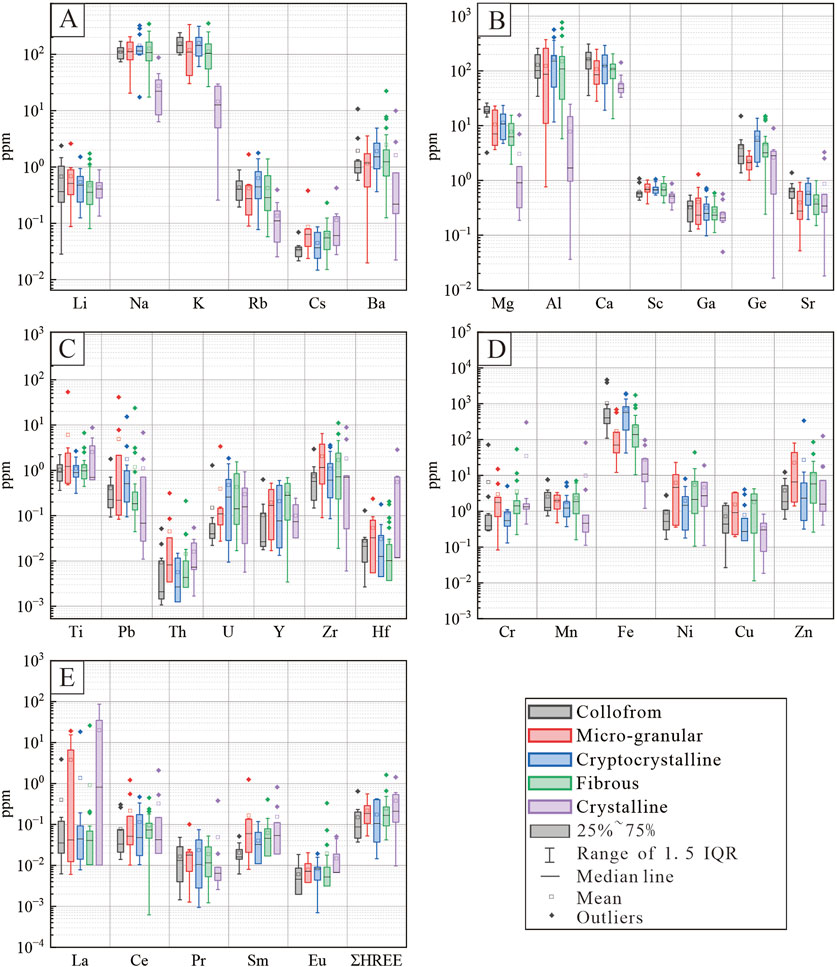
Figure 8. Box diagrams of trace element contents from Xunke agates. (A) Fluid-mobile elements. (B) Lithophile elements. (C) High-field strength elements. (D) Transition metal elements. (E) Rare earth elements.
Notably, the Fe contents are elevated in the cryptocrystalline and colloform layers (Figure 8D). The concentrations of Ca, Ge, and Sr decrease in the order of colloform, cryptocrystalline, fibrous, to micro-granular textures (Figure 8B), while Cs, Sc, Zr, Cr, Mn, Ni, Zn, Sm, Th, and ΣHREE follow a contrasting trend (Figures 8A–E).
The contents of Mg and Ga increase in fibrous, micro-granular, cryptocrystalline, and colloform textures (Figure 8B). Pb is more abundant in cryptocrystalline than in colloform textures. The contents of Ba and U decrease in the sequence of cryptocrystalline, fibrous, micro-granular, and colloform textures (Figures 8A,C), and Al is more concentrated in colloform than in micro-granular textures. For Y and Cu, although their average values show minimal differences, there are sharp decreases in colloform and cryptocrystalline textures, respectively (Figures 8C,D).
5 Discussion
Petrographic analysis shows Xunke agates have diverse textures (colloform, micro - granular, fibrous, cryptocrystalline layers, and crystalline quartz) arranged in Type I and Type II structural sequences. EPMA mapping and LA-ICP-MS analysis reveal that different textures have distinct elemental compositions. These findings are fundamental for understanding Xunke agate formation processes, as well as the substitution, distribution of trace elements, and the characteristics of ore-forming fluids.
5.1 Distribution characteristic and substation of trace elements in agate
Elemental partitioning in agate layers exhibits systematic texture-dependent patterns (Figure 8). Colloform textures show lithophile elements (Mg, Ca, Ga, and Sr) enrichment, but high-field strength element (HFSE: Th, U, Y, and Zr), transition metal (Cr, Ni, and Zn), and rare earth element (REE) depletion, mirroring primitive mafic fluid signatures. Micro-granular chalcedony displays peak concentrations of large-ion lithophile elements (LILEs; e.g., Ti, Th, Zr, and Hf), transition metals, and REEs, contrasting with cryptocrystalline layers enriched in fluid-mobile elements (FMEs: Li, K, Rb, and Ba), select lithophiles (Al and Ge), HFSEs (Pb and U), and LREEs (La, Ce, and Eu). Fibrous textures feature Y-Cu enrichment but FME and HFSE (Pb and Hf) depletion.
Crystalline quartz contains minimal FMEs, lithophiles, and transition metals, validating REEs as fluid source tracers. REE incorporation mechanisms follow crystal-chemical controls: ionic radius/charge mismatches prevent direct lattice substitution, necessitating fluid inclusion-mediated transport (Gliozzo, 2019; Gliozzo et al., 2019), producing distinct REE fractionation where micro-granular/crystalline textures exhibit LREE/HREE decoupling (low HREE/LREE ratio) and colloform/cryptocrystalline/fibrous texture chalcedony layers show coupled LREE-HREE enrichment.
Xunke agates exhibit coupled Si-Ti-Ga-Ge covariation across textural domains (Figure 9A), reflecting tetravalent cation saturation (Ti4+, Ge4+, and Ga4+) in silica-saturated fluids (Watt et al., 1997; Götze et al., 2001a; Chen et al., 2011). The absence of Al3+ + P5+ ↔ 2Si4+ substitution (Figure 9B) (Jacamon and Larsen, 2009) contrasts with documented Al-Li charge-balance compensation (Si4+ ↔ Al3+ + Li+, Figure 9C) (Rusk et al., 2008a), requiring supplementary alkali influx (K+/Na+) to maintain Al3+/Li+ <1:1 stoichiometry (Rusk et al., 2008b). Consistent Al-K-Na correlations (Figures 5A–F) and observed Si4+ ↔ (Al3+, Fe3+) + (K+, Na+, Li+) (Figure 9D) collectively demonstrate trace element regulation by alkali-enriched hydrothermal fluids (Lan et al., 2021), with textural variations modulating solid solution capacities through crystal-chemical constraints.
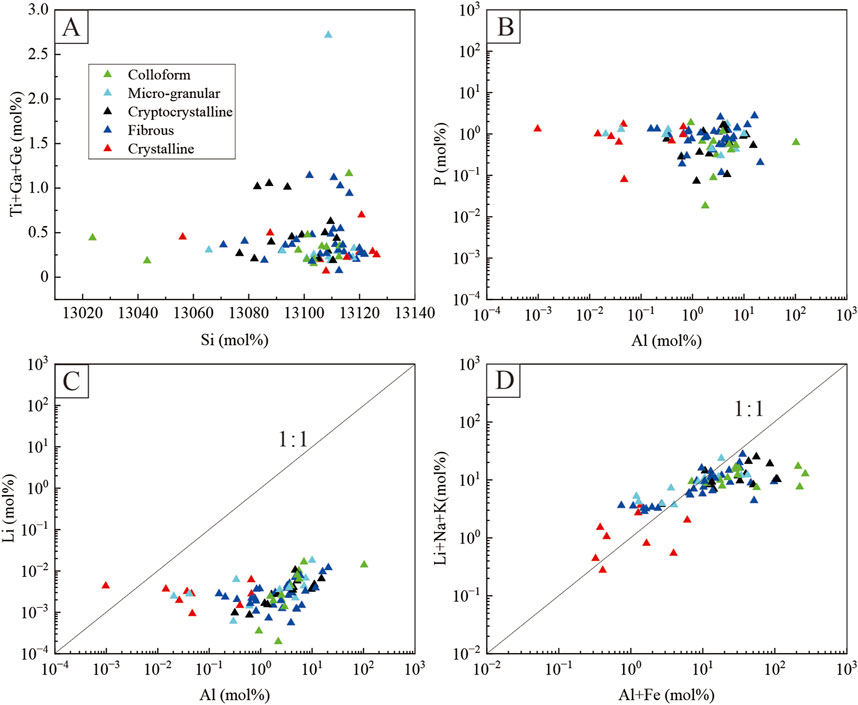
Figure 9. Plots of selected elements in different layers from the Xunke alluvial agates. (A) Ti+Ga+Ge (mol%) versus Si (mol%). (B) P (mol%) versus Al (mol%). (C) Li (mol%) versus Al (mol%). (D) Li+Na+K (mol%) versus Al+Fe (mol%).
5.2 Origin and geochemical characteristics of agate-forming fluids
Geochemical analysis is pivotal in determining the origin of Xunke agate ore-forming fluids. Comparing the elemental concentrations of Xunke agates and GH Formation basalt, normalized to chondrite values (Figure 10A), reveals similarities in Ba, Fe, and Mg. There are enrichments in Ti, La, Pb, P, Tb, Tm, Hf, and U, and depletions in Nb, Sr, Y, and HREEs relative to LREEs, with a distinct negative Ce anomaly. The chondrite-normalized patterns of trace and REEs in basalt and agate (Figure 10B) show similar trends of LREE depletion, HREE enrichment, and negative Ce and Eu anomalies, though U, La, Tb, and Tm trends differ. Agate has a unique negative Ce anomaly, and Xunke agate has a positive Hf anomaly. The significant increase in U relative to Th indicates U release and enrichment during agate formation.
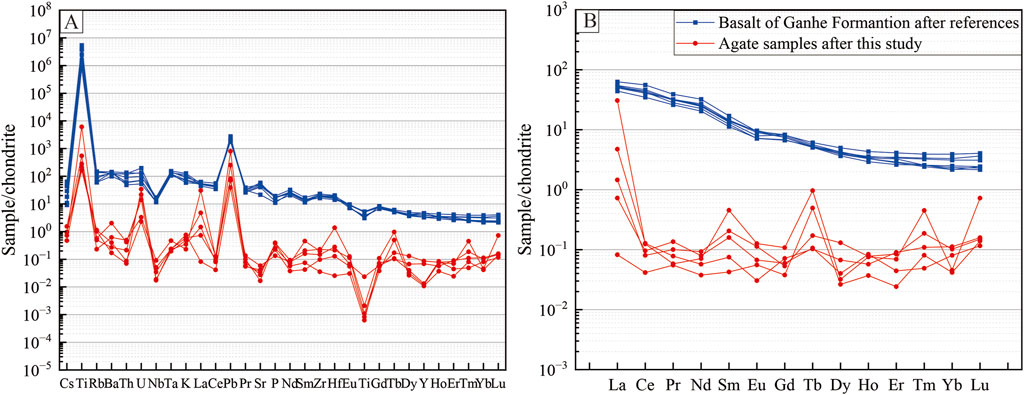
Figure 10. Trace elements (A) and REEs (B) average concentrations of Xunke alluvial agates normalized to the chondrite (Mcdonough and Sun, 1995). Blue lines indicate the average value obtained for the agate samples, while black lines indicate reference basalt samples obtained from the GH Formation (Zhang et al., 2019).
In the GH Formation, near-surface basalt vesicles filled with meteoric water led to mineral dissolution. When the pressure decreased, and the temperature fell below 200°C, silica in the fluids became supersaturated, precipitating microcrystalline silica on vesicle walls (Flörke et al., 1982). The correlation among Al, Na, K, and Rb (Figure 5) indicates that pyroxene and feldspar decomposition influenced agate chemistry, and machine learning verification (Zhang et al., 2024) confirms that Xunke agate ore-forming fluids originate from GH Formation basalt.
The element distribution in agate further supports this origin. Lithophiles and most HFSEs (except Y) are balanced, especially in Type I length-fast agates (Figure 6A, nos. 13–18; Figure 6B, nos. 10–16). The outer agate bands near the host rock have high LREEs and Li, sourced from basalt alteration.
The Ge/Al ratio suggests that magmatic fluid temperatures during early agate formation ranged from 100°C to 200°C (Figure 11A) (Müller et al., 2018; Wang et al., 2022; Yang et al., 2023). Similar Al-Ge trends with South African basalt-related agates (Gliozzo et al., 2019) imply comparable formation conditions (Figure 11A). The decreasing Ge/Al ratio from crystalline to colloform textures (Figure 11B) reflects fluid self-purification, likely because of different silica absorption capacities.
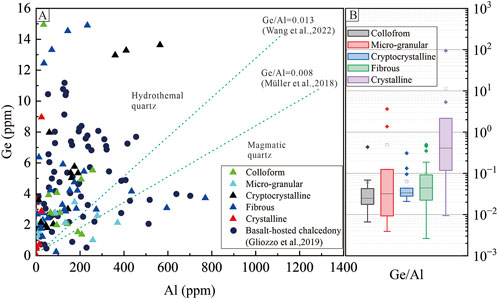
Figure 11. (A) Binary diagrams of Al versus Ge (Müller et al., 2018; Wang et al., 2022). (B) Box diagrams of Ge/Al ratios for different texture layers from Xunke agates.
Oxygen isotope values also play a crucial role, with Xunke agate’s median δ18OSMOW(‰) value of 13.9 being significantly lower (Shen et al., 2022), typical of basalt-hosted agates formed at temperatures ranging from 42°C to 220°C (median 104.5°C), higher than that of agates related to rhyolite and andesite (29°C–128°C; median 70°C and 94°C respectively) (Supplementary Table S2) (Fallick et al., 1985; Gliozzo et al., 2019; Götte et al., 2009; Götze et al., 2016; Götze et al., 2001b; Harris, 1988; Harris, 1989; Holzhey, 2001; Shen et al., 2022).
Fe precipitation patterns indicate an oxidizing early-stage environment. Fe accumulates in colloform and cryptocrystalline layers, with lower concentrations in crystalline quartz (Figures 4, 6–8) (Götte et al., 2009; Dumanska-Slowik et al., 2013; Powolny et al., 2019). H+-driven metasomatism mobilizes Fe2+, Mn2+, Cu2+, and Zn2+ from Fe-Mg minerals (Gliozzo et al., 2019), and these cations decrease from the outer to inner layers, especially in Type II slow-growing agates (Supplementary Table S1; Figures 7A–C, nos. 1–8, 10).
HREEs are more abundant than LREEs because of preferential complexation during alteration and migration (Gliozzo et al., 2019; Götze et al., 2016; Wood, 1990). The depletion of Zr and REEs in agate, increasing from colloform to crystalline quartz, indicates H2S-bearing fluid involvement (Supplementary Table S2; Figures 6, 7, 8E). These fluids generate sulfuric acid in acidic conditions, similar to African basalt-related agates (Gliozzo et al., 2019).
High U in agate results from interactions with volatile fluids promoting SiF4 and UO2F2 transport (Gliozzo et al., 2019; Götze et al., 2012). An increase in the U content from colloform to crystalline quartz (Figure 8C) implies enhanced volatile-mediated SiF4 migration to inner layers, suggesting lower-temperature formation for fibrous and cryptocrystalline layers and a higher-temperature for micro-granular and crystalline quartz layers. The Type II micro-granular initial layer formed at a higher temperature than the Type I colloform initial layer.
The positive Hf anomaly in Xunke agate is likely due to the solubility of Hf in siliceous melts and limited water solubility (Gliozzo et al., 2019). The decrease in the median Hf content from micro-granular chalcedony to crystalline quartz layers (Figure 8C) reflects reduced water content during post-magmatic alteration.
5.3 A model for the formation of basaltic-related agate
Early Cretaceous volcanic activity in the Greater and Lesser Hinggan Ranges facilitated the formation of basalt-related agates in the Xunke area (H.G.I.G.E.R., 2009; Han, 2013; Li et al., 2018; Li et al., 2014; Ma et al., 2002; Wu et al., 2015; Xiao et al., 2003; Zhang et al., 2019; Zhang et al., 2010) and triggered intermittent volcanic eruptions near Xunke, creating basic volcanic rocks replete with cavities. These magma-derived cavities served as conduits for fluid migration and sites for agate precipitation.
Silica for Xunke agate formation stems from three main sources: volcanic rock alteration, colloidal silica transformation, and fluid-mediated processes. Heated meteoric water interacting with magmatic fluids induces “autometamorphism” of basalt components (volcanic glass, pyroxene, and feldspar), transforming them into clay minerals, zeolites, and iron oxides/hydroxides and liberating silica (Ottens et al., 2019; Götze et al., 2020a; Klammer, 1997). When silicate minerals weather, they release polymeric and monomeric silicic acids (Landmesser, 1995; Dietzel, 2000). Monomeric silicic acid or oligomers, the primary transport forms of dissolved silica, condense into amorphous silica, contributing to agate formation (Dietzel, 2000; Landmesser, 1995). Fluids (water, carbon dioxide, and fluorine) participate in silica alteration and transport. Under specific conditions (pH > 9, elevated temperature), the solubility of silica increases, enabling it to diffuse into agate cavities (Powolny et al., 2019; Wood, 1990; Kempe et al., 1997).
Geochemical changes in mineral-forming fluids, reflected by variations in the relative contents of HF, H2O, and H2S, produce diverse agate textures (Figure 12). Negative Ce and positive U anomalies indicate an acidic-oxidizing environment during agate formation. The negative Ce anomaly reflects redox conditions, stabilizing Ce4+ during the incorporation of REEs (Bau and Koschinsky, 2009; Shields and Stille, 2001; Gliozzo et al., 2019). The slight negative Eu and Ce anomalies further support an oxidizing environment (Gliozzo et al., 2019). High U concentrations suggest formation in oxidizing, acidic, and carbonate-rich waters (Gliozzo et al., 2019).
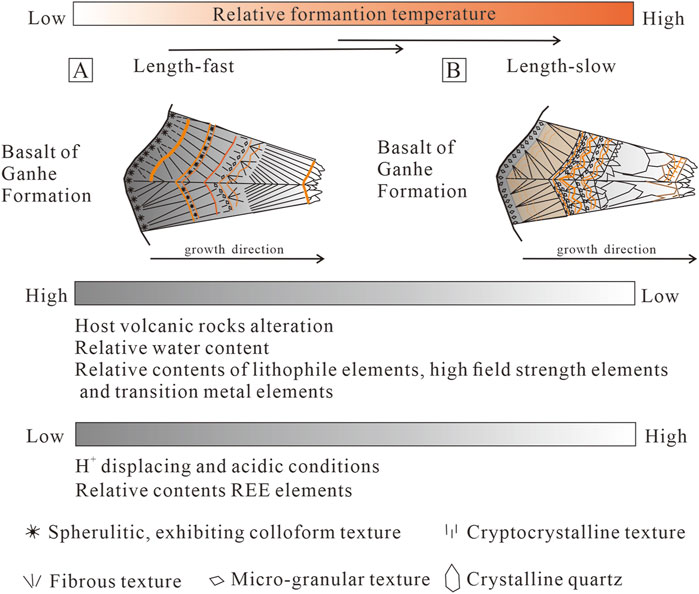
Figure 12. Model of the formation process of the Xunke agates. The orange lines and zones indicate the zonation of the Fe-bearing particles.
H2S-bearing fluids are crucial under increasingly acidic conditions. The increasing Zr and REE contents from colloform to crystalline quartz textures suggest a gradient of increasing acidity in mineral-forming fluids (Figure 12). Coupled with an increase in the U content from colloform to crystalline quartz, this indicates that fibrous and cryptocrystalline layers formed at lower temperatures, while micro-granular and crystalline quartz layers formed at higher temperatures. Consequently, length-fast agates (Figure 12A) have lower formation temperatures than length-slow agates (Figure 12B). The decrease in the median Hf content from micro-granular chalcedony layers to crystalline quartz layers reflects a reduction in water content in mineral-forming fluids (Figure 12).
Type I length-fast-growing structural sequences (Figure 12A) are characterized by a transition from colloform spherulitic to cryptocrystalline and then fibrous textures, representing a “self-purification process.” In contrast, Type II length-slow growing sequences initiate with higher initial crystallization temperatures because of fibrous micro-granular textures in the initial layers. Subsequently, a rapid reduction in temperature leads to a transition from colloform to fibrous textures. These sequences reflect post-magmatic metamorphism, where silica components accumulate and fluctuate under non-equilibrium, low-temperature, and rapid-cooling conditions, resulting in distinct texture assemblages. Fe, the chromogenic element, is most abundant in cryptocrystalline texture layers, significantly influencing the color of basalt-related agates (Figure 12).
In the Th/Yb versus Ta/Yb discrimination diagram (Figure 13A), Xunke agate data points are closely related to the Early Cretaceous Pacific Plate subduction environment and the active continental margin tectonic setting (Rottura et al., 1998). The high Ba and low Sr contents in agate samples (Figure 13B) indicate meteoric water as the main water source (Warren, 2000). Combined with the negative anomaly of Ce and Eu, it can be inferred that after the basalt eruption, a mixture of gas and meteoric water was trapped in basalt vesicles, forming primary Xunke agate deposits. Mesozoic and Pleistocene peneplanation events, along with weathering and fluvial transportation, led to the formation of secondary deposits, controlled by Mesozoic faulted basins.
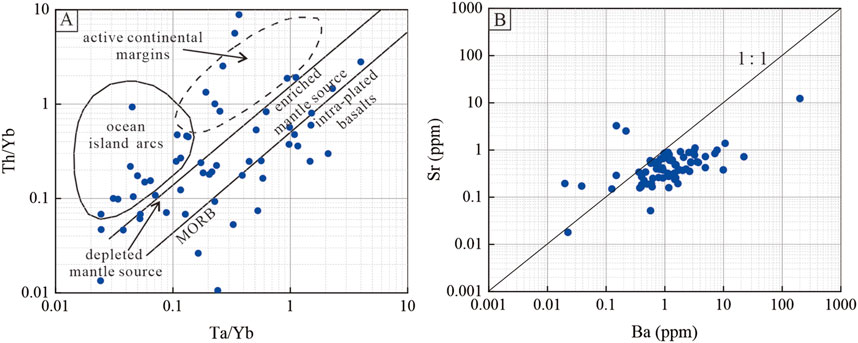
Figure 13. (A) Th/Yb versus Ta/Yb discrimination diagram of agate from Xunke area (Rottura et al., 1998). (B) Sr versus Ba of agate from the Xunke area.
6 Conclusion
This investigation uses a multidisciplinary approach, including mineralogical analyses, EPMA mapping, and LA–ICP–MS, to study basalt-associated agates. The key findings are:
Xunke agate is associated with GH Formation basalt. The vesicles at the margins of these basaltic rocks provided cavities for silica deposition. Meteoric water contributed to ore-forming fluids.
Element distribution correlates systematically with agate textures: colloform structures favor lithophile elements (e.g., Mg and Ca), while micro-granular layers concentrate LIIEs (e.g., Ti and Zr) and REEs. Cryptocrystalline zones host fluid-mobile elements (e.g., Li and Ba) and LREEs. Fibrous textures enrich Y and Cu, and crystalline quartz retains REEs with fractionation patterns associated with fluid inclusions and crystal chemistry.
Type I (length-fast) agate indicates stable low-temperature acidic settings, while Type II (length-slow) micro-granular textures signal higher-temperature origins. The agate forming fluids evolution transitions from the outer to inner zones, marked by declining water activity, rising acidity, and temperature gradients. Oscillating redox states reflected in Fe-enriched colloform and cryptocrystalline texture chalcedony layers drive color zonation.
Data availability statement
The original contributions presented in the study are included in the article/Supplementary Material, further inquiries can be directed to the corresponding author.
Author contributions
PZ: Conceptualization, Formal Analysis, Funding acquisition, Investigation, Methodology, Writing – original draft, Writing – review and editing. B-CW: Data curation, Formal Analysis, Investigation, Supervision, Visualization, Writing – review and editing. J-LZ: Formal Analysis, Funding acquisition, Investigation, Methodology, Writing – review and editing. X-YG: Formal Analysis, Investigation, Resources, Supervision, Validation, Writing – review and editing.
Funding
The author(s) declare that financial support was received for the research and/or publication of this article. Financial support for this research was provided by the University Nursing Program for Young Scholars with Creative Talents, Heilongjiang Province (UNPYSCT-2020211) and the Geological Survey Project, China Geological Survey (DD20230477).
Acknowledgments
We would like to express our gratitude to the colleagues from the Harbin Center for Integrated Natural Resources Survey, Geological Survey of China, for their support in sample collection and field investigations in the Xunke area.
Conflict of interest
The authors declare that the research was conducted in the absence of any commercial or financial relationships that could be construed as a potential conflict of interest.
Generative AI statement
The author(s) declare that no Generative AI was used in the creation of this manuscript.
Publisher’s note
All claims expressed in this article are solely those of the authors and do not necessarily represent those of their affiliated organizations, or those of the publisher, the editors and the reviewers. Any product that may be evaluated in this article, or claim that may be made by its manufacturer, is not guaranteed or endorsed by the publisher.
Supplementary material
The Supplementary Material for this article can be found online at: https://www.frontiersin.org/articles/10.3389/feart.2025.1548167/full#supplementary-material
References
Bau, M., and Koschinsky, A. (2009). Oxidative scavenging of cerium on hydrous Fe oxide: evidence from the distribution of rare earth elements and yttrium between Fe oxides and Mn oxides in hydrogenetic ferromanganese crusts. Geochem. J. 43, 37–47. doi:10.2343/geochemj.1.0005
Chen, X., Chen, Z., Cheng, Y., Ye, H., and Wang, H. (2011). Distribution and application of trace elements in hydrothermal quartz: understanding and prospecting. Geol. Rev. 57, 707–717. doi:10.16509/j.georeview.2011.05.005
Dietzel, M. (2000). Dissolution of silicates and the stability of polysilicic acid. Geochim. Cosmochim. Acta 64, 3275–3281. doi:10.1016/s0016-7037(00)00426-9
Dumanska-Slowik, M., Natkaniec-Nowak, L., Weselucha-Birczynska, A., Gawel, A., Lankosz, M., and Wrobel, P. (2013). Agates from sidi rahal, in the atlas Mountains of Morocco: gemological characteristics and proposed origin. Gems Gemol. 49, 148–159. doi:10.5741/gems.49.3.148
Fallick, A. E., Jocelyn, J., Donnelly, T., Guy, M., and Behan, C. (1985). Origin of agates in volcanic rocks from Scotland. Nature 313, 672–674. doi:10.1038/313672a0
Fan, W.-M., Guo, F., Wang, Y.-J., and Lin, G. (2003). Late Mesozoic calc-alkaline volcanism of post-orogenic extension in the northern Da Hinggan Mountains, northeastern China. J. Volcanol. Geoth. Res. 121, 115–135. doi:10.1016/s0377-0273(02)00415-8
Flörke, O., Köhler-Herbertz, B., Langer, K., and Tönges, I. (1982). Water in microcrystalline quartz of volcanic origin: agates. Contr. Mineral. Petrol. 80, 324–333. doi:10.1007/bf00378005
Gliozzo, E. (2019). “Variations on the silica theme: classification and provenance from Pliny to current supplies,” in The contribution of mineralogy to cultural heritage. doi:10.1180/EMU-notes.20.2
Gliozzo, E., Cairncross, B., and Vennemann, T. (2019). A geochemical and micro-textural comparison of basalt-hosted chalcedony from the Jurassic Drakensberg and Neoarchean Ventersdorp Supergroup (Vaal River alluvial gravels), South Africa. Int. J. Earth Sci. 108, 1857–1877. doi:10.1007/s00531-019-01737-3
Götte, J., Möckel, R., Kempe, U., Kapitonov, I., and Vennemann, T. (2009). Characteristics and origin of agates in sedimentary rocks from the Dryhead area, Montana, USA. Mineral. Mag. 73, 673–690. doi:10.1180/minmag.2009.073.4.673
Götze, J., Hofmann, B., Machałowski, T., Tsurkan, M. V., Jesionowski, T., Ehrlich, H., et al. (2020a). Biosignatures in subsurface filamentous fabrics (SFF) from the deccan volcanic province, India. Minerals 10, 540. doi:10.3390/min10060540
Götze, J., Möckel, R., and Pan, Y. (2020b). Mineralogy, geochemistry and genesis of agate—a review. Minerals 10, 1037. doi:10.3390/min10111037
Götze, J., Möckel, R., Pan, Y., and Müller, A. (2024). Geochemistry and formation of agate-bearing lithophysae in lower Permian volcanics of the NW-Saxonian Basin (Germany). Min. Petrol. 118, 23–40. doi:10.1007/s00710-023-00841-2
Götze, J., Möckel, R., Vennemann, T., and Müller, A. (2016). Origin and geochemistry of agates in Permian volcanic rocks of the Sub-Erzgebirge basin, Saxony (Germany). Chem. Geol. 428, 77–91. doi:10.1016/j.chemgeo.2016.02.023
Götze, J., Nasdala, L., Kempe, U., Libowitzky, E., Rericha, A., and Vennemann, T. (2012). The origin of black colouration in onyx agate from Mali. Mineral. Mag. 76, 115–127. doi:10.1180/minmag.2012.076.1.115
Götze, J., Plötze, M., and Habermann, D. (2001a). Origin, spectral characteristics and practical applications of the cathodoluminescence (CL) of quartz - a review. Min. Petrol. 71, 225–250. doi:10.1007/s007100170040
Götze, J., Tichomirowa, M., Fuchs, H., Pilot, J., and Sharp, Z. D. (2001b). Geochemistry of agates: a trace element and stable isotope study. Chem. Geol. 175, 523–541. doi:10.1016/s0009-2541(00)00356-9
Han, S. J. (2013). Research on magmatic fluids and gold mineralization of the late mesozoic epithermal gold system in the Northern Lesser Xing’an Range [doctoral thesis]. Changchun, Jilin: Jilin University.
Han, Z. (1995). Metallogenic series of ore deposits related to Caledonian granitoids in XiaoHingganling region. Min. Deposits 14, 301–312.
Harris, C. (1988). Oxygen isotope geochemistry of a quartz-agate Geode from northwestern Namibia. Communs Geol. Surv. SW Afr. Namib. 4, 43–44.
Harris, C. (1989). Oxygen-isotope zonation of agates from karoo volcanics of the skeleton coast. Namib. Am. Min. 74, 476–481.
Heaney, P. J. (1993). A proposed mechanism for the growth of chalcedony. Contr. Mineral. Petrol. 115, 66–74. doi:10.1007/bf00712979
Heaney, P. J., and Davis, A. M. (1995). Observation and origin of self-organized textures in agates. Science 269, 1562–1565. doi:10.1126/science.269.5230.1562
H. G. I. G. E. R.(Heilongjiang General Institute of Geological Exploration and Research of Non-ferrous Metals) (2009). 1:50,000 regional geological and mineral Survey report of kelin sheet and dongkelin forest farm sheet in Heilongjiang Province. Harbin: Heilongjiang Provincial Department of Natural Resources.
Holzhey, G. (2001). Contribution to petrochemical-mineralogical characterization of alteration processes within the marginal facies of rhyolitic volcanics of lower Permian Age. Chem. Erde 61, 149–186.
Jacamon, F., and Larsen, R. B. (2009). Trace element evolution of quartz in the charnockitic Kleivan granite, SW-Norway: the Ge/Ti ratio of quartz as an index of igneous differentiation. Lithos 107, 281–291. doi:10.1016/j.lithos.2008.10.016
Kempe, U., Götze, J., Belyatsky, B., and Plötze, M. (1997). Ce anomalies in monazite, fluorite and agate from Permian volcanics of the Saxothuringian (Germany).
Klammer, D. (1997). Mass change during extreme acid-sulphate hydrothermal alteration of a tertiary latite, Styria, Austria. Chem. Geol. 141, 33–48. doi:10.1016/s0009-2541(97)00056-9
Lan, Q., Lin, J., Fu, S., and Luo, J. (2021). Cathodoluminescent textures and trace element signatures of hydrothermal quartz from the granite-related no. 302 uranium deposit, South China: a reconnaissance study for their genetic significances. J. Geochem. Explor. 224, 106740. doi:10.1016/j.gexplo.2021.106740
Landmesser, M. (1995). Mobility by metastability-silica trasport at low-temperatures. Chem. Der Erde-geochamistry 55, 149–176.
Lee, D. R. (2007). Characterisation of silica minerals in a banded agate: implications for agate genesis and growth mechanisms. Masters Res., 1–18.
Li, Y., Xu, W.-L., Tang, J., Pei, F.-P., Wang, F., and Sun, C.-Y. (2018). Geochronology and geochemistry of Mesozoic intrusive rocks in the Xing’an Massif of NE China: implications for the evolution and spatial extent of the Mongol–Okhotsk tectonic regime. Lithos 304-307, 57–73. doi:10.1016/j.lithos.2018.02.001
Li, Y., Xu, W.-L., Wang, F., Tang, J., Pei, F.-P., and Wang, Z.-J. (2014). Geochronology and geochemistry of late Paleozoic volcanic rocks on the western margin of the Songnen–Zhangguangcai Range Massif, NE China: implications for the amalgamation history of the Xing’an and Songnen–Zhangguangcai Range massifs. Lithos 205, 394–410. doi:10.1016/j.lithos.2014.07.008
Liu, Y., Hu, Z., Gao, S., Günther, D., Xu, J., Gao, C., et al. (2008). In situ analysis of major and trace elements of anhydrous minerals by LA-ICP-MS without applying an internal standard. Chem. Geol. 257, 34–43. doi:10.1016/j.chemgeo.2008.08.004
Liu, Y., Hu, Z., Zong, K., Gao, C., Gao, S., Xu, J., et al. (2010). Reappraisement and refinement of zircon U-Pb isotope and trace element analyses by LA-ICP-MS. Chin. Sci. Bull. 55, 1535–1546. doi:10.1007/s11434-010-3052-4
Lu, Z., He, X., and Guo, Q. (2020). Color and genesis of beihong agate and its spectroscopic characteristics. Spectrosc. Spectr. Anal. 40, 2531–2537. doi:10.3964/j.issn.1000-0593(2020)08-2531-07
Ma, L. F., Qiao, X. F., Fan, B. X., Min, R. R., and Ding, X. Z. (2002). Atlas of geology in China. Beijing: Geological Publishing House.
Ma, T., Zhao, L., Song, Z., Dong, Y., and Gao, Y. (2023). Geochronology and geochemical characteristics of early paleozoic granites in Xunke area of northern Lesser Khingan range. World Geol. 42, 433–443. doi:10.3969/j.issn.1004-5589.2023.03.003
McDonough, W. F., and Sun, S. (1995). The composition of the Earth. Chem. Geol. 120, 223–253. doi:10.1016/0009-2541(94)00140-4
Merino, E., Wang, Y., and Deloule, E. (1995). Genesis of agates in flood basalts; twisting of chalcedony fibers and trace-element geochemistry. Am. J. Sci. 295, 1156–1176. doi:10.2475/ajs.295.9.1156
Mockel, R., Götze, J., Sergeev, S. A., Kapitonov, I. N., Adamskaya, E. V., Goltsin, N. A., et al. (2009). Trace-element analysis by laser ablation inductively coupled plasma mass spectrometry. Poland: LA-ICP-MS.
Moxon, T., Petrone, C. M., and Reed, S. J. B. (2013). Characterization and genesis of horizontal banding in Brazilian agate: an X-ray diffraction, thermogravimetric and electron microprobe study. Mineral. Mag. 77, 227–248. doi:10.1180/minmag.2013.077.3.02
Mrozik, M., Götze, J., Pan, Y., and Möckel, R. (2023). Mineralogy, geochemistry, and genesis of agates from Chihuahua, Northern Mexico. Minerals 13, 687. doi:10.3390/min13050687
Müller, A., Herklotz, G., and Giegling, H. (2018). Chemistry of quartz related to the Zinnwald/Cínovec Sn-W-Li greisen-type deposit, Eastern Erzgebirge, Germany. J. Geochem. Explor. 190, 357–373. doi:10.1016/j.gexplo.2018.04.009
Ottens, B., Götze, J., Schuster, R., Krenn, K., Hauzenberger, C., Zsolt, B., et al. (2019). Exceptional multi stage mineralization of secondary minerals in cavities of flood basalts from the Deccan Volcanic Province, India. Minerals 9, 351. doi:10.3390/min9060351
Powolny, T., Dumańska-Słowik, M., Sikorska-Jaworowska, M., and Wójcik-Bania, M. (2019). Agate mineralization in spilitized Permian volcanics from “Borówno” quarry (Lower Silesia, Poland) – microtextural, mineralogical, and geochemical constraints. Ore Geol. Rev. 114, 103130. doi:10.1016/j.oregeorev.2019.103130
Rottura, A., Bargossi, G. M., Caggianelli, A., Del Moro, A., Visonà, D., and Tranne, C. A. (1998). Origin and significance of the Permian high-K calc-alkaline magmatism in the central-eastern Southern Alps, Italy. Lithos 45, 329–348. doi:10.1016/s0024-4937(98)00038-3
Rusk, B. G., Lowers, H. A., and Reed, M. H. (2008a). Trace elements in hydrothermal quartz: relationships to cathodoluminescent textures and insights into vein formation. Geol 36, 547. doi:10.1130/g24580a.1
Rusk, B. G., Reed, M. H., and Dilles, J. H. (2008b). Fluid inclusion evidence for magmatic-hydrothermal fluid evolution in the porphyry copper-molybdenum deposit at Butte, Montana. Econ. Geol. 103, 307–334. doi:10.2113/gsecongeo.103.2.307
Shen, M., Lu, Z., and He, X. (2022). Mineralogical and geochemical characteristics of banded agates from placer deposits: implications for agate genesis. ACS Omega 7, 23858–23864. doi:10.1021/acsomega.2c02538
Shields, G., and Stille, P. (2001). Diagenetic constraints on the use of cerium anomalies as palaeoseawater redox proxies: an isotopic and REE study of Cambrian phosphorites. Chem. Geol. 175, 29–48. doi:10.1016/s0009-2541(00)00362-4
Stoch, L., Łaczka, M., and Wacławska, I. (1985). DTA and x-ray diffraction study of the phase transformation of silica minerals. Thermochim. Acta 93, 533–536. doi:10.1016/0040-6031(85)85134-0
Wang, F., Ge, G., Ning, S., Nie, L., Zhong, G., and White, N. C. (2017). A new approach to LA-ICP-MS mapping and application in geology. Acta Petrol. Sin. 33, 3422–3436.
Wang, S. L., Peng, H. J., Wang, T. R., Zou, H., Zhou, Q., Yang, D. J., et al. (2022). Trace element composition and cathodoluminescence of quartz in the hongniu–hongshan skarn deposit in yunnan province, southwest China. Front. Earth Sci. 10, 864118. doi:10.3389/feart.2022.864118
Warren, J. (2000). Dolomite: occurrence, evolution and economically important associations. Earth Sci. Rev. 52, 1–81. doi:10.1016/s0012-8252(00)00022-2
Watt, G. R., Wright, P., Galloway, S., and McLean, C. (1997). Cathodoluminescence and trace element zoning in quartz phenocrysts and xenocrysts. Geochim. Cosmochim. Ac. 61, 4337–4348. doi:10.1016/s0016-7037(97)00248-2
Wood, S. A. (1990). The aqueous geochemistry of the rare-earth elements and yttrium: 1. Review of available low-temperature data for inorganic complexes and the inorganic REE speciation of natural waters. Chem. Geol. 82, 159–186. doi:10.1016/0009-2541(90)90080-q
Wu, G., Chen, Y., Sun, F., Liu, J., Wang, G., and Xu, B. (2015). Geochronology, geochemistry, and Sr–Nd–Hf isotopes of the early Paleozoic igneous rocks in the Duobaoshan area, NE China, and their geological significance. J. Asian Earth Sci. 97, 229–250. doi:10.1016/j.jseaes.2014.07.031
Xiao, W., Windley, B. F., Hao, J., and Zhai, M. (2003). Accretion leading to collision and the Permian Solonker suture, Inner Mongolia, China: termination of the central Asian orogenic belt. Tectonics 22. doi:10.1029/2002tc001484
Yang, L., Tian, Y., Li, Q., Yan, J., and Xie, J. (2023). Texture and trace element characteristics of quartz in the Dongyuan porphyry W deposit, eastern China. Solid Earth Sci. 8, 305–318. doi:10.1016/j.sesci.2023.11.001
Yang, Y., Yang, X., Jiang, B., Wang, Y., and Pang, X. (2022). Spatio-temporal distribution of mesozoic volcanic strata in the great Xing’ an range: response to the subduction of the Mongol-Okhotsk ocean and Paleo-Pacific ocean. Earth Sci. Front. 29, 115–131. doi:10.13745/j.esf.sf.2022.2.11
Yin, B. C., and Ran, Q. C. (1997). Metallogenic evolution in xiaohingganling- zhangguangcailing region, Heilongjiang province. Min. Deposits 16, 235–241. doi:10.16111/j.0258-7106.1997.03.005
Zhang, C., Wu, X., Zhang, Y., Guo, W., and Quan, J. (2019). U-Pb chronology of Mesozoic volcanic rocks from Longjiang Basin and their constraints on basement. J. Jilin Univ. 49, 460–476. doi:10.13278/j.cnki.jjuese.20170096
Zhang, P., Wang, B.-C., Huang, X.-W., and Xi, X. (2024). Geochemical discrimination of agate in diverse volcanic host rocks through machine learning methods. Minerals 15, 32. doi:10.3390/min15010032
Zhang, X., Ji, L., and He, X. (2020). Gemological characteristics and origin of the Zhanguohong agate from Beipiao, Liaoning province, China: a combined microscopic, X-ray diffraction, and Raman spectroscopic study. Minerals 10, 401. doi:10.3390/min10050401
Zhang, Z., Mao, J., Wang, Y., Pirajno, F., Liu, J., and Zhao, Z. (2010). Geochemistry and geochronology of the volcanic rocks associated with the Dong’an adularia–sericite epithermal gold deposit, Lesser Hinggan Range, Heilongjiang province, NE China: constraints on the metallogenesis. Ore Geol. Rev. 37, 158–174. doi:10.1016/j.oregeorev.2010.03.001
Keywords: agate, basalt-related, formation mechanism, origin of mineral-forming fluids, EPMA mapping, LA-ICP-MS
Citation: Zhang P, Wang B-C, Zheng J-L and Guo X-Y (2025) Formation mechanism of basalt-related agate deposits: an example from the Ating River alluvial gravels in the Xunke area, Heilongjiang, NE China. Front. Earth Sci. 13:1548167. doi: 10.3389/feart.2025.1548167
Received: 19 December 2024; Accepted: 23 April 2025;
Published: 02 May 2025.
Edited by:
Edson Campanhola Bortoluzzi, The University of Passo Fundo, BrazilReviewed by:
Hartmann, L.A., Federal University of Rio Grande do Sul, BrazilDiovane Freire Moterle, Federal Institute of Rio Grande do Sul, Brazil
Copyright © 2025 Zhang, Wang, Zheng and Guo. This is an open-access article distributed under the terms of the Creative Commons Attribution License (CC BY). The use, distribution or reproduction in other forums is permitted, provided the original author(s) and the copyright owner(s) are credited and that the original publication in this journal is cited, in accordance with accepted academic practice. No use, distribution or reproduction is permitted which does not comply with these terms.
*Correspondence: Bo-Chao Wang, d2FuZ2JvY2hhb0BtYWlsLmNncy5nb3YuY24=