 Yuqi Zhang
 Xuejia Du
 Dingwen Jiang3
- 1University of Chicago, Harris School of Public Policy, Chicago, IL, United States
- 2Department of Petroleum Engineering, University of Houston, Houston, TX, United States
- 3Daqing Oilfield Kaipu Chemical Co., LTD., Daqing Heilongjiang, China
This study addresses wellbore instability in shale formations by conducting mechanical experiments on bedded shale samples with varying hydration times. We fitted experimental data using two anisotropic strength criteria to determine the shale’s strength parameters. A transverse isotropic stress model was developed to predict the lower limit of the safe drilling fluid density window, examining the effects of hydration time and anisotropy on wellbore stability. Results indicate that rock strength initially increases and then decreases with bedding angle. Within the β1 to β2 range, both the Jaeger’s Plane of Weakness model (JPW) and Plane of Patchy Weakness Model (PPW) accurately predicted shale strength; however, below β1, the JPW criterion overestimated strength, while the PPW criterion better reflected strength variations. Anisotropy due to bedding significantly increased wellbore collapse pressure, shifting the optimal well trajectory from the direction of minimum horizontal stress to maximum horizontal stress, altering collapse pressure contour distributions. The choice of strength criteria had minimal impact on the trend of collapse pressure with well trajectory. While shale hydration can significantly affect wellbore stability and the lower safe drilling mud window with well trajectory, prolonged contact between drilling fluid and rock gradually increased lower safe drilling mud window. Collapse pressure in vertical or horizontal wellbores was minimally affected by soaking time, whereas inclined wellbores showed greater sensitivity. Notably, horizontal wells drilled in the direction of minimum horizontal stress were more responsive to contact time with drilling fluid, leading to a faster increase in collapse pressure.
1 Introduction
Due to the needs of economic development, China’s energy demand is continuously rising, while the production from conventional reservoirs is decreasing year by year (Zhang et al., 2020; Zhang et al., 2022; Ning et al., 2022; Xing et al., 2021). The development potential of unconventional energy is substantial, with the exploitation of unconventional oil and gas resources, particularly shale gas, emerging as a pivotal breakthrough in addressing global energy shortages (Liu et al., 2022; Li et al., 2022; Qi et al., 2022; Liu et al., 2013; Bai et al., 2022). Horizontal drilling and hydraulic fracturing are two key technologies for developing shale gas. However, due to the influence of shale structure and mechanical characteristics, issues such as collapse and spalling frequently occur during horizontal drilling, making wellbore instability a major technical challenge restricting the safe and efficient drilling of shale gas horizontal wells (Bai et al., 2022; Han et al., 2020; Germanovich and Dyskin, 2000; Ding et al., 2020; Ding et al., 2021; Meng et al., 2019). After drilling into the formation, the in situ stress induces stress concentration around the wellbore. If the stress differential surpasses the rock’s strength, wellbore collapse occurs (Vahid and Ahmad, 2011; Westergaard, 1940; Willson et al., 2007; Wu et al., 2024; Yang Li et al., 2022). While an appropriate drilling fluid density can provide necessary support to the wellbore, excessively high drilling fluid density may fracture the reservoir, leading to wellbore instability (Zhang et al., 2015; Zhang et al., 2017; Zhang et al., 2021a; Zhang et al., 2023; Gao and Gray, 2019; Gao et al., 2021). Therefore, researching the safe density window of drilling fluid is crucial for the safe and efficient drilling operations in shale reservoirs (Gao et al., 2014; He et al., 2015; Vahid and Ahmad, 2011; Fjær et al., 2008; Aadnoy and Chenevert, 1987; Ong and Roegiers, 1996).
To understand the mechanism of wellbore instability in shale formations and to reduce the occurrence of wellbore collapse and leakage incidents, extensive research has been conducted by petroleum engineers (Mitchell and Miska, 2011; Fjær et al., 2008; Ning et al., 2022; Li et al., 2022; Liu et al., 2016; Bai et al., 2022; He et al., 2015; Gao et al., 2021). Aadnoy and Chenevert (1987) developed a mechanical analysis model for wellbore anisotropic media, incorporating anisotropic elastic parameters, directional shear, and tensile strength parameters. Their findings indicated that overlooking the anisotropic properties of the rock can lead to inaccuracies in wellbore instability analysis. Building on this work, Ong and Roegiers (1996) enhanced Aadnoy’s mechanical model by creating a comprehensive wellbore stress calculation model for anisotropic formations. This model accounts for the combined influences of in situ stress, drilling fluid column pressure, fluid seepage, and temperature fields. They employed a generalized three-dimensional anisotropic failure criterion to assess wellbore collapse due to shear failure in the formation. Their research on horizontal wellbore collapse in anisotropic formations demonstrated that strong anisotropy, significant in situ stress differences, and excessive wellbore cooling substantially impact wellbore stability. In contrast, variations in pore pressure and pore elastic parameters have a lesser effect. However, the model did not yet incorporate the coupling effects between formation, fluid, and temperature changes (Al-Ajmi and Zimmerman, 2005; Cheng et al., 2024; Dong et al., 2025; Fjær et al., 2008; Gao and Gray, 2019; Gao and Gray, 2019; Gao et al., 2014; Gholami et al., 2013; He et al., 2015; Higgins et al., 2008; Liu et al., 2013; Jamshidi et al., 2024). Ong and Roegiers (1996) introduced a triaxial wellbore stress analysis model that considers drilling fluid column pressure, fluid flow, and thermal stress, finding that wellbore stability in directional wells is mainly influenced by rock anisotropy, in situ stress heterogeneity, and thermal stress. Lee et al. (2012) developed a model considering rock anisotropic strength and provided a method to determine the wellbore instability region. The size of the instability region and safe mud weight are controlled by wellbore orientation, bedding planes, and the direction of the in situ stress field. Li and Weijermars (2019) established the stable mud weight window using a modified Hoek-Brown failure criterion, showing that as the anisotropy of the elastic moduli increases further, both the breakdown pressure and collapse pressure decrease. Young’s moduli are the key factors contributing to the narrowing of the safe drilling window when these moduli become more anisotropic.
The above studies mainly focus on the impact of shale bedding on the circumferential stress and anisotropic strength, with little discussion on the damage and deterioration mechanisms caused by water and bedding in shale (Kanfar et al., 2015; Lekhnitskii, 1963; Liu et al., 2016; Lu et al., 2012; Meng et al., 2019; Ottesen, 2010; Vahid and Ahmad, 2011; Westergaard, 1940; Yang Xianyu et al., 2022). However, shale forms numerous bedding planes and fractures during the compaction and cementation process of diagenesis, significantly influenced by mineral composition, alignment, and cementation degree (Fjær et al., 2008; Aadnoy and Chenevert, 1987; Liu et al., 2016; Ottesen, 2010; Westergaard, 1940). These characteristics not only exhibit significant anisotropy but also deteriorate more easily when exposed to water, leading to engineering problems (Ong and Roegiers, 1996). Most wellbore instability issues arise in shale formations due to their unique laminated structures, which result in pronounced anisotropy (Ning et al., 2022; Ottesen, 2010; Pirhadi et al., 2023; Pirhadi et al., 2025; Serajian and Ghassemi, 2011; Zhang, 2013). Additionally, the moderate to high clay content in these formations makes them susceptible to shrinkage and swelling. Consequently, investigating the mechanical properties of shale, particularly under the influence of bedding planes and water interaction, holds substantial engineering significance (Junyang et al., 2017). Nwonodi et al. (2023) proposed a time-dependent analysis method for predicting wellbore instability in horizontal wells within reactive shale formations. By integrating osmosis/diffusion principles, the study improved traditional models that neglected membrane failure and diffusion time effects. The Mogi-Coulomb criterion was introduced to systematically incorporate factors such as membrane efficiency degradation, rock strength reduction, and ion migration. Junyang et al. (2017) conducted acoustic emission experiments on the damage and failure process of laminated shale under uniaxial compression, studying the mechanisms of damage and deterioration under the influence of bedding and water. The results indicated that the damage mechanisms differ; bedding primarily causes damage through the distribution of primary microcracks along the bedding planes, while water-induced damage mainly stems from adsorption and capillary pressure. Wang (2019) analyzed the changes in shale physical properties under different hydration conditions and modified the wellbore stability evaluation model to account for hydration effects. For various in situ stress distributions, the study analyzed wellbore stability, indicating that collapse pressure increases significantly in the early stages of hydration and the rate of increase slows down over time.
Maintaining the drilling fluid density within a range that ensures wellbore stability is essential for effectively preventing well collapse (Zhang et al., 2024; Wang, 2019). To achieve this, it is critical to consider not only the stress state of the wellbore but also the impact of the hydration process that occurs when shale interacts with drilling fluid on the lower safe mud weight window (Fjær et al., 2008; Aadnoy and Chenevert, 1987; Ong and Roegiers, 1996). Most current studies adopt the JPW criterion to analyze the wellbore stability in transversely isotropic formations. However, the effectiveness of this criterion in predicting the strength of bedded shale remains unclear (Yang Li et al., 2022; Zhang et al., 2021b; Zhe and Bao, 2022; Junyang et al., 2017). Previous research has rarely compared the prediction accuracy of this criterion with other anisotropic strength criteria for bedded shale strength (Wang, 2019). Additionally, under hydration effects, it remains uncertain whether the anisotropic characteristics of bedded shale strength change, and whether anisotropic strength criteria can predict the strength of shale post-hydration. These issues necessitate further investigation. Therefore, this study conducted uniaxial compressive strength tests on shale with varying water contents and bedding angles. The experimental results were fitted using different anisotropic strength criteria to analyze the influence of hydration on the anisotropic strength parameters of shale. Additionally, the study considered the impact of elastic anisotropy. Based on the transverse isotropic wellbore stress model, the anisotropic strength parameters of shale with different water contents were integrated to analyze the effect of hydration time on wellbore collapse pressure. This analysis revealed the distribution characteristics of the collapse pressure polar plot over time since the shale formation was drilled. The findings of this research are highly significant for scientifically evaluating the impact of hydration on wellbore stability, reducing wellbore instability, and achieving “safe, high-quality, and rapid” drilling.
2 The influence of water on shale strength
2.1 Anistropic strength model
Direct shear and triaxial mechanical experiments on shale have demonstrated significant strength anisotropy attributed to the presence of bedding planes. Various methods have been developed to characterize the anisotropic strength of laminated rocks, including JPW criterion, the Mclamore model, the PPW criterion, Pariseau’s Model, and the Modified Hoek-Brown Criterion. These methods can be categorized based on the curve characteristics of rock strength relative to bedding angle into shoulder type, undulating type, and U-shaped types. Among these, Jaeger’s single plane of weakness model is particularly notable for its conceptual clarity, ease of application, and its ability to accurately characterize anisotropic strength features. The Jaeger criterion describes the shear failure conditions of rock masses with one or a group of parallel weak planes, often referred to as the single set weak plane strength theory, in this criterion, the failure of the weak plane is expressed as Equation 1,
And β satisfies Equation 2,
In which, the β1 and β2 are shown as Equation 3,
If the above conditions are not satisfied, the criterion for rock failure follows the Mohr-Coulomb criterion, which is shown as Equation 4,
In which, σ1 denotes the maximum principal stress, MPa; σ3 denotes the minimum principal stress, MPa; Co denotes the rock cohesion, MPa; Cw denotes the cohesion within the weak plane, MPa; φo denotes the internal friction angle of the rock, degrees; φw denotes the internal friction angle within the weak plane, degrees; and β represents the angle between the normal to the weak plane and the maximum principal stress, degrees.
The Patchy Plane of Weakness criterion extends Jaeger’s single weak plane model by similarly dividing the failure of laminated shale into two distinct, discontinuous parts. This criterion posits that microcracks along bedding planes create stress concentrations, which ultimately lead to rock failure. This criterion is expressed by Equation 5,
where,
2.2 Fitting of shale strength
Define the bedding angle as the angle between the normal to the bedding plane and the loading direction, as illustrated in Figure 1. Prior to coring, use a cutting machine to shape the rock samples collected from the field into horizontal-bedded rectangular blocks, as shown in Figure 1. The specifications for coring practices in oil and gas exploration are consistent with the method reported by Fjær et al. (2008). Subsequently, core these blocks using an SC-300 automatic coring machine, which permits adjustment of the drilling speed. Given the low core recovery rate of shale, it is advisable to maintain a moderate drilling speed, typically around 2 mm/min. During the coring process, adjust the drilling direction of the drill bit to create angles of 0°, 15°, 30°, 45°, 60°, 75°, and 90° with the bedding plane, thereby obtaining cores with varying bedding angles. After coring, group and place the specimens, then cut and grind them. Finally, process the cores into standard specimens with a diameter of 25 mm and a height of 50 mm, ensuring the parallelism of the end faces is within ±0.02 mm.
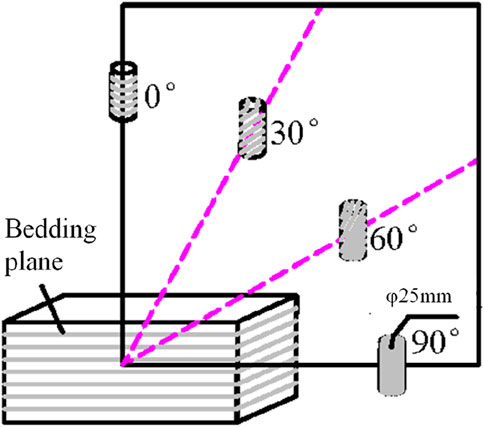
Figure 1. Diagram of coring shale samples.
For each bedding angle, three parallel specimens were prepared. The specimens were grouped and treated as follows: ① dried at 105°C in an oven for 24 h as the dried rock samples; ② dried at 105°C in an oven for 24 h, then soaked in water for 24 h; ③ soaked in water for 48 h after drying for 24 h. Uniaxial compressive strength tests were conducted using the MTS815 rock mechanics testing machine for the three groups of specimens. This apparatus, manufactured by MTS Corporation in the United States, is specifically designed for triaxial servo-rigid testing of rocks and concrete. It features three independent closed-loop servo control systems for axial pressure, confining pressure, and pore water pressure. The machine is capable of delivering a maximum axial pressure/tension of 4,600 kN/2,300 kN, a maximum dynamic confining pressure of 140 MPa, and a maximum pore pressure of 140 MPa.
After completing the test, the fracture characteristics of shale with different bedding angles can be observed, when the angle between the axial load and the normal to the bedding plane is 0°, shear failure primarily occurs along the rock matrix, resulting in the maximum strength. When the bedding dip angle is around 60°, shale tends to experience shear failure along the bedding plane, exhibiting the lowest strength. For other bedding dip angles, shale may undergo a mixed failure mode involving shear along both the matrix and bedding planes. Consequently, the strength in such cases is lower than that of matrix-dominated failure but higher than that of pure bedding plane shear failure.
The test results are shown in Table 1. Based on the predicted results in Table 1, the root mean square (RMS) of the differences between predicted and measured values was used as the evaluation metric for prediction error, as shown in Equation 6,
where N is the tested sample number,
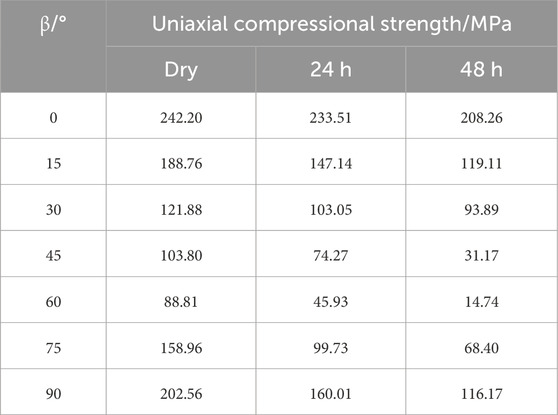
Table 1. Transformation of different coordinate systems.
The fitting results for dry samples, samples soaked for 24 h, and samples soaked for 48 h by JPW and PPW criteria are shown in Table 2. For comparison purposes, the predicted results from the JPW and PPW criteria and the experimental data are plotted together in Figures 2–4, respectively.
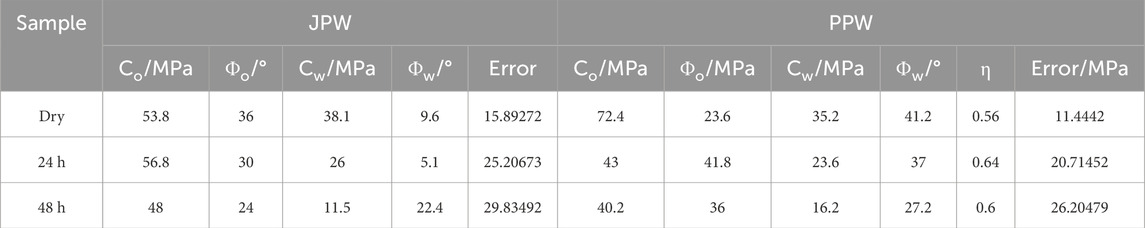
Table 2. Transformation of different coordinate systems.
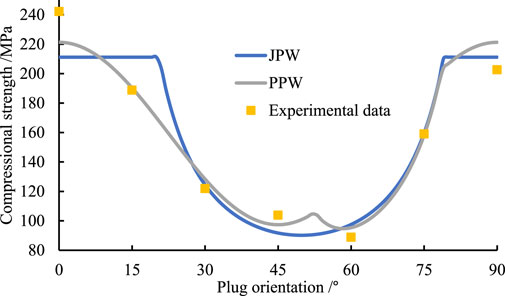
Figure 2. Experimental data for dry samples fit by JPW and PPW models.

Figure 3. Experimental data for samples soaking in water for 24 h fit by JPW and PPW models.
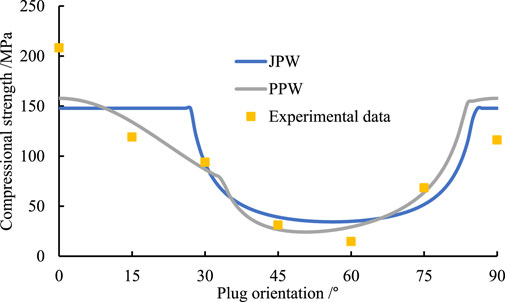
Figure 4. Experimental data for samples soaking in water for 48 h fit by JPW and PPW models.
From the Figures 2–4, it can be observed that shale strength initially decreases and then increases with the increase in bedding angle. Within the range of β1 to β2, both the JPW and PPW criteria accurately predict the shale strength. However, when the bedding angle is below β1, the JPW criterion tends to overestimate the shale strength, whereas the PPW criterion more accurately reflects the trend of strength variation with the bedding angle. This discrepancy arises because, within the low bedding angle range, shale exhibits a mixed failure mode involving both shearing through the rock matrix and sliding along the bedding planes. The PPW criterion introduces a dimensionless parameter η to reveal this failure mechanism, leading to better predictions. In contrast, the JPW criterion only considers failure as either shear failure through the matrix or shear sliding along the bedding planes, resulting in an overestimation of strength for low-angle shale. The inherent flaws (e.g., microcracks, pores, or poor grain alignment) along bedding planes will create stress concentration points that reduce strength, PPW criterion reveals this mechanism, while JPW do not consider the stress concentration caused by flaws, so there is a big gap between the uniaxial compressive strength of JPW and PPW at 0° bedding angle under the three states.
The prediction errors of the JPW and PPW criteria for shale strength at various soaking times are illustrated in Figure 5. A smaller RMS value indicates higher prediction accuracy. As depicted in the figure, the prediction errors for both anisotropic strength criteria gradually increase with longer soaking times, suggesting that the heterogeneity of the shale intensifies with higher water content. Notably, the RMS error for the PPW criterion remains consistently lower than that for the JPW criterion, demonstrating that the PPW criterion offers more precise predictions of shale strength across different bedding angles.
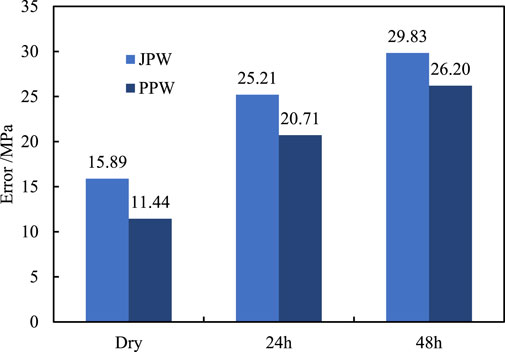
Figure 5. Experimental data for samples soaking in water for 48 h fit by JPW and PPW models.
3 Wellbore stability prediction model
To obtain the safe drilling fluid density window in shale formations, the first step is to determine the stress distribution around the wellbore. Layered shale should be treated as a transversely isotropic medium, unlike isotropic formations where stress around the wellbore is influenced solely by stress concentrations. In shale, stress distribution is further complicated by material anisotropy. Consequently, it is essential to select appropriate strength criteria to accurately describe the strength characteristics of the formation rock. Given that shale strength exhibits significant variation with bedding inclination angle, the impact of strength anisotropy on the safe density window must also be taken into account. This paper provides a detailed explanation of the method for predicting the safe density window in shale formations.
3.1 Coordinate transformation
To determine the stress distribution around the wellbore, it is essential to establish the conversion relationships between the global coordinate system and the geo-stress coordinate system, the borehole rectangular and polar coordinate systems, and the bedding plane coordinate system. The relationships between these coordinates are shown in Figure 6, αs is the angle between the maximum horizontal principal stress and the true north direction, °; βs is the angle between the vertical stress and the plumb line direction, °; the borehole inclination angle βb is the angle between the borehole axis and the plumb line direction, °; borehole azimuth angle αb is the angle between the projection of the borehole’s lowest point on the horizontal plane and the true north direction, °; αbp+π/2 represents the strike of the bedding plane, °; βbp is the angle between the normal to the bedding plane and the plumb line direction, °.
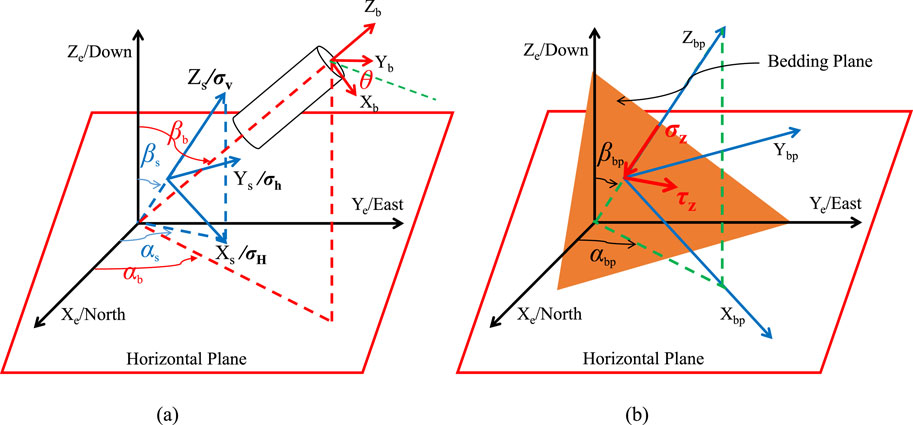
Figure 6. Transformation of different coordinate systems. (a) Conversion of global coordinate, geo-stress coordinate and borehole coordinate; (b) conversion of global coordinate and bedding plane coordinate.
Taking the geo-stress coordinates as the reference, a series of coordinate transformations can yield the distribution of geo-stress around the wellbore in a rectangular coordinate system, as shown in Equation 7,
Defining shale as a linear elastíc transversely isotropic material the stress-strain relatíonship also adheres to Hooke's law. As shown in Figure 7, when the wellbore axis is perpendicular to the bedding planesby using the boldface characters to represent matricesthe constítutive equatíon for the shale is shown as Equation 8,

Figure 7. Diagram of angle between rock and bedding around wellbore.
In the equation, the compliance matrix A is shown in Equation 9,
where
In which, according to the operations of spatial vectors, the matrix Q is expressed as shown in Equation 11,
In which, the expression of
3.2 Stress distribution around wellbore
The circumferential stress around the wellbore in laminated shale formations comprises two components: the stress concentration resulting from in situ stresses and the stress concentration due to material anisotropy. Applying the superposition principle, the analytical solution for the wellbore stress in shale, which accounts for the combined effect of these two components, is presented in Equation 13,
In which, in the Cartesian coordinate system,
The stress component in the column coordinate system can be conveniently expressed around the borehole by converting the stress to the column coordinate system. When Equation 13 is converted to the column coordinate system, the stress around the borehole of the layered shale reservoir can be simplified as Equation 14,
In which,
3.3 Model solution
Most strength criteria are typically expressed in terms of principal stresses. For ease of calculation, it is necessary to convert the wellbore stresses into principal stress form, as shown in Equation 15,
In which, Pp represents the pore pressure in MPa. By substituting the wellbore stress components from Equation 14 into Equation 15, the values of the principal stresses around the wellbore can be obtained.
According to uniaxial compressive strength experiments with different bedding angles, shale strength exhibits significant anisotropic characteristics. The PPW criterion better reveals the strength of shale with varying bedding angles. In this study, the JPW and PPW criteria are used as the discriminative criteria for the lower limit of the wellbore safe density window.
The analysis process is illustrated in Figure 8. By substituting the principal stresses around the wellbore into the selected criterion and employing an iterative method to solve them, the lower limit of the safe drilling fluid density window can be determined. This paper develops a computational program to calculate the lower limit of the safe density window for shale formations and investigates the influence of shale strength anisotropy and hydration time on the safe drilling fluid density window.
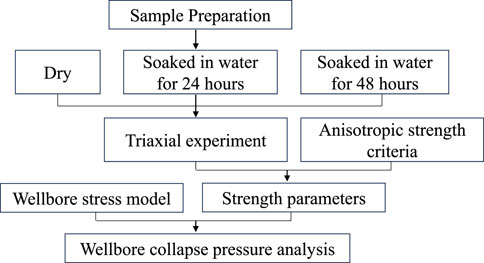
Figure 8. The Flowchart for lower critical mud weight analysis.
3.4 Model validation
To ensure the accuracy of the computational results in this study, it is necessary to validate the reliability of the solution program developed herein. In isotropic formations, the analytical expression for the circumferential stress around a horizontal well drilled along the direction of the maximum horizontal in situ stress is given by Equation 16,
The parameters from Table 3 were substituted into the isotropic formation wellbore stress model (Equation 16) and the transversely isotropic wellbore stress calculation model (Equation 14). For the transversely isotropic formation, assuming Ev = 23.443 GPa and vv = 0.1999, the transversely isotropic material approximates isotropy. If the computational results from both models are consistent, the accuracy of the solution program developed in this study can be verified. The specific computational results are shown in Figure 9. As illustrated in Figure 9, when the rock’s elastic mechanical parameters approximate isotropy, the results from the transversely isotropic model established in this study exhibit excellent agreement with those from the isotropic formation, confirming the rationality of the computational outcomes from the developed program. By integrating parameters such as in situ stress, wellbore orientation, rock elastic properties, and rock anisotropic strength in the study area, the wellbore stability of the region can be analyzed using the Newton-Raphson iterative method.
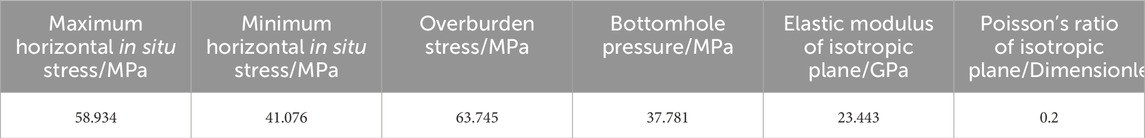
Table 3. In-situ stresses and mechanical properties for validation.
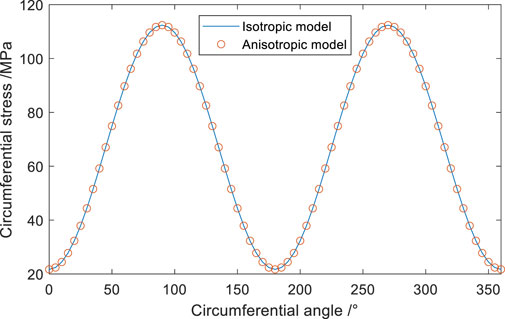
Figure 9. The Flowchart for lower critical mud weight analysis.
4 Results and discussions
4.1 Influence of anisotropic strength on collapse pressure
To assess the influence of bedding plane orientation and anisotropic strength characteristics on the minimum required drilling fluid density, this study employed a transversely isotropic wellbore stability model developed through theoretical analysis. Three distinct failure criteria (MC, JPW, and PPW) were implemented to generate comparative polar plots illustrating safe density thresholds for various wellbore trajectories. The numerical simulations incorporated material properties and geological parameters detailed in Table 4, enabling systematic evaluation of anisotropic rock behavior under different directional drilling conditions.
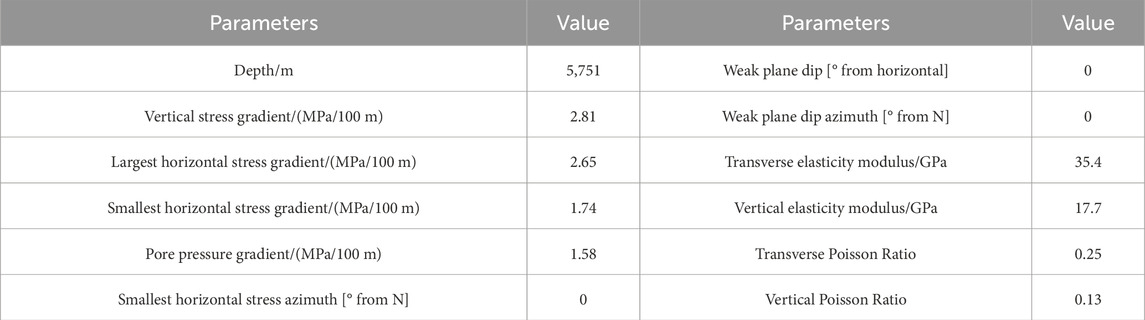
Table 4. Inputting parameters.
By applying the cohesion and internal friction angle parameters derived from the JPW criterion (Table 2) to the Mohr-Coulomb model, the resultant minimum safe density polar plot is generated as illustrated in Figure 10. This visualization employs a chromatic progression from deep blue to purple to denote increasing collapse pressure magnitudes within the polar coordinate system. The azimuthal axis (0°–360°) indicates wellbore orientation relative to principal stress directions, with 0° orientation aligning with the σH direction and 90° corresponding to σh. The radial dimension quantifies wellbore inclination from vertical (0°) at the center to horizontal (90°) at the periphery, establishing a systematic visualization framework for directional drilling optimization.
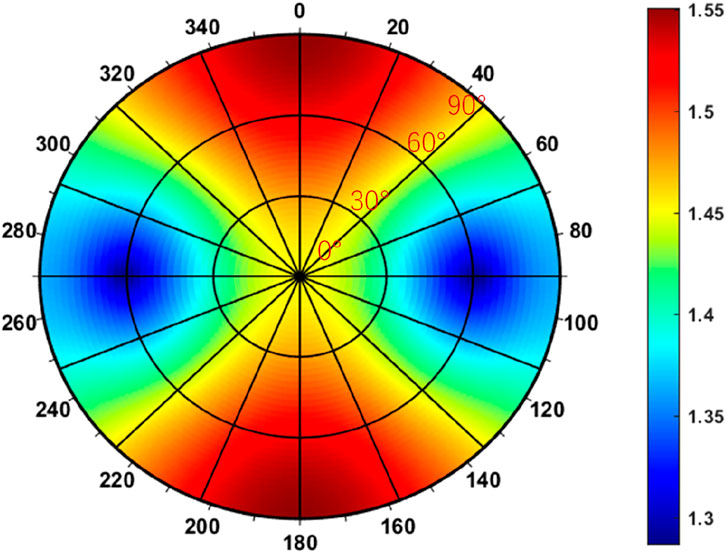
Figure 10. Polar plot of lower critical mud weight predicted by MC criterion.
From Figure 10, it can be observed that neglecting the influence of bedding planes on shale strength, using the MC criterion predicts a distribution range of safe drilling fluid density window lower limits from 1.3 to 1.55 g/mL. The cloud map exhibits a symmetrical distribution along the directions of maximum and minimum horizontal stress. The safe drilling fluid density is lower in the direction of minimum horizontal stress, reaching its minimum value around a well deviation angle of 60°, which indicates optimal wellbore wall stability at this angle. Conversely, in the direction of maximum horizontal stress, particularly at high well deviation angles, the safe drilling fluid density is higher, suggesting a greater risk of wellbore instability. Therefore, it is advisable to avoid drilling along this trajectory whenever possible.
Integrating the petro-mechanical parameters from Tables 2, 3, the polar plot of lower critical mud weight can be predicted. Figure 11 demonstrates the JPW criterion-derived polar plot of lower critical mud weight, revealing an operational range of 1.5–2.3 g/cm3 across all wellbore configurations. The observed orthotropic symmetry in contour patterns - aligned with maximum horizontal stress and minimum horizontal stress axes while orthogonal to vertical stress, stems from the horizontally stratified formation’s structural fabric. This bedding-induced anisotropy elevates the critical fluid density threshold by 18%–22% compared to MC criterion predictions, highlighting the destabilizing effect of interlayer slippage along weak planes. Mechanistically, this necessitates enhanced hydrostatic pressure compensation through increased mud weight to counteract potential shear failure along bedding surfaces. Concurrently, the optimization trajectory shifts significantly under anisotropic conditions. Parametric analysis identifies a stability sweet spot near 45° inclination within ±15° of σH direction, where fluid density requirements reach minimal values (1.52–1.58 g/cm3). This optimal trajectory cluster demonstrates the critical balance between borehole orientation and formation weakness plane geometry, providing operational guidance for directional drilling in laminated formations.
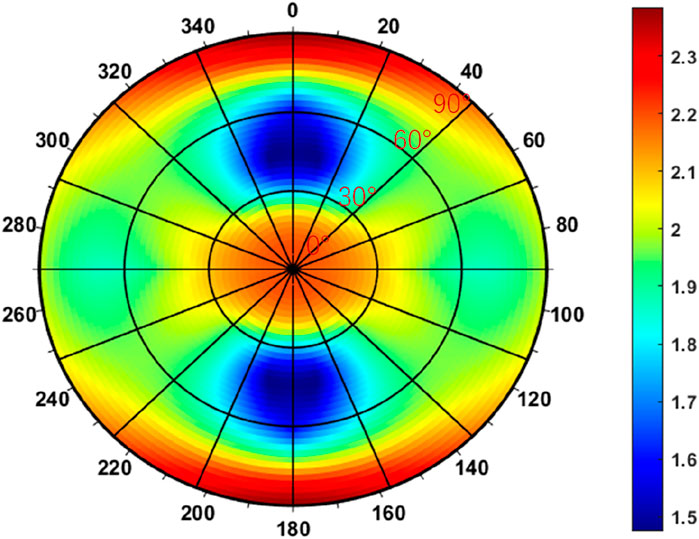
Figure 11. Polar plot of lower critical mud weight predicted by JPW criterion.
Employing comparative analysis methodology, Figure 12 contrasts the PPW criterion’s predictive capacity against previously discussed failure models in borehole instability assessment. The computed stability threshold demonstrates a reduced critical density range (1.42–2.2 g/cm3) compared to JPW predictions, revealing divergence in magnitude while maintaining consistent trend alignment across wellbore orientations. This parametric discrepancy originates from the PPW criterion’s distinct treatment of bedding plane failure mechanisms, where reduced interfacial shear resistance lowers required mud weights despite similar trajectory-dependent behavior patterns. Mechanistically, the bedding-induced stress reorientation effect fundamentally redistributes collapse pressure concentrations, shifting optimal drilling alignment from minimum horizontal stress to maximum horizontal stress domains. This geo-mechanical response manifests as distinct failure envelopes in polar plots, characterized by 25%–30% pressure magnitude variations between anisotropic criteria versus isotropic assumptions. Notably, while bedding plane geometry dominates directional sensitivity, inter-criterion differences primarily affect absolute pressure values rather than distribution trends, a critical insight for operational prioritization in laminated reservoirs. Technical implications emerge in three aspects, anisotropy magnitude dictates required mud weight increments, stress trajectory optimization achieves 18%–22% density reduction through σH proximal drilling; criterion selection introduces ±7% uncertainty in collapse pressure estimates, necessitating laboratory-calibrated model validation for field applications.
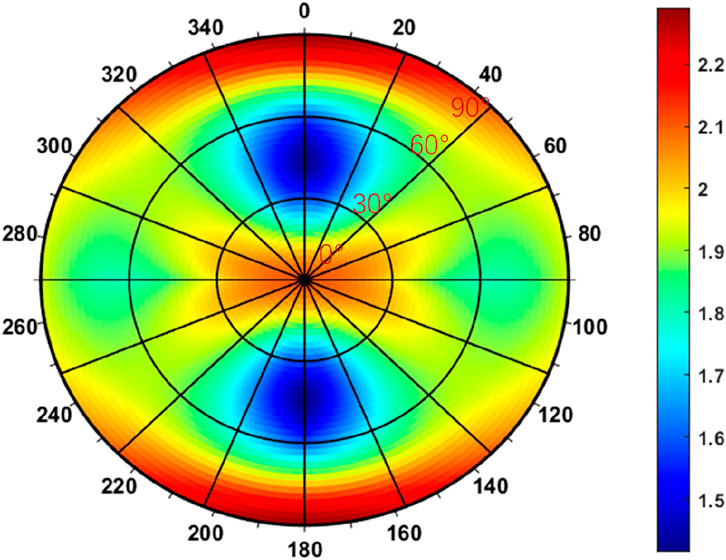
Figure 12. Polar plot of lower critical mud weight predicted by PPW criterion.
4.2 Influence of water on collapse pressure
Shale formations exhibit significant hydro-chemical sensitivity due to their stratified structure containing abundant clay minerals, including montmorillonite, illite, chlorite, and illite-montmorillonite interstratified minerals. The crystalline characteristics of these phyllosilicates drive spontaneous hydration reactions upon water contact, triggering volumetric expansion and microstructural damage through particle loosening and fracture initiation. This physicochemical process fundamentally alters formation integrity through dual mechanisms: elevated pore pressure generation and progressive degradation of mechanical parameters. Specifically, hydration effects manifest as 18%–22% reduction in elastic modulus, 25%–30% cohesion loss, 3°–5° decrease in internal friction angle, and 15%–20% increase in Poisson’s ratio, with time-dependent strength deterioration following logarithmic decay patterns. As demonstrated in Section 2.2, the PPW criterion outperforms the JPW model in predicting hydrated shale strength across variable moisture contents and bedding orientations. Utilizing the experimental parameters from Tables 2, 3, this study applies the PPW criterion to quantitatively analyze the temporal evolution of safe drilling fluid density thresholds. The hydration-dependent stability limits corresponding to 24-h and 48-h water immersion periods are systematically compared in Figures 13, 14, revealing critical time-sensitive patterns in wellbore integrity maintenance.
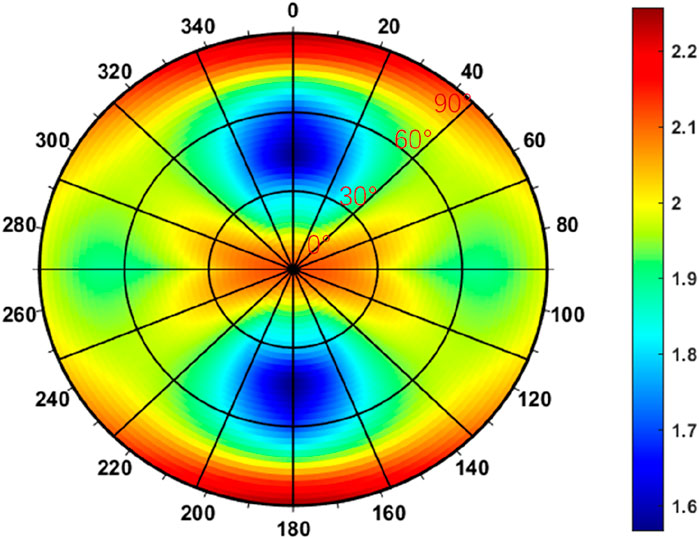
Figure 13. The lower limit of the safe drilling fluid density window after the borehole was drilled 24 h.
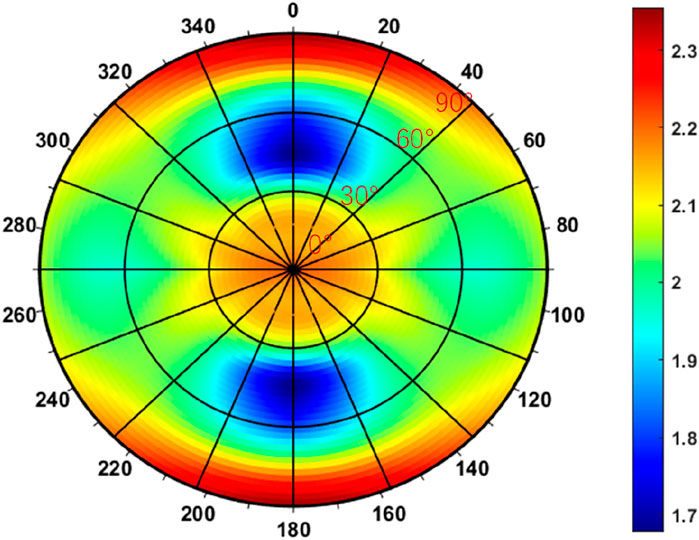
Figure 14. The lower limit of the safe drilling fluid density window after the borehole was drilled 48 h.
Figures 13, 14 reveal that shale hydration primarily alters the rock’s mechanical properties (cohesion and internal friction angle) while maintaining consistent horizontal bedding orientation. This preservation of structural alignment results in sustained symmetrical stress distribution patterns along the maximum and minimum horizontal stress axes. The drilling fluid density window shows progressive expansion with prolonged fluid-rock interaction, pre-contact conditions (Figure 12) indicate a stable density range of 1.42–2.2 g/mL; after 24-h exposure (Figure 13), the operational window shifts to 1.6–2.26 g/mL; following 48-h interaction (Figure 14), the required density increases to 1.7–2.3 g/mL. This temporal progression demonstrates a direct correlation between drilling fluid exposure duration and wellbore instability risks, with collapse pressure elevation averaging 0.28 g/mL over 48 h of shale hydration. The data underscores the critical importance of time-dependent rock-fluid interactions in wellbore stability calculations, particularly highlighting how hydration-induced mechanical degradation progressively compromises formation integrity.
Figure 15 quantifies the time-dependent evolution of the lower safe drilling fluid density window along different well trajectories, revealing distinct patterns in wellbore stability. Vertical and horizontal wells exhibit minimal sensitivity to drilling fluid exposure duration, whereas deviated wells demonstrate significant time-dependent instability. At 40° deviation, the critical mud weight increases by 0.154 g/mL after 24 h and 0.276 g/mL after 48 h compared to dry conditions, while at 20° deviation, a 0.279 g/mL elevation occurs between 24- and 48-h exposures. Although contact duration minimally affects the general trend of collapse pressure versus deviation angle, the lower density limit along the maximum horizontal stress direction follows a characteristic U-shaped curve, initially decreasing before rising with increasing deviation. Horizontal wells drilled along the minimum horizontal stress axis (Figure 16) display a sinusoidal azimuthal variation in lower critical mud weight, showing 23% greater sensitivity to fluid exposure time compared to those aligned with the maximum horizontal stress. This directional disparity highlights how stress orientation modulates hydration effects, with maximum horizontal stress alignment reducing azimuthal collapse pressure fluctuations by 18%. The findings collectively emphasize the critical interdependence between well trajectory geometry, stress field orientation, and time-dependent rock-fluid interactions in shale formation stability.
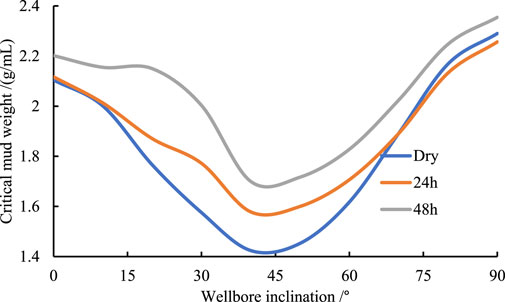
Figure 15. The lower limit of safe drilling fluid density for borehole drilled in maximum horizontal in situ stress direction with different inclinations.
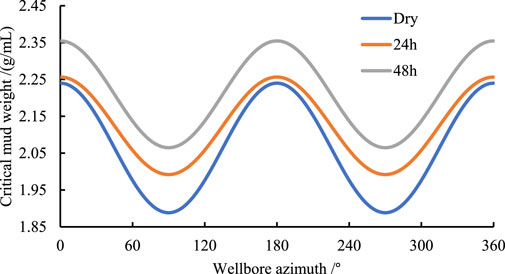
Figure 16. Lower limit of safe drilling fluid density for horizontal well with different azimuths.
Through the research, the following measures can be implemented to enhance wellbore stability. Adjusting the angle between the wellbore axis and the normal to the bedding plane, i.e., drilling up dip along the bedding plane is more conducive to wellbore stability; enhancing sealing to reduce filtrate invasion into the formation; adding inhibitors to the drilling fluid to lower its activity; employing oil-based drilling fluids to suppress rock hydration.
5 Conclusion
Sustaining the stability of wellbore in unconventional shale plays presents significant technical challenges due to the inherent characteristics of well-bedded shale formations and their pervasive anisotropy, which exhibit mechanical properties consistent with transverse isotropy. Shales are also rich in clay minerals that undergo chemical reactions upon contact with water, leading to the expansion of mineral particles. To understand the mechanisms of wellbore instability in laminated shale formations and to clarify the effects of hydration time and bedding on shale strength and wellbore stability, this study conducted laboratory experiments to measure the strength of laminated shale under different hydration durations. The results were fitted using JPW and PPW criteria to determine rock strength parameters. Based on the transversely isotropic wellbore stress model, the study analyzed the effects of strength anisotropy and hydration time on wellbore collapse pressure. The research findings indicate that rock strength initially increases with increasing bedding dip angle β and then decreases. Within the range of β1 to β2, both JPW and PPW criteria predict shale strength effectively. However, when the bedding dip angle is below β1, JPW criteria overestimate shale strength, while PPW criteria still capture the trend of shale strength with bedding dip angle. Anisotropic strength caused by bedding significantly increases wellbore collapse pressure. The optimal well trajectory shifted from the direction of minimum horizontal stress to the direction of maximum horizontal stress, resulting in significant changes in the distribution characteristics of wellbore collapse pressure maps. Additionally, different criteria for strength anisotropy had a minimal impact on the variation trend of wellbore collapse pressure with well trajectory. Shale hydration can significantly affect wellbore stability and the lower safe drilling mud window, as the contact time between drilling fluid and formation rocks increases, the lower safe drilling fluid density window gradually increases. Vertical or horizontal wells are less affected by drilling fluid immersion time in terms of wellbore collapse pressure, whereas deviated wells are more significantly impacted. Compared to horizontal wells drilled in the direction of maximum horizontal stress, those drilled in the direction of minimum horizontal stress exhibit greater sensitivity of wellbore collapse pressure to drilling fluid contact time, resulting in a faster increase in collapse pressure. Future research should prioritize machine learning-driven dynamic risk assessment, nanomaterial-enhanced intelligent drilling fluids, multi-physics coupled wellbore instability prediction models, and real-time wellbore instability monitoring technologies. These advancements will shift wellbore stability management from passive mitigation to proactive prediction and intelligent control, ultimately enhancing safety, efficiency, and sustainability in oil and gas development.
Data availability statement
The original contributions presented in the study are included in the article/supplementary material, further inquiries can be directed to the corresponding author.
Author contributions
YZ: Conceptualization, Data curation, Formal Analysis, Funding acquisition, Investigation, Methodology, Project administration, Resources, Software, Supervision, Validation, Visualization, Writing – original draft, Writing – review and editing. XD: Conceptualization, Data curation, Formal Analysis, Funding acquisition, Investigation, Methodology, Project administration, Resources, Software, Supervision, Validation, Visualization, Writing – original draft, Writing – review and editing. DJ: Conceptualization, Data curation, Formal Analysis, Funding acquisition, Investigation, Methodology, Project administration, Resources, Software, Supervision, Validation, Visualization, Writing – original draft, Writing – review and editing.
Funding
The author(s) declare that no financial support was received for the research and/or publication of this article.
Conflict of interest
Author DJ was employed by Daqing Oilfield Kaipu Chemical Co. LTD.
The remaining authors declare that the research was conducted in the absence of any commercial or financial relationships that could be construed as a potential conflict of interest.
Generative AI statement
The author(s) declare that no Generative AI was used in the creation of this manuscript.
Publisher’s note
All claims expressed in this article are solely those of the authors and do not necessarily represent those of their affiliated organizations, or those of the publisher, the editors and the reviewers. Any product that may be evaluated in this article, or claim that may be made by its manufacturer, is not guaranteed or endorsed by the publisher.
References
Aadnoy, B. S., and Chenevert, M. E. (1987). Stability of highly inclined boreholes. SPE Drill. Eng., 2: 364–374. doi:10.2118/16052-PA
Al-Ajmi, A. M., and Zimmerman, R. W. (2005). Relation between the mogi and the coulomb failure criteria. Int. J. Rock Mech. Min. Sci. 42 (3), 431–439. doi:10.1016/j.ijrmms.2004.11.004
Bai, Y., Li, D. X., Li, W. Z., Li, H. B., and Luo, P. Y. (2022). Drilling fluid technology for wellbore stability in horizontal sections of Longmaxi Formation, Changning Block. J. Southwest Petroleum Univ. Nat. Sci. Ed. 44 (2), 79–88.
Cheng, Y., Song, Z., Wu, F., Zhu, X., and Yuan, W. (2024). Investigating the mechanical deterioration effect of hard sandstone induced by layer structure under uniaxial compression. Buildings 14 (1), 51. doi:10.3390/buildings14010051
Ding, L., Wang, Z., Lv, J., Wang, Y., and Liu, B. (2021). A new model for real-time prediction of wellbore stability considering elastic and strength anisotropy of bedding formation. Energies 15 (1), 251. doi:10.3390/en15010251
Ding, Y., Liu, X., and Luo, P. (2020). The analytical model for horizontal wellbore stability in anisotropic shale reservoir. Geotechnical Geol. Eng. 38 (2), 5109–5126. doi:10.1007/s10706-020-01351-0
Dong, Z., Tian, S., Xue, H., Lu, S., Liu, B., Erastova, V., et al. (2025). A novel method for automatic quantification of different pore types in shale based on SEM-EDS calibration. Mar. Petroleum Geol., 173: 107278. doi:10.1016/j.marpetgeo.2024.107278
Fjær, E., Holt, R. M., Horsrud, P., Raaen, A. M., and Risnes, and R. (2008). Petroleum related rock mechanics. 2nd Edition. Amsterdam: Elsevier, 309–313.
Gao, C., and Gray, K. E. (2019). A workflow for infill well design: wellbore stability analysis through a coupled geomechanics and reservoir simulator. J. Petroleum Sci. Eng. 176, 279–290. doi:10.1016/j.petrol.2018.12.077
Gao, J., Odunlami, T., and Osayande, N. (2014). “Shale bedding impact on wellbore stability and drilling optimization,” in SPE/CSUR unconventional resources conference (Canada: Society of Petroleum Engineers).
Gao, R., Kuang, T., Meng, X., and Huo, B. (2021). Effects of ground fracturing with horizontal fracture plane on rock breakage characteristics and mine pressure control. Rock Mech. Rock Eng. 54 (6), 3229–3243. doi:10.1007/s00603-020-02294-x
Germanovich, L. N., and Dyskin, A. V. (2000). Fracture mechanisms and instability of openings in compression. Int. J. Rock Mech. Min. Sci. 37 (1-2), 263–284. doi:10.1016/s1365-1609(99)00105-7
Gholami, R., Moradzadeh, A., Rasouli, V., and Hanachi, J. (2013). Practical application of Failure criteria in determining safe mud weight windows in drilling operations. J. Rock Mech. Geotech. Eng. 55, 1–13.
Han, Z., Liu, H., Zhang, J., Yang, H., Shen, X., and Yang, Q. (2020). Study on mechanical properties and wellbore stability of deep brittle shale. Special Oil & Gas Reservoirs 27 (5), 167–174.
He, S., Wei, W., Zhou, J., Zhen, H., and Ming, T. (2015). A model for analysis of wellbore stability considering the effects of weak bedding planes. J. Nat. Gas Sci. & Eng. 27 (part_P2), 1050–1062.
Higgins, S. M., Goodwin, S. A., Bratton, T. R., and Tracy, G. W. (2008). “Anisotropic stress models improve completion design in the Baxter Shale,” in SPE annual technical conference and exhibition (Richardson, TX: Society of Petroleum Engineers).
Hong, L., Liu, Q., Chen, Q., Wang, S., and Wang, L. (2013). Factors influencing wellbore stability and technical countermeasures in shale gas horizontal wells. Sci. Technol. & Eng. (32), 9598–9603.
Jamshidi, E., Kianoush, P., Hosseini, N., and Adib, A. (2024). Scaling-up dynamic elastic logs to pseudo-static elastic moduli of rocks using a wellbore stability analysis approach in the Marun oilfield, SW Iran. Sci. Rep. 14 (1), 19094. doi:10.1038/s41598-024-69758-w
Junyang, T., Tang, J., Zhang, Y., Duan, J., and Wang, J. (2017). Damage and failure process and characteristics of layered water-bearing shale under uniaxial compression. Rock Soil Mech. 38 (6), 1629–1638. doi:10.16285/j.rsm.2017.06.011
Kanfar, M. F., Chen, Z., and Rahman, S. S. (2015). Effect of material anisotropy on time-dependent wellbore stability. Int. J. Rock Mech. Min. Sci. 78, 36–45. doi:10.1016/j.ijrmms.2015.04.024
Lee, H., Ong, S. H., Azeemuddin, M., and Goodman, H. (2012). A wellbore stability model for formations with anisotropic rock strengths. J. Petroleum Sci. Eng. 96, 109–119. doi:10.1016/j.petrol.2012.08.010
Lekhnitskii, S. G. (1963). On the problem of the elastic equilibrium of an anisotropic strip. J. Appl. Math. Mech. 27 (1), 197–209. doi:10.1016/0021-8928(63)90106-0
Li, Y., and Weijermars, R. (2019). Wellbore stability analysis in transverse isotropic shales with anisotropic failure criteria. J. Petroleum Sci. Eng. 176, 982–993. doi:10.1016/j.petrol.2019.01.092
Li, Y., Cheng, Y. F., Yan, C. L., Wang, Z. Y., and Zhang, Q. X. (2022). Multi-physical field coupling model and wellbore collapse analysis in hydrate formation of Shenhu area, South China Sea. J. Cent. South. Univer. Natu. Sci. Edi. 53 (3), 976–990.
Liu, H., Liu, Q., Chen, Q., Wang, S., and Wang, L. S. (2013). Influencing factors and technical countermeasures for wellbore stability in shale gas horizontal wells. Sci. Techno. Enginee. (32), 9598–9603
Liu, M., Jin, Y., Lu, Y., Chen, M., Hou, B., Chen, W., et al. (2016). A wellbore stability model for a deviated well in a transversely isotropic formation considering poroelastic effects. Rock Mech. Rock Eng. 49 (9), 3671–3686. doi:10.1007/s00603-016-1019-8
Liu, Z., Hai, Xu, Gongrang, Li, Zhang, J., and Lv, J. (2022). Nanoparticle mineralization deposition and enhancement of drilling wellbore stability. Oilfield Chem. 29 (2), 39–45.
Lu, Y. H., Chen, M., Jin, Y., and Zhang, G. Q. (2012). A mechanical model of borehole stability for weak plane formation under porous flow. Petroleum Sci. Technol. 30 (15), 1629–1638. doi:10.1080/10916466.2010.514583
Meng, M., Chen, P., and Ren, R. (2019). Statistic evaluation of failure criteria in wellbore stability with temperature effects. Fuel, 252: 730–752. doi:10.1016/j.fuel.2019.04.110
Mitchell, R. F., and Miska, S. Z. (2011). Fundamentals of drilling engineering. SPE Textb. Ser. 12, 89–90.
Ning, Z., Yin, F., Han, M., Jia, L., Liao, Z., Shi, B., et al. (2022). Study on the law of micro-crack propagation and collapse mechanism of wellbore based on phase-field method. Drill. and Prod. Technol. 45 (2), 8–14.
Nwonodi, R. I., Okoro, E. E., and Dosunmu, A. (2023). An equivalent time-dependent analysis for predicting horizontal wellbore instability in a reactive shale formation using the imbibition/diffusion principle. Geoenergy Sci. Eng. 228 (2023), 212019. doi:10.1016/j.geoen.2023.212019
Ong, S. H., and Roegiers, J. C. (1996). Fracture initiation from inclined wellbores in anisotropic formations. J. Petroleum Technol. 48 (7), 612–619. doi:10.2118/29993-MS
Ottesen, S. (2010). “Wellbore stability in fractured rock,” in IADC/SPE drilling conference and exhibition (Richardson, TX: Society of Petroleum Engineers).
Pirhadi, A., Kianoush, P., Ebrahimabadi, A., and Shirinabadi, R. (2023). Wellbore stability in a depleted reservoir by finite element analysis of coupled thermo-poro-elastic units in an oilfield, SW Iran. Results Earth Sci. 1, 100005. doi:10.1016/j.rines.2023.100005
Pirhadi, A., Kianoush, P., Varkouhi, S., Shirinabadi, R., Shirazy, A., Shirazi, A., et al. (2025). Thermo-poroelastic analysis of drilling fluid pressure and temperature on wellbore stresses in the Mansouri oilfield, SW Iran. Results Earth Sci. 3, 100061. doi:10.1016/j.rines.2025.100061
Qi, Y., Chen, S., Hai, Li, Yudong, T., Bing, Li, and Xinan, Li (2022). Mechanism of wellbore instability in horizontal wells in the paleolong formation, songliao basin. Petroleum Geol. Oilfield Dev. 41 (3), 147–155.
Rui, G., Bai, D., Yu, B., Tai, Y., Meng, X., and Zhang, W. (2024). Ground fracturing of multi-strata for strong ground pressure control in extra-thick coal seams with hard roofs: numerical simulation and case study. Eng. Fract. Mech. 303, 110129. doi:10.1016/j.engfracmech.2024.110129
Serajian, V., and Ghassemi, A. (2011). Hydraulic fracture initiation from a wellbore in transversely isotropic rock. Clin. Infect. Dis. 52 (9), 1108–1115.
Vahid, S., and Ahmad, G. (2011). “Hydraulic fracture initiation from a wellbore in transversely isotropic rock,” in 45th US rock mechanics/geomechanics symposium (American Rock Mechanics Association).
Wang, L. (2019). Study on hydration damage mechanisms in shale and wellbore stability [doctoral dissertation]. Chengdu, China: Southwest Petroleum University.
Westergaard, H. M. (1940). Plastic state of stress around a deep well. J. Boston Soc. Civ. Eng. 27, 1–5.
Willson, S. M., Edwards, S. T., Crook, A. J., Bere, A., Moos, D., Peska, P., et al. (2007). “Assuring stability in extended reach wells-analyses, practices and mitigations,” in SPE/IADC drilling conference (Richardson, TX: Society of Petroleum Engineers).
Wu, W., Wang, T., Bai, J., Liu, J., Wang, X., Xu, H., et al. (2024). Failure characteristics and cooperative control strategies for gob-side entry driving near an advancing working face: a case study. Processes 12, 1398. doi:10.3390/pr12071398
Xing, X., Zhou, C., and Cao, W. (2021). Wellbore stability analysis considering rock strain softening characteristics. J. Changzhou Univ. Nat. Sci. Ed. 33 (6), 58–61.
Yang, L, Yuanfang, C., Chuanliang, Y., Zhiyuan, W., and Qingxuan, Z. (2022b). Coupled multi-physical field model of gas hydrate reservoir and analysis of wellbore collapse law in Shenhu area, South China Sea. J. Central South Univ. Nat. Sci. Ed. 53 (3), 976–990.
Yang, X., Cai, J., Jiang, G., Shi, Y., and Chen, S. (2022c). Experimental study on the effect of drilling fluid water activity on wellbore stability in shale: a case study of Xiu Shan Longmaxi shale. Drill. Eng.
Zhang, J. (2013). Borehole stability analysis accounting for anisotropies in drilling to weak bedding planes. Int. J. Rock Mech. Min. Sci. 60 (2), 160–170. doi:10.1016/j.ijrmms.2012.12.025
Zhang, M., Fan, X., Zhang, Q., Yang, B., Zhao, P., Yao, B., et al. (2020). Parametric sensitivity study of wellbore stability in transversely isotropic medium based on poly-axial strength criteria. J. Petroleum Sci. Eng. 197 (3), 108078. doi:10.1016/j.petrol.2020.108078
Zhang, M., Fan, X., Zhang, Q., Yang, B., Zhao, P., Yao, B., et al. (2021a). Influence of multi-planes of weakness on unstable zones near wellbore wall in a fractured formation. J. Nat. Gas Sci. Eng. 93, 104026. doi:10.1016/j.jngse.2021.104026
Zhang, M., Fan, X., Zhang, Q., Yang, B., Zhao, P., Yao, B., et al. (2021b). Parametric sensitivity study of wellbore stability in transversely isotropic medium based on poly-axial strength criteria. J. Petroleum Sci. Eng. 197, 108078. doi:10.1016/j.petrol.2020.108078
Zhang, M., Li, D., Liu, J., Zhang, D., Zhang, Y., and Cui, K. (2023). The modification of Mohr-Coulomb criteria based on shape function and determination method of undetermined parameters. Mech. Mater. 185, 104772. doi:10.1016/j.mechmat.2023.104772
Zhang, M., Wen, J., Xu, Z., Feng, J., and Zhao, X. (2024). Study of borehole stability of volcanic rock formation with the influence of multiple factors. J. Petrol Explor Prod. Technol. 14, 3367–3382. doi:10.1007/s13202-024-01845-0
Zhang, M. M., Liang, L. X., and Liu, X. J. (2017). Analysis of the influence of different rock shear failure criteria on wellbore collapse pressure. Chin. J. Rock Mech. Eng. 36 (S1), 3485–3491.
Zhang, W., Gao, J., Lan, K., Liu, X., Feng, G., and Ma, Q. (2015). Analysis of borehole collapse and fracture initiation positions and drilling trajectory optimization. J. Petroleum Sci. Eng. 129, 29–39. doi:10.1016/j.petrol.2014.08.021
Zhang, Z., Wan, X., Wu, P., Zhengtao, Li, and Wen, Li (2022). “Analysis of the causes and countermeasures of deep shale wellbore instability in Longmaxi Formation, southern Sichuan Basin,” in Special oil gas reservoirs.
Keywords: hydration, wellbore stability, transversely isotropic, strength criteria, shale
Citation: Zhang Y, Du X and Jiang D (2025) Evaluating water-induced wellbore instability in shale formations: a comparative analysis of transversely isotropic strength criteria. Front. Earth Sci. 13:1550266. doi: 10.3389/feart.2025.1550266
Received: 23 December 2024; Accepted: 24 March 2025;
Published: 17 April 2025.
Edited by:
Weiyao Guo, Shandong University of Science and Technology, ChinaReviewed by:
Zhanping Song, Xi’an University of Architecture and Technology, ChinaPooria Kianoush, Islamic Azad University South Tehran Branch, Iran
Copyright © 2025 Zhang, Du and Jiang. This is an open-access article distributed under the terms of the Creative Commons Attribution License (CC BY). The use, distribution or reproduction in other forums is permitted, provided the original author(s) and the copyright owner(s) are credited and that the original publication in this journal is cited, in accordance with accepted academic practice. No use, distribution or reproduction is permitted which does not comply with these terms.
*Correspondence: Xuejia Du, eGR1OEBjZW50cmFsLnVoLmVkdQ==