Abstract
The Lihong Road area in Litong District, Wuzhong City, Ningxia, is highly prone to debris flow disasters due to its steep topography, loose surface materials, and frequent extreme rainfall. This study investigates the formation mechanisms and hazard dynamics of debris flows in this area, with particular attention to both natural factors and anthropogenic influences, such as sand mining. A key innovation of this research lies in integrating terrain modification effects into FLO-2D numerical simulations under varying rainfall scenarios. The results reveal that intense precipitation, steep slopes, and abundant loose materials primarily contribute to debris flow initiation. Simulations show that human-induced topographic changes significantly alter flow patterns and exacerbate risk. The study identifies a critical rainfall threshold of 130.86 mm and a 1-h triggering intensity of 50.86 mm. Hazard zoning based on flow velocity, deposition depth, and inundation range highlights the region’s vulnerability, especially around infrastructure and farmland. This work provides a scientific basis for early warning, engineering mitigation, and regional disaster prevention strategies.
1 Introduction
Debris flow is a common and highly destructive geological disaster in mountainous, hilly, and plateau areas (He et al., 2025; Cui et al., 2013; Zhou et al., 2022). Heavy rainfall, snowmelt, earthquakes, or human activities typically trigger it. Debris flows move at high speeds and possess destructive solid power, often causing rapid destruction of surrounding ecosystems and infrastructure and endangering the lives and property of residents (Moos et al., 2018; Hürlimann et al., 2019; Huang et al., 2020; Li et al., 2023). The Lihong Road area in Litong District, Wuzhong City, Ningxia, is particularly vulnerable to such events due to its steep terrain, loose surface materials, and frequent extreme rainfall. Debris flows in this region have been a subject of some geological studies. Still, understanding their formation mechanisms remains incomplete, especially regarding the combined effects of local topography, precipitation patterns, and human activities.
Current research on debris flow formation mechanisms has primarily focused on the influence of topography and precipitation (Wang et al., 2020; Jiang et al., 2022; Pang et al., 2022). Steep slopes, narrow valleys, and intense rainfall events are recognized as primary drivers of debris flow initiation and propagation (Iverson, 1997). Studies have shown that the erosion of unstable slopes, especially after intense rainfall, can mobilize loose soil and sediment, leading to debris flow (Borga et al., 2014; Wei et al., 2025; Yan et al., 2020; Yan et al., 2024; Yu B. et al., 2016). In addition, human activities such as sand mining, road construction, and land-use changes have been found to exacerbate debris flow risks by altering natural water flow paths and destabilizing the terrain (Gan B. R. et al., 2018). A comprehensive understanding of these risks allows local governments to proactively implement land use planning, disaster prevention, mitigation measures, and emergency response plans, thereby reducing the damage to ecosystems, the social economy, and people’s lives and property during a disaster (Xu et al., 2014; Zou et al., 2018; Li Z. et al., 2021; Ding X. Y. et al., 2023; Kumar et al., 2024). However, a comprehensive understanding of how these factors influence debris flow formation in the Lihong Road area is still lacking.
Various models have been developed using numerical simulation methods to predict debris flow behavior. Among the most widely used is the FLO-2D model, which simulates debris flow dynamics by solving mass and momentum equations for flow velocity, depth, and sediment transport (Di et al., 2008; Jo and Jun, 2022; Ding W. et al., 2023; Zhang et al., 2023; Guo et al., 2024; Jia et al., 2024). This method has been successfully applied in similar mountainous areas to assess the risk and predict the impact of debris flows (Santi et al., 2011). Other models, such as the RAMMS (Rapid Mass Movement Simulation) and SHALSTAB, have been employed to simulate slope stability and debris flow initiation (Schneider et al., 2014; Iverson and George, 2016). However, most studies focus on individual factors or isolated regions, and there is a gap in integrating both natural and anthropogenic factors in a unified model for debris flow risk assessment (Iverson, 2015).
This study aims to fill this gap by providing a detailed investigation of debris flow formation mechanisms and conducting a comprehensive risk assessment using the FLO-2D model. The basic data are sourced from the National Meteorological Science Data Center, the Geospatial Data Cloud, and local geological surveys. We systematically examine the roles of topography, precipitation, sediment availability, and anthropogenic activities—including sand mining and land use changes—in shaping debris flow processes in the Lihong Road area. A key innovation of this study lies in its integration of both natural and human-induced factors into a unified simulation framework. Previous studies have often analyzed these elements in isolation, limiting the accuracy of hazard predictions. By simulating debris flow behavior under various rainfall scenarios and comparing pre- and post-disturbance terrain conditions, we quantitatively assess the impact of human-modified landforms on debris flow dynamics. In particular, the influence of large artificial pits formed by sand mining is modeled to evaluate their role as storage sinks and risk amplifiers. This research not only enhances our understanding of the dynamic interactions contributing to debris flow risk in semi-arid, loess-covered terrains, but also provides critical insights for designing early warning systems and mitigation measures. The proposed methodology offers a transferable approach for similar hazard-prone regions undergoing rapid human transformation.
2 Debris flow characteristics
2.1 Overview of the study area
The Lihong Road area, located in the west of K27+200m of Lihong Road in Sunjiatan Development Zone, Biandangou Town, Litong District, Wuzhong City, Ningxia, is situated in a region characterized by a combination of complex geological formations and dynamic environmental conditions that significantly contribute to the occurrence and severity of debris flows (Figure 1). The area is part of the Loess Plateau, known for its unique geomorphological features, including steep slopes, deep gullies, and loose, weathered soil layers. These geological conditions and the area’s susceptibility to extreme weather events make the Lihong Road region a hotspot for debris flow activity. The topography of the Lihong Road area is marked by steep slopes with an average gradient of 25°–45°, which are typical of mountainous regions. These slopes are often V-shaped, formed by the erosion of gully valleys that cut through the landscape. The steepness of these slopes, coupled with the narrowness of the valleys, promotes the rapid convergence of surface water during rainfall, increasing the potential for erosion and sediment transport. The region’s high elevation variations, with altitudes ranging from 1,000 to 1,500 m above sea level, also enhance the gravitational force that drives debris flows downhill.
FIGURE 1

Overview map of debris flow on Lihong Road, Litong District, Wuzhong City.
The Lihong Road area is characterized by highly weathered rock with well-developed joints and fissures, which are prone to physical weathering due to thermal expansion and contraction. This process gradually causes the rocks to break and peel away, generating large amounts of loose material, particularly at the foot of the slopes and in the gentler areas along the gully. Loose debris, such as rock fragments and gravel, are easily washed into the valley by water flow, becoming the primary solid material source for debris flows. The occurrence of debris flows follows a periodic and fluctuating pattern, driven by the accumulation of seasonal precipitation and the continuous buildup of loose material on the slopes. The degree of weathering is influenced by factors such as rainfall intensity, climate changes, topography, vegetation cover, and human activities (Chen and Chen, 2022; Zhao et al., 2022; Niu et al., 2023; Zhu et al., 2024).
The hydrological conditions in the area are significantly influenced by the seasonal rainfall patterns. The region experiences concentrated rainfall from June to August, with extreme precipitation events occurring during this period. These heavy rainstorms rapidly saturate the soil, reducing the stability of the slopes and increasing the likelihood of slope failure. The combination of steep topography, loose soil, and intense rainfall creates an ideal environment for the initiation of debris flows, especially in the gully valleys where sediment is easily mobilized. Human activities, such as sand mining, road construction, and agricultural development, have further altered the natural geological conditions in the Lihong Road area. Sand mining, in particular, has removed large amounts of loose material from the slopes, reducing their stability and increasing the amount of sediment available to contribute to debris flows. Additionally, infrastructure development, including roads and buildings, has disturbed the natural flow paths of water, often diverting water and sediment accumulation towards specific areas, further exacerbating the risk of debris flows.
2.2 Formation analysis for debris flow
In the Lihong Road debris flow channel, the type of debris flow is dilute debris flow, with the primary hazards being erosion and inundation (Lee et al., 2022). The formation of debris flows in the Lihong Road area results from multiple factors, including topography, material sources, and precipitation (Long et al., 2020; Cao et al., 2021; Zhao et al., 2022). Firstly, the topographic conditions provide a favorable foundation for debris flow formation. Well-developed gullies and significant topographic relief characterize the area. The gullies are mainly “V” shaped with steep slopes, approximately 45°, and the large drainage area causes water to converge quickly, making the area prone to intense flooding (Figure 2). The upstream region has low slope integrity, and the bedrock is highly weathered, forming large amounts of loose material. During heavy rainfall, this material is easily washed into the gully, becoming a key source of debris flow material (Figure 3). The deposition area at the gully’s mouth is relatively flat, and Lihong Road runs through this region. Although the impact of debris flows here is relatively small, the existence and continuous accumulation of sediment layers still present a potential risk for debris flow formation.
FIGURE 2

Photo of the “V” shaped valley.
FIGURE 3

The slope has obvious traces of rain erosion, and the soil is loose.
Secondly, the material source conditions are the primary source of debris flow supply. The surface of the slopes in this area is covered with a layer of loose sandy soil and gravel, with an average thickness of about 0.5 m. Beneath this layer, the underlying strata mainly consist of highly weathered mudstone and sandstone. Over time, the slopes on both sides of the gully have been subjected to extensive weathering, causing the surface rocks and soils to be quickly eroded and washed away by rainwater, leading to localized phenomena such as collapses and landslides. The loose materials continue to accumulate in the gully bed. Furthermore, the gully bed is mudstone, easily eroded by water flow, further exacerbating the material supply. Precipitation conditions are also a critical triggering factor for debris flow formation. According to the data of wuzhong Meteorological Bureau, the average precipitation for many years is 228 mm. Rainfall varies greatly from year to year, with the maximum monthly rainfall of 91.8 mm. Rainfall is mainly concentrated from June to August, accounting for more than 70% of the annual rainfall, and it mostly appears in the form of rainstorms, which have the characteristics of short duration, high intensity, and concentration. In particular, during heavy rain, the rapid accumulation of water triggers debris flows, providing sufficient water volume and erosive power to support debris flow formation in this region (Simoni et al., 2020; Thouret et al., 2020; Walter et al., 2020; Xiong et al., 2021).
Watershed morphology, channel features, solid loose materials’ quantity and supply characteristics, and rainfall intensity influence flow characteristics of debris flow (Liu and He, 2020; Guo et al., 2021a; Xiong et al., 2021). Field investigations found that the flow process of debris flows is usually continuous, forming a confluence process of flood-debris flow-flood. The flow rate, velocity, and concentration of debris flow fluctuate over time. During heavy rainfall, floodwaters first carry sand and gravel out of the gully at a fast velocity; next, the debris flow emerges from the gully in a “dense debris flow” form, with increased flow volume but slower velocity; finally, the flow decreases and may even cease. On-site exploration revealed that the debris flow deposition area consists of two layers of material, indicating that two large-scale debris flow events occurred in the region in the past. The debris flow deposits are primarily concentrated in the channel and gully mouth, with similar particle composition throughout. Due to the relatively shallow slope in the upper and middle reaches, the debris flow velocity is slower, resulting in more deposition. However, the thickness of the deposits has been reduced due to the disturbance of sand mining activities. In the downstream, the gully bed is relatively flat, and after the debris flow exits the mountain, the channel widens, and water dynamics decrease, allowing for large-scale deposition of solid materials, particularly at the gully mouth, where human excavation of a large pit has altered the channel’s flow direction.
2.3 Basin division of debris flow
The Lihong Road debris flow watershed can be divided into three main zones: formation, transport, and deposition (Thouret et al., 2020; Yang et al., 2020).
Formation Zone: Located in the middle to upper reaches of the gully, the formation zone consists primarily of three tributary gullies. The gully cross-section is mostly “V”-shaped, with slope gradients ranging from 30° to 60° and steep slopes. The lithology mainly consists of sandy soil and gravel layers, with occasional exposure of brick-red mudstone and sandy mudstone, which are highly weathered and fragmented, making them vulnerable to erosion from rainfall and water flow. The left tributary gully and its slope are more vegetated, mainly with wild grasses and sparse shrubs, covering approximately 40%, while other areas have much lower vegetation coverage, less than 10%. This zone is the primary source of debris flow material supplied through surface erosion, weathering, and rainfall runoff.
Transport Zone: The transport zone is located along the main gully in the middle and lower reaches, covering an area of about 0.08 km2, with a gully length of approximately 240 m. The slope gradient is relatively gentle, ranging from 20° to 30°, and the gully bed has a gradient of 42‰. The loose materials in this zone mainly consist of silt and clay. Small-scale potential landslide bodies are distributed intermittently on both sides of the gully. Due to later erosion and downcutting, loose sediment is transported and accumulated near the gully’s mouth, forming some deposits.
Deposition Zone: The deposition zone is located at the gully mouth, covering an area of about 0.14 km2, and features a well-defined alluvial fan. The lithology primarily comprises Quaternary loose sandy soil mixed with sand and gravel. Lihong Road crosses the deposition area, and the surrounding terrain is relatively flat, mainly consisting of cornfields. The alluvial fan at the gully mouth is relatively intact, with a growing trend in deposition. The fan extends about 50 m in length, 135 m in width, and has a spread angle 52°.
The essential characteristics of these three zones are summarized in Table 1.
TABLE 1
| Ravine name | Zones | Area (km2) | Main channel length (km) | Vegetation coverage (%) | Valley slope (°) | Relative height difference(m) | Gradient (‰) | Ravine section |
|---|---|---|---|---|---|---|---|---|
| Lihong Road debris flow | Formation Zone | 0.25 | 0.5 | 20 | 30°–60° | 30 | 60 | “V” type |
| Transport Zone | 0.08 | 0.24 | 10 | 20°–30° | 10 | 42 | “V” type |
Comprehensive characteristics of the debris flow formation area and flow area of Lihong Road.
2.4 Fluid characteristic values of debris flow
This study provides an in-depth analysis of the fluid characteristics of debris flow in the Lihong Road area, employing three methods: particle size distribution analysis, morphological investigation, and table comparison. The average bulk density of the debris flow was determined to be 1.563 t/m3. Particle size distribution analysis involved collecting sediment samples from the gully bed, sorting and weighing them by particle size, and analyzing the mass distribution across different size fractions. This method comprehensively explains the solid material content within the debris flow. The morphological investigation combined field surveys and interviews with local residents, providing first-hand data on the flow state and fluid properties of the debris flow. The results showed that the debris flow in the Lihong Road area exhibited a typical dense debris flow-like flow characteristic, with a lower flow velocity but a higher flow volume. These field data were further confirmed concerning the standards in the Debris Flow Disaster Prevention Engineering Survey Code (DZ/T0220-2006), allowing for an accurate determination of the flow’s bulk density. The table comparison method cross-referenced the debris flow susceptibility data with historical records, resulting in a comprehensive bulk density value of 1.563 t/m3 for the debris flow. This outcome provides critical data support for subsequent dynamic analysis and mitigation efforts.
Additionally, the study employed the rain-flood method to calculate the debris flow’s flow rate, yielding flow data for various return periods. The results show that the maximum flood peak flow for a 100-year return period was 4.30 m3/s. By calculating the debris flow’s peak discharge, the study further estimated the maximum runoff volume, which was found to be 0.24 × 10⁴ m3, 0.19 × 10⁴ m3, and 0.15 × 10⁴ m3 for the 1%, 2%, and 5% return periods, respectively. These results indicate that the Lihong Road debris flow falls into the small-scale category, which has important implications for the design of disaster mitigation structures. The study also identified some key characteristics of debris flow movement, such as the slower flow velocity and greater sediment deposition in the upper and middle reaches due to the gentler slope. However, due to sand mining activities, the sediment thickness has been reduced. In contrast, the downstream region experiences large-scale sedimentation, particularly at the gully mouth where human excavation has altered the natural flow direction.
2.5 Critical rainfall threshold for debris flow
The formation of debris flows requires sufficient water (runoff), with the primary source being rainfall and the secondary source being snowmelt. Rainfall serves as the water source for debris flows, and during the confluence process, it also acts as the driving force for debris flow movement. Different types of debris flows have different triggering conditions. For instance, heavy or torrential rainfall can trigger rainfall-induced debris flows, while snowmelt is triggered by continuous high temperatures that cause rapid snow and ice melting. In addition, the intensity and amount of rainfall have critical thresholds—debris flows will only occur when the precipitation reaches or exceeds this threshold. The raindrops from torrential rainfall have a strong erosive and splashing effect on the surface. For example, a heavy rain of 70 mm/h can quickly disturb the surface soil, destabilizing loose debris and triggering a debris flow. Therefore, intense rainfall has a strong erosive impact on loose materials on steep slopes, making it a significant triggering factor for the occurrence of debris flows.
The study found that the intensity and total amount of rainfall play a decisive role in debris flows, particularly during intense and short-duration rainfall events. A critical water depth formula for debris flow initiation was derived using the Mohr-Coulomb strength criterion and the limit equilibrium theory. This formula was further used to calculate the critical rainfall required to trigger debris flows. The study reveals that the critical rainfall threshold for the Lihong Road debris flow is 130.86 mm, and the 1-hour rainfall intensity that could potentially trigger the debris flow is 50.86 mm. When the rainfall exceeds this threshold, the likelihood of debris flow occurrence significantly increases. Detailed runoff generation and concentration analysis further demonstrated how rainfall influences debris flow initiation. It was also found that the combined effect of antecedent rainfall and short-duration heavy rainfall is a key factor in triggering debris flows. This research provides a scientific basis for early warning and mitigation strategies and a reference for risk assessment in similar watersheds, offering essential theoretical support for developing more effective prevention measures and reducing the risk of debris flow disasters.
3 Debris flow hazard assessment
The FLO-2D two-dimensional simulation software was used to model the formation process and movement characteristics of the Lihong Road debris flow. By combining rainfall data with digital elevation model (DEM) data, repeated simulations and data fitting were conducted to determine key parameters such as the flow depth, velocity, deposition range, and degree of destruction of the debris flow. On this basis, the movement characteristics of the debris flow during its occurrence were simulated, recreating the features of the debris flow disaster at the time of its event. By comparing the computed values from this investigation with the numerical simulation results, various simulation parameters—such as the Manning coefficient, viscosity coefficient, and others—were adjusted repeatedly to refine the model. The goal was to ensure that the simulated results closely matched the actual conditions of the debris flow disaster.
3.1 Theoretical basis of FLO-2D simulation
FLO-2D is a widely used two-dimensional numerical simulation model for predicting debris flow dynamics, particularly in mountainous terrain. It is based on solving shallow water equations that account for unsteady flow in irregular topography. In this study, FLO-2D was employed to simulate the initiation, movement, and deposition of debris flows in the Lihong Road area, incorporating site-specific topographic and rainfall data. The simulation framework is underpinned by the following theoretical assumptions and computational formulations.
3.1.1 Assumptions of numerical simulation
To ensure computational efficiency and maintain alignment with site-specific conditions, the FLO-2D model adopts a set of assumptions that simplify the simulation process while retaining the essential physics of debris flow behavior.
3.1.1.1 Core assumptions of the FLO-2D model
Fixed-bed condition: The model assumes a non-erodible bed surface, meaning that the topography remains constant throughout the simulation. Processes such as bed scouring, channel incision, or sediment entrainment are not explicitly modeled. As a result, the simulation focuses on flow routing and deposition patterns rather than sediment dynamics. No simulation of hydraulic jumps or shock waves: Due to the simplifications in the governing equations, abrupt changes in flow depth or velocity (such as hydraulic jumps) are not represented. The model is therefore best suited for gradually varied, shallow overland flow conditions.
3.1.1.2 Supporting hydrodynamic assumptions
Shallow water wave approximation: The model treats debris flow as shallow water flow, allowing the use of depth-averaged equations. Vertical accelerations are neglected, and hydrostatic pressure distribution is assumed. Hydrostatic pressure distribution: The flow is assumed to exhibit a uniform pressure distribution in the vertical direction, which is a common assumption in shallow flow simulations. Temporal resolution and cell uniformity: The simulation uses a fixed time step, with each computational cell assigned constant parameter values, including elevation, surface roughness (Manning’s n), and cross-sectional hydraulic characteristics. These values are averaged across each cell and remain unchanged during the simulation period. Shallow water wave assumption: The model assumes the flow to be in the shallow water wave regime. The model satisfies the steady-flow resistance equation during debris flow events. Static pressure distribution assumption: The distribution of hydrostatic pressure is assumed to be uniform. The time step in the numerical simulation is fixed and corresponds to a stable, constant flow over each interval. Each parameter at every grid point has a single value, including elevation and Manning’s roughness coefficient n. Each grid section is assumed to have average values for cross-sectional area and hydraulic roughness.
These assumptions provide a practical framework for simulating debris flow behavior in mountainous terrain, especially when the primary objective is to predict flow paths, inundation areas, and deposition patterns under different rainfall scenarios.
3.1.2 Governing equations
In FLO-2D, the continuity and momentum equations are the basic control equations for the 2D debris flow model. These equations, based on -1 and (Equations 3-2, 3-3), govern the volume and mass conservation of the debris flow or flood, and are used for the calculations.
Continuity Equation:
In the equation: t is time; i is the effective rainfall intensity (m/s); Vx-X is the average flow velocity along the X-axis; Vy-Y is the average flow velocity along the Y-axis; h is the flow depth.
Momentum Equation:
In the equation: g is the acceleration due to gravity; sfx and sfy are the friction slope gradients along the X and Y axes, respectively; sox and soy are the bed slope gradients along the X and Y axes, respectively.
Equation 3-2 is the momentum equation in the X-axis direction of the model, used to represent the force balance. The dynamic wave model primarily uses this momentum Equation 3-2 as the central equation. This momentum equation is expressed in a dimensionless form to facilitate the discussion of the effects of accelerated motion during the simulation process. From left to right, the components include: friction slope gradient, bed slope gradient, pressure gradient, and terms related to convective acceleration and local acceleration in the inertial forces.
In the FLO-2D simulation, it is assumed that each direction is one-dimensional fluid flow, and based on this, two-dimensional fluid flow is modeled. The simulation solves the momentum for each one-dimensional direction, then calculates the average velocity at the grid boundaries in that direction. However, for any given grid point, there is a degree of freedom in the flow direction. Therefore, the method first calculates the velocity and flow depth in all eight directions for each grid point, and then, based on this, establishes the concept of two-dimensional fluid flow.
3.1.3 Rheological model equation
The foundation of the FLO-2D debris flow model is the rheological model developed by O'Brien and Julien (O'Brien and Julien, 1988), as shown in Equation 3-4. The rheological model uses a rheological equation in the form of a slope-based equation:
In the equation: Sy is the yield slope gradient; Sv is the viscous slope gradient; Std is the turbulent and diffusion slope gradient; τy is the yield stress; η is the viscosity coefficient; rm is the unit weight of the debris flow material; K is the laminar flow resistance coefficient; ntd is the equivalent Manning’s roughness coefficient.
If the fluid contains a high volume concentration during the study of fluid motion, the increased frequency of collisions between micro-particles within the fluid leads to a corresponding increase in the fluid’s diffusion stress. Therefore, this effect must be considered in the research process, particularly with regard to its influence on the flow resistance. In most cases, as the volume concentration increases, the Manning’s roughness coefficient tends to change in an exponential growth pattern.
3.2 Numerical simulation
3.2.1 Numerical simulation parameters
The surface roughness condition determines Manning’s n value. In this study, Manning’s coefficient n for the debris flow area is set to 0.12. A higher Manning’s n value indicates better vegetation coverage and a rougher surface.
The Digital Elevation Model (DEM) is a mathematical and digital representation of the surface topography, which serves as a necessary prerequisite for simulation. The grid size is determined based on the required research accuracy, ensuring that each grid point is assigned an appropriate absolute elevation. The area of each cell is then calculated using the FLO-2D model. The elevation points are derived through interpolation and the DEM transformation process. This study uses a 5 m × 5 m grid to simulate debris flow in the Lihong Road area.
Volume concentration (Cv) refers to the percentage of solid materials, such as soil, gravel, and stones, within the debris flow relative to the total volume. In this study’s FLO-2D debris flow model, the relationship between volume concentration, yield stress, and viscosity coefficient follows an exponential function. As the volume concentration increases, the yield stress also increases proportionally. The initial volume concentration in this study is set to 0.62, with slight adjustments made based on the simulation results.
The yield stress in this study is the Bingham yield stress, which primarily represents the internal stress of a viscous debris flow. This stress is mainly in the form of viscous forces resulting from the interaction between shear and tensile stresses in the fluid. Therefore, the Bingham viscosity coefficient and the viscous force are closely related. When the viscosity coefficient decreases, the viscous force also decreases, resulting in improved flowability of the debris flow. The increase in volume concentration causes an exponential increase in the Bingham yield stress and the Bingham viscosity coefficient, and the relationship is expressed as follows:
(1) Expression for Yield Stress and Volume Concentration
(2) Relationship between Bingham viscosity coefficient and volume concentration
In the FLO-2D model, the viscosity coefficient and yield stress are determined based on the given parameters α1, α2, β1, β2, and the debris flow volume concentration. α1, α2, β1, and β2 are empirical coefficients. In this simulation, the following parameters are used: α1 = 0.812, α2 = 0.00461, β1 = 13.71, and β2 = 11.25.
After the debris flow occurs, the flowing material inevitably faces various resistances during its movement. The resistance acts along the same line as the flow direction but in the opposite direction. The resistance is closely related to the viscosity force and the fluid’s viscosity coefficient. As the viscosity coefficient increases, the resistance also increases. Another factor influencing resistance is the laminar flow resistance coefficient, which is related to the roughness of the surface through which the debris flow passes. The resistance coefficient K used in this model is set to 2,280 based on numerous complex factors.
The flow rate process of the debris flow is determined by multiplying the bulking factor (BF) by the water flow rate at the debris flow inlet. The BF is calculated based on the volume concentration and is given by the following equation:
If the debris flow fluid carries gravel, the parameter specific gravity is approximately 2.65. If it carries clay, the parameter is approximately 2.75. Since the debris flows in this study area are all classified as gravel-sand type, the specific gravity of the soil and rock materials can be set to 2.65. These expressions are summarized in Equations 3-5, 3-6, 3-7, which respectively define the relationships between yield stress and volume concentration, viscosity coefficient and volume concentration, and the bulking factor used for discharge calculation.
3.2.2 Debris flow simulation
Terrain Data Processing: Using ArcGIS, the DEM files were converted into ASCII files that FLO-2D can recognize. The simulation area was delineated, and the grid division was refined as much as possible. The starting point of the debris flow was determined based on the absolute elevation values of the DEM, and suitable simulation grid points were chosen in combination with field survey results. The simulation starting point was set near the debris flow outlet, considering the characteristics of runoff convergence after rainfall. The study did not involve artificial structures such as dams, and the simulation considered the operational conditions of drainage channels.
Rainfall Process Simulation: The FLO-2D simulation is based on cumulative rainfall percentage data derived from collected rainfall data. The initial value at the beginning of the simulation is zero, and as time progresses, the data is gradually calculated and converted into the total rainfall percentage. By the end of the simulation, the cumulative percentages at all time points sum to 1. The simulation time step was set to 0.4 h, with data extraction every 0.1 h to analyze the convergence of rainfall. The rainfall concentration process line was extracted from the simulation results and combined with field survey and on-site investigation data to determine the debris flow outlet location for the dry gully, providing data support for subsequent clean water flow studies.
Process Numerical Simulation: Using the FLO-2D debris flow simulation software, the debris flow disaster was simulated and reproduced, aiming to replicate the conditions during the catastrophe closely. By referencing the FLO-2D user manual, additional parameters for the debris flow simulation were determined, such as the deposit’s volume concentration and the debris materials’ specific gravity. By integrating the “Rainfall-Runoff Model” in FLO-2D, the clean water flow process line was extracted, and the BF value was calculated using this. This allowed for the calculation of the debris flow’s discharge (see Table 2), enabling the simulation of the entire debris flow process and determination of the disaster’s impact range and deposition thickness.
TABLE 2
| Frequency | Qp | Qc | Unit |
|---|---|---|---|
| 100-year period (1%) | 4.30 | 7.18 | m3/s |
| 50-year period (2%) | 3.44 | 5.74 | |
| 20-year period (5%) | 2.58 | 4.31 |
Peak flow of the section at the outlet under different rainfall frequencies within the Lihonglu watershed.
3.2.3 Changes in terrain before and after human mining activities
By comparing remote sensing images and DEM data from two periods—before and after human mining activities (Figure 4)—it can be observed that human activities have caused significant modifications to the region’s topography. These modifications primarily manifest in creating pits of various sizes, from sand mining activities to artificial water storage reservoirs. Notably, within the debris flow watershed is a large sand mining pit measuring approximately 230 m in length, 160 m in width, and an average depth of about 10 m, providing a storage volume of roughly 36.8 × 10³ m3.
FIGURE 4

Comparison of remote sensing images before (a) and after (b) the formation of the sand mining pit.
3.2.4 Changes in terrain before and after human mining activities
The DEM data before the formation of the sand mining pit was converted into an ASDII file and imported into the FLO-2D simulation software. The debris flow line and related parameters were input to simulate the debris flow accumulation and migration morphology under different recurrence periods. The results are shown in Figures 5–7, and Table 3.
FIGURE 5
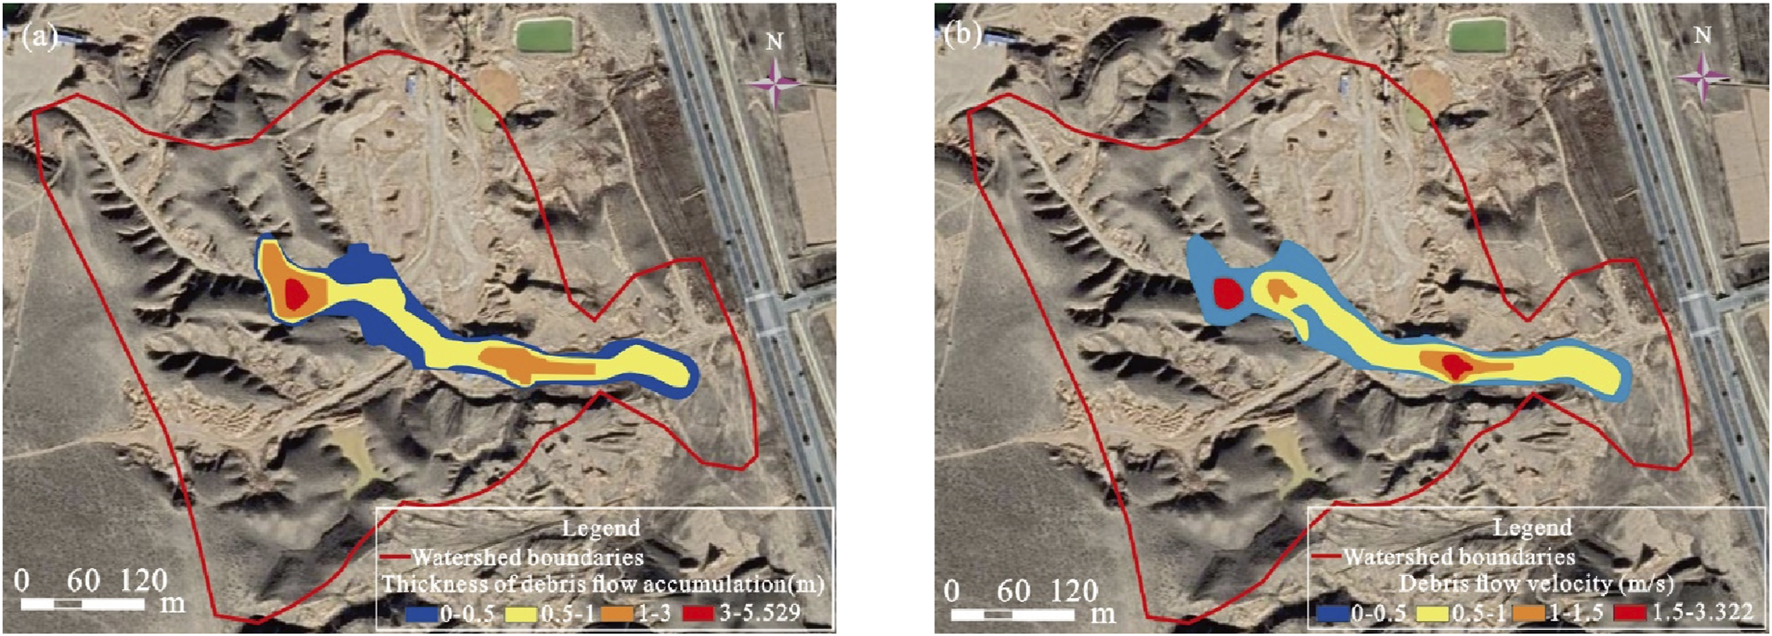
Distribution of debris flow accumulation thickness (a) and flow velocity under a 100-year return event (b) before the formation of the sand mining pit.
FIGURE 6

Distribution of debris flow accumulation thickness (a) and flow velocity under a 50-year return period (b) before the formation of the sand mining pit.
FIGURE 7

Distribution of debris flow accumulation thickness (a) and flow velocity under a 20-year return period (b) before the formation of the sand mining pit.
TABLE 3
| Recurrence period | Accumulation fan area (m2) | Maximum Depth(m) | Maximum speed (m/s) | Accumulation (m3) |
|---|---|---|---|---|
| 20-year period | 0 | 4.920 | 1.322 | 0 |
| 50-year period | 2,675 | 5.768 | 3.314 | 1,428.88 |
| 100-year period | 5,375 | 5.529 | 3.417 | 2,810.5 |
Debris flow simulation results under different rainfall frequencies (before sand mining pits are formed).
3.2.5 Simulation of different rainfall frequencies after the formation of sand mining pits
The investigation revealed a large amount of loose material in the gully, which is relatively open and straight. Debris flow occurrence is risky under conditions of heavy rainfall. Therefore, simulations can predict the potential disaster severity of debris flows in the Lihong Road area under various rainfall frequencies, providing reasonable guidance for debris flow mitigation efforts in the region.
The debris flow discharge curve and related parameters were input in the FLO-2D debris flow module, and the simulation was initiated. The Lihong Road debris flow simulation results under different recurrence intervals are shown in Figures 8–10, and Table 4.
FIGURE 8

Distribution of debris flow accumulation thickness (a) and flow velocity (b) under the condition of once in 100 years.
FIGURE 9

Distribution of debris flow accumulation thickness (a) and flow velocity (b) under the condition of once in 50 years.
FIGURE 10

Distribution of debris flow accumulation thickness (a) and flow velocity (b) under the condition of once in 20 years.
TABLE 4
| Recurrence period | Accumulation fan area (m2) | Maximum Depth(m) | Maximum speed (m/s) | Accumulation (m3) | Amount of the sand mining pit (m3) |
|---|---|---|---|---|---|
| 20-year period | 15,700 | 2.189 | 1.764 | 11,278.1 | 5,827.35 |
| 50-year period | 16,700 | 2.217 | 1.778 | 14,311.2 | 8,026.35 |
| 100-year period | 17,350 | 2.606 | 1.896 | 18,136.65 | 10,899.3 |
Debris flow simulation results under different rainfall frequencies.
3.3 Simulation results analysis
This study calculated the debris flow accumulation and movement under two conditions using FLO-2D. After forming the sand mining pit, the estimated volume was the amount of debris flow that converged into the sand pit. The survey calculation results, on the other hand, corresponded to the volume of material that flowed out of the gully. These two results are not directly comparable. However, the data shows that the simulated results were more significant than the survey results. This discrepancy is mainly due to the longer flow path in the survey calculation, whereas the actual material flowing out of the gully was relatively small. In contrast, due to the blockage by the sand mining pit, the simulated calculation results showed that all debris flow material accumulated in the pit, leading to a larger deposition volume.
By comparing the numerical simulation results before the formation of the sand mining pit with the survey calculation results (see Table 5), the results are generally consistent, except for the 5% rainfall frequency, where the results differ. For the 5% rainfall frequency, the FLO-2D simulation showed that the debris flow did not exit the gully, resulting in a discharge volume 0.
TABLE 5
| Rainfall frequency | One-time flushing volume (×104 m3) | |||
|---|---|---|---|---|
| Survey calculation results (flushing volume) | Simulation calculation results (flushing volume) | Deviation (%) | Simulation calculation results (sand mining pit accumulation) | |
| 5% | 0.15 | 0 | —— | 0.58 |
| 2% | 0.19 | 0.20 | 5 | 0.8 |
| 1% | 0.24 | 0.28 | 16.7% | 1.09 |
Comparison of survey calculation results and simulation calculation results.
4 Debris flow formation mechanism and disaster model
4.1 Formation mechanism
The formation mechanism of the Lihong Road debris flow is a complex process influenced by multiple factors, including topography, precipitation, material sources, and human activities. Topographic conditions are a vital foundation for the occurrence of debris flows. The topography of the Lihong Road debris flow watershed has significant elevation variations, with many gully valleys forming V-shaped profiles and steep slopes (approximately 45°). The terrain’s steepness and the valleys’ narrow characteristics facilitate the convergence of water flow, which enhances soil erosion and water loss from the slopes. The slopes are severely weathered, and the soil layer is loose. These topographic features provide ample material sources for the sediment carried by water flow and rainfall.
Precipitation is decisive in forming debris flows (Iverson, 1997; Malet et al., 2005; Borga et al., 2014). Rainfall in the Lihong Road area is concentrated between June and August, with heavy rainfall and high intensity. Frequent torrential rain and extreme precipitation events occur in this region. Continuous and short-duration intense rainfall dramatically increases water flow within the valleys, causing slope instability. During rains, the scouring effect of water gradually weakens the slope, creating large amounts of loose material that enter the valley with the water flow, ultimately converging to form debris flows. The intensity, duration, and antecedent rainfall directly influence debris flow formation (Tian et al., 2022). The antecedent rainfall increases soil moisture, raises the saturation of the slope material, and reduces the soil’s resistance to erosion, thus creating favorable conditions for debris flows.
Material sources are also crucial in supporting debris flow formation (Costa, 1984; Iverson et al., 1997; He et al., 2020; Du et al., 2024). The slopes in the Lihong Road debris flow watershed are covered by a 0.5-meter thick layer of sandy soil and gravel, with the underlying strata primarily consisting of brick-red mudstone and sandy mudstone. The surface is heavily weathered, and the soil structure is loose, making it susceptible to water erosion. The gully bed consists of mudstone, vulnerable to incision and erosion, leading to more solid material being washed into the valley. Additionally, human sand mining activities have resulted in large amounts of loose sediment in the watershed. These human activities not only alter the stability of the slopes but also affect the flow direction of the debris flow, changing its flow pattern, especially near the sand mining pits at the mouth of the gully, where the flow direction is diverted.
Human activities significantly impact the formation and evolution of debris flows. Sand mining, road construction, and other human activities in the Lihong Road area have damaged the original landform structure, reducing slope stability and increasing the risk of debris flow (Chen N. et al., 2015; Guo et al., 2021b; Li Y. et al., 2021). In the sand mining pit areas, artificial excavation has altered the water flow direction in the gully, affecting the normal flow of debris flow. While the sand mining pit temporarily mitigates the threat of debris flow to downstream roads and farmland, under sufficient rainfall and abundant material sources, debris flow may still migrate downstream along the gully.
4.2 Disaster manifestation and impact
The Lihong Road debris flow disaster manifests in two primary modes: scouring destruction and sediment accumulation (Major, 1997; Tang et al., 2012; Po et al., 2024; Qu et al., 2024). During intense rainfall, the debris flow accelerates, enhancing its erosive power. This results in severe damage to slopes, vegetation, and infrastructure along the gully, particularly in areas with steeper slopes where the scouring force is most intense. While the flow mainly consists of gravel and small stones—less destructive than larger boulders—it still poses significant risks to infrastructure.
As the debris flow moves through the gully, it deposits large volumes of sediment, particularly at the gully mouth and accumulation zones. These areas, characterized by relatively flat and modified terrain, experience a rise in ground elevation due to continuous sedimentation, which alters the local topography and creates raised landforms. The diversion of the flow near sand mining pits exacerbates this sediment accumulation, further modifying the landscape. Over time, this accumulation negatively affects land use and agriculture, while increasing the risk of future debris flow events.
The evolution of the debris flow disaster is influenced by both natural and human-induced factors. Torrential rainfall triggers debris flows, but human activities such as sand mining and infrastructure development have altered natural flow patterns, increasing the frequency and intensity of debris flows. These human modifications complicate risk assessment and disaster mitigation efforts. To address the risks, strategies such as precipitation monitoring, soil moisture management, and engineering protections (e.g., gully reinforcement and sediment control) are crucial for reducing future debris flow hazards and improving resilience in the region (Santi et al., 2011; Chen X. et al., 2015; Moraci et al., 2024).
5 Conclusion
(1) This study identifies the primary factors contributing to debris flow formation in the Lihong Road area: topography, precipitation, material sources, and human activities. The steep slopes and well-developed gully valleys, combined with extreme rainfall events, create ideal conditions for debris flows. The research also reveals that antecedent rainfall, slope material saturation, and rainfall intensity are critical factors influencing debris flow occurrence. These findings contribute to a better understanding of debris flow formation mechanisms and can be used to predict future events based on changing weather conditions.
(2) The study provides a detailed risk assessment of debris flow hazards, focusing on key dynamic parameters such as flow velocity, depth, and deposition thickness. Simulation results show how these parameters change with varying precipitation, offering valuable insights into the spatial distribution and intensity of debris flows. The research contributes to more accurate risk assessment models that can guide decision-making for disaster management and mitigation strategies.
(3) The findings underscore the importance of targeted disaster prevention strategies, including better precipitation monitoring, soil moisture management, and engineering protections (e.g., gully reinforcement and sediment control). The study also highlights the role of human activities—especially sand mining and infrastructure development—in altering debris flow behavior. By focusing on reducing material accumulation and stabilizing slopes, these findings offer concrete recommendations to mitigate future debris flow risks in the region.
Statements
Data availability statement
The datasets presented in this study can be found in online repositories. The names of the repository/repositories and accession number(s) can be found in the article/supplementary material.
Author contributions
HW: Conceptualization, Data curation, Funding acquisition, Writing – original draft. GW: Data curation, Formal Analysis, Investigation, Writing – original draft. ZyH: Funding acquisition, Methodology, Project administration, Writing – original draft. XH: Investigation, Project administration, Resources, Writing – original draft. YG: Funding acquisition, Software, Supervision, Writing – review and editing. GZ: Methodology, Project administration, Visualization, Writing – original draft. ZeH: Software, Supervision, Validation, Writing – original draft. JY: Conceptualization, Investigation, Software, Writing – review and editing. YZ: Supervision, Validation, Writing – review and editing.
Funding
The author(s) declare that financial support was received for the research and/or publication of this article. This research was funded by Ningxia Mining Geological Environment Monitoring and Ecological Restoration Innovation Team, 2021 youth talent support program of Ningxia, and the 2022 Science and Technology youth talent support program of Ningxia.
Conflict of interest
The authors declare that the research was conducted in the absence of any commercial or financial relationships that could be construed as a potential conflict of interest.
Generative AI statement
The author(s) declare that no Generative AI was used in the creation of this manuscript.
Publisher’s note
All claims expressed in this article are solely those of the authors and do not necessarily represent those of their affiliated organizations, or those of the publisher, the editors and the reviewers. Any product that may be evaluated in this article, or claim that may be made by its manufacturer, is not guaranteed or endorsed by the publisher.
References
1
Borga M. Stoffel M. Marchi L. Marra F. Jakob M. (2014). Hydrogeomorphic response to extreme rainfall in headwater systems: flash floods and debris flows. J. Hydrology518, 194–205. 10.1016/j.jhydrol.2014.05.022
2
Cao C. Zhang W. Chen J. Shan B. Song S. Zhan J. (2021). Quantitative estimation of debris flow source materials by integrating multi-source data: a case study. Eng. Geol.291, 106222. 10.1016/j.enggeo.2021.106222
3
Chen H. W. Chen C. Y. (2022). Warning models for landslide and channelized debris flow under climate change conditions in taiwan. Water14 (5), 695. 10.3390/w14050695
4
Chen N. Chen M. Li J. He N. Deng M. Iqbal Tanoli J. et al (2015a). Effects of human activity on erosion, sedimentation, and debris flow activity–A case study of the Qionghai Lake watershed, southeastern Tibetan Plateau, China. Holocene25(6), 973–988. 10.1177/0959683615574893
5
Chen X. Cui P. You Y. Chen J. Li D. (2015b). Engineering measures for debris flow hazard mitigation in the Wenchuan earthquake area. Eng. Geol.194, 73–85. 10.1016/j.enggeo.2014.10.002
6
Costa J. E. (1984). Physical geomorphology of debris flows in Developments and applications of geomorphology. Berlin, Heidelberg: Springer Berlin Heidelberg, 268–317.
7
Cui P. Zou Q. Xiang L. Z. Zeng C. (2013). Risk assessment of simultaneous debris flows in mountain townships. Prog. Phys. Geogr.37 (4), 516–542. 10.1177/0309133313491445
8
Di B. F. Chen N. S. Cui P. Li Z. L. He Y. P. Gao Y. C. (2008). GIS-based risk analysis of debris flow: an application in Sichuan, southwest China. Int. J. Sediment Res.23 (2), 138–148. 10.1016/s1001-6279(08)60013-x
9
Ding W. Wang G. Yang Q. Xu Y. Gao Y. Chen X. et al (2023a). Risk assessment and control of geological hazards in towns of complex mountainous areas based on remote sensing and geological survey. Water15 (18), 3170. 10.3390/w15183170
10
Ding X. Y. Hu W. J. Liu F. Yang X. (2023b). Risk assessment of debris flow disaster in mountainous area of northern Yunnan province based on FLO-2D under the influence of extreme rainfall. Front. Environ. Sci.11, 1252206. 10.3389/fenvs.2023.1252206
11
Du Y. Liu H. Li H. Xie M. Chicas S. D. Wu J. et al (2024). Exploring the initiating mechanism, monitoring equipment and warning indicators of gully-type debris flow for disaster reduction: a review. Nat. Hazards120, 13667–13692. 10.1007/s11069-024-06742-7
12
Gan B. R. Liu X. N. Yang X. G. Wang X. K. Zhou J. W. (2018). The impact of human activities on the occurrence of mountain flood hazards: lessons from the 17 August 2015 flash flood/debris flow event in Xuyong County, south-western China. Geomatics, Nat. Hazards Risk9 (1), 816–840. 10.1080/19475705.2018.1480539
13
Guo X. Chen X. Song G. Zhuang J. Fan J. (2021a). Debris flows in the Lushan earthquake area: formation characteristics, rainfall conditions, and evolutionary tendency. Nat. Hazards106, 2663–2687. 10.1007/s11069-021-04559-2
14
Guo X. Li Y. Chen X. Zhang J. Sun Y. (2021b). Variation of debris flow/flood formation conditions at the watershed scale in the Wenchuan Earthquake area. Landslides18, 2427–2443. 10.1007/s10346-021-01644-2
15
Guo Y. Feng Z. Wang L. Tian Y. Chen L. (2024). Hazard assessment of debris flow: a case study of the huiyazi debris flow. Water16 (10), 1349. 10.3390/w16101349
16
He S. Wang D. Zhao P. Li Y. Lan H. Chen W. et al (2020). A review and prospects of debris flow waste-shoal land use in typical debris flow areas, China. Land Use Policy99, 105064. 10.1016/j.landusepol.2020.105064
17
He X. Gong Y. Yan J. Gao S. He Z. Zhang G. et al (2025). Research on the movement process of erosion-denudation type debris flow in middle-low mountains based on particle algorithm model. Front. Earth Sci.12, 1532456. 10.3389/feart.2024.1532456
18
Huang J. Li X. Zhang L. Li Y. Wang P. (2020). Risk perception and management of debris flow hazards in the upper salween valley region: implications for disaster risk reduction in marginalized mountain communities. Int. J. Disaster Risk Reduct.51, 101856. 10.1016/j.ijdrr.2020.101856
19
Hürlimann M. Coviello V. Bel C. Guo X. Berti M. Graf C. et al (2019). Debris-flow monitoring and warning: review and examples. Earth-Science Rev.199, 102981. 10.1016/j.earscirev.2019.102981
20
Iverson R. M. (1997). The physics of debris flows. Rev. Geophys.35 (3), 245–296. 10.1029/97rg00426
21
Iverson R. M. George D. L. (2016). Modelling landslide liquefaction, mobility bifurcation and the dynamics of the 2014 Oso disaster. Géotechnique66(3), 175–187. 10.1680/jgeot.15.LM.004
22
Iverson R. M. Ouyang C. (2015). Entrainment of bed material by Earth‐surface mass flows: review and reformulation of depth‐integrated theory. Rev. Geophys.53 (1), 27–58. 10.1002/2013rg000447
23
Iverson R. M. Reid M. E. LaHusen R. G. (1997). Debris-flow mobilization from landslides. Annu. Rev. Earth Planet. Sci.25 (1), 85–138. 10.1146/annurev.earth.25.1.85
24
Jia X. Lv J. Luo Y. (2024). Simulation and management impact evaluation of debris flow in dashiling gully based on FLO-2D modeling. Appl. Sci.14 (10), 4216. 10.3390/app14104216
25
Jiang T. Yan P. Ma T. Wang R. (2022). Nutritional requirements and precise fertilization of wine grapes in the eastern foothills of Helan Mountain. Int. J. Agric. Biol. Eng.15 (4), 147–153. 10.25165/j.ijabe.20221504.5406
26
Jo H. I. Jun K. W. (2022). A study on the application of FLO-2D model for analysis of debris flow damage area. J. Korean Soc. Disaster Secur.15 (2), 37–44. 10.21729/KSDS.2022.15.2.37
27
Kumar S. Sharma A. Singh K. (2024). A comprehensive review on debris flow landslide assessment using rapid mass movement simulation (RAMMS). Geotechnical Geol. Eng.42 (7), 5447–5475. 10.1007/s10706-024-02887-1
28
Lee S. An H. Kim M. Lee G. Shin H. (2022). Evaluation of different erosion–entrainment models in debris-flow simulation. Landslides19 (9), 2075–2090. 10.1007/s10346-022-01901-y
29
Li Y. Liu X. N. Gan B. R. Wang X. K. Yang X. G. Li H. B. et al (2021a). Formation-evolutionary mechanism analysis and impacts of human activities on the 20 august 2019 clustered debris flows event in Wenchuan county, southwestern China. Front. Earth Sci.9, 616113. 10.3389/feart.2021.616113
30
Li Z. Chen J. Tan C. Zhou X. Li Y. Han M. (2021b). Debris flow susceptibility assessment based on topo-hydrological factors at different unit scales: a case study of Mentougou district, Beijing. Environ. Earth Sci.80, 365–19. 10.1007/s12665-021-09665-9
31
Li Z. Wu M. Chen N. Hou R. Tian S. Rahman M. (2023). Risk assessment and analysis of its influencing factors of debris flows in typical arid mountain environment: a case study of central tien Shan mountains, China. Remote Sens.15 (24), 5681. 10.3390/rs15245681
32
Liu W. He S. (2020). Comprehensive modelling of runoff-generated debris flow from formation to propagation in a catchment. Landslides17, 1529–1544. 10.1007/s10346-020-01383-w
33
Long K. Zhang S. Wei F. Hu K. Zhang Q. Luo Y. (2020). A hydrology-process based method for correlating debris flow density to rainfall parameters and its application on debris flow prediction. J. Hydrology589, 125124. 10.1016/j.jhydrol.2020.125124
34
Major J. J. (1997). Depositional processes in large-scale debris-flow experiments. J. Geol.105 (3), 345–366. 10.1086/515930
35
Malet J. P. Laigle D. Remaître A. Maquaire O. (2005). Triggering conditions and mobility of debris flows associated to complex earthflows. Geomorphology66 (1-4), 215–235. 10.1016/j.geomorph.2004.09.014
36
Moos C. Bebi P. Schwarz M. Stoffel M. Sudmeier-Rieux K. Dorren L. (2018). Ecosystem-based disaster risk reduction in mountains. Earth-science Rev.177, 497–513. 10.1016/j.earscirev.2017.12.011
37
Moraci N. Ciurleo M. Mandaglio M. C. Pisano M. (2024). Design and installation of a local monitoring system to validate debris flow methodology for risk mitigation. Geotechnical Geol. Eng.42 (7), 6219–6235. 10.1007/s10706-024-02878-2
38
Niu X. Hou K. Sun H. (2023). Study on the prevention and control of downhole debris flows based on disaster chain theory. Water15 (13), 2367. 10.3390/w15132367
39
O'Brien J. S. Julien P. Y. (1988). Laboratory analysis of mudflow properties. J. Hyd. Eng.114 (8), 877–887. 10.1061/(ASCE)0733-9429(1988)114:8(877)
40
Pang D. Liu B. Wu M. Li X. Hu Y. Ma J. et al (2022). Features and driving factors of microbial metabolic limitation in mountain ecosystems in arid areas: a case study on the Helan Mountains, Northwest China. Front. For. Glob. Change5, 1024656. 10.3389/ffgc.2022.1024656
41
Po Y. Xiekang W. Dongya S. Zexing X. Weizhen L. (2024). Development and application of an integrated methodology for post‐disaster field investigation of debris floods. Earth Surf. Process. Landforms49 (10), 2914–2935. 10.1002/esp.5866
42
Qu J. Yang W. Xue Y. Zhang C. Kong F. Li J. et al (2024). Formation analysis and hazard assessment of the landslide-debris flow disaster chain in small watersheds of the reservoir type. Bull. Eng. Geol. Environ.83 (12), 484–20. 10.1007/s10064-024-03929-x
43
Santi P. M. Hewitt K. VanDine D. F. Barillas Cruz E. (2011). Debris-flow impact, vulnerability, and response. Nat. hazards56, 371–402. 10.1007/s11069-010-9576-8
44
Schneider D. Huggel C. Cochachin A. Guillén S. García J. (2014). Mapping hazards from glacier lake outburst floods based on modelling of process cascades at Lake 513, Carhuaz catchment, Peru. Advances in Geosciences35, 145–155. 10.5194/adgeo-35-145-2014
45
Simoni A. Bernard M. Berti M. Boreggio M. Lanzoni S. Stancanelli L. M. et al (2020). Runoff‐generated debris flows: observation of initiation conditions and erosion–deposition dynamics along the channel at Cancia (eastern Italian Alps). Earth Surf. Process. Landforms45 (14), 3556–3571. 10.1002/esp.4981
46
Tang C. van Asch T. W. Chang M. Chen G. Q. Zhao X. H. Huang X. C. (2012). Catastrophic debris flows on 13 August 2010 in the Qingping area, southwestern China: the combined effects of a strong earthquake and subsequent rainstorms. Geomorphology139, 559–576. 10.1016/j.geomorph.2011.12.021
47
Thouret J. C. Antoine S. Magill C. Ollier C. (2020). Lahars and debris flows: characteristics and impacts. Earth-Science Rev.201, 103003. 10.1016/j.earscirev.2019.103003
48
Tian S. Hu G. Chen N. Rahman M. Han Z. Somos-Valenzuela M. et al (2022). Extreme climate and tectonic controls on the generation of a large-scale, low-frequency debris flow. Catena212, 106086. 10.1016/j.catena.2022.106086
49
Walter F. Amann F. Kos A. Kenner R. Phillips M. de Preux A. et al (2020). Direct observations of a three million cubic meter rock-slope collapse with almost immediate initiation of ensuing debris flows. Geomorphology351, 106933. 10.1016/j.geomorph.2019.106933
50
Wang Y. Nie L. Zhang M. Wang H. Xu Y. Zuo T. (2020). Assessment of debris flow risk factors based on meta-analysis—cases study of northwest and southwest China. Sustainability12 (17), 6841. 10.3390/su12176841
51
Wei G. Xia Z. Yan J. Li B. Wu X. (2025). Characteristics of landslide movement and dynamic processes in Hongyacun landslide cluster, Qinghai Province, China. Front. Earth Sci.13, 1551527. 10.3389/feart.2025.1551527
52
Xiong J. Tang C. Chen M. Gong L. Li N. Zhang X. et al (2021). Long-term changes in the landslide sediment supply capacity for debris flow occurrence in Wenchuan County, China. Catena203, 105340. 10.1016/j.catena.2021.105340
53
Xu F. G. Yang X. G. Zhou J. W. (2014). An empirical approach for evaluation of the potential of debris flow occurrence in mountainous areas. Environ. earth Sci.71, 2979–2988. 10.1007/s12665-013-2667-6
54
Yan J. Huang J. Li H. Chen L. Zhang Y. (2020). Study on instability mechanism of shallow landslide caused by typhoon and heavy rain. Journal of Geomechanics26(4), 481–491. 10.12090/j.issn.1006-6616.2020.26.04.041
55
Yan J. Ma Y. Liu L. Wang Z. Ren T. (2024). Numerical Simulation of Rainfall-induced Xianchi Reservoir Landslide in Yunyang, Chongqing, China. Acta Geologica Sinica (English Edition)98(2), 505–515. 10.1111/1755-6724.15146
56
Yang H. Yang T. Zhang S. Zhao F. Hu K. Jiang Y. (2020). Rainfall-induced landslides and debris flows in mengdong Town, yunnan province, China. Landslides17, 931–941. 10.1007/s10346-019-01336-y
57
Yu B. Wang T. Zhu Y. Zhu Y. (2016). Topographical and rainfall factors determining the formation of gully-type debris flows caused by shallow landslides in the Dayi area, Guizhou Province, China. Environ. Earth Sci.75, 551–18. 10.1007/s12665-016-5243-z
58
Zhang P. Liu X. Shu H. (2023). Hazard assessment of debris flow by using FLO-2D and hazard matrix: a case study of Qingshui Gully in the southern Gansu Province, China. Desalination Water Treat.315, 650–662. 10.5004/dwt.2023.30108
59
Zhao T. Zhou G. G. Sun Q. Crosta G. B. Song D. (2022). Slope erosion induced by surges of debris flow: insights from field experiments. Landslides19 (10), 2367–2377. 10.1007/s10346-022-01914-7
60
Zhou Y. Yue D. Liang G. Li S. Zhao Y. Chao Z. et al (2022). Risk assessment of debris flow in a mountain-basin area, western China. Remote Sens.14 (12), 2942. 10.3390/rs14122942
61
Zhu Y. Qiu H. Liu Z. Ye B. Tang B. Li Y. et al (2024). Rainfall and water level fluctuations dominated the landslide deformation at Baihetan Reservoir, China. J. Hydrology642, 131871. 10.1016/j.jhydrol.2024.131871
62
Zou Q. Cui P. Zhou G. G. Li S. Tang J. Li S. (2018). A new approach to assessing vulnerability of mountain highways subject to debris flows in China. Prog. Phys. Geogr. Earth Environ.42(3), 305–329. 10.1177/0309133318770985
Summary
Keywords
debris flow, geological disaster, formation mechanism, numerical simulation, Wuzhong City
Citation
Wang H, Wang G, Hu Z, He X, Gong Y, Zhang G, He Z, Yan J and Zhang Y (2025) Formation mechanism and risk assessment of debris flow geological disasters in Lihong Road, Litong District, Wuzhong City, Ningxia. Front. Earth Sci. 13:1550360. doi: 10.3389/feart.2025.1550360
Received
23 December 2024
Accepted
14 May 2025
Published
06 June 2025
Volume
13 - 2025
Edited by
Shilin Zhang, Southwest Jiaotong University, China
Reviewed by
Zhao Duan, Xi’an University of Science and Technology, China
Longwei Yang, China Coal Technology Engineering Group, China
Updates
Copyright
© 2025 Wang, Wang, Hu, He, Gong, Zhang, He, Yan and Zhang.
This is an open-access article distributed under the terms of the Creative Commons Attribution License (CC BY). The use, distribution or reproduction in other forums is permitted, provided the original author(s) and the copyright owner(s) are credited and that the original publication in this journal is cited, in accordance with accepted academic practice. No use, distribution or reproduction is permitted which does not comply with these terms.
*Correspondence: Yongfeng Gong, gongyongfeng@163.com; Yaoyao Zhang, zhangyy@cags.ac.cn
Disclaimer
All claims expressed in this article are solely those of the authors and do not necessarily represent those of their affiliated organizations, or those of the publisher, the editors and the reviewers. Any product that may be evaluated in this article or claim that may be made by its manufacturer is not guaranteed or endorsed by the publisher.