 Wei Liu1
 Lin Shang1*Guangliang Gao1Dan Li1Miao Wang1Wenshuang Geng1Qian Jia1Guodong Zhang1
 Haixiang Zhang2*Pengfei Hao3Licai Peng3
- 1Exploration and Development Research Institute, Jidong Oilfield, Tangshan, China
- 2Institute of Nuclear and New Energy Technology, Tsinghua University, Beijing, China
- 3School of Aerospace Engineering, Tsinghua University, Beijing, China
This study presents a comprehensive investigation into the intricate microstructural characteristics of tight reservoir rocks, utilizing advanced micro-CT scanning and FIB-SEM technologies. Micro-CT scanning technology was employed to obtain clear micro-pore structures and pore-throat size distribution patterns of four typical lithologies: dolomite, sandstone, mudstone, and conglomerate. Our findings reveal that the average pore-throat dimensions in tight reservoirs are confined to several micrometers, markedly diminutive by 1-2 orders of magnitude compared to their conventional counterparts. The FIB-SEM was used to obtain the distribution patterns of nano- and micrometer-scale pore-throats in tight cores. Nano-scale pores with equivalent diameters below 200 nm accounted for 20% of the total pore area, contributing minimally to storage space and permeability, while the main storage space and flow channels were concentrated in micrometer-scale pore-throats. Three-dimensional micro-CT scanning provides a comprehensive and intuitive digital rock structure for establishing permeability models, while nano-scale two-dimensional scanning yields finer microscopic pore-throat structures and size distribution patterns. The combination of both methods leads to measurement results closer to reality. Conclusively, we propose a mathematical formulation for predicting the absolute permeability of tight reservoirs, predicated on micro-scan data. This formulation is distinguished by its generality, computational simplicity, and its potential to furnish essential data for the design of reservoir development strategies.
1 Introduction
With the depletion of conventional reservoirs, tight reservoirs have been considered as an alternative in the increasing demand for fossil fuel. The high heterogeneity and tortuous pore space structure often result in complicated and anomalous measurements of bulk properties (Kerr, 2010; Hughes, 2013; Martini et al., 1996; Dresselhaus and Thomas, 2001; Javadpour et al., 2021). The various pore size distribution, pore type, and pore connectivity are critical to understand and predict the fluid storage and flow in tight reservoirs (Takbiri-Borujeni et al., 2019; Lai et al., 2018; Wang et al., 2016; Zhang et al., 2016; Song et al., 2023; Wu et al., 2024; Wu et al., 2022; Wu et al., 2025). Thus, the accurate and comprehensive characterization of the pore structures in tight reservoirs is a key step for the hydrocarbon accumulation, exploration and development.
The wide range of the pore scale, due to the existence of multiple scales of pore types in tight reservoirs, results in difficulties of direct observations. A variety of testing techniques have been developed to investigate the pore structure in tight reservoirs, for instance, the mercury injection method (MIM), gas absorption method (GAM), nuclear magnetic resonance (NMR) and small-angle and ultra-small-angle neutron scattering (SANS/USANS). The MIM has been regarded as the most traditional method to measure the porosity of porous media. However, the MIM can only resolve pores with radii larger than 0.12 µm, and the physical properties of rocks may be damaged under the mercury injection process. The GAM can identify only nanoscale pores, while miss macro and isolated pores. The NMR can detect connected and isolated pores in nanoscale, while a coefficient is needed to convert NMR T2 spectrum to pore size distribution, which has great impact on the accuracy of the measured distribution. The SANS/USANS allows for a wide pore size distribution to be investigated and is nondestructive, while this method may ignore the sample heterogeneity and regional differences.
The X-ray Computed Tomography (CT) (Arif et al., 2020; Hao et al., 2023; Chen et al., 2023) is another effective method to directly analyze pore structure, tortuosity and connectivity visually, but is incapable to provide an overall character of pore spaces. The Scanning Electron Microscopes (SEM) (Curtis et al., 2012; Yao et al., 2019; Slatt and O’Brien, 2011; Loucks et al., 2012) are widely used to analyze pore structure at nanoscale, though it is limited by a small field of view. Therefore, the combination of CT and SEM has been regarded as one of the most convenient and effective methods to quantitatively identify the pore structures in porous media. And the 2-D and 3-D images of rock samples with high resolution, obtained by means of the combination of CT and SEM, enable us to investigate pore structures. With similar techniques but focusing on higher image resolution, such as micro-CT, focused ion beam scanning electron microscopy (FIB-SEM), the nano-scale pores can also be identified, and the 3-D pore structure models can also be established for tight reservoirs to analyze pore size distribution and pore connectivity.
Accurate permeability prediction in tight porous media constitutes a critical scientific challenge with significant implications for hydrocarbon recovery optimization and strategic design of geological gas storage systems. While conventional approaches simplify intricate pore architectures into idealized geometries (e.g., the Kozeny-Carman model), such empirical formulations exhibit limited predictive capacity for realistic heterogeneous media (Berg, 2014; Kozeny, 1927; Carman, 1937; Fauzi, 2011; En Orlov et al., 2021). Advanced methodologies integrating micro-computed tomography (μ-CT) imaging with computational fluid dynamics (CFD) simulations have enabled permeability quantification accounting for true pore-scale complexity (Wei et al., 2021; Wadsworth et al., 2023). Nevertheless, CFD-based approaches remain computationally prohibitive for large-scale or multiscale analyses. A pressing scientific priority lies in developing data-driven permeability predictors that establish robust correlations between experimentally measurable pore-structural descriptors (e.g., tortuosity, connectivity, and throat size distribution) and macroscopic transport properties. Such predictive frameworks must reconcile physical interpretability with computational efficiency to enable practical applications in reservoir characterization and subsurface engineering.
The purpose of this work is to present a workflow to analyze the complicated microstructure characterization of tight reservoirs by combing the micro-CT and FIB-SEM. The three-dimensional grayscale images of different kinds of rock samples are obtained by micro-CT technology, and the threshold segmentation algorithm is applied to reconstruct the 3D digital cores. Meanwhile, the microstructure characteristic parameters are analyzed based on the results of pore throat segmentation algorithm. The 2D high-definition images are performed by FIB-SEM technology, and the nano-scale pore distribution characteristics are investigated.
2 Samples and methods
2.1 Samples
The rock samples analyzed in this work were selected from tight reservoirs, including tight dolomite, tight sandstone, tight mudstone and high-permeability conglomerate. In this work, tight dolomite is regarded as the main study object, and other kinds of rocks are employed to carry out comparative analysis. The same kind cores are selected from different wells to ensure the reasonableness and representativeness of the samples.
2.2 Experimental methods
2.2.1 Micro-CT
In this work, the Versa510 (Carl Zeiss AG, Germany) is employed to implement the X-ray computed tomography. The view field scale of micro-CT is 1–50 mm, which is bigger than nano-CT but much smaller than mm-CT. Micro-CT can achieve moderate resolution and contrast with a maximum resolution of 300 nm. Through X-ray microscopic imaging with optical lens, 3D grayscale images of rock samples can be obtained and reconstructed, in which a certain grayscale value corresponds to a certain density. Consequently, the pores and matrix could be distinguished obviously in rock samples.
2.2.2 FIB-SEM
In order to obtain much higher resolution images, the Helios650 (FEI, United States) with a maximum resolution of 0.9 nm is also used in this work. The side length of a single 2D image obtained from the FIB-SEM is about 10–50 µm, furthermore, the view field can be expanded to 1 cm by means of image mosaics technology. Due to the high resolution and high contrast, the FIB-SEM can be applied to examine pore morphology of rock samples. The FIB-SEM can also identify the micro-/nano-pores and organic matters in tight reservoirs. Nevertheless, it may take a large amount of time and CPU when using the FIN-SEM method. Hence, the combination of micro-CT and FIB-SEM is put forward to analyze the pore characterization in this work.
2.3 Digital cores
A 3D template is reconstructed based on the superposition of 2D slice set of grayscale images obtained by micro-CT. The various grayscales in images represent different CT values, and the bigger CT values indicate higher densities and whiter color. According to the principle, the pores and minerals can be distinguished obviously. The white and gray areas represent rock grains, and other black areas represent pores. Based on the image threshold segmentation method, pores can be separated from the grayscale images. The main steps of constructing digital cores, which indeed reflect the inner pore structures of rocks, are listed as follows.
(1) Image filtering: The first step of image processing is to remove noise, enhance signal-to-noise ratio effectively, and simultaneously preserve detailed features and marginal information of the images by filtering algorithm, as shown in Figure 1. The median filtering method is performed for image preprocessing, which can remain edge information of original image while remove the noise. The purpose of image filtering is to make the distinction between pores and rock grains more obvious, and immensely eliminate the influence of noise on subsequent image processing.
(2) Threshold segmentation: Based on the filtered image, threshold segmentation algorithm is applied to generate 2-D cross section image. The boundary areas between grains and pore space can be labeled accurately by a certain threshold value. Through constantly adjusting the threshold, an appropriate value can be obtained to exactly divide grains and pores, as shown in Figure 2.
(3) Constructing digital core: In this work, we perform the Generate Surface Module provided by the AVIZO software to reconstruct the geometric model of inner pore structure. Based on the classic Marching Cubes display algorithm, a series of 2D data is regarded as a 3D data field. Through dealing with each individual element in the 3D data field, the elements with identical value can be extracted to form the contour surface. Consequently, the digital core, which can reflect the real inner structure of rocks, is constructed.
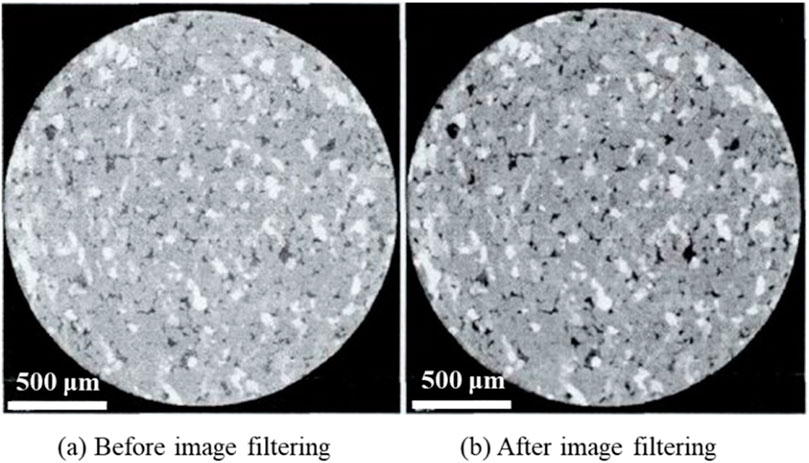
Figure 1. Schematic diagram of image filtering. In comparison to the original images prior to filtering (a), the post-filtering images (b) demonstrate a more pronounced distinction between pores and rock particles.
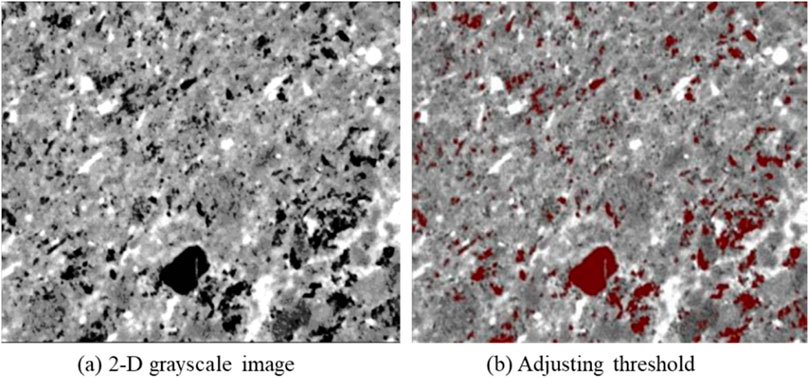
Figure 2. Schematic diagram of threshold segmentation. The appropriate threshold value can exactly divide grains and pores in the original image (a), as demonstrated in (b).
2.4 Pore network model
The 3D digital cores can reflect the real characterization and distribution of inner pores, nevertheless, it is difficult to deal with the extremely complex and irregular pore structures. Therefore, it is critical to establish a simple pore network model with an equivalent pore space topology, that can approximately represent the real characterization and distribution of inner pores. The pore network model is an equivalent of the complex pore space structure in porous media. In the pore network model, pore spaces are divided into several units with different functions, for instance, the throat represents narrow pore space, and the pore body relates to the larger pore space between two throats. The pore body and throat are usually assumed to be with ideal geometric shapes.
Nevertheless, it is difficult to extract the equivalent pore network model from the real digital core. There are many different methods to generate a network model, for example, central axis algorithm, Voronoi polyhedron algorithm, maximum ball algorithm and so on. In this paper, the maximum ball algorithm is employed to obtain a 3D representation of the void space of a rock. Figure 3 illustrates the transformation from a digital core to a pore network model.
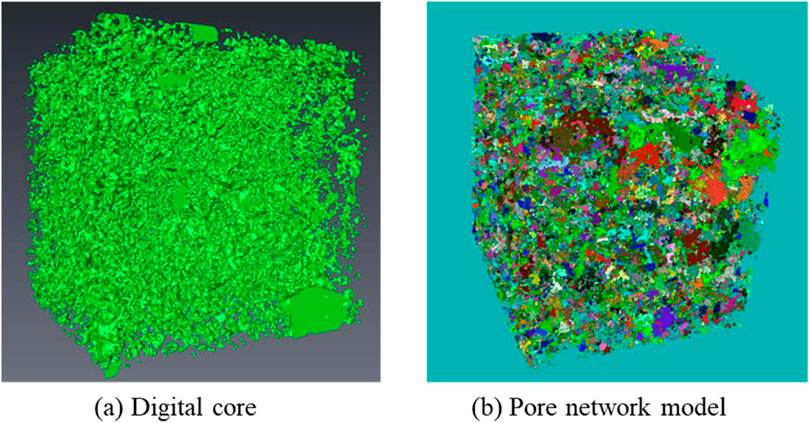
Figure 3. Schematic diagram of pore network model. The pore network model (b) is extracted from the digital rock core (a) using the maximal ball algorithm.
3 Results and discussions
In this paper, dense dolomite is taken as the main research object and compared with dense sandstone, dense mudstone and high permeability conglomerate. 9 sets of micro-CT scanning experiments were carried out and 9 sets of experimental data were obtained, of which 6 sets were for the dense dolomite samples (with different resolutions and well numbers), 1 set was for the dense sandstone samples, 1 set was for the dense mudstone samples and 1 set was for the conglomerate samples. At the same time, 4 FIB-SEM scanning experiments were carried out and the scanned images of dense dolomite, dense sandstone, mudstone and grey siltstone were stitched in 2D to enlarge the field of view and obtain more image information. The detailed information of samples, test techniques, rock types, and so on, are listed in Table 1.
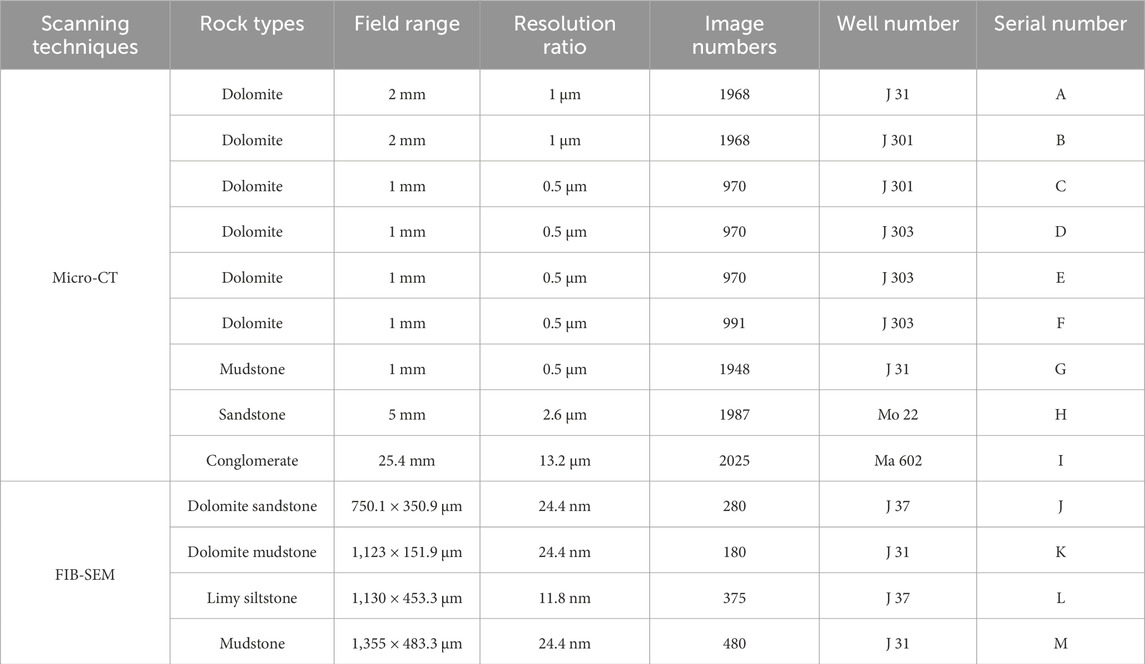
Table 1. Detailed information of the micro-CT (A-I) and FIB-SEM (J-M) experiments.
3.1 Micro-CT scanning results
Figure 4 shows the scanning results of sample A, including (a) 2-D grayscale image, (b) digital core image, (c) pore-throat model, (d) distribution of throat diameter, and (e) distribution of pore diameter. The 2D grayscale images are obtained by micro-CT, where the white and gray areas represent rock grains, and other black areas represent pores (Figure 1a). By means of the method mentioned above to construct digital core of Sample A, just as Figure 4b shows. The simplified pore-throat model, established by the maximum ball algorithm, is also shown in Figure 1c. Based on the pore-throat model, the throat and pore size distribution of all identified pore clusters are obtained as shown in Figures 1d,e. Similarly, the scanning results of samples B-I were able to be obtained. The scanning results of samples G, H and I, i.e., mudstone, sandstone and conglomerate, are shown in Figures 5–7.
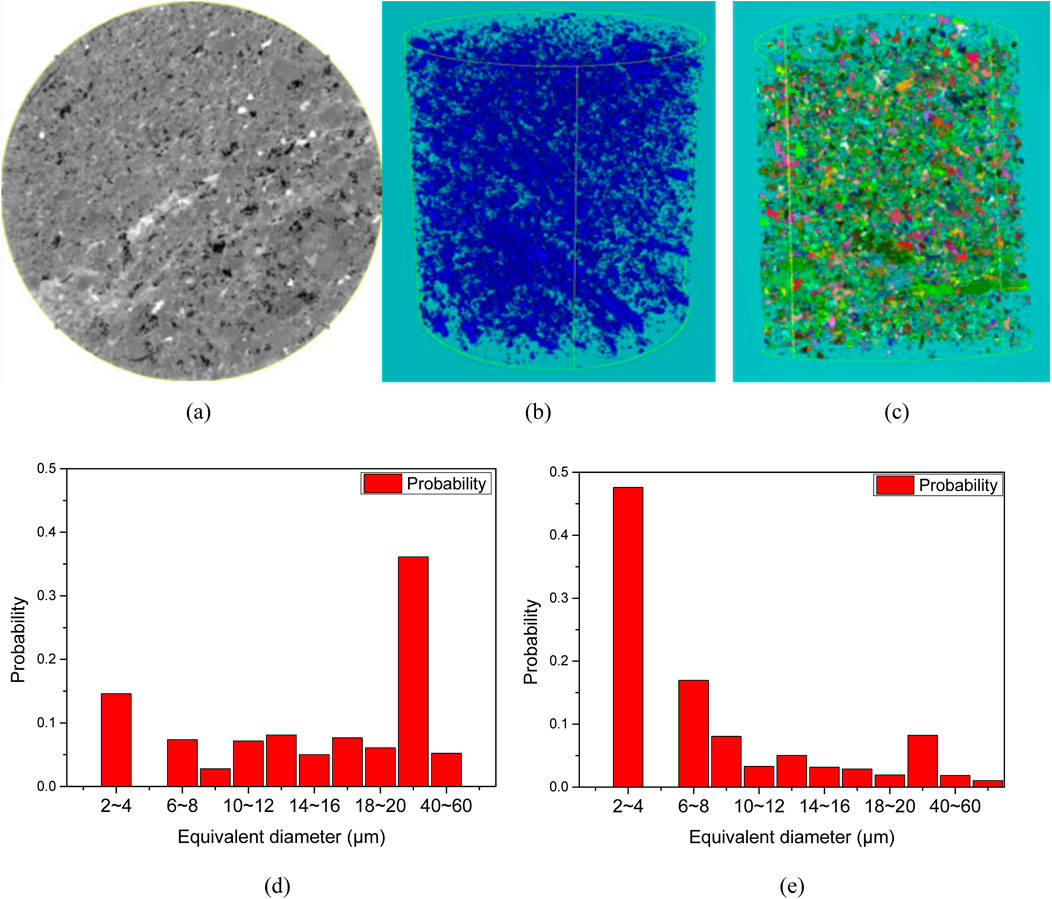
Figure 4. Scanning results of Sample A. The dolomite sample demonstrates homogeneous spatial distributions in both pore body and connecting throat dimensions. (a) 2-D grayscale image (b) Digital core image (c) Schematic of pore-throat model. (d) Distribution of pore diameter (e) Distribution of throat diameter.
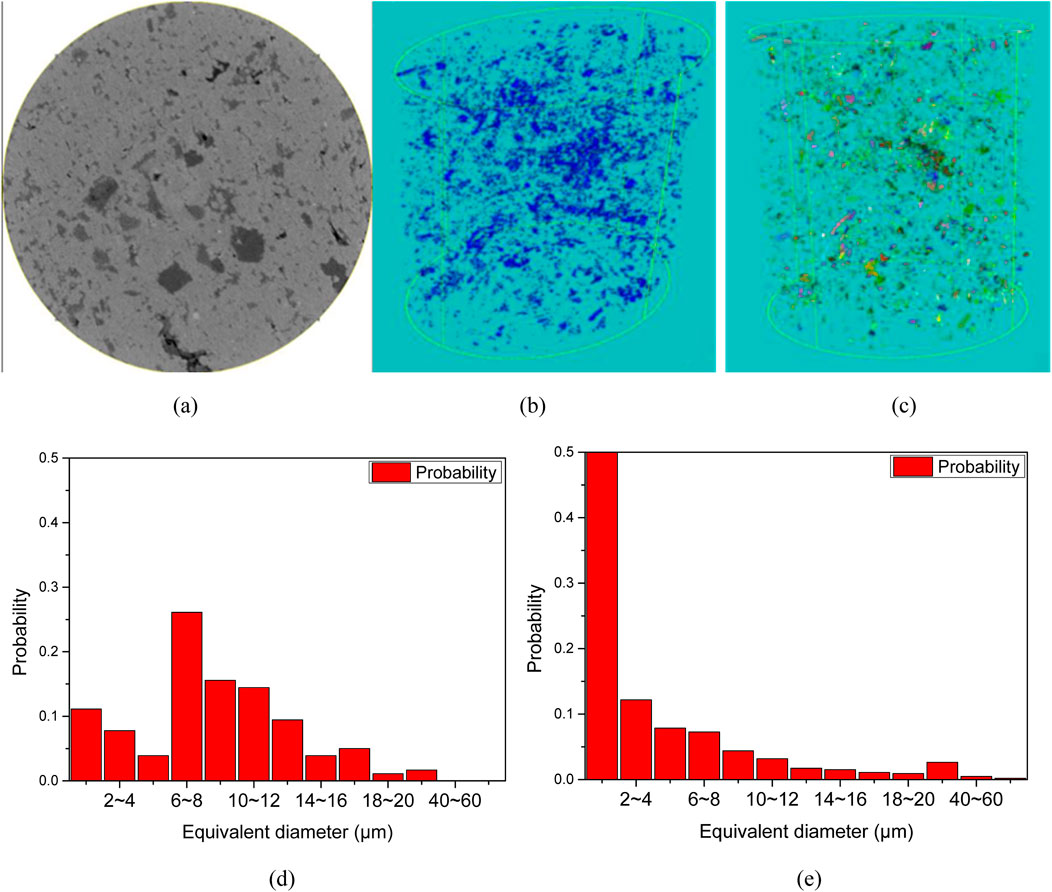
Figure 5. Scanning results of Sample G. Statistical analysis of mudstone samples reveals normally distributed pore apertures contrasted against gamma-distributed conduit sizes, the latter demonstrating marked size reduction. (a) 2-D grayscale image (b) Digital core image (c) Schematic of pore-throat model. (d) Distribution of pore diameter (e) Distribution of throat diameter.
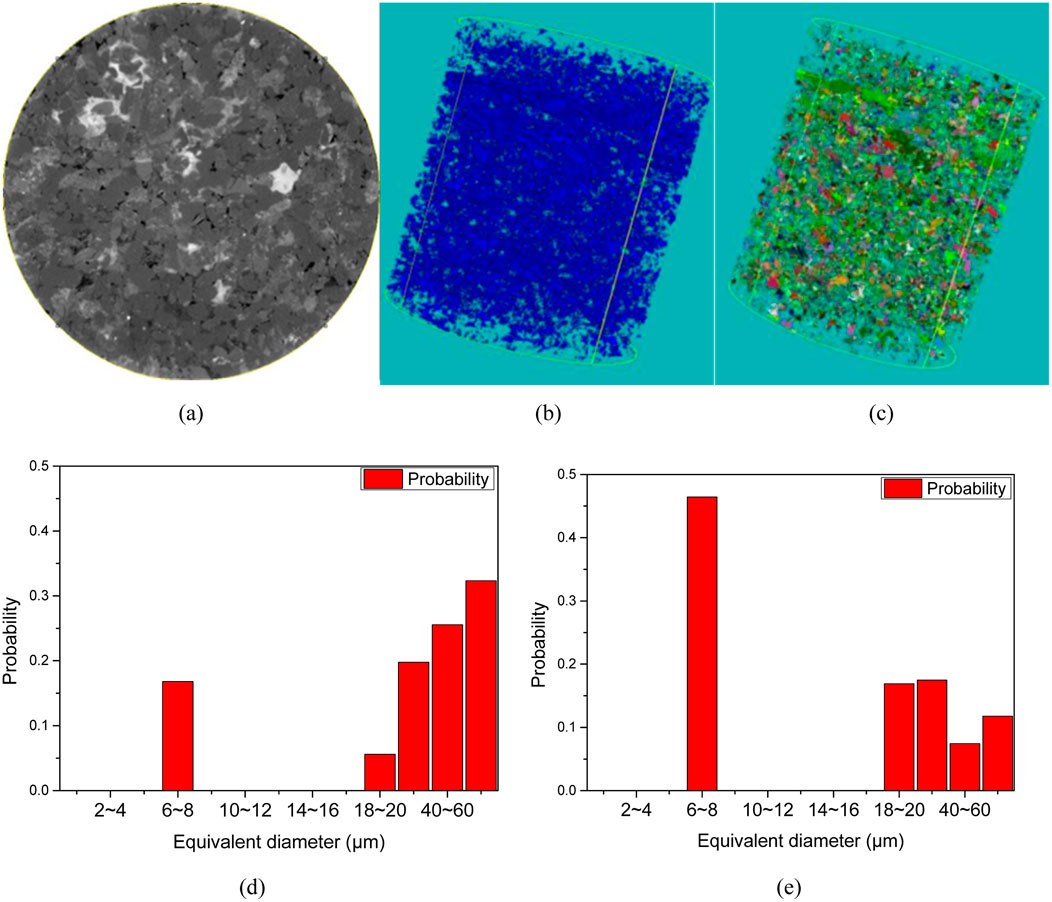
Figure 6. Scanning results of Sample H. The petrophysical architecture of sanstone samples demonstrates marked heterogeneity, with polydisperse distributions governing pore body dimensions and associated throat apertures. (a) 2-D grayscale image (b) Digital core image (c) Schematic of pore-throat model. (d) Distribution of pore diameter (e) Distribution of throat diameter.
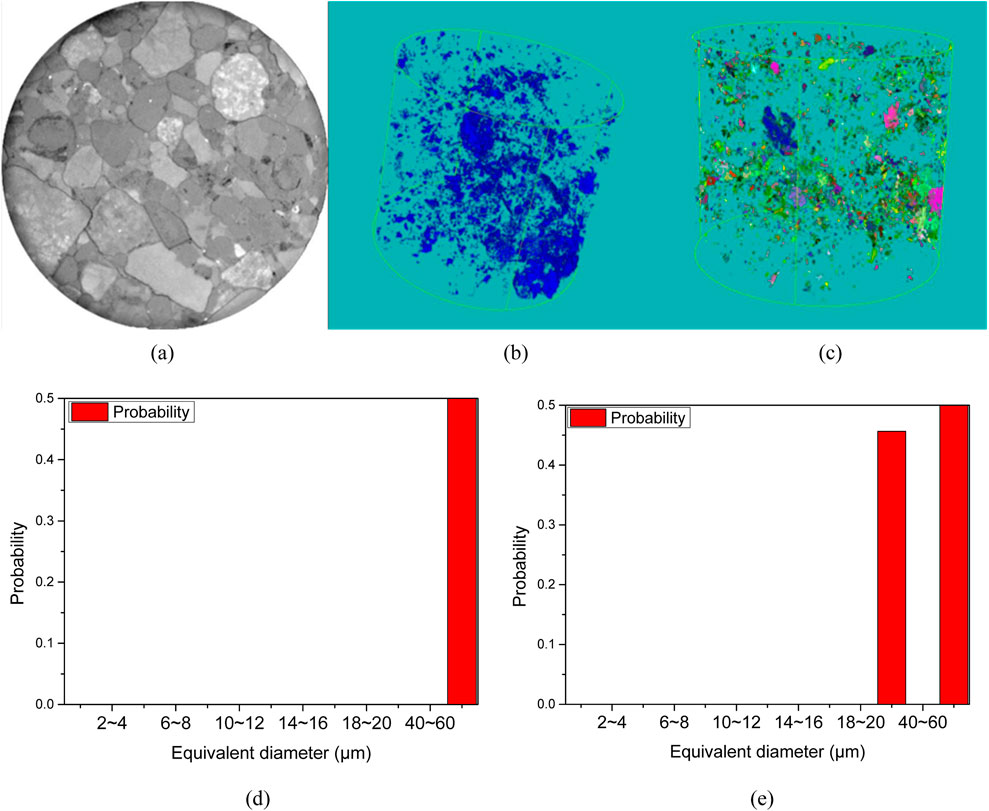
Figure 7. Scanning results of Sample I. Statistical analysis reveals narrow dispersion indices in the macroporous architecture of conglomerates, where pore bodies and associated throats collectively display elevated size spectra. (a) 2-D grayscale image (b) Digital core image (c) Schematic of pore-throat model. (d) Distribution of pore diameter (e) Distribution of throat diameter.
The statistical results of the 3D scanning of the nine samples are shown in Table 2, where φ is porosity, dp is pore diameter, dt is throat diameter, C is the coordination number, G is the throat shape factor and pc is percentage of the connected pores. The 3D scanning can simultaneously obtain the pore and throat scale distribution patterns and connectivity, which is superior to the conventional method, e.g., conventional thin section method, and the data are more intuitive and reliable (Niu et al., 2023; Liu et al., 2022). The micro-CT scanning results show that the pore diameters of dolomitic rocks, mudstones and sandstones are centrally distributed below 10 μm, but the contribution of this part of the pores to the storage space is very small, and the pores with larger sizes (diameters larger than 40 μm) have the largest contribution to the pore space, although the proportion of larger pores is small.
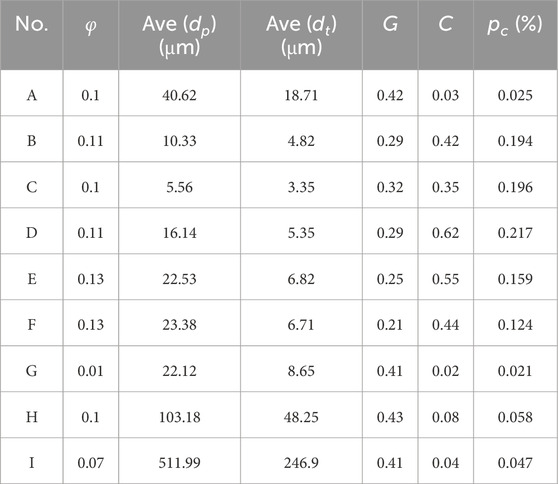
Table 2. 3-D CT scanning statistics, including porosity φ, pore diameter dp, throat diameter dt, coordination number C, throat shape factor G and percentage of the connected pores pc.
Compared to other reservoir types, such as conventional sandstone and carbonate reservoirs (Niu et al., 2023; Liu et al., 2022), tight reservoirs exhibit pore-throat sizes that are 1–2 orders of magnitude smaller. This significant reduction in pore-throat dimensions is likely a primary factor contributing to the ultra-low permeability characteristics observed in tight reservoirs. The coordination number distribution shows that the connectivity of the three rock samples is very poor, which is another contribution to the low permeability of the tight reservoir.
3.2 FIB-SEM scanning results
FIB-SEM scanning was used to obtain 280 2D images of dolomitic sandstone, with a single image scan area of 37.5 μm × 25.1 μm and a resolution of 24.4 nm; 180 2D images of dolomitic mudstone, with a single image scan area of 37. 4 μm × 25.3μm and a resolution of 24.4 nm, with a spliced FOV of 1.123 mm × 151.9μm; 480 2D images of mudstone, with a single image scan area of 45.2 μm × 30.2 μm and a resolution of 29.4 nm, with a spliced FOV of 1. 123 mm × 151.9 μm mm×151.9 μm; 480 two-dimensional images of mudstone were obtained with a scanned area of 45.2 μm × 30.2 μm, a resolution of 29.4 nm and a spliced field of view of 1.355 mm × 483.3 μm. The scanned images of the three types of rock splices are shown in Figure 8, and in the case of the dolomitic sandstone, for example, a large bright area represents the skeleton, and some light grey areas represent the kerogen. In the dolomitic sandstone, for example, the large light areas represent the rock skeleton, the light grey areas in the middle represent the organic matter such as glyptostroboids, and the black dots scattered in the middle as well as the large black areas represent the pores in the rock.

Figure 8. FIB-SEM scanning results of Sample (a) J, (b) K, (c) L, and (d) M.
The distribution of pore diameters and area weight of different pore diameters are statistically shown in Figures 9, 10. Furthermore, the pore size distribution of samples J-K are also listed in Table 3. From the analysis of FIB-SEM scanning results, the two-dimensional pore size and area ratio distribution of dolomitic sandstone, dolomitic mudstone and mudstone were obtained, and the frequency ratio of the pore throat radius mainly below 0.1 μm was 81%, which was similar to that of the experimental results of constant velocity mercury compression (75%), but the area weight was only 20%, and the pore frequency weight of the pore throat diameter larger than 1,000 nm was 0.37%, but the area weight was 50%. The frequency weight of pores with a throat diameter greater than 1,000 nm is 0.37%, but the area weight is 50%. Therefore, compared to micron sized pores, the influence of nanometer sized pores on permeability is very small and can be ignored. In addition, comparing the dolomitic rock (sample F) of the tight reservoir with the sandstone (sample H) and conglomerate (sample I) of the conventional reservoir, the pore size and pore throat size of the dolomite are 1-2 orders of magnitude smaller than those of the sandstone and conglomerate, and therefore the absolute permeability of the tight reservoir is much lower than that of the conventional reservoir. Therefore, we can draw the following conclusions: the medium in the onshore phase has significant differences from the conventional sandstone and conglomerate due to the characteristics of tightness and inhomogeneity, which leads to a large change in the seepage pattern.
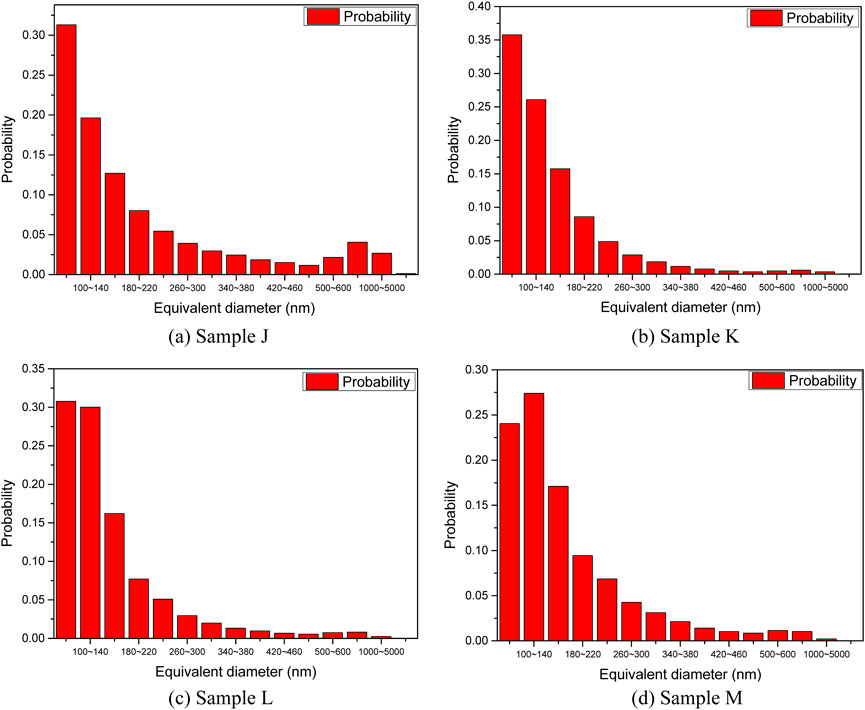
Figure 9. Distribution of pore diameters of Sample (a) J, (b) K, (c) L, and (d) M. Quantitative analysis reveals monotonically decreasing pore population density as a function of increasing pore radius in all investigated lithological categories.
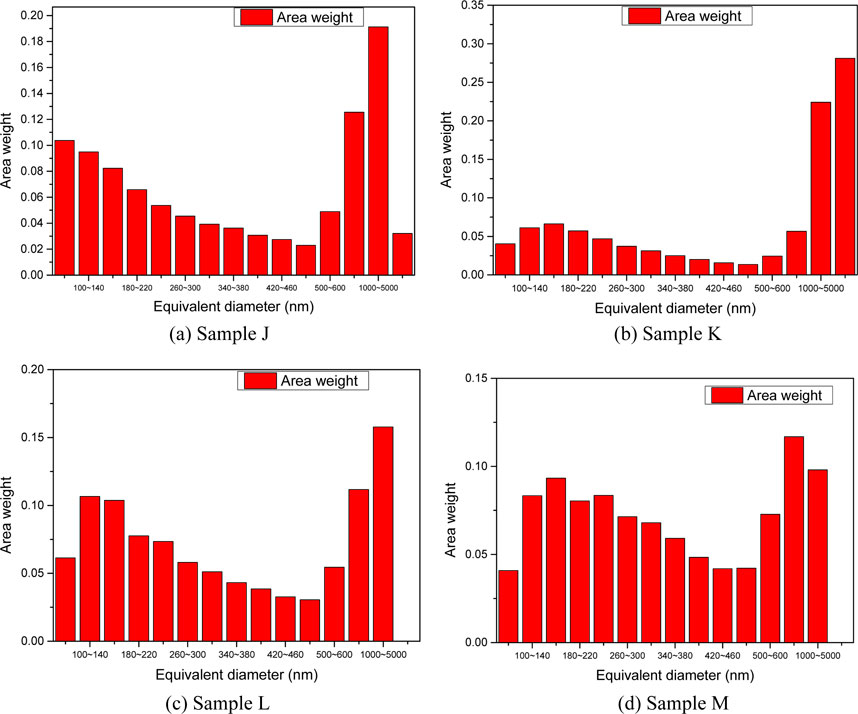
Figure 10. Area weight of different pore diameters of Sample (a) J, (b) K, (c) L, and (d) M. Statistical analysis reveals that while large-diameter pores exhibit lower abundance, they dominate in area-weighted contributions to total porosity.
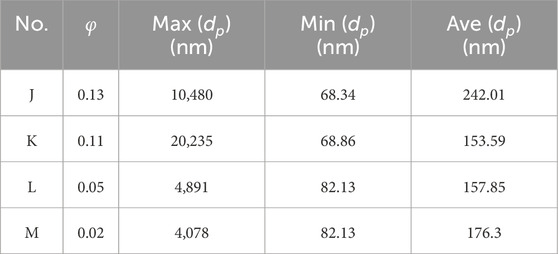
Table 3. Pore size distribution of samples J-K, including porosity φ, maximum, minimum, and average pore diameter.
3.3 Permeability prediction based on pore structure parameters
According to the hydrodynamics theory and the specific structure of the core, it can be assumed that the seepage characteristics of the core mainly depend on the porosity of the core, the size of the pore throat, the coordination number and the shape of the pore throat. Here we take the porosity φ, the average throat cross-section equivalent circle radius rt, the average throat cross-section shape factor G and the coordination number C to be related, thus the empirical formula of permeability K can be expressed as Equation 1:
where, α is the empirical coefficient, and α = 2 × 10⁻³, φ is porosity, rt is the average throat radius, C is the coordination number, G is the throat shape factor.
Table 4 presents the pore structure characteristic parameters of different cores along with their experimentally measured permeability values. The predicted permeability values obtained from the above formula are close to the experimental values, which could validate the correctness of the proposed empirical formula. The proposed formula is solely dependent on microstructural parameters and demonstrates universal applicability, as evidenced by its consistent performance across a wide range of experimental data. Among several parameters, the throat radius has the most significant influence on the permeability. Due to the extremely small throat radius in tight reservoirs, their permeability is much lower than that of conventional reservoirs.
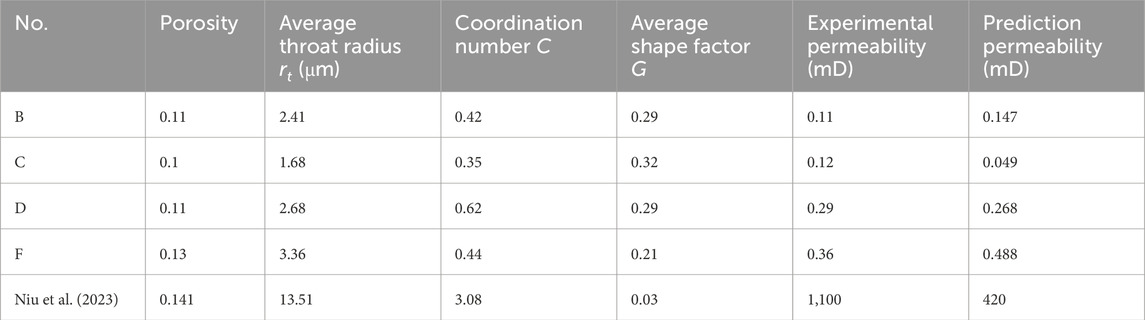
Table 4. Pore structure characteristic parameters and permeability.
Furthermore, the proposed model was validated against experimental data reported in existing literature (Niu et al., 2023). As summarized in Table 4, the predicted values obtained from the model align with the experimental measurements within the same order of magnitude. Although discrepancies in absolute magnitudes are observed, this consistency substantiates the rationality and applicability of the model. In future studies, further efforts will be dedicated to refining the permeability model to enhance its generalizability across diverse geological conditions and fluid transport scenarios.
4 Conclusion
In this paper, the clear microscopic pore structure and pore throat scale distribution pattern of four typical lithologies, namely, dolomite, sandstone, mudstone and conglomerate, were obtained by Micro-CT scanning technology. The analysis reveals that the average pore-throat size in tight reservoirs is on the order of a few micrometers, which is 1-2 orders of magnitude smaller than that observed in conventional reservoirs. Additionally, focused ion beam scanning electron microscopy (FIB-SEM) was utilized to characterize the nano- and micron-scale pore-throat distributions within the tight cores. It was found that nanopores with equivalent diameters below 200 nm constitute 20% of the total pore area. However, their contribution to reservoir storage capacity and permeability is minimal. In contrast, the primary storage space and flow pathways are predominantly associated with micron-scale pore throats.
Compared to traditional methods, the integration of 3D micro-CT scanning provides a comprehensive and intuitive digital representation of the core structure, enabling the establishment of accurate seepage models. Meanwhile, nano-scale 2D scanning offers finer details of the microscopic pore-throat structures and their size distributions. The combination of these two techniques yields measurement results that more closely approximate real-world conditions. Finally, a mathematical formula is proposed to predict the absolute permeability of tight reservoirs based on microscopic scanning data. This formula is both general and computationally efficient, providing essential foundational data for the design and optimization of reservoir development strategies. In future studies, further efforts will be dedicated to refining the permeability model to enhance its generalizability across diverse geological conditions and fluid transport scenarios.
Data availability statement
The raw data supporting the conclusions of this article will be made available by the authors, without undue reservation.
Author contributions
WL: Writing – review and editing, Funding acquisition, Resources. LS: Writing – review and editing, Funding acquisition, Project administration, Resources, Validation. GG: Data curation, Writing – review and editing, Supervision. DL: Writing – review and editing, Software, Supervision. MW: Writing – review and editing. WG: Writing – review and editing, Investigation, Methodology. QJ: Writing – review and editing, Project administration, Validation. GZ: Writing – review and editing, Data curation, Funding acquisition, Resources. HZ: Writing – original draft. PH: Writing – review and editing, Methodology, Writing – original draft. LP: Data curation, Funding acquisition, Resources, Writing – review and editing, Project administration.
Funding
The author(s) declare that no financial support was received for the research and/or publication of this article.
Conflict of interest
The authors declare that the research was conducted in the absence of any commercial or financial relationships that could be construed as a potential conflict of interest.
Generative AI statement
The author(s) declare that no Generative AI was used in the creation of this manuscript.
Publisher’s note
All claims expressed in this article are solely those of the authors and do not necessarily represent those of their affiliated organizations, or those of the publisher, the editors and the reviewers. Any product that may be evaluated in this article, or claim that may be made by its manufacturer, is not guaranteed or endorsed by the publisher.
References
Arif, M., Mahmoud, M., Zhang, Y., and Iglauer, S. (2020). X-ray tomography imaging of shale microstructures: a review in the context of multiscale correlative imaging. Int. J. Coal Geol., 233. doi:10.1016/j.coal.2020.103641
Berg, C. F. (2014). Permeability description by characteristic length, tortuosity, constriction and porosity. Transp. Porous Media 103, 381–400. doi:10.1007/s11242-014-0307-6
Carman, P. C. (1937). Fluid flow through granular beds. Trans. Inst. Chem. Eng. 15, 150–166. doi:10.1016/S0263-8762(97)80003-2
Chen, X., Ma, R., Wu, J., and Sun, J. (2023). Fractal analysis of coal pore structure based on computed tomography and fluid intrusions. Fractal & Fract. 7 (6), 439. doi:10.3390/fractalfract7060439
Curtis, M. E., Sondergeld, C. H., Ambrose, R. J., and Rai, C. S. (2012). Microstructural investigation of gas shales in two and three dimensions using nanometer-scale resolution imaging. AAPG Bull. 96 (4), 665–677. doi:10.1306/08151110188
Dresselhaus, M. S., and Thomas, I. L. (2001). Alternative energy technologies. Nature 414 (6861), 332–337. doi:10.1038/35104599
En Orlov, D., Ebadi, M., Muravleva, E., Volkhonskiy, D., Erofeev, A., Savenkov, E., et al. (2021). Different methods of permeability calculation in digital twins of tight sandstones. J. Nat. Gas. Sci. Eng. 87, 103750. doi:10.1016/j.jngse.2020.103750
Fauzi, U. (2011). An estimation of rock permeability and its anisotropy from thin sections using a renormalization group approach. Environ. Eff. 33, 539–548. doi:10.1080/15567030903097038
Hao, J., Shu, L., Huo, Z., Fan, Y., Wu, S., Li, Y., et al. (2023). Quantitative characterization of pore-fracture structure of medium and high-rank coal based on micro-CT technology. Int. J. Coal Prep. Util. 44, 358–375. doi:10.1080/19392699.2023.2190102
Hughes, J. D. (2013). Energy: a reality check on the shale revolution. Nature 494 (7437), 307–308. doi:10.1038/494307a
Javadpour, F., Singh, H., Rabbani, A., Babaei, M., and Enayati, S. (2021). Gas flow models of shale: a review. Energy fuels. 35, 2999–3010. doi:10.1021/acs.energyfuels.0c04381
Kerr, R. A. (2010). Natural gas from shale bursts onto the scene. Science 328 (5986), 1624–1626. doi:10.1126/science.328.5986.1624
Kozeny, J. (1927). Uber kapillare leitung des wassers in boden. R. Acad. Sci. Vienna Proc. Cl. I 136, 271–306.
Lai, J., Wang, G., Wang, Z., Chen, J., Pang, X., Wang, S., et al. (2018). A review on pore structure characterization in tight sandstones. Earth-Science Rev. 177, 436–457. doi:10.1016/j.earscirev.2017.12.003
Liu, H., Ma, C., and Zhu, C. (2022). X-Ray micro CT based characterization of pore-throat network for marine carbonates from south China sea for marine carbonates from south China sea. Appl. Sci. 12, 2611, doi:10.3390/app12052611
Loucks, R. G., Reed, R. M., Ruppel, S. C., and Hammes, U. (2012). Spectrum of pore types and networks in mudrocks and a descriptive classification for matrix-related mudrock pores. AAPG Bull. 96 (6), 1071–1098. doi:10.1306/08171111061
Martini, A. M., Budai, J. M., Walter, L. M., and Schoell, M. (1996). Microbial generation of economic accumulations of methane within a shallow organic-rich shale. Nature 383, 155–158. doi:10.1038/383155a0
Niu, W., Zhao, Y., Song, X., Yu, Z., Liu, Y., and Gong, Y. (2023). Construction of pore network model based on computational geometry Geometry. Acta Geophys. 71, 2197–2216. doi:10.1007/s11600-023-01027-2
Slatt, M. S., and O’Brien, N. R. (2011). Pore types in the Barnett and Woodford gas shales: contribution to understanding gas storage and migration pathways in fine-grained rocks. AAPG Bull. 95 (12), 2017–2030. doi:10.1306/03301110145
Song, S., Liu, Q., Cao, X., Zhang, T., and Tu, Q. (2023). Construction of pore structure geometry model from digital images of porous media and its application in pore-scale flow simulation. Geoenergy Sci. Eng., 229. doi:10.1016/j.geoen.2023.212079
Takbiri-Borujeni, A., Fathi, E., Kazemi, M., and Belyadi, F. (2019). An integrated multiscale model for gas storage and transport in shale reservoirs. Fuel 237, 1228–1243. doi:10.1016/j.fuel.2018.10.037
Wadsworth, F. B., Vasseur, J., Heap, M. J., Carbillet, L., Dingwell, D. B., Reuschlé, T., et al. (2023). A universal model for the permeability of sintered materials. Acta Mater. 250, 118859. doi:10.1016/j.actamat.2023.118859
Wang, S., Javadpour, F., and Feng, Q. (2016). Molecular dynamics simulations of oil transport through inorganic nanopores in shale. Fuel 171, 74–86. doi:10.1016/j.fuel.2015.12.071
Wei, S., Wang, K., Zhang, H., Zhang, J., Wei, J., Han, W., et al. (2021). A permeability estimation method based on elliptical pore approximation. Water 13, 3290. doi:10.3390/w13223290
Wu, J., Jing, H., Gao, Y., Meng, Q., Yin, Q., and Du, Y. (2022). Effects of carbon nanotube dosage and aggregate size distribution on mechanical property and microstructure of cemented rockfill. Cem. Concr. Compos. 127, 104408. doi:10.1016/j.cemconcomp.2022.104408
Wu, J., Wong, H., Zhang, H., Yin, Q., Jing, H., and Ma, D. (2024). Improvement of cemented rockfill by premixing low-alkalinity activator and fly ash for recycling gangue and partially replacing cement. Cem. Concr. Compos. 145, 105345. doi:10.1016/j.cemconcomp.2023.105345
Wu, J. Y., Yang, S., Williamson, M., Wong, H. S., Bhudia, T., Pu, H., et al. (2025). Microscopic mechanism of cellulose nanofibers modified cemented gangue backfill materials. Adv. Compos. Hybrid Mater. 8, 177. doi:10.1007/s42114-025-01270-9
Yao, J., Song, W., Wang, D., Sun, H., and Li, Y. (2019). Multi-scale pore network modelling of fluid mass transfer in nano-micro porous media. Int. J. Heat Mass Transf. 141 (OCT.), 156–167. doi:10.1016/j.ijheatmasstransfer.2019.06.077
Keywords: microstructure characterization, tight reservoirs, micro-CT, FIB-SEM, permeability
Citation: Liu W, Shang L, Gao G, Li D, Wang M, Geng W, Jia Q, Zhang G, Zhang H, Hao P and Peng L (2025) Microstructure characterization of tight reservoirs using micro-CT and FIB-SEM imaging technology. Front. Earth Sci. 13:1551826. doi: 10.3389/feart.2025.1551826
Received: 26 December 2024; Accepted: 19 May 2025;
Published: 18 June 2025.
Edited by:
Jiangyu Wu, China University of Mining and Technology, ChinaReviewed by:
Kaixuan Zhang, Nankai University, ChinaWeihong Peng, China University of Mining and Technology, China
Copyright © 2025 Liu, Shang, Gao, Li, Wang, Geng, Jia, Zhang, Zhang, Hao and Peng. This is an open-access article distributed under the terms of the Creative Commons Attribution License (CC BY). The use, distribution or reproduction in other forums is permitted, provided the original author(s) and the copyright owner(s) are credited and that the original publication in this journal is cited, in accordance with accepted academic practice. No use, distribution or reproduction is permitted which does not comply with these terms.
*Correspondence: Lin Shang, c2hhbmdsaW5zb25ueUAxNjMuY29t; Haixiang Zhang, emhhbmdoeEB0c2luZ2h1YS5lZHUuY24=