 Sherif Farouk1
 Saada Ahmed Saada2
 Mohamed Arafat3Khaled Al-Kahtany4
 Thomas Gentzis5
 Amr S. Zaky6,7*
 Luigi Jovane7*
- 1Exploration Department, Egyptian Petroleum Research Institute, Cairo, Egypt
- 2Department of Geology, Faculty of Science, Suez University, Suez, Egypt
- 3Geology Department, Faculty of Science, South Valley University, Qena, Egypt
- 4Geology and Geophysics Department, College of Science, King Saud University, Riyadh, Saudi Arabia
- 5Core Laboratories, Reservoir Geology Group, Houston, TX, United States
- 6Geology Department, Faculty of Science, Menoufia University, Shebin El-Kom, Egypt
- 7Instituto Oceanográfico da Universidade de São Paulo, São Paulo, Brazil
This study investigates the origin and thermal maturity of natural gases in Upper Cretaceous reservoirs within the Azhar-E1X well, Beni Suef Basin, Egypt, using stable carbon isotopic analyses of headspace gas samples. Gas shows within the Cretaceous succession, specifically the Bahariya Formation and the Abu Roash “F” Member (A/R “F” Member), were characterized. A total of 15 headspace gas samples and five mud gas samples were analyzed for molecular composition and stable carbon isotopic values (δ13C1, δ13C2, δ13C3). Methane concentrations ranged from 69 to 1,446 ppm in headspace samples and 961–5,670 ppm in mud gases. Isotopic analysis suggests that gases from the A/R “E, F, and G″ members are primarily derived from the primary cracking of kerogen. In contrast, gases from the underlying Bahariya Formation indicate a mixed origin, resulting from both primary cracking of coal-rich kerogen and secondary cracking of oil. The natural gases analyzed are predominantly thermogenic. A normal carbon isotope trend (δ13C1 < δ13C2 < δ13C3) was observed in the headspace gas samples, where methane isotopic compositions are lower than those of ethane.
1 Introduction
The Beni Suef Basin (BSB), located in north-central Egypt, is a structurally complex extensional rift basin that formed during the Cretaceous break-up of Gondwana. The basin’s evolution is characterized by significant tectonic subsidence, which has played a critical role in controlling the burial history, thermal maturation, and hydrocarbon generation within its stratigraphic units. Key intervals, such as the Abu Roash and Kharita Formations, serve as major source rocks, with their maturity levels closely tied to the basin’s subsidence-driven burial history and associated heat flow (Tawfik et al., 2022; Farouk et al., 2024a; Farouk et al., 2024b).
Stable carbon (δ13C) and hydrogen (δD) isotope measurements are crucial in determining the thermal maturation and genetic origin of natural gas and correlating natural gas to its source rock (Schoell, 1988). Natural gas forms primarily through thermogenic and biogenic (microbial) processes. Microbial gas mainly results from microbial decomposition of organic matter at temperatures below 80°C (Schoell, 1988; Huang and Larter, 2014). Thermogenic gas, on the other hand, is produced by the thermal degradation of organic matter, involving both primary cracking of kerogen and secondary cracking of oil and gas (Dai et al., 1985).
By integrating isotopic data with genetic diagrams and maturity parameters, such as the iC4/nC4 ratio, this study provides enhanced insights into the hydrocarbon potential of the BSB. Unlike general descriptions of organic matter degradation into thermogenic gas, our work emphasizes the specific isotopic and geochemical processes within the basin. Furthermore, it critically examines the differences between headspace and mud gases to understand secondary alterations, including migration and fractionation, to present a more comprehensive understanding of the region’s petroleum system. To date, no published studies have specifically examined the origin of natural gas in the Cretaceous reservoirs of the Beni Suef Basin (BSB) using high-resolution stable carbon isotopic data.
This study addresses this critical gap by integrating δ13C analyses of headspace and mud gases from the Azhar-E1X well to evaluate the interplay between thermal maturity, subsidence-driven burial history, and secondary alteration processes. The main objectives are to (1) determine the origin and thermal evolution of reservoir gases through δ13C1–δ13C3 signatures, (2) assess the impact of basin subsidence, hydrocarbon generation kinetics, and post-genetic processes (such as migration and isotopic fractionation) on gas composition, and (3) resolve discrepancies between headspace and mud gas isotopic signatures to refine models of secondary alteration effects in rift basin petroleum systems.
2 Geological setting
2.1 Structure and tectonic events
Beni Suef Basin (BSB) is an extensional rift basin that spans the West and East Nile provinces, in the Nile Valley and is a significant component of a NW-SE (northwest-southeast) network of Cretaceous basins (Figure 1). The study area covers approximately 57 km2 in the western desert’s northeastern region (Figure 1). The Azhar-E1X well in the Azhar oil field was used to evaluate the hydrocarbon potential in the Cretaceous sequence (Ali et al., 2024). It is located at latitude of 29° 08′45.25″N and longitude of 30° 56′50.07″E. Structures are mostly anticlinal with faults that result from the vertical movement of basement blocks (Schlumberger, 1984; Schlumberger Middle East, 1995). There are three major patterns displayed by faults in the Northwestern Desert: NE-SW (Northeast-Southwest), E-W (East-West), and NW-SE (Northwest-Southeast). Understanding the tectonic forces and processes that shaped the region’s geological formation can be gained by studying fault trends. The shallower areas are characterized by several hanging faults. The initial conceptual model illustrates Africa’s movement relative to Eurasia, indicating an eastward shift from the Lower Jurassic to the early Late Cretaceous, a subsequent westward movement from the later Late Cretaceous to the late Eocene, and a final northward shift from the latest Eocene to the present (Smith, 1971). Because of the collision of Africa and Asia, three tectonic events impacted northern Egypt. The oldest event resulted in NW or WNW trending structures. Another event that occurred during the Cretaceous resulted in the ENE trending Syrian Arc structures. Lastly, the third event occurred during the Late Eocene to the Early Oligocene and resulted in NW and NNE trending structures (Meshref, 1982). The BSB was controlled by the Aptian/Albian NE-SW extension movement. This movement resulted in deposition of the Albian Kharita Formation directly on the crystalline rocks of the Egyptian Basement Complex (Moustafa et al., 2008; Zahran et al., 2011; Abdel-Fattah, 2015; Salem and Sehim, 2017; Nabawy et al., 2022). These structural tectonics were caused by Africa’s displacement with respect to Eurasia (Smith, 1971). Significant Miocene uplift that resulted from the pre-rift Red Sea thermal uplift was documented by Bosworth and Stockli (2016). Salem and Sehim (2017) evaluated the BSB’s extensional rifting during Eocene time. With a few notable variations in the thickness and absence of certain rock layers, most wells that were drilled in the study area indicated the same geologic column as in the Northwest Desert of Egypt, where the Abu Roash Formation (A/R) “D” Member was absent due to faulting. The age of the rock units ranges from the Albian Kharita Formation to the Eocene - Oligocene Dabaa Formation (Figure 2).
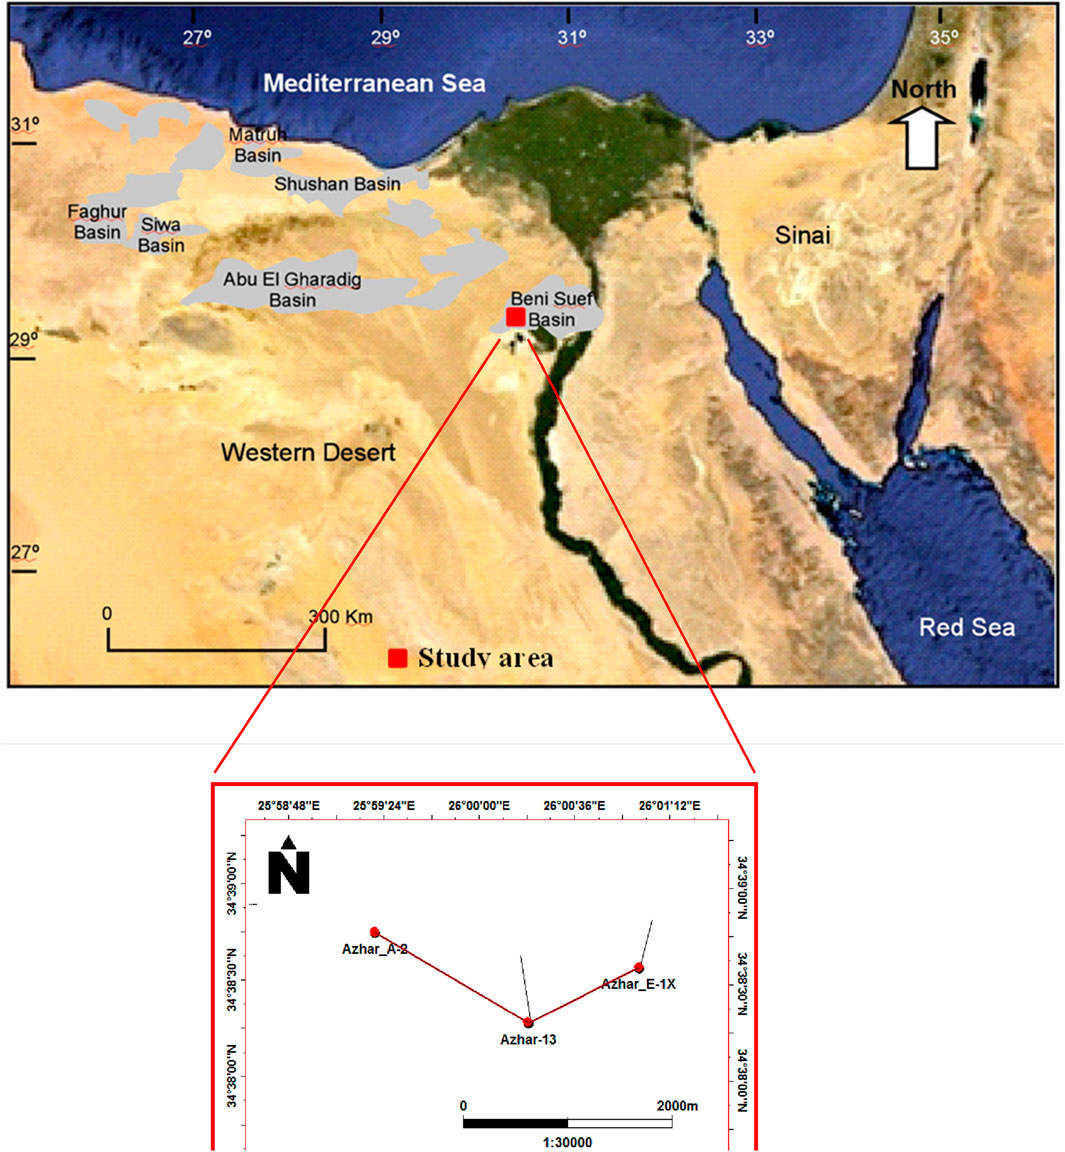
Figure 1. Location map showing the Azhar Field, Beni Suef basin, Egypt (Farouk et al., 2024a; Farouk et al., 2024c).
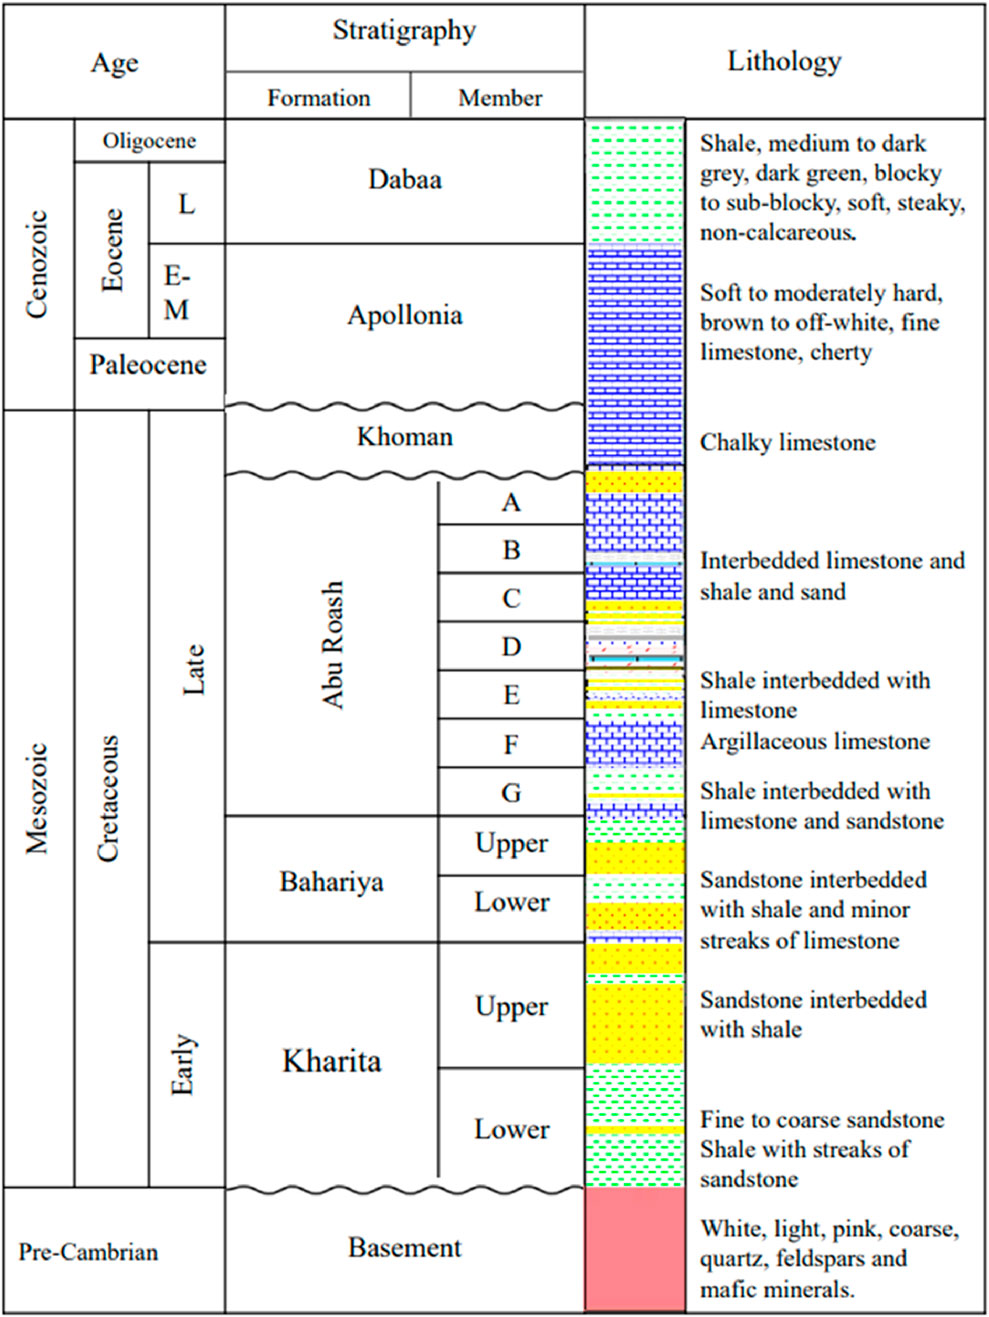
Figure 2. BSB stratigraphic column (after Edress et al., 2021).
2.2 Lithostratigraphy
The Cretaceous lithostratigraphic succession in the BSB commenced with deposition of fluvial siliciclastic sediments of the Kharita (Kh) Formation in the Early Cretaceous, followed by predominantly siliciclastic sediments from the Cenomanian Bahariya Formation.
The Cenomanian Bahariya Formation, as described by Said (1990), is situated above the fluviatile sediments of the Kh Formation and is conformably overlain by the marine A/R Formation. It consists of interbedded sandstone and siltstone, with occasional limestone and shale intercalations (Figure 2). The lower section of the formation is predominantly by sand-based units, exhibiting repeated patterns of blocky gamma-ray features (Figure 2). Conversely, the upper sections display a significant increase in gamma ray/neutron porosity readings, indicating higher mud content in the upward direction (Figure 2).
The Bahariya Formation was followed by clastic/carbonate units from the Upper Cenomanian-Santonian A/R Formation, and eventually gives way to carbonates and chalk from the Campanian–Maastrichtian Khoman Formation (Zahran et al., 2011; Shehata et al., 2019; Shehata et al., 2020; Mansour et al., 2024).
The A/R Formation is thick in the BSB and has a thickness of more than 1,000 m (Hantar, 1990). Palynological dating of the A/R Formation in the Western Desert basins indicates Cenomanian to early Santonian age (Tahoun and Deaf, 2016). The A/R Formation, named by Norton (1967), are overlies the Bahariya Formation in the northwestern Desert and frequently underlies the Khoman Formation. The formation is mostly composed of limestone interbedded with shale and sandstone. In the north Western Desert, the A/R Formation is separated into seven conformable, well-defined, and clearly traceable clastic and carbonate members, known as from base to top: the “G”, “F”, “E”, “D”, “C”, “B”, and “A” members (Schlumberger Middle East, 1995) (Figure 2).
2.3 Burial history
Subsidence in the BSB, driven by rifting and vertical movements of basement blocks, has led to significant burial depths and the progressive thermal maturation of organic matter. The Aptian-Albian extension initiated the deposition of the Kharita Formation directly on the crystalline basement. This was followed by the deposition of the Bahariya Formation and A/R Formation during successive transgressive and regressive cycles. The basin’s subsidence history has resulted in varying burial depths and geothermal gradients, creating distinct thermal maturity zones across the stratigraphic column.
The geological assessment of subsidence in the basin reveals the interplay between tectonics, sedimentation, and organic matter maturation, which ultimately controls the hydrocarbon system. Geological subsidence in the BSB has resulted in the progressive burial and heating of organic-rich sediments, driving the thermal cracking of kerogen to generate hydrocarbons. For example, the lower Kharita Formation has reached peak maturity within the oil generation window, while the Abu Roash members range from immature to early mature stages. Elevated heat flow values (57–60 mW/m2) coupled with rapid subsidence during the Cretaceous have accelerated maturation rates, affecting gas composition and isotopic characteristics (Mansour et al., 2020; Mansour et al., 2023; Farouk et al., 2024a).
The Cretaceous succession, central to this study, includes Bahariya Formation and A/R “E, F, and G” members, which exhibit significant hydrocarbon potential. The Bahariya Formation, deposited in fluvial to shallow marine environments, represents deeper burial and higher thermal maturity than the overlying A/R Formation. Geochemical and isotopic data suggest the gases from the Bahariya Formation are thermogenically derived, with signatures indicating both primary kerogen cracking and secondary oil cracking. In contrast, the A/R “E, F, and G” members are associated with earlier stages of maturity, reflecting their relatively shallower burial.
3 Methodology and sample collection
3.1 Differences between headspace gases and mud gases
The sampling methodology for this study follows established protocols (Ferworn et al., 2008), using headspace gas samples collected in isojars and mud gas samples collected in isotubes. While both methods provide insights into hydrocarbon composition, isotopic fractionation during degassing can skew δ13C measurements, affecting interpretations of gas maturity and origin. Headspace gas samples, processed in controlled lab conditions, yield higher-resolution data, but discrepancies with mud gas highlight the need to evaluate fractionation effects.
An isotube is a stainless-steel device for collecting mud gas directly from the degasser tank during drilling. Isojars, airtight containers for cutting samples, prevent biodegradation with water and bactericide. Over 24 h, gases desorb into the jar’s headspace, capturing formation gas with lighter isotopes (12C) released first, while heavier isotopes (13C) remain in the pores (Ferworn et al., 2008; Dominato et al., 2018; Chatellier et al., 2018).
Mud gas analysis provides real-time data for large-scale surveys but may lack precision for specific maturity assessments (Tretner et al., 2008). In contrast, headspace gas samples from core cuttings enable detailed lab analysis of gas composition and isotopic signatures, ensuring accurate maturity evaluation.
3.2 Sampling
A total of fifteen headspace gas samples were collected in isojars and analyzed for molecular gas concentrations using gas chromatography (Table 1). Additionally, five mud gas samples were collected in isotubes and analyzed for molecular gas concentrations using gas chromatography (Table 2) from the Upper Cretaceous succession. This study primarily focused on headspace gas analyses due to their higher accuracy, whereby headspace gas sampling offers higher resolution and more direct measurements for assessing the maturity of specific rock intervals and source rocks (Kolb and Ettre, 2006). Six of the headspace gas samples were also subjected to methane stable carbon isotopic analysis, while 15 headspace gas samples were analyzed for ethane and propane stable carbon isotopic analyses (Table 1). In addition, five samples of mud gas were analyzed for methane, ethane, and propane stable carbon isotopic analyses (Table 2).
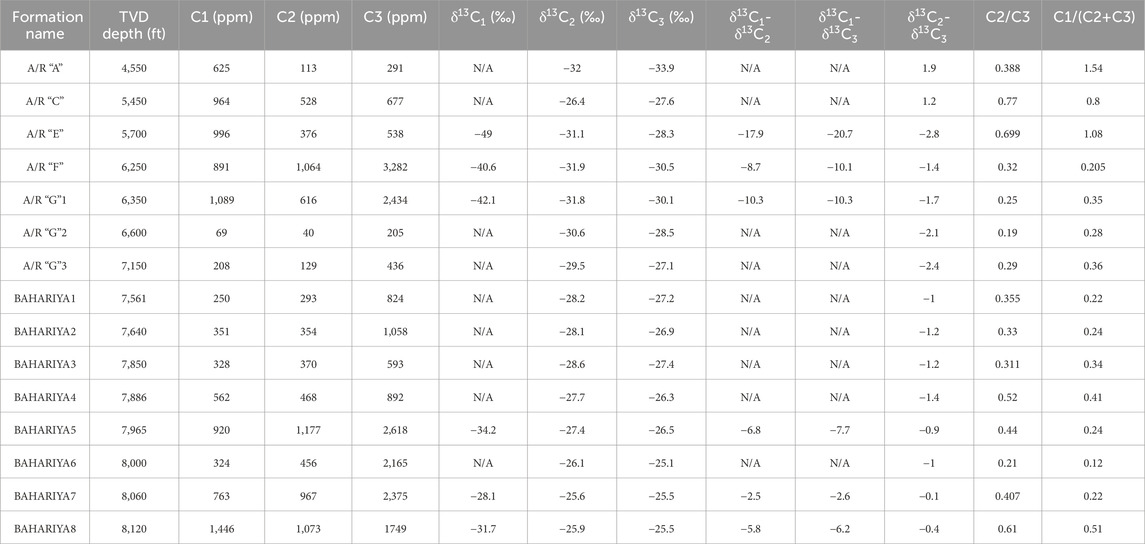
Table 1. Headspace gas samples from the Azhar-E1X well, together with their stable carbon isotopic compositions (‰), including δ13C1 (Methane), δ13C2 (Ethane) and δ13C3 (Propane) and their molecular concentration (ppm).
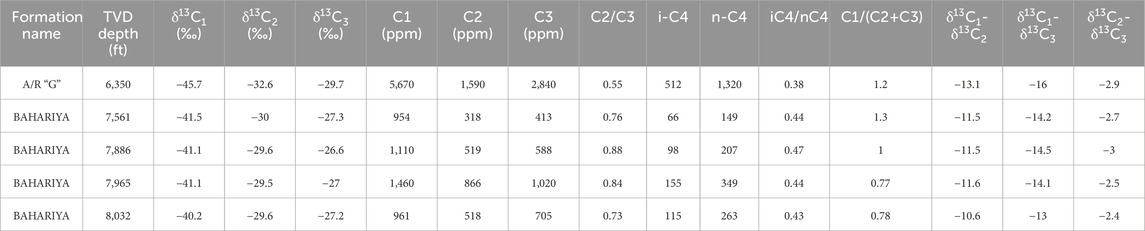
Table 2. Mud gas samples from the Azhar-E1X well, together with their stable carbon isotopic compositions (‰), including δ13C1 (Methane), δ13C2 (Ethane) and δC3 (Propane) and their molecular concentration (ppm), and remain molecular ratios (ppm).
3.3 Gas composition by gas chromatography (GC) and isotopic analysis
To determine the molecular composition of gases, a fused silica capillary column with a diameter of 0.20 mm and a length of 25 mm was used in a Carlo Erba gas chromatograph. The thermal ionization detector was operated at 200°C, while the inlet temperature was maintained at 150°C. The oven temperature was initially held at 40°C for 8 min and then gradually increased to 180°C at a rate of 6°C per minute. The measurement of various hydrocarbon concentrations (methane, ethane, propane, iso-butane, and n-butane) involved comparing the integrated peak areas of the sample and a standard mixture. This chromatographic technique determines the concentrations of hydrocarbons in the sample. Gas chromatography was used to separate the various substances in the gas mixture, enabling the initial separation of gas components. Following this separation, the constituents underwent combustion and subsequent isotope ratio mass spectrometry, which determined the isotopic composition of elements in distinct molecules. The temperature program included a rise from 30°C at 8°C per minute up to 70°C, and then at 3°C per minute up to 270°C, with an inlet temperature of 200°C. The Vienna Pee Dee Belemnite (VPDB) Standard is a commonly used reference material for measuring carbon isotope ratios. The difference between a sample’s stable carbon isotope ratio (13C/12C) and the VPDB standard is expressed using the δ13C notation. This notation indicates the variation in parts per thousand from the VPDB standard, symbolized by per mil (‰).
4 Results
4.1 Concentration of headspace gases
Methane (C1) is the dominant gas in the Azhar E−1X well, with concentrations ranging from 69 ppm to 1,446 ppm. The highest methane concentration (1,446 ppm) was found in the Bahariya Formation at 8,120 ft, indicating higher thermal maturity, while the lowest (69 ppm) was in the A/R “G” Member at 6,600 ft, suggesting lower maturity or biodegradation (Table 1). Ethane (C2) and propane (C3) concentrations vary significantly, with ethane ranging from 40 ppm to 1,177 ppm and propane from 205 ppm to 3,282 ppm. The highest propane concentration (3,282 ppm) was in the A/R “F” Member at 6,250 ft, indicating oil-derived gases. The iC4/nC4 ratio, a thermal maturity indicator, decreases with depth from 2.5 to 0.5, reflecting increasing maturity, as branched hydrocarbons (iC4) are more stable than straight-chain hydrocarbons (nC4) (Table 1).
4.2 Stable carbon isotope compositions
Stable isotopic analysis of headspace gases offers a powerful tool to understand the origins, pathways, and environmental implications of hydrocarbon fluids in geological systems (Philp and Monaco, 2012). Stable carbon isotope values (δ13C) for methane (δ13C1), ethane (δ13C2), and propane (δ13C3) were measured. Methane δ13C1 values range from −49.0‰ to −28.1‰, with the most negative value (−49.0‰) in the A/R “E” Member (5,700 ft), indicating lower maturity, and the least negative (−28.1‰) in the Bahariya Formation (8,060 ft), reflecting higher maturity. Ethane δ13C2 values range from −32.0‰ to −25.9‰, and propane δ13C3 values range from −33.9‰ to −25.1‰, both showing less negative values with depth, consistent with increasing thermal maturity (Table 1).
4.3 Isotopic trends and thermal maturity
The δ13C1 < δ13C2 < δ13C3 trend confirms a normal thermogenic gas origin. The differences in isotopic compositions (Δ13CC1-C2 and Δ13CC1-C3) provide insights into thermal maturity. Δ13CC1-C2 ranges from −17.9‰ to −2.5‰, with the most negative value in the A/R “E” Member (−17.9‰), indicating lower maturity, and the least negative (−2.5‰) in the Bahariya Formation (8,060 ft), reflecting higher maturity. Similarly, Δ13CC1-C3 ranges from −20.7‰ to −2.6‰, with the most negative value in the A/R “E” Member (−20.7‰) and the least negative (−2.6‰) in the Bahariya Formation.
4.4 Mud gas vs. headspace gas comparison
Mud gas samples show higher methane concentrations (961 ppm–5,670 ppm) compared to headspace gases (Table 2), likely due to continuous sampling during drilling. Ethane and propane concentrations in mud gases are also higher, averaging 762 ppm and 1,113 ppm, respectively. Mud gas δ13C values are slightly less negative than headspace gases, with δ13C1 ranging from −45.7‰ to −40.2‰, compared to −49.0‰ to −28.1‰ for headspace gases (Table 2). This difference is attributed to isotopic fractionation during gas desorption and diffusion, which preferentially releases lighter isotopes (e.g., 12C).
4.5 Statistical analysis
Statistical analysis reveals strong correlations between depth and thermal maturity indicators. δ13C1 values increase (become less negative) with depth, from −49.0‰ at 5,700 ft to −28.1‰ at 8,060 ft. The C2/C3 ratio increases with depth, from 0.19 in the A/R “G” Member to 0.61 in the Bahariya Formation, reflecting increasing maturity. The iC4/nC4 ratio decreases with depth, from 2.5 in the A/R “E” Member to 0.5 in the Bahariya Formation, further supporting the trend of increasing thermal maturity.
5 Discussion
5.1 Genetic characterization of natural gases
The types of methane production, the nature of organic sources, and the rate of thermal evolution significantly influence the stable isotopic composition and molecular structure of natural gas. Understanding these factors is essential for evaluating the geochemical characteristics of natural gas and the processes responsible for its formation (Tissot and Welte, 1984; Waples, 1985; Whiticar and Faber, 1986). In geochemistry and source rock analysis, the stable carbon isotopic compositions of ethane (δ13C2) and propane (δ13C3) are critical for distinguishing between gases derived from different organic sources. Specifically, natural gases with δ13C2 values less than −29‰ and δ13C3 values less than −27‰ are typically generated from oil-prone source rocks (Type II kerogen), reflecting the isotopic signature of hydrocarbons derived from marine or lacustrine organic matter rich in liptinite (Dai et al., 1985; Zou et al., 2007; Zumberge et al., 2012). In contrast, gases with δ13C2 values greater than −27.5‰ and δ13C3 values greater than −25.5‰ are generally associated with coal-bearing source rocks (Type III kerogen), indicating a terrestrial origin dominated by vitrinite and inertinite, which are more prone to gas generation (Saxby and Shibaoka, 1986; Dai et al., 2004; Gao et al., 2018). Additionally, gases with δ13C2 values greater than −27.5‰ and δ13C3 values less than −27‰ suggest a mixed origin, where contributions from both oil-prone and coal-prone source rocks are present, often due to the co-existence of different organic facies within the same basin or during migration and accumulation processes (Zou et al., 2007). The influence of oil-derived gas is reflected in the carbon isotopic composition of C2+ hydrocarbons in mixed gases, whereas the coal-derived gas composition mostly determines the δ13CC1 composition of the mixture. When describing the origins and contributions of different hydrocarbons in complex gas mixtures, this kind of isotope study is helpful (Zou et al., 2007). The methane isotopic composition in mixed gas is largely affected by the higher methane content in gas from coal.
In this study, and according to the values of δ13C2 and δ13C3, gas samples from the A/R “E, F and G” members are located in the oil-derived gas zone, whereas the underlying Bahariya Formation samples range from mixed gas (7,561 ft–7,886 ft) to coal-derived gas (7,886 ft–8,120 ft) (Table 1; Figure 3).
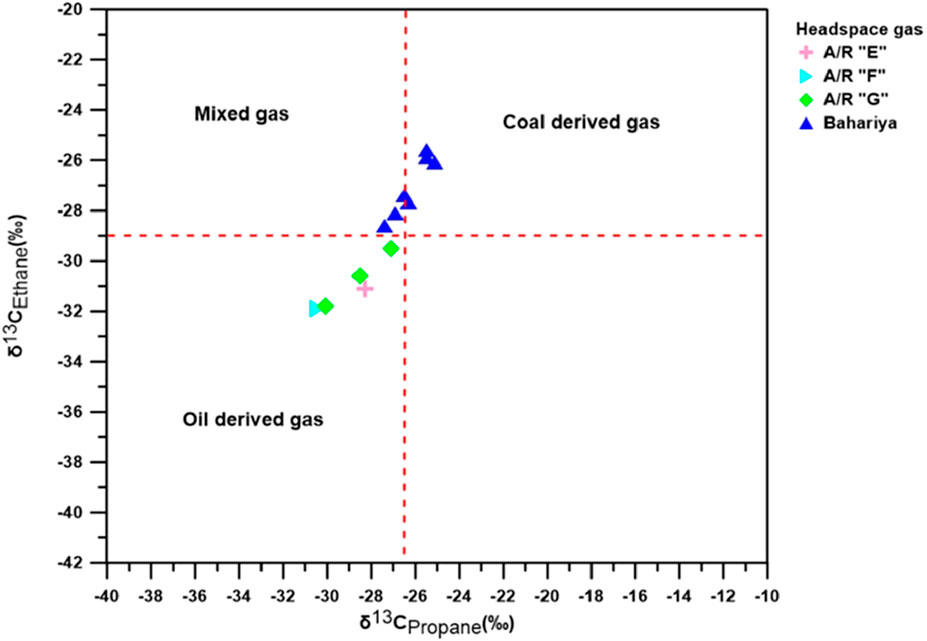
Figure 3. δ13C2 versus δ13C3 diagram of headspace gas samples of Azhar-E1X well (after Dai et al., 1985).
A comparison between the δ13C1, δ13C2 and δ13C3 confirms that the headspace gas samples of the A/R “E, F and G” members are oil-derived and that the headspace gas samples of the Bahariya Formation are coal-derived (Figure 4).
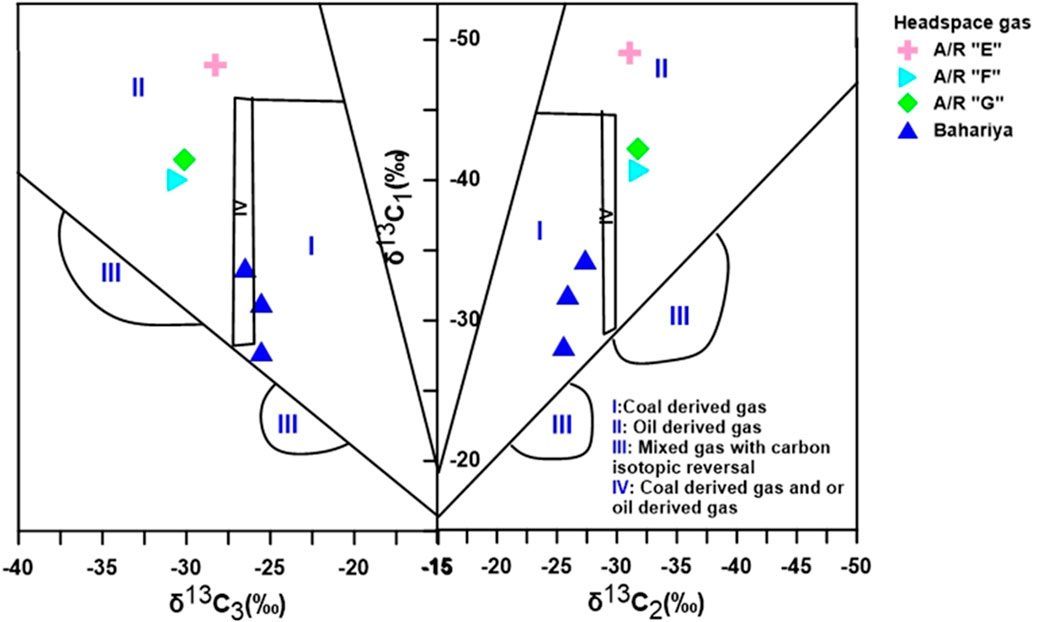
Figure 4. Combined plots of δ13C1- δ13C2- δ13C3 headspace gas samples of Azhar-E1X well (after Dai et al., 1985).
To differentiate between the thermogenic and microbial origins of natural gases, the δ13C1 valuesare widely used (Schoell, 1980; Schoell, 1983; Whiticar, 1994; Whiticar, 1999; Prinzhofer and Battani, 2003; Xia and Gao, 2017). δ13C values for methane and ethane facilitate differentiation of gas samples while providing insights into gas origins and alteration histories (Cesar et al., 2021). The δ13C1 values of the headspace gas samples range from −49.0 to −28.1‰, which confirms that they are they are predominantly thermogenic and were generated at relatively low thermal maturity (Figure 5), possibly in the early to middle stages of the oil window. The samples from the Bahariya Formation also plot along with the kerogen Type III trend whereas the A/R Formation samples plot in proximity to the mixed Type II/Type III and kerogen Type II trends (Figure 5).
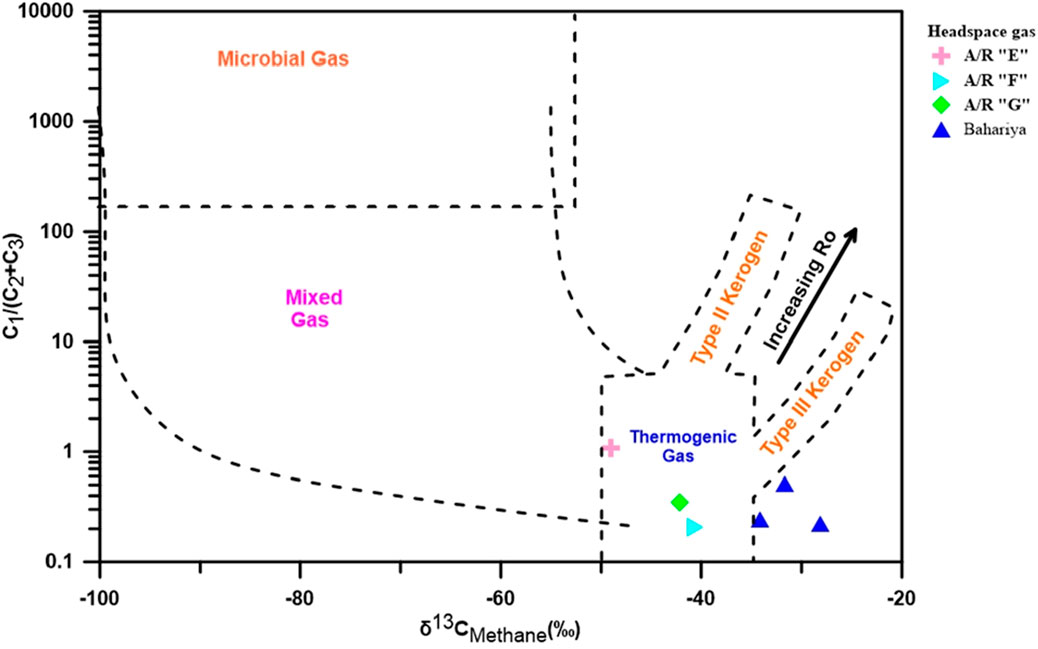
Figure 5. Bernard diagram for headspace gas classifies gas using the combination of C1/(C2+C3) ratio and δ13CC1ratio (after Bernard et al., 1978; Faber and Stahl, 1984).
Gas molecules form in geological formations through primary and secondary cracking of organic matter. While heavier hydrocarbons break down during secondary cracking, kerogen breaks down directly during primary cracking. The specific conditions of thermal maturation significantly impact the composition of the resulting natural gases (Tissot and Welte, 1984). Separating primary gas cracking from secondary gas cracking is crucial. In the early phases of the oil window and the wet gas window, kerogen cracking is the main process that produces hydrocarbons (Curtis, 2010).
Tian (2006) proposed a plot of δ13C2 - δ13C3 versus δ13C1 to distinguish between oil and kerogen-derived gases. As thermal stress increases, the δ13C2 - δ13C3 gap between oil and kerogen-derived gases becomes significantly larger. The δ13C2 - δ13C3 versus ln(C2/C3) plot of Prinzhofer and Huc (1995) was used to indicate the origin of gases. The A/R “E, F, and G” members exhibit higher fractionation of δ13C2 - δ13C3 than ln(C2/C3), indicating primary cracking of kerogen (Type II). In contrast, the Bahariya Formation shows two distinct trends. In the first trend, the fractionation of δ13C2 - δ13C3 is lower than ln(C2/C3), indicating secondary cracking of oil (Type III). In the second trend, the fractionation of δ13C2 - δ13C3 is higher than ln(C2/C3), suggesting primary cracking of kerogen (Type II) (Figure 6).
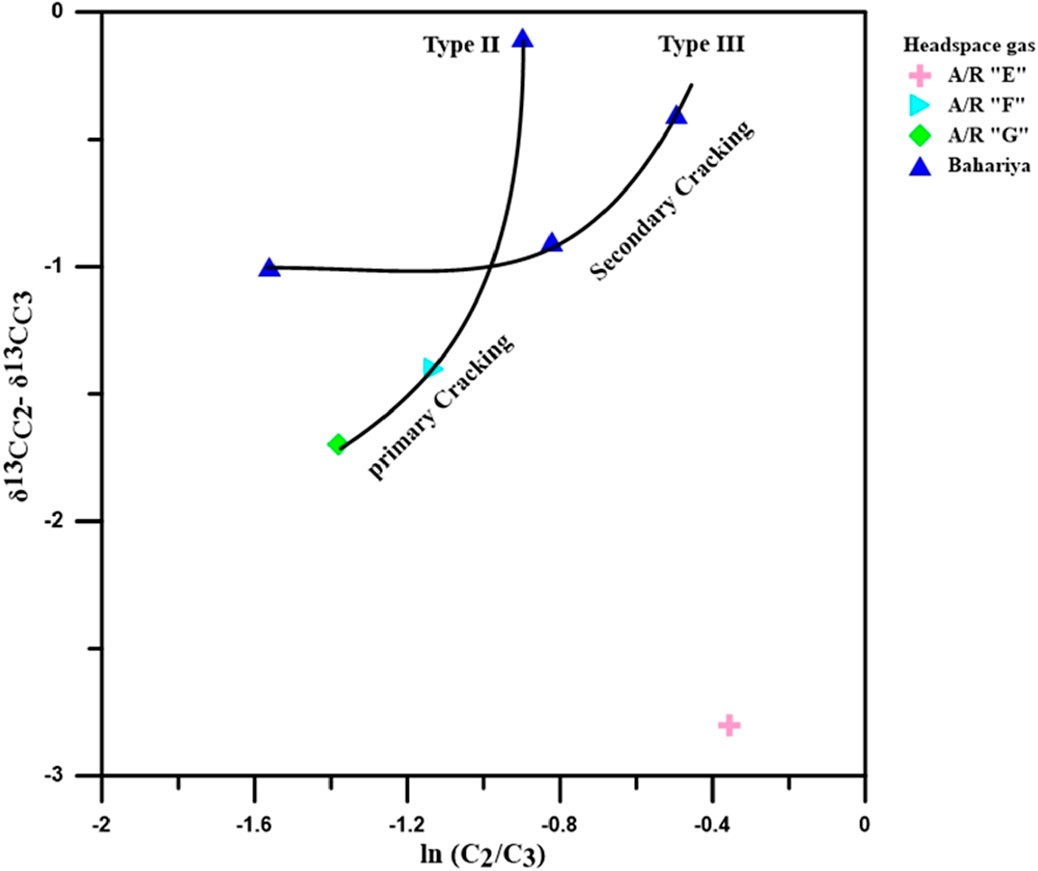
Figure 6. δ13C2 - δ13C3 vs. lnC2/C3 plot (after Prinzhofer and Huc, 1995).
5.2 Fractionation of carbon isotopes and alteration processes
Changes to the isotopic and molecular compositions in natural gases can occur as a result of several factors, including high thermal maturity, migration, biodegradation, mixing of gases from various sources, and thermochemical sulphate reduction (TSR) (Schoell, 1983; Dai et al., 1985; Whiticar, 1994; Whiticar, 1999; Hao et al., 2008), The lack of detectable H2S in the studied gases suggests that TSR has not influenced the natural gas at the well site.
Compared to iso-alkanes and non-hydrocarbons, n-alkanes are more susceptible to biodegradation. Hydrocarbons exhibit various degrees of resistance to biodegradation (Peters et al., 2005). Alkanes crack (thermally degrade) in the following order: C3; nC4; nC5; iC5; iC4; neoC5. Ethane is difficult to biodegrade (Chung et al., 1988; Head et al., 2003; Meng et al., 2017). Microbial degradation involves the consumption of propane and the production of methane. As a result, the amount of propane is reduced and the amount of methane, which has a more negative composition of hydrogen and carbon isotopes (δD and δ13C), increases. The iC4/nC4 ratio is a dependable indicator of gas biodegradation, and certain threshold values offer a qualitative evaluation of the degree of biodegradation. Non-biodegraded gas is indicated to have iC4/nC4 ratio of less than 0.8, whereas biodegraded gas has iC4/nC4 ratio more than 1.75 (Horstad and Larter, 1997). The hydrocarbons generated would have positive trends (δ13C1 < δ13C2 < δ13C3) in their carbon isotopic values and the carbon number (n) and a linear connection with 1/n. As the molecular weight increases, there is a progressive increase in δ13C values. This lends shows that isotope fractionation occurs during thermal maturation. The linear relationship with 1/n provides more evidence of a regular shift in isotopic composition as carbon number increases. The preferential fractionation of isotopes during thermal degradation could be the cause of this relationship. Although the linear relationship with 1/n and the indicated isotopic trend of δ13C1 < δ13C2 < δ13C3 are theoretical expectations under specific circumstances, it is critical to recognize that natural gas origins are diverse, and that actual data frequently deviate from such idealized patterns. Natural gas isotopic compositions can be influenced by complex geological and geochemical processes. In many situations, the linear relationship might not be obvious (Chung et al., 1988).
According to Milkov et al. (2020), inverted carbon isotope ratios (δ13C2 < δ13C1) result from isotope fractionation via desorption brought on by uplift and depressurization in gases drawn from conventional and unconventional reservoirs. Ethane and propane isotope “rollover” (reversals or positive shift) can occur in high maturity shale gas wells (Hao and Zou, 2013). These wells appear to be among the most productive shale wells because in situ cracking produces smaller molecules, which increases fluid pressure and brittleness of the organic matter due to increased kerogen porosity and permeability (Jew et al., 2022). Such behavior is observed in well-known shales such as Fayetteville, Woodford, Haynesville, Utica, Marcellus in the US, portions of the US Rockies, and in the Vaca Muerta and Los Molles in South America. Wells without such anomalies or reversals are usually not good producers (Györe et al., 2021).
Thermal maturity is a key factor influencing the isotopic composition of natural gases. Reservoirs affected by significant uplift and depressurization tend to exhibit higher thermal maturity levels (>2% Ro), indicating overmature conditions. In such cases, isotopic reversals (δ13C1 > δ13C2) may occur due to advanced cracking of hydrocarbons or secondary migration pathways (Evans, 2019; Wang et al., 2021). Conversely, reservoirs subjected to less uplift and depressurization exhibit lower maturity levels (<2% Ro) and display normal isotope trends (δ13C1 < δ13C2), supporting the thermogenic origin of the gases. This trend is consistent with gases generated through primary kerogen cracking and secondary oil cracking in rift basins (Tang et al., 2005; Dai et al., 2016). The absence of isotopic reversals (δ13C1 > δ13C2), which are typically observed in high-maturity shale gas systems (Li et al., 2022), further reinforces the thermogenic nature of the analyzed gases.
In addition to physical phenomena like desorption and diffusion, thermal maturity significantly impacts carbon isotope series in natural gases. The higher molecular mobility of isotopologues containing lighter carbon isotopes (12C) facilitates carbon isotope fractionation during gas migration or secondary alteration processes (Zhang and Krooss, 2001). This fractionation alters the δ13C values of methane (δ13C1), ethane (δ13C2), and propane (δ13C3), potentially masking original isotopic signatures. Such effects are particularly pronounced in overmature reservoirs where secondary processes dominate, leading to isotopic shifts or reversals (Tilley and Muehlenbachs, 2013; Xia and Gao, 2018).
The studied headspace gas samples show a normal carbon isotopic trend between δ13C1 and δ13C2 that follows the trend δ13C1 < δ13C2 < δ13C3 < δ13C4. This indicates that the carbon-13 isotopic composition in methane is lower than that of ethane, and ethane has lower 13C than propane. The negative values of δ13CC1-C2 and δ13CC1-C3 indicate that isotopic fractionation is occurring between methane (C1) and ethane (C2), as well as between methane (C1) and propane (C3). This suggests that during the formation or transformation processes, the carbon isotopes are being preferentially partitioned in a way that results in lighter isotopes being more enriched in methane compared to ethane and propane. The samples exhibiting normal isotopic trends are further categorized into pre oil window, low mature, oil/wet-gas, and wet-gas to dry gas windows according to their level of maturity (Figure 7).
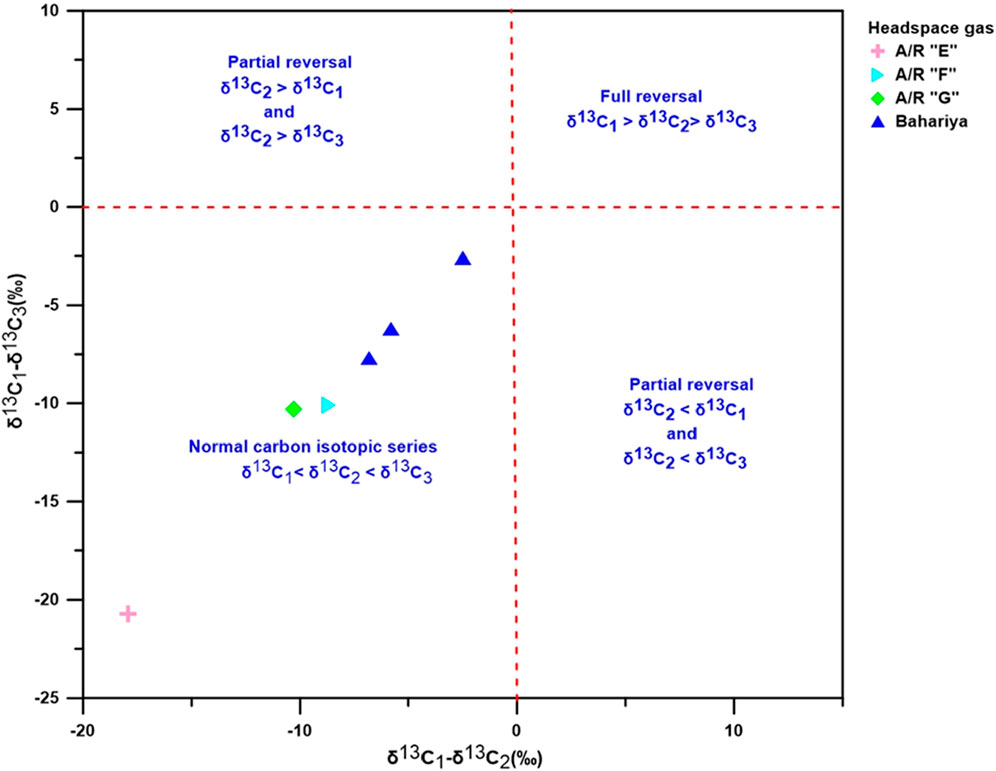
Figure 7. Natural gases carbon isotopic composition series distribution mode (after Feng et al., 2017).
Berner and Faber (1988), James (1990), and Dai et al. (2004) draw attention to the difficulties in interpreting carbon isotopic series in natural gases. The observed isotopic trends can be attributed to a variety of reasons. The fact that these effects are acknowledged emphasizes how crucial it is to understand carbon isotopic series in natural gases.
To properly understand the isotopic data, geochemists must consider source rock properties, maturation history, and geological environment. Although isotopic series analysis can offer useful insights into the origin, migration, and modification of natural gases, a thorough comprehension necessitates considering the different contributing variables. According to Chung et al. (1988), the origin of all natural gases in the A/R “E, F and G” members is oil-derived gas (except for one sample in A/R “E” that is coal-derived). The Bahariya Formation natural gas origin is coal-derived (Figure 8).
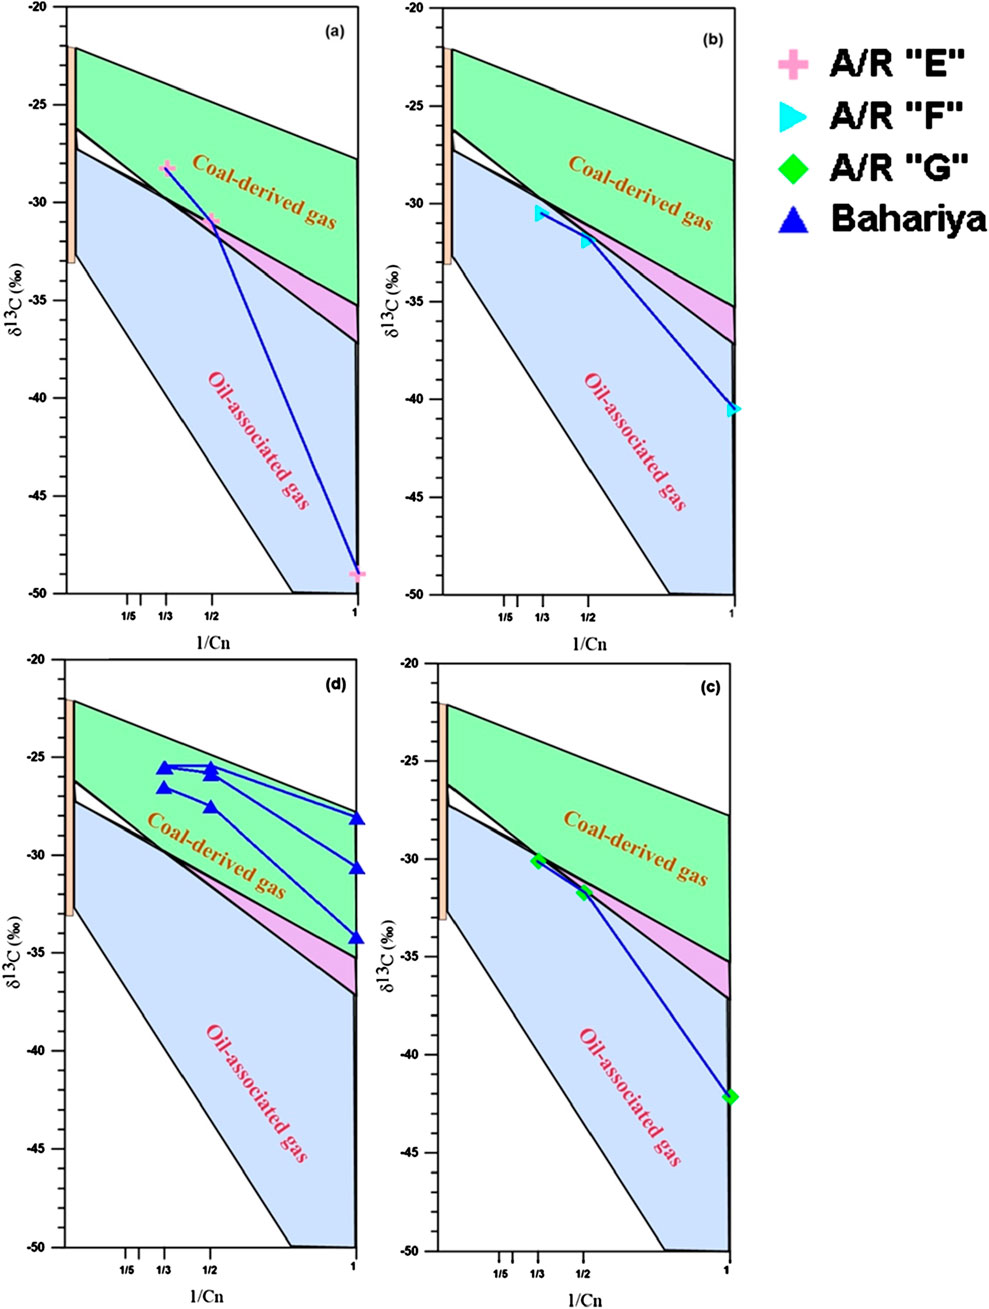
Figure 8. Plot of δ13C vs. 1/Cn for A/R “E, F and G” members (a–c), respectively, and for Bahariya Formation (d) (after Chung et al., 1988).
5.3 Carbon isotopic composition as a thermal maturity indicator
Plots from Cesar et al. (2020) are used to evaluate the thermal maturity of headspace gas samples and offer important insights into the potential for hydrocarbon generation. The plots show the difference in δ13C values between CH4 and C2H6 (Δ13CC1-C2 = δ13CC1- δ13CC2), and between CH4 and C3H8 (Δ13CC1-C3 = δ13CC1- δ13CC3).
The differences in the carbon isotopic composition of propane (C3), ethane (C2), and methane (C1) are represented by δ13CC1-C2 and δ13CC1-C3, respectively. The isotopic composition of the hydrocarbons contained in the natural gas samples are evaluated using the values of δ13CC1-C2 and δ13CC1-C3. Samples of natural gas with δ13CC1-C2 values between −15 and −6‰ correspond to a range linked to the onset of wet gas generation. This range indicates a transitional phase from the oil window toward the wet gas zone, which is often characterized by a significant amount of heavier hydrocarbons (e.g., ethane, propane). The isotopic range associated with the onset of wet gas generation is also indicated by natural gas samples with δ13CC1-C3 values between −20 and −12‰ (Cesar et al., 2020). According to Cesar et al. (2020), the δ13C1, δ13C2, and δ13C3 values of natural gases tend to increase with depth, reflecting the progressive thermal maturation of organic matter as burial depth increases. Figure 9a illustrates this trend in the Azhar-E1X well, where the δ13C values for methane (δ13C1), ethane (δ13C2), and propane (δ13C3) all show an increase with depth across the 5,600–8,100 ft interval. However, the rate of increase for δ13C1 (methane) is notably steeper compared to δ13C2 (ethane) and δ13C3 (propane). This steeper gradient in δ13C1 is consistent with the higher sensitivity of methane to thermal maturation processes, as lighter hydrocarbons like methane are more susceptible to isotopic fractionation during gas generation and migration. The observed trends in δ13C values with depth provide valuable insights into the thermal maturity and hydrocarbon generation history of the studied formations, with the Bahariya Formation exhibiting higher maturity compared to the shallower Abu Roash (A/R) members.
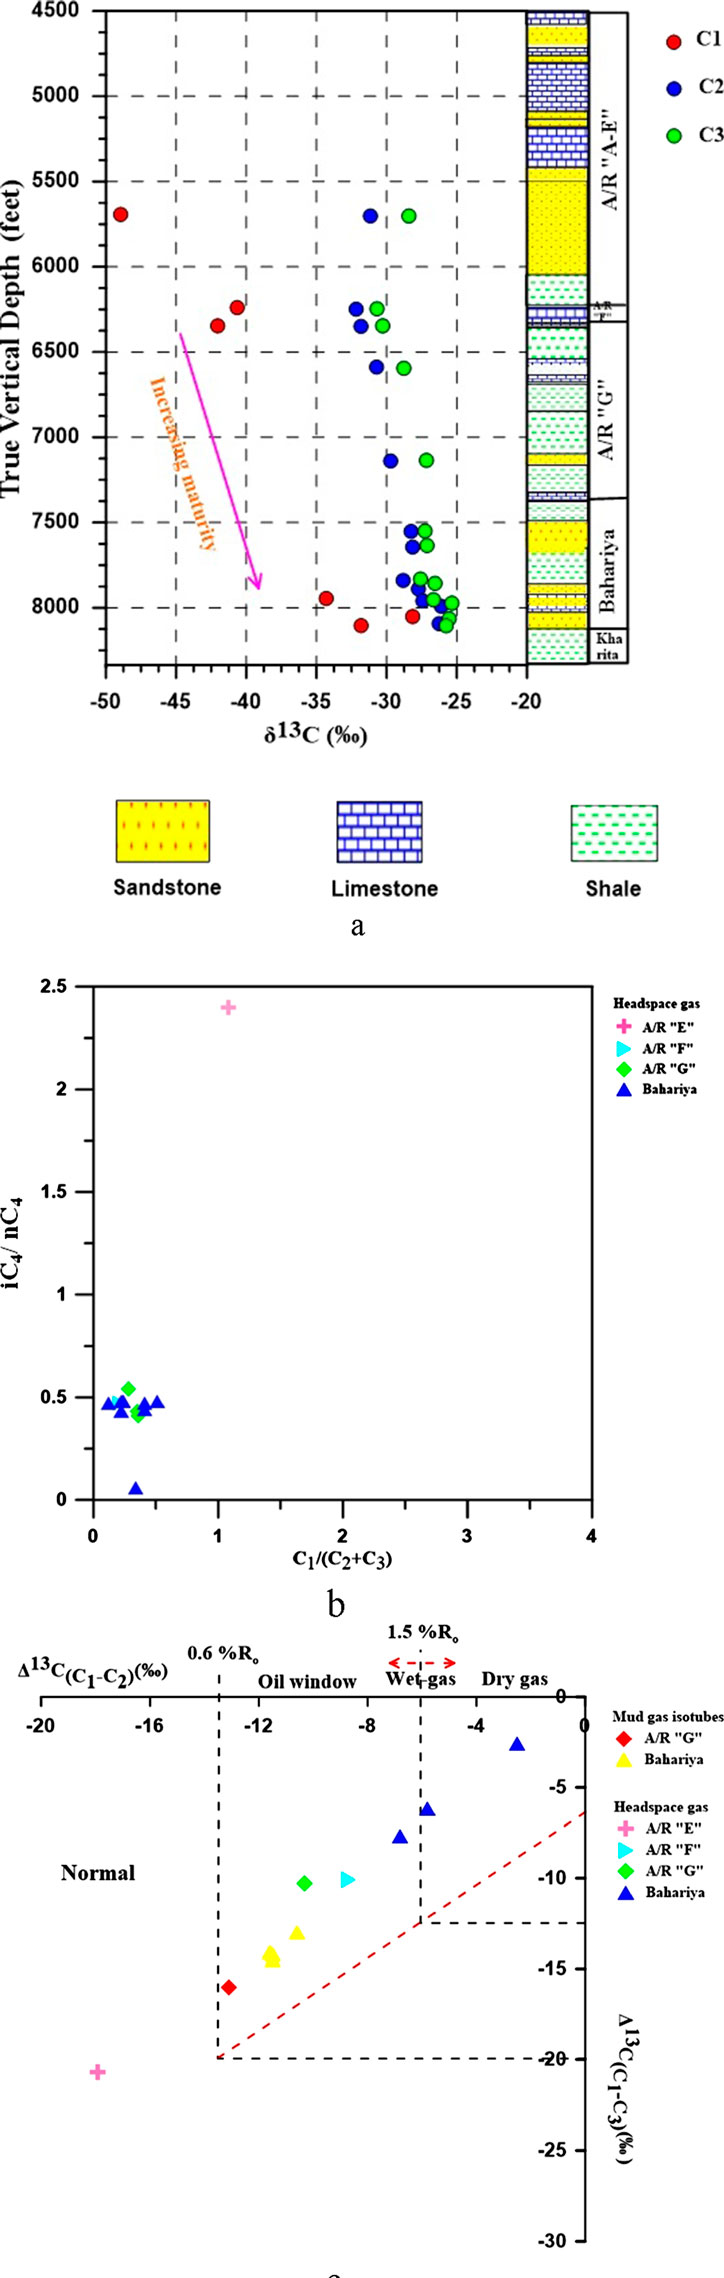
Figure 9. (a) Headspace Gas Carbon Isotope Composition Logs for well Azhar-E1X. (b) C1/C2+C3 ratio vs. iC4/nC4 ratio for gases Azhar-E1X (modified after Cesar et al., 2022). (c) Thermal maturity plot of headspace gas stable carbon isotopic samples from Azhar-E 1X well through the relationship between Δ13CC1-C2 and Δ13CC1-C3 (modified after Cesar et al., 2020).
The iC4/nC4 ratio is a well-established indicator of thermal maturity in natural gases (Zumberge et al., 2012; Chatellier et al., 2013). Typically, an increase in the C1/(C2 + C3) ratio corresponds to an increase in the iC4/nC4 ratio, reflecting higher production of iC4 (isobutane) from the cracking of kerogen or oil (Hao and Zou, 2013). In this study, the iC4/nC4 ratio decreased with increasing depth and maturity, declining from approximately 2.5 to 0.5 (Figure 9b). As C1/(C2 + C3) increased, the iC4/nC4 ratio actually increased, which is consistent with the findings of Hao and Zou (2013) and Cesar et al. (2020). This pattern results from thermal decomposition processes, whereby larger hydrocarbon molecules crack into smaller ones. Branched hydrocarbons (iC4) are more thermally stable than straight-chain hydrocarbons (nC4) due to their compact structure, which reduces carbon skeleton strain and enhances resistance to breakdown (Tissot and Welte, 1984). As thermal maturation progresses, selective cracking and migration cause a relative reduction in iC4 concentrations, lowering the iC4/nC4 ratio. This process is also influenced by factors like volatility, molecular rearrangement, and hydrocarbon migration (Peters et al., 2005; Kang et al., 2021).
Furthermore, the thermal maturity was studied based on the δ13CC1-C2 V s δ13CC1-C3 plot. The values of δ13CC1-C2 (>−18‰) and δ13CC1-C3 (>−21‰) became less negative and showed a linear increase from the A/R “E” Member to the Bahariya Formation (Figure 9c). More specifically, the values of δ13CC1-C2 ranged from −17.9‰ to −2.5‰ and the values of δ 13CC1-C3 ranged from −20.7‰ to −2.6‰. These values indicate that the headspace gas samples from the A/R “E” Member are in the low mature stage, where Ro is less than 0.6% (Figure 9c). On the other hand, the gases from the A/R “F” and A/R “G members plot within the oil window region and the Bahariya Formation gases plot in the region spanning the upper oil-window/wet gas transition to dry gas, where the Ro is >1.50% (Rokosh et al., 2012). Also, the differences between the isotope values of methane in mud gas samples and headspace gas samples were used as permeability and fracturing indicators. According to Ferworn et al. (2008), the Bahariya and A/R “G” reservoir δ13CC1 of headspace gas samples is more positive than the δ13CC1 of mud gas samples indicating low permeability (Table 1 and 2).
For the mud gas samples, the values of δ13CC1-C2 vary from −13.1‰ to −10.6‰ and the values of δ13CC1-C3 vary from −16‰ to −13.4‰ (Table 1). For the headspace gas samples, the values of Δ δ13CC1-C2 vary from −17.9‰ to −2.5‰ and the values of δ13CC1-C3 vary from −20.7‰ to −2.6‰ (Table 1). Headspace gas samples show an obvious offset over the trend line because of the significant variance in the values of δ13CCH4 and to a lesser extent in those of δ13CC2H6 and δ13CC3H8. This offset occurred due to carbon isotope fractionation (Cesar et al., 2022) (Figure 9c). The headspace gas samples of the Bahariya Formation are more mature than those of the A/R “E, F and G” members because of the greater depth of burial and higher maturity attained by the Bahariya Formation.
While the C2/C3 ratio remains constant during bitumen or kerogen cracking, it increases during secondary cracking of the hydrocarbons (Cesar et al., 2022). According to the present study, the C2/C3 ratio increased with thermal maturity (Figure 10). Cesar et al. (2020) observed that at Ro = 1.5%, the C2/C3 ratio started to increase as thermal cracking of the wet-gas constituents became more pronounced and that a difference of 6‰ was reached between the δ13CC1, δ13CC2, and δ13CC3 values (the so-called even isotopic distribution or EID).
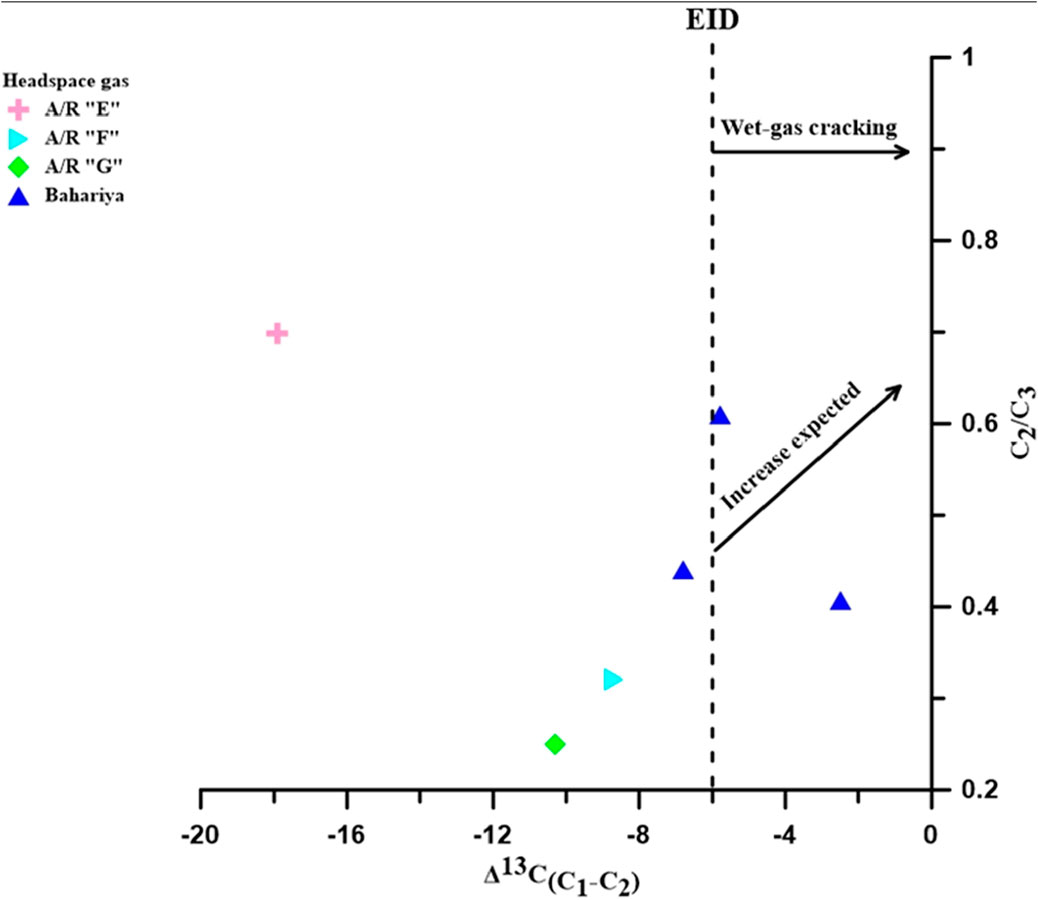
Figure 10. The C2/C3 ratio vs. (δ13CC1- δ13CC2) of headspace gas samples from Azhar- E1X well (modified after Cesar et al., 2022).
In the headspace gas samples of this study, the EID (δ13C1 - δ13C2 < −6‰) was reached by samples from the Bahariya Formation at a depth of 8,060 ft. This indicates that samples below this depth are in the wet-gas stage of maturity and lie to the left of the EID (Tilley and Muehlenbachs, 2013; Cesar et al., 2022) (Figure 10). In contrast, the headspace gas samples from the A/R “E, F, and G” members, which are in the oil window stage, have not reached the EID. When analyzing headspace gas samples, particular emphasis is placed on the distribution of carbon isotopes. The analysis shows that there is a fractionation of carbon isotopes that mainly affects C1 (methane) and C2 (ethane) to a lesser amount. It is known that isotopic fractionation process affects the isotopic ratios of carbon and hydrogen within hydrocarbons, such as propane (C3) and ethane (C2).
The δ13CC2- δ13CC3 vs. C2/C3 plot is used to study gas generation from crude oil cracking at various stages of maturation. The total amount of gas generated from kerogen-cracking increases as thermal maturity progresses, as does the ratio of C2/C3 in gas derived from oil-cracking. To identify the gas that originates from oil cracking, Liu et al. (2018) suggested using the plot of δ13CC2- δ13CC3 vs. C2/C3 that was initially introduced by Prinzhofer and Battani (2003).
The isotopic fractionation that occurs in headspace gases is due to desorption and diffusion effects. The anomalies in the carbon isotope ratios in headspace gas samples, which depend on nanopore throat size and overpressure, are due to diffusion effects (Wu et al., 2020). Hydrocarbon reservoirs that have low permeability do not show the effects of carbon isotopic fractionation caused by diffusion and desorption (Cesar et al., 2022). Most gases in the Bahariya Formation plot near the Type III kerogen trend (Figure 11). So, it can be expected that gas generation in the Bahariya Formation came from source rocks rich in vitrinite (Saxby and Shibaoka, 1986; Ogbesejana et al., 2021). The source rock is potentially the Lower Kharita Formation, which is a gas-prone, late-mature source rock. The gases generated from the A/R “E, F, and G” members plot close to the kerogen Type II trend, so these gases came from source rocks that were comparatively more liptinite-rich (Goodarzi et al., 1994). These source rocks is potentially A/R “E, F, and G” members, which are oil/mixed prone source rocks (low mature to marginally mature source rocks). The Bahariya Formation gases are more mature than gases from the A/R “E, F, and G” members (Figure 11).
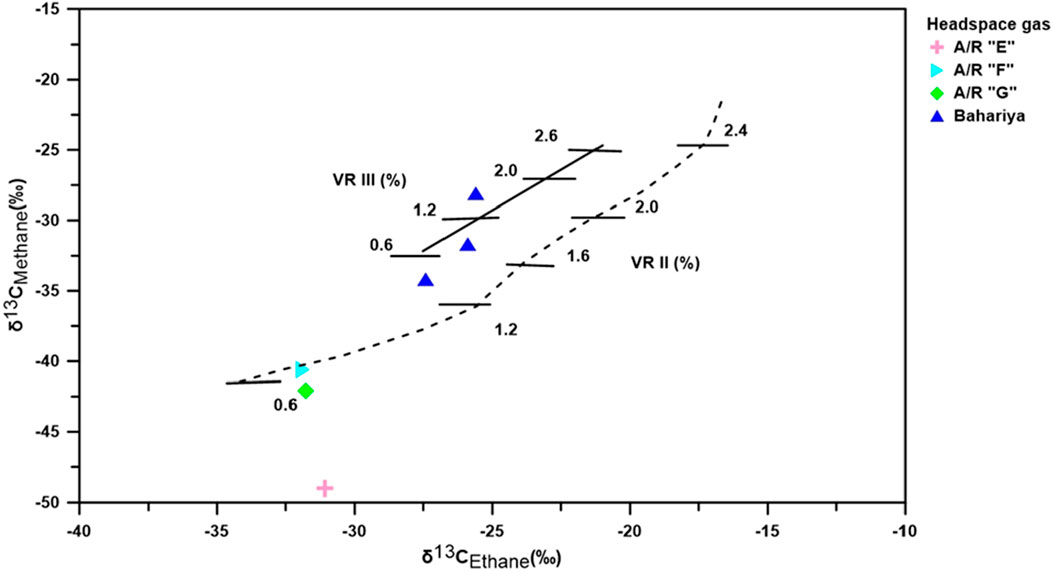
Figure 11. Plot of δ13C1 versus δ13C2 for type II and type III source rock gases of Azhar-E1X (modified after Berner et al., 1995).
6 Conclusion
The following conclusions can be made based on the carbon stable isotopic composition of headspace natural gases from the Upper Cretaceous successions in the Azhar field, BSB.
- The hydrocarbon gases from the A/R “E, F and G” members likely originated from mostly liptinitic (Type II kerogen) source rocks, whereas the Bahariya Formation gases originated from source rocks that were comparatively more enriched in vitrinite (Type III kerogen).
- The gaeous hydrocarbons in the A/R “E, F and G” members are oil-derived, whereas those in the Bahariya Formation range from mixed to coal-derived. Most gases were generated thermogenically by primary kerogen cracking in the A/R “E, F and G” members in the Bahariya Formation; the gases were generated by two processes, namely, secondary cracking of oil and primary cracking of kerogen.
- The plot of δ13CC1-C2 V s δ13CC1-C3 indicates that gases from the A/R “E” Member are low mature to oil window stage) and those from the A/R “F and G” members are mature (in the oil window) The Bahariya Formation gases are mature to overmature (upper oil window to wet gas).
- The C2/C3 ratio increased as thermal maturity increased. The gas samples from the A/R “E, F and G” members did not reach the EID threshold, whereas the gas samples of the Bahariya Formation reached the EID threshold because the Bahariya gases are more mature than those from the A/R members.
- All studied gas samples showed normal carbon isotopic trend (δ13C1 < δ13C2 < δ13C3 < δ13C4) with weak biodegradation, which is reflected in the low iC4/nC4 ratio.
Data availability statement
The original contributions presented in the study are included in the article/supplementary material, further inquiries can be directed to the corresponding authors.
Author contributions
SF: Conceptualization, Data curation, Formal Analysis, Investigation, Methodology, Project administration, Resources, Software, Supervision, Validation, Visualization, Writing – original draft, Writing – review and editing. SA: Conceptualization, Data curation, Formal Analysis, Investigation, Methodology, Resources, Software, Validation, Visualization, Writing – original draft, Writing – review and editing. MA: Conceptualization, Data curation, Formal Analysis, Investigation, Methodology, Resources, Software, Validation, Visualization, Writing – original draft, Writing – review and editing. KA-K: Conceptualization, Data curation, Formal Analysis, Investigation, Methodology, Software, Validation, Visualization, Writing – original draft, Writing – review and editing. TG: Conceptualization, Data curation, Formal Analysis, Investigation, Methodology, Resources, Software, Supervision, Validation, Visualization, Writing – original draft, Writing – review and editing. AZ: Conceptualization, Data curation, Formal Analysis, Funding acquisition, Investigation, Methodology, Resources, Software, Validation, Visualization, Writing – original draft, Writing – review and editing. LJ: Conceptualization, Data curation, Formal Analysis, Funding acquisition, Investigation, Methodology, Resources, Software, Validation, Visualization, Writing – original draft, Writing – review and editing.
Funding
The author(s) declare that financial support was received for the research and/or publication of this article. Luigi Jovane and the CORE lab are supported by the Fundação de Amparo à Pesquisa do Estado de São Paulo (FAPESP) project 2016/24946-9. Amr S. Zaky is also supported by FAPESP grant number 2022/08285-3. Khaled Al-Kahtany thanks the Research Support Project Number (RSP2025R139), King Saud University, Riyadh, Saudi Arabia.
Acknowledgments
The authors would like to extend their sincere gratitude to the two reviewers and the handling editor of Frontiers in Earth Science for their valuable feedback and insightful comments, which significantly enhanced the quality of this paper. Khaled Al-Kahtany thanks the Research Support Project Number (RSP2025R139), King Saud University, Riyadh, Saudi Arabia.
Conflict of interest
The authors declare that the research was conducted in the absence of any commercial or financial relationships that could be construed as a potential conflict of interest.
The author(s) declared that they were an editorial board member of Frontiers, at the time of submission. This had no impact on the peer review process and the final decision.
Generative AI statement
The author(s) declare that no Generative AI was used in the creation of this manuscript.
Publisher’s note
All claims expressed in this article are solely those of the authors and do not necessarily represent those of their affiliated organizations, or those of the publisher, the editors and the reviewers. Any product that may be evaluated in this article, or claim that may be made by its manufacturer, is not guaranteed or endorsed by the publisher.
References
Abdel-Fattah, M. I. (2015). Impact of depositional environment on petrophysical reservoir characteristics in Obaiyed Field, Western Desert, Egypt. Arabian J. Geosciences 8, 9301–9314. doi:10.1007/s12517-015-1913-5
Ali, W. A., Deaf, A. S., and Mostafa, T. (2024). 3D geological and petrophysical modeling of Alam El-Bueib Formation using well logs and seismic data in Matruh Field, northwestern Egypt. Sci. Rep. 14 (1), 6849. doi:10.1038/s41598-024-56825-5
Bernard, B. B., Brooks, J. M., and Sackett, W. M. (1978). Light hydrocarbons in recent Texas continental shelf and slope sediments. J. Geophys. Res. Oceans 83 (C8), 4053–4061. doi:10.1029/jc083ic08p04053
Berner, U., and Faber, E. (1988). Maturity related mixing model for methane, ethane and propane, based on carbon isotopes. Org. Geochem. 13 (1-3), 67–72. doi:10.1016/0146-6380(88)90026-5
Berner, U., Faber, E., Scheeder, G., and Panten, D. (1995). Primary cracking of algal and landplant kerogens: kinetic models of isotope variations in methane, ethane and propane. Chem. Geol. 126 (3-4), 233–245. doi:10.1016/0009-2541(95)00120-4
Bosworth, W., and Stockli, D. F. (2016). Early magmatism in the greater Red Sea rift: timing and significance. Can. J. Earth Sci. 53 (11), 1158–1176. doi:10.1139/cjes-2016-0019
Cesar, J., Mayer, B., Becker, V., Nightingale, M., and Ardakani, O. H. (2022). Molecular and stable carbon isotope geochemistry of mud-gas-derived hydrocarbons and its application for the assessment of low-permeability reservoirs from the Montney Formation: western Canada. Org. Geochem. 163, 104328. doi:10.1016/j.orggeochem.2021.104328
Cesar, J., Mayer, B., and Humez, P. (2021). A novel isotopic approach to distinguish primary microbial and thermogenic gases in shallow subsurface environments. Appl. Geochem. 131, 105048. doi:10.1016/j.apgeochem.2021.105048
Cesar, J., Nightingale, M., Becker, V., and Mayer, B. (2020). Stable carbon isotope systematics of methane, ethane and propane from low-permeability hydrocarbon reservoirs. Chem. Geol. 558, 119907. doi:10.1016/j.chemgeo.2020.119907
Chatellier, J. Y., Flek, P., Molgat, M., Anderson, I., Ferworn, K., Larsen, N. L., et al. (2013). Overpressure in shale gas: when geochemistry and reservoir engineering data meet and agree. The American Association of Petroleum Geologists, 45–69.
Chatellier, J. Y., Simpson, K., Perez, R., and Tribovillard, N. (2018). Geochemically focused integrated approach to reveal reservoir characteristics linked to better Montney productivity potential. Bull. Can. Petroleum Geol. 66 (2), 516–551.
Chung, H. M., Gormly, J. R., and Squires, R. M. (1988). Origin of gaseous hydrocarbons in subsurface environments: theoretical considerations of carbon isotope distribution. Chem. Geol. 71 (1-3), 97–104. doi:10.1016/0009-2541(88)90108-8
Curtis, M. E. (2010). “Structural characterization of gas shales on the micro-and nano-scales,” in SPE Canada unconventional Resources conference. SPE-137693.
Dai, J., Xia, X., Qin, S., and Zhao, J. (2004). Origins of partially reversed alkane δ13C values for biogenic gases in China. Org. Geochem. 35 (4), 405–411. doi:10.1016/j.orggeochem.2004.01.006
Dai, J., Zou, C., Dong, D., Ni, Y., Wu, W., Gong, D., et al. (2016). Geochemical characteristics of marine and terrestrial shale gas in China. Mar. Petroleum Geol. 76, 444–463. doi:10.1016/j.marpetgeo.2016.04.027
Dai, J. X., Qi, H. F., and Song, Y. (1985). Primary discussion of some parameters for identification of coal-and oil-type gases. Acta Pet. Sin. 6 (2), 31–38.
Dominato, K. R., Rostron, B. J., Hendry, M. J., Schmeling, E. E., Sandau, C. D., and Mundle, S. O. (2018). Developing deep high-resolution concentration and 13C isotope profiles for methane, ethane, and propane. J. Petroleum Sci. Eng. 170, 280–290. doi:10.1016/j.petrol.2018.06.064
Edress, N. A., Darwish, S., and Ismail, A. (2021). Geochemical characterization of the source rock intervals, Beni-Suef Basin, west Nile Valley, Egypt. Open Geosci. 13 (1), 1536–1551. doi:10.1515/geo-2020-0306
Evans, C. (2019). Molecular composition and isotope mapping of natural gas in the British Columbia Natural Gas Atlas (Doctoral dissertation).
Faber, E., and Stahl, W. (1984). Geochemical surface exploration for hydrocarbons in North Sea. AAPG Bull. 68 (3), 363–386. doi:10.1306/ad460a26-16f7-11d7-8645000102c1865d
Farouk, S., Arafat, M., Fagelnour, M. S., Al-Kahtany, K., and Gentzis, T. (2024b). Petroleum system assessment of the Beni Suef Basin, Western Desert, Egypt. J. Afr. Earth Sci. 217, 105345. doi:10.1016/j.jafrearsci.2024.105345
Farouk, S., Saada, S. A., Fagelnour, M., Tawfik, A. Y., Arafat, M., and El-Kahtany, K. (2024a). Geochemical evaluation and basin modelling of the cretaceous succession in the azhar oil field, west Beni Suef Basin, Egypt. Geol. J. 59 (7), 1949–1967. doi:10.1002/gj.4979
Farouk, S., Saada, S. A., Fagelnour, M. S., and Arafat, M. (2024c). Petrophysical and gas chromatographic analysis integration for hydrocarbon identifications in cretaceous reservoirs, azhar field, Beni Suef Basin, Egypt. Egypt. J. Petroleum 33 (1), 7. doi:10.62593/2090-2468.1018
Feng, Z., Huang, S., Wu, W., Xie, C., Peng, W., and Cai, Y. (2017). Longmaxi shale gas geochemistry in Changning and Fuling gas fields, the Sichuan Basin. Energy Explor. and Exploitation 35 (2), 259–278. doi:10.1177/0144598716687931
Ferworn, K., Zumberge, J., Reed, J., and Brown, S. (2008). Gas character anomalies found in highly productive shale gas wells. Tech. Present. GeoMark Res.
Gao, G., Zhang, W. W., Ma, G. F., Chen, G., Li, T., Hu, L. Z., et al. (2018). Mineral composition and organic geochemistry of the lower cretaceous Xiagou formation source rock from the Qingxi Sag, Jiuquan Basin, Northwest China. Petroleum Sci. 15, 51–67. doi:10.1007/s12182-017-0213-y
Goodarzi, F., Snowdon, L., Gentzis, T., and Pearson, D. (1994). Petrological and chemical characteristics of liptinite-rich coals from Alberta, Canada. Mar. petroleum Geol. 11 (3), 307–319. doi:10.1016/0264-8172(94)90052-3
Györe, D., Pujol, M., Gilfillan, S. M., and Stuart, F. M. (2021). Noble gases constrain the origin, age and fate of CO2 in the Vaca Muerta shale in the neuquén basin (Argentina). Chem. Geol. 577, 120294. doi:10.1016/j.chemgeo.2021.120294
Hantar, G. (1990). “North Western desert,” in The geology of Egypt. Editor R. Said (Rotterdam: Balkema), 407–438.
Hao, F., Guo, T., Zhu, Y., Cai, X., Zou, H., and Li, P. (2008). Evidence for multiple stages of oil cracking and thermochemical sulfate reduction in the Puguang gas field, Sichuan Basin, China. AAPG Bull. 92 (5), 611–637. doi:10.1306/01210807090
Hao, F., and Zou, H. (2013). Cause of shale gas geochemical anomalies and mechanisms for gas enrichment and depletion in high-maturity shales. Mar. Petroleum Geol. 44, 1–12. doi:10.1016/j.marpetgeo.2013.03.005
Head, I. M., Jones, D. M., and Larter, S. R. (2003). Biological activity in the deep subsurface and the origin of heavy oil. Nature 426 (6964), 344–352. doi:10.1038/nature02134
Horstad, I., and Larter, S. R. (1997). Petroleum migration, alteration, and remigration within Troll field, Norwegian North Sea. AAPG Bull. 81 (2), 222–248.
Huang, H., and Larter, S. (2014). Secondary microbial gas formation associated with biodegraded oils from the Liaohe Basin, NE China. Org. Geochem. 68, 39–50. doi:10.1016/j.orggeochem.2014.01.005
James, A. T. (1990). Correlation of reservoired gases using the carbon isotopic compositions of wet gas components. AAPG Bull. 74 (9), 1341–1458. doi:10.1306/0c9b24f7-1710-11d7-8645000102c1865d
Jew, A. D., Druhan, J. L., Ihme, M., Kovscek, A. R., Battiato, I., Kaszuba, J. P., et al. (2022). Chemical and reactive transport processes associated with hydraulic fracturing of unconventional oil/gas shales. Chem. Rev. 122 (9), 9198–9263. doi:10.1021/acs.chemrev.1c00504
Kang, X., Hu, W., Tan, J., Li, Z., Xiang, B., Wang, J., et al. (2021). Hydrogen isotopic responses to thermochemical oxidation of light hydrocarbon gases in deep clastic reservoirs of the Junggar Basin, China. Chem. Geol. 563, 120052. doi:10.1016/j.chemgeo.2020.120052
Kolb, B., and Ettre, L. S. (2006). Static headspace-gas chromatography: theory and practice. John Wiley and Sons.
Li, Y., Xu, X., Pang, L., Guan, P., Fang, Y., Lu, H., et al. (2022). Elemental and isotopic signatures of bulk sedimentary organic matter in Shenhu Area, Northern South China Sea. Front. Earth Sci. 10. doi:10.3389/feart.2022.836381
Liu, Q., Jin, Z., Li, H., Wu, X., Tao, X., Zhu, D., et al. (2018). Geochemistry characteristics and genetic types of natural gas in central part of the Tarim Basin, NW China. Mar. Petroleum Geol. 89, 91–105. doi:10.1016/j.marpetgeo.2017.05.002
Mansour, A., Gentzis, T., El Nady, M. M., Mostafa, F., and Tahoun, S. S. (2020). Hydrocarbon potential of the albian-early cenomanian formations (Kharita-Bahariya) in the north Western desert, Egypt: a review. J. Petroleum Sci. Eng. 193, 107440. doi:10.1016/j.petrol.2020.107440
Mansour, A., Gentzis, T., Tahoun, S. S., Ahmed, M. S., Gier, S., Carvajal-Ortiz, H., et al. (2023). Near equatorial paleoclimatic evolution and control on organic matter accumulation during the Cenomanian in the Abu Gharadig Basin, southern Tethys: insights from palynology, organic petrography, and geochemistry. Int. J. Coal Geol. 270, 104221–221. doi:10.1016/j.coal.2023.104221
Mansour, A., Wang, J., Fu, X., Tahoun, S. S., and Ruebsam, W. (2024). Regional to global correlation of Cenomanian-early Turonian sea-level evolution and related dynamics: new perspectives. Earth-Science Rev. 256, 104863–863. doi:10.1016/j.earscirev.2024.104863
Meng, Q., Wang, X., Wang, X., Shi, B., Luo, X., Zhang, L., et al. (2017). Gas geochemical evidences for biodegradation of shale gases in the upper triassic yanchang formation, ordos basin, China. Int. J. Coal Geol. 179, 139–152. doi:10.1016/j.coal.2017.05.018
Meshref, W. M. (1982). “Regional structural setting of northern Egypt,” in In proceeding of the 6th Egyptian general petroleum corporation exploration seminar, 17–34.
Milkov, A. V., Faiz, M., and Etiope, G. (2020). Geochemistry of shale gases from around the world: composition, origins, isotope reversals and rollovers, and implications for the exploration of shale plays. Org. Geochem. 143, 103997. doi:10.1016/j.orggeochem.2020.103997
Moustafa, A. R., Abd El-Aziz, M., and Gaber, W. (2008). “Tiba–Natrun–Kattaniya Basin, northern Western Desert (Egypt): impact of fault orientations on basin inversion,” in 3rd symposium on the sedimentary basins of Libya (the geology of East Libya), 1, 295–310.
Nabawy, B. S., Lashin, A. A., and Barakat, M. K. (2022). Implementation of lithofacies and microfacies types on reservoir quality and heterogeneity of the late cretaceous upper Bahariya member in the shurouk field, shoushan basin, north Western desert, Egypt. J. Asian Earth Sci. 224, 105014. doi:10.1016/j.jseaes.2021.105014
Norton, P. (1967). Rock stratigraphic nomenclature of the Western Desert, Egypt. Cairo: Egyptian Petroleum Corporation.
Ogbesejana, A. B., Liu, B., and Ostadhassan, M. (2021). Stable isotope geochemistry of the organic elements within shales and crude oils: a comprehensive review. Molecules 27 (1), 34. doi:10.3390/molecules27010034
Peters, K. E., Walters, C. C., and Moldowan, J. M. (2005). The biomarker guide, 1. Cambridge University Press.
Philp, R. P., and Monaco, G. L. (2012). “Applications of stable isotopes in hydrocarbon exploration and environmental forensics,”, 1, 639–677. doi:10.1007/978-3-642-10637-8_31
Prinzhofer, A., and Battani, A. (2003). Gas isotopes tracing: an important tool for hydrocarbons exploration. Oil and Gas Sci. Technol. 58 (2), 299–311. doi:10.2516/ogst:2003018
Prinzhofer, A. A., and Huc, A. Y. (1995). Genetic and post-genetic molecular and isotopic fractionations in natural gases. Chem. Geol. 126 (3-4), 281–290. doi:10.1016/0009-2541(95)00123-9
Rokosh, C. D., Lyster, S., Anderson, S. D. A., Beaton, A. P., Berhane, H., Brazzoni, T., et al. (2012). Summary of Alberta’s shale-and siltstone-hosted hydrocarbon resource potential, 6. Energy Resources Conservation Board, 327. ERCB/AGS Open File Report.
Salem, E., and Sehim, A. (2017). Structural imaging of the East Beni sueif basin, north eastern desert, Egypt. J. Afr. Earth Sci. 136, 109–118. doi:10.1016/j.jafrearsci.2017.05.009
Saxby, J. D., and Shibaoka, M. (1986). Coal and coal macerals as source rocks for oil and gas. Appl. Geochem. 1 (1), 25–36. doi:10.1016/0883-2927(86)90035-1
Schlumberger Middle East (1995). Well evaluation conference, Egypt, geology of Egypt, SA. Schlumberger Middle East. EGPC.
Schoell, M. (1980). The hydrogen and carbon isotopic composition of methane from natural gases of various origins. Geochimica Cosmochimica Acta 44 (5), 649–661. doi:10.1016/0016-7037(80)90155-6
Schoell, M. (1983). Genetic characterization of natural gases. AAPG Bull. 67 (12), 2225–2238. doi:10.1306/ad46094a-16f7-11d7-8645000102c1865d
Schoell, M. (1988). Multiple origins of methane in the Earth. Chem. Geol. 71 (1-3), 1–10. doi:10.1016/0009-2541(88)90101-5
Shehata, A. A., El Fawal, F. M., Ito, M., Aal, M. H. A., and Sarhan, M. A. (2019). Cenomanian–turonian depositional history of a post–gondwana rift succession in the West Beni Suef Basin, Egypt. J. Afr. Earth Sci. 150, 783–798. doi:10.1016/j.jafrearsci.2018.10.006
Shehata, A. A., El Fawal, F. M., Ito, M., Aboulmagd, M. A., and Brooks, H. L. (2020). Senonian platform-to-slope evolution in the tectonically-influenced Syrian Arc sedimentary belt: Beni Suef Basin, Egypt. J. Afr. Earth Sci. 170, 103934. doi:10.1016/j.jafrearsci.2020.103934
Smith, A. G. (1971). Alpine deformation and the oceanic areas of the tethys, mediterranean, and atlantic. Geol. Soc. Am. Bull. 82 (8), 2039–2070. doi:10.1130/0016-7606(1971)82[2039:adatoa]2.0.co;2
Tahoun, S. S., and Deaf, A. S. (2016). Could the conventionally known Abu Roash “G” reservoir (upper Cenomanian) be a promising active hydrocarbon source in the extreme northwestern part of Egypt? Palynofacies, palaeoenvironmental, and organic geochemical answers. Mar. Petroleum Geol. 76, 231–245. doi:10.1016/j.marpetgeo.2016.05.025
Tang, Y., Huang, Y., Ellis, G. S., Wang, Y., Kralert, P. G., Gillaizeau, B., et al. (2005). A kinetic model for thermally induced hydrogen and carbon isotope fractionation of individual n-alkanes in crude oil. Geochimica Cosmochimica Acta 69 (18), 4505–4520. doi:10.1016/j.gca.2004.12.026
Tawfik, A. Y., Ondrak, R., Winterleitner, G., and Mutti, M. (2022). Source rock evaluation and petroleum system modeling of the East Beni Suef Basin, north eastern desert, Egypt. J. Afr. Earth Sci. 193, 104575. doi:10.1016/j.jafrearsci.2022.104575
Tian, H. (2006). A study on the kinetic modeling of natural gas generation and gas accumulation in the platform area of Tarim Basin. Guangzhou Inst. Geochem. Chin. Acad. Sci., 35–43.
Tilley, B., and Muehlenbachs, K. (2013). Isotope reversals and universal stages and trends of gas maturation in sealed, self-contained petroleum systems. Chem. Geol. 339, 194–204. doi:10.1016/j.chemgeo.2012.08.002
Tissot, B. P., and Welte, D. H. (1984). Petroleum formation and occurrence. Springer Science and Business Media.
Tretner, A., Zimmer, M., Erzinger, J., Nakada, S., and Saito, M. (2008). Real-time drill mud gas logging at the USDP-4 drilling, Unzen volcano, Japan. J. Volcanol. Geotherm. Res. 175 (1-2), 28–34. doi:10.1016/j.jvolgeores.2008.03.031
Wang, Z., Xiao, S., Wang, F., Tang, G., Zhu, L., and Zhao, Z. (2021). Phase behavior identification and formation mechanisms of the BZ19-6 condensate gas reservoir in the deep bozhong sag, bohai bay basin, eastern China. Geofluids 2021 (1), 1–19. doi:10.1155/2021/6622795
Whiticar, M. J. (1994). Correlation of natural gases with their sources: chapter 16: Part IV. Identification and Characterization, 261–283.
Whiticar, M. J. (1999). Carbon and hydrogen isotope systematics of bacterial formation and oxidation of methane. Chem. Geol. 161 (1-3), 291–314. doi:10.1016/s0009-2541(99)00092-3
Whiticar, M. J., and Faber, E. (1986). Methane oxidation in sediment and water column environments—isotope evidence. Org. Geochem. 10 (4-6), 759–768. doi:10.1016/s0146-6380(86)80013-4
Wu, Y., Tong, J., Algeo, T. J., Chu, D., Cui, Y., Song, H., et al. (2020). Organic carbon isotopes in terrestrial Permian-Triassic boundary sections of North China: implications for global carbon cycle perturbations. GSA Bull. 132, 1106–1118. doi:10.1130/b35228.1
Xia, X., and Gao, Y. (2017). Mechanism of linear covariations between isotopic compositions of natural gaseous hydrocarbons. Org. Geochem. 113, 115–123. doi:10.1016/j.orggeochem.2017.07.003
Xia, X., and Gao, Y. (2018). Depletion of 13C in residual ethane and propane during thermal decomposition in sedimentary basins. Org. Geochem. 125, 121–128. doi:10.1016/j.orggeochem.2018.09.003
Zahran, H., Elyazid, K. A., and Mohamad, M. (2011). Beni Suef Basin the key for exploration future success in Upper Egypt, 10351. Search and Discovery Article, 10–13.
Zhang, T., and Krooss, B. M. (2001). Experimental investigation on the carbon isotope fractionation of methane during gas migration by diffusion through sedimentary rocks at elevated temperature and pressure. Geochimica Cosmochimica Acta 65 (16), 2723–2742. doi:10.1016/s0016-7037(01)00601-9
Zou, Y. R., Cai, Y., Zhang, C., Zhang, X., and Peng, P. (2007). Variations of natural gas carbon isotope-type curves and their interpretation–A case study. Org. Geochem. 38 (8), 1398–1415. doi:10.1016/j.orggeochem.2007.03.002
Keywords: Beni Suef basin, Abu Roash Formation, Bahariya Formation, stable carbon isotopes, thermogenic gas, hydrocarbon maturation, biodegradation, Azhar-E1X well
Citation: Farouk S, Ahmed Saada S, Arafat M, Al-Kahtany K, Gentzis T, Zaky AS and Jovane L (2025) Thermal maturity and gas generation in Upper Cretaceous formations of the Beni Suef Basin, Egypt: insights from stable carbon isotopes and geochemical analysis of the Azhar-E1X well. Front. Earth Sci. 13:1552662. doi: 10.3389/feart.2025.1552662
Received: 28 December 2024; Accepted: 04 April 2025;
Published: 17 April 2025.
Edited by:
Faisal Ur Rahman Awan, Edith Cowan University, AustraliaReviewed by:
Muhammad Jawad Munawar, University of the Punjab, PakistanAbbas F. Gharib, University of Kirkuk, Iraq
Copyright © 2025 Farouk, Ahmed Saada, Arafat, Al-Kahtany, Gentzis, Zaky and Jovane. This is an open-access article distributed under the terms of the Creative Commons Attribution License (CC BY). The use, distribution or reproduction in other forums is permitted, provided the original author(s) and the copyright owner(s) are credited and that the original publication in this journal is cited, in accordance with accepted academic practice. No use, distribution or reproduction is permitted which does not comply with these terms.
*Correspondence: Amr S. Zaky, YW1yc2FpZDg2QHNjaWVuY2UubWVub2ZpYS5lZHUuZWc=; Luigi Jovane, am92YW5lQHVzcC5icg==